Back to Journals » Cancer Management and Research » Volume 14
Prognostic Value of Macrophage-Associated Long Non-Coding RNA Expression for Hepatocellular Carcinoma
Received 24 September 2021
Accepted for publication 26 November 2021
Published 14 January 2022 Volume 2022:14 Pages 215—224
DOI https://doi.org/10.2147/CMAR.S340574
Checked for plagiarism Yes
Review by Single anonymous peer review
Peer reviewer comments 4
Editor who approved publication: Dr Sanjeev K. Srivastava
Guan-Yu Chen,1 Duo Wang2
1Departments of Anesthesiology, Zigong Fourth People’s Hospital, Zigong, Sichuan, People’s Republic of China; 2Department of Ultrasound, Affiliated Tumor Hospital of Guangxi Medical University, Nanning, People’s Republic of China
Correspondence: Guan-Yu Chen Email [email protected]
Background: There is ample evidence that macrophages play a crucial role in the biological processes of hepatocellular carcinoma (HCC). This study was designed to establish a novel macrophage-associated prognostic model for HCC.
Methods: Long non-coding RNA (lncRNA) microarrays and clinical data in The Cancer Genome Atlas (TCGA) database were analysed using a univariate Cox proportional regression model to select macrophage-associated prognostic lncRNAs. Multivariate Cox proportional regression models and survival analysis were used to establish a prognosis index (PI) model. Furthermore, to better understand the biological functions of differentially expressed macrophage-associated lncRNAs (MALs) in HCC, enrichment analysis was performed. Finally, the correlation between MALs and clinical features was further analysed in HCC.
Results: We identified eight MALs with significant prognostic values for HCC. Next, a PI model for HCC was developed, and patients were classified into the high-risk or low-risk group based on risk scores. The overall survival (OS) of high-risk patients was significantly shorter than that of low-risk patients (P < 0.001). Univariate and multivariate factors indicate that risk scores can be used as independent prognostic factors for patients with HCC. Multiple receiver operating characteristic (ROC) plots show that the area under the ROC curve (AUC) of the risk score is higher than that of other clinical features. The C-index of our nomogram was 0.768.
Conclusion: The PI model has a prognostic efficacy superior to that of other clinical features.
Keywords: macrophage-associated lncRNAs, The Cancer Genome Atlas, prognosis index model, liver hepatocellular carcinoma
Introduction
Hepatocellular carcinoma (HCC) is one of the most common cancers and the third leading cause of cancer-related deaths.1 Although progress has been made in early diagnosis and treatment, the prognosis of HCC remains poor, with a median survival of 6–20 months.2 Therefore, new prognostic models providing more powerful prognostic biomarkers for patients with liver cancer are urgently needed.
Tumours are composed of not only cancer cells but also a series of stromal cells, such as tumour-associated macrophages (TAMs), which may regulate tumour growth and development, angiogenesis and adaptive immunity.3 Macrophages are immune cells derived from embryonic precursors and circulating CD14 + monocytes derived from bone marrow. So far, two main functional types of macrophages have been identified. Macrophages that promote Th1-type inflammatory response and have microbicidal and tumour-killing activities are called M1 macrophages (also known as classically activated macrophages). M2 macrophages (also known as activated macrophages) are immunomodulators with almost no microbicidal activity can reside and proliferate in tissues and support Th2-mediated diseases, homeostasis and heat generation.4–6 Although both M1 and M2 macrophages have been observed in tumours, evidence suggests that M2 macrophages are the main subtype found in tumours and tend to promote tumour progression.7,8 Moreover, studies have shown that the number of TAMs (mainly M2 macrophages) in tumour tissue is related to the poor prognosis of patients and tumour development.9,10
There is evidence that long non-coding RNA (lncRNA) regulates many cell and developmental processes, including cell proliferation, apoptosis and differentiation.11–13 Abnormal expression of lncRNA is related to pathophysiological conditions, including diabetes, cancer, tissue fibrosis and cardiovascular diseases.14–16 Although efforts have been made to understand the mechanism of lncRNA in regulating gene expression, little progress has been made in studying the function of lncRNA in macrophages.17,18 Considering the important role of macrophages and lncRNA in tumours, we measured the expression of lncRNA in macrophages during the polarisation process from the M2 phenotype to the M1 phenotype.
In this study, microarrays were used to detect the differential expression of lncRNA in M1 and M2 macrophages. Subsequently, we screened eight lncRNAs from differentially expressed lncRNAs based on the previous study of our research group. Subsequently, we verified the expression of the eight lncRNAs in 251 pairs of matched HCC tissues and adjacent normal tissues using quantitative reverse transcription polymerase chain reaction (RT-qPCR) and further analysed their correlation with clinicopathological parameters and overall survival (OS) of 251 patients with HCC. Finally, we developed a new model based on the eight lncRNAs, which can provide more powerful prognostic biomarkers for patients with liver cancer.
Methods
Cell Culture and M1/M2 Phenotype Identification
This is the same as the cell culture and M1/M2 phenotype identification, lncRNA microarray (Supplement File 4) and data analysis methods used in our previous study.19 U937 cell line was purchased from Shanghai Cell Bank (Chinese Academy of Science, Shanghai, China). U937 cells were seeded in 12-well plates and perfused with fresh media supplemented with different stimuli. First, phorbol 12-myristate 13-acetate (PMA) was added to U937 cells and incubated for 24 h, and then, interleukin (IL)-4 and IL-13 were added. After 12 h of incubation, PMA-induced U937 cells were stimulated to differentiate into the M2 phenotype. Lipopolysaccharide (LPS) and interferon-gamma (IFN-γ) were used to stimulate cell differentiation from the M2 phenotype to the M1 phenotype. The M1 and M2 phenotypes were identified using qPCR analysis of transforming growth factor-beta, IL-10, IL-12 and inducible nitric oxide synthase. Duplicate samples of polarised M1 and M2 cells were collected for subsequent microarray analysis.
Patient and Tissue Source
Liver cancer tissues and corresponding adjacent healthy liver tissues were collected from 251 patients with liver cancer who underwent hepatectomy from January 2014 to December 2016 at the Department of Hepatobiliary Surgery, Affiliated Tumor Hospital of Guangxi Medical University. The research protocol was approved by the Ethics Committee of the same hospital (institutional approval number: LW2019008). All patients signed the relevant informed consent form. The corresponding adjacent healthy liver tissues were collected from the area 2 cm above the tumour boundary, and its normality was confirmed by pathological examination. The tissue was stored at −80°C.
In the short term (within 1 year), the patients are followed up every 3 months, mainly through outpatient follow-up visits, whereas in the long term, the patients were followed up through telephone interviews. The deadline for follow-up was May 2018. The median follow-up time was 32 months (range, 17–52 months). The primary endpoint was OS, which starts from the date of pathological diagnosis/recruitment to death or the end of available follow-up data. The recorded clinical features included the following: age, gender, TNM stage, Barcelona Clinic Liver Cancer (BCLC) staging, cirrhosis, tumour size, number of tumours and lymph node metastasis, among others. The clinicopathological features of the 251 patients with HCC are presented in Supplement Table 1.
RNA Extraction, Reverse Transcription and Quantitative Real-Time PCR (qRT-PCR)
We extracted total RNA from the 251 pairs of HCC tissues using TRIzol reagent (Invitrogen, Carlsbad, California, USA). The concentration of RNA was then measured using a NanoDrop 8000 spectrophotometer (Thermo-Fisher Scientific, Waltham, MA, USA). Reverse transcription of RNA into cDNA was performed using M-MLV Reverse Transcriptase Kit (Takara Biotechnology, Dalian, China). Applied Biosystems 7900HT Fast Real-Time PCR was used to detect the expression of the eight lncRNAs. The expression levels of the eight lncRNAs were normalised to the expression of β-actin using the 2–ΔΔCT method. The primer sequences are listed in Supplement Table 2.
Construction of a PI Model
A univariate Cox proportional regression model was used to select macrophage-associated prognostic lncRNAs. When the p-value was less than 0.05, the prognostic value of the lncRNA was considered statistically significant. Finally, a PI model was constructed using eligible MALs based on a formula in which gene expression is multiplied by a regression coefficient. The patients were classified into the high-risk and low-risk groups according to their risk scores with the median score used as the cut-off point. The Kaplan–Meier (KM) method was used to describe differences in survival between the high-risk and low-risk groups and was assessed using log-rank analysis. We used a multivariate Cox proportional hazard regression model to determine independent prognostic factors for establishing the PI model. A PI model was constructed using eligible IRLs based on the following formula: (k score = ∑i = 1N(Expi*Coei), where N, Expi and Coei represented the number of signature lncRNAs, lncRNA expression level and coefficient value, respectively).
Bioinformatics Analysis
We used the edgeR software package to filter and normalise the expression profiles found in The Cancer Genome Atlas (TCGA) database to analyse differentially expressed MALs. LogFC values of more than 1 and P-values of less than 0.05 were considered significant. We examined the expression correlation between prognostic lncRNAs and mRNAs by calculating the Pearson correlation coefficient through paired lncRNA and mRNA expression profiles in 374 HCC tissues. The visualisation of the correlation between the expression level of the eight lncRNAs and each protein-coding gene (PCG) was performed using Cytoscape.20 Furthermore, enrichment analysis was performed to better understand the biological functions of the differentially expressed MALs in HCC, including the analysis of the gene ontology (GO) and Kyoto Encyclopaedia of Genes and Genomes (KEGG) pathways. The R clusterProfiler package was used to perform enrichment analysis,21 and the GOplot package was used to display the results.22 A nomogram and calibration chart were created using the rms software package of R. The survival and survminer package were used to perform survival analysis. The survival ROC package was used to establish time-dependent receiver operating characteristic (ROC) curves.
Statistical Analysis
Univariate Cox proportional hazards regression analysis was performed to evaluate the association between OS time and the expression of the eight lncRNAs. When the p-value is less than 0.05, the prognostic value of the gene is considered statistically significant. Next, multivariate Cox proportional hazard regression analysis was performed using the candidate prognostic gene bank. The Akaike Information Criteria were used to select the most suitable model. By weighing the estimated Cox regression coefficients, a prognostic model based on the eight lncRNAs was constructed. The patients were divided into the high-risk and low-risk groups according to their condition, and the median was used as the cut-off point. The KM method and Log rank test were used to estimate the OS of the patients. The multivariate Cox proportional hazard regression model was used to determine the independent prognostic factors, and the Cox regression model was used to calculate the hazard ratio (HR). The predictive accuracy of the risk model was determined using ROC curves. Based on the Cox proportional hazards regression model, a prognostic nomogram was created for OS. The consistency index (C index) was calculated to determine the performance of the nomogram. The nomogram and calibration chart were created using the rms software package of R. R (version 3.6.1) was used for bioinformatics analysis. All tests were two-tailed tests, and p-values of less than 0.05 were used to denote statistical significance. All data were analysed using Prism 7 (GraphPad Software Inc., La Jolla, California, USA). The difference in clinicopathological parameters between the high-risk and low-risk groups was tested using Student’s t-test or the chi-square test. The t-test was used if the Kolmogorov–Smirnov test has been used on data to ensure normal distribution.
Results
Flowchart
The flowchart of this study is shown in Figure 1.
 |
Figure 1 Flow chart of this research. |
LncRNA Microarray Analysis
The U937 cells were stimulated to become M2 and M1 macrophages. Three duplicate samples of M1 and M2 cells were used to extract the total RNA. The Arraystar Human LncRNA Microarray V3.0, which is designed for the global profiling of human lncRNAs and protein-coding transcripts, was used to analyse the expression of lncRNAs. Then, 26,200 lncRNAs were obtained and clustered in the two phenotypes (ie, M1 and M2) of U937 cells. U937 cell line was purchased from Shanghai Cell Bank (Chinese Academy of Science, Shanghai, China). Further analysis showed that there were 3703 differentially expressed lncRNAs, of which 1777 were upregulated and 1926 were downregulated (LogFC > 1 and p < 0.05) (Figure 2A). The volcano map and heatmap of the differential lncRNAs are shown in Figure 2B and C.
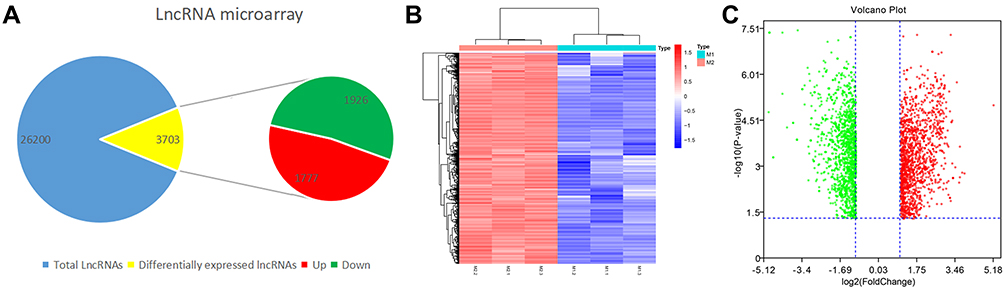 |
Figure 2 Acquisition of LncRNAs from M1 and M2 macrophages. (A) Amount of differentially expressed LncRNAs and total LncRNAs. (B) Heatmap of differentially expressed LncRNAs (LogFC >1 q-value < 0.05). Red color represents upregulation and blue represents downregulation. (C) Volcan plot of differentially expressed LncRNAs (LogFC >1 q-value < 0.05). Volcano plot showing the differentially expressed genes. Red color represents upregulation and blue represents downregulation. |
qRT-PCR
We verified the expression of the eight lncRNAs in the 251 pairs of matched HCC tissues and adjacent healthy tissues, of which one was upregulated (ie, FOXP4-AS1) and seven were downregulated (ie, LINC01160, NRSN2-AS1, GMDS-DT, LAMTOR5-AS1, SEMA6A-AS1, ADPGK-AS1 and ZBED5-AS1) (Figure 3).
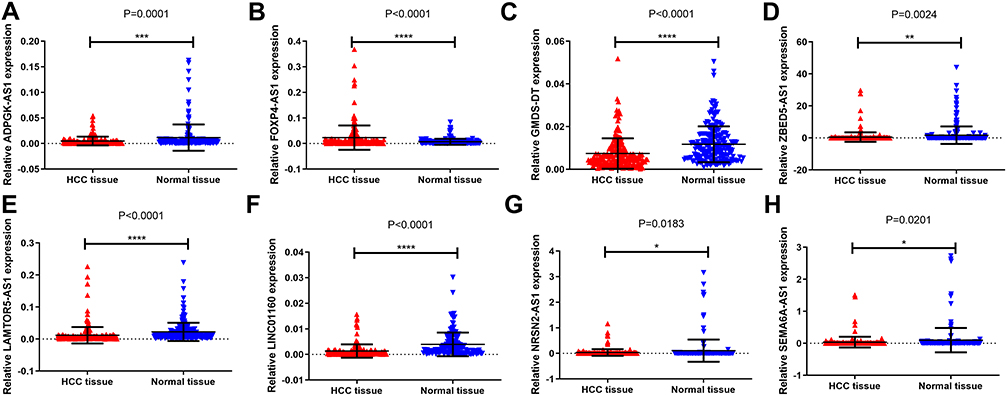 |
Figure 3 Expression of 8 lncRNAs in 251 pairs of matched HCC tissues and adjacent normal tissues. *p < 0.05, **p < 0.01, ***p < 0.001, ****p < 0.0001. (A) ADPGK-AS1, (B) FOXP4-AS1, (C) GMDS-DT, (D) ZBED5-AS1 (E) LAMTOR5-AS1, (F) LINC01160, (G) NRSN2-AS1, (H) SEMA6A-AS1. |
KM Curve and Construction of the PI Model
The KM method was used to describe differences in survival between the high-risk and low-risk groups and was assessed using log-rank analysis (Figure 4). Eight MALs were associated with the prognosis of patients with HCC, of which one (ie, LAMTOR5−AS1) was identified as a protective MAL (HR < 1), whereas the remaining seven MALs were identified as risk MALs (HR > 1) (Figure 5). Subsequently, a PI model was constructed using eight MALs based on a formula in which the expression of MALs is multiplied by a regression coefficient. Risk score = LINC01160 expression * (0.137311193) + LAMTOR5 - AS1 * −0.185061679 + NRSN2-AS1 expression * (0.351122187) + GMDS-DT expression * 0.235411984 + ADPGK-AS1 expression * 0.600764478 + SEMA6A-AS1 expression * (0.062876234) + ZBED5-AS1 expression * 0.058795151 + FOXP4-AS1expression * (0.338427062). The patients were classified into the high-risk and low-risk groups according to their risk scores, with the median score used as the cut-off point. The KM curve showed that high-risk patients had a worse prognosis than low-risk patients (P < 0.001)(Supplement Figure 1A and B). As the risk score increased, the patient’s survival time tended to decline (Supplement Figure 1C and D).
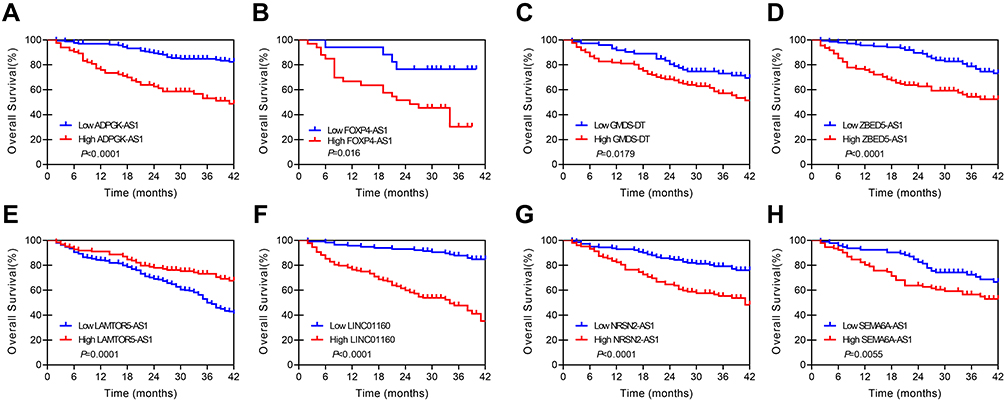 |
Figure 4 KM curve of 8 lncRNAs in 251 pairs of matched HCC tissues and adjacent normal tissues. (A) ADPGK-AS1, (B) FOXP4-AS1, (C) GMDS-DT, (D) ZBED5-AS1. (E) LAMTOR5-AS1, (F) LINC01160, (G) NRSN2-AS1, (H) SEMA6A-AS1. |
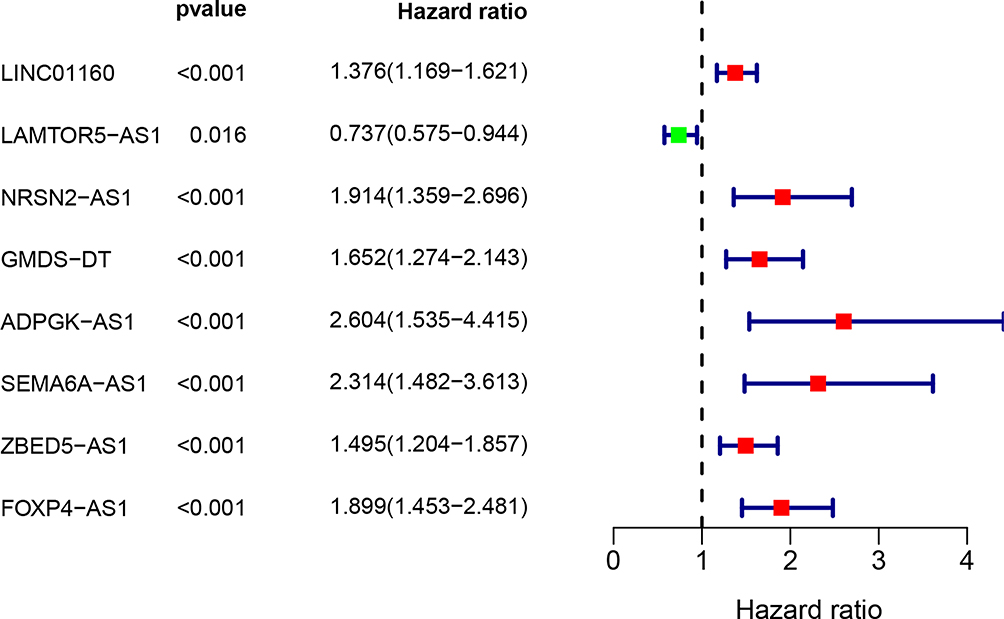 |
Figure 5 A univariate Cox analysis of 8 differentially MAls based on clinical dataset. P value less than 0.05 was considered significant. |
Risk Score is an Independent Prognostic Factor for Patients with HCC
We performed univariate and multivariate Cox regression analyses to investigate whether the risk score was an independent prognostic factor for OS. In the univariate Cox regression analysis, risk scores, BCLC stage, cirrhosis and TNM stage were associated with OS in patients with HCC (All P-value < 0.05) (Supplement Figure 2A). However, multivariate Cox regression analysis showed that only the risk scores were associated with OS in patients with HCC (P-value < 0.001) (Supplement Figure 2B). Therefore, our results indicate that after adjusting for these factors, the risk score is an independent prognostic factor for OS.
ROC Curve
The ROC curve showed the predictive performance of the eight MALs on the prognosis of patients with HCC. The AUC of risk score was 0.849, which was significantly higher than that of gender (AUC = 0.589), TMN stage (AUC = 0.671), BCLC stage (AUC = 0.694), cirrhosis (AUC = 0.660) and grade (AUC = 0.412) (Supplement Figure 3). These results indicate that the use of the eight MALs as a risk model improves the ability to predict survival in patients with HCC compared with the use of clinical factors.
Nomogram Development for Predicting the Prognostic Risk
To provide clinicians with a quantitative approach for predicting cancer survival, we assembled a nomogram that integrated both the risk signature and various clinicopathological risk factors. The nomogram was constructed to estimate 1-, 2-, 3- and 5-year survival probabilities and showed that the signature risk score was the most essential factor among the different variables analysed (Supplement Figure 4). The C-index was calculated to estimate the performance of this nomogram. The C-index of our nomogram was 0.768. The results of this calibration curve showed that the accuracy of this PI model is excellent (Supplement Figure 5).
Differentially Expressed MALs in HCC Based on TCGA Dataset
We downloaded 374 HCC samples with eight MAL expression profiles from TCGA database. We examined the expression correlation between prognostic lncRNAs and mRNAs by calculating the Pearson correlation coefficient through paired lncRNA and mRNA expression profiles in 374 HCC. One hundred and forty-nine PCGs were highly correlated with at least one lncRNA contained in the eight-lncRNA signature (Pearson correlation coefficient > 0.4 and p < 0.01). The visualisation of the correlation between the expression level of the eight lncRNAs and each PCG was performed using Cytoscape (Supplement Figure 6).
GO and KEGG Pathway Enrichment Analysis of the Differentially Expressed MALs Based on TCGA Database
The top 10 enriched GO items are listed in Supplement Figure 7 and Supplement File 2. GO Biological Process (BP) analysis revealed that differentially expressed MALs were significantly enriched in mRNA processes, including microtubule cytoskeleton organisation and RNA splicing. For Cellular Component (CC) analysis, these genes were significantly enriched in centrosome, chromatin and nuclear chromosome part, among others. The Molecular Function (MF) analysis for these genes included chromatin binding, transcription coregulator activity and transcription coactivator activity, among others (Supplement Figure 7A and B). Moreover, KEGG pathway enrichment analysis of these genes was performed (Supplement File 3). These genes were significantly enriched in Herpes simplex virus 1 infection, coronavirus disease 2019, Salmonella infection and endocytosis, among others (Supplement Figure 7C and D).
Validation of Macrophage-Associated Prognostic lncRNAs Based on TCGA Database
The PI model was validated using eight MALs based on the following formula: risk score = LINC01160 expression * (0.137311193) + LAMTOR5-AS1 * −0.185061679 + NRSN2-AS1 expression * (0.351122187) + GMDS – DT expression * 0.235411984 + ADPGK-AS1 expression * 0.600764478 + SEMA6A-AS1 expression * (0.062876234) + ZBED5-AS1 expression * 0.058795151 + FOXP4-AS1 expression * (0.338427062). The patients were classified into the high-risk and low-risk groups according to their risk scores, with the median score used as the cut-off point. The, we performed survival analysis based on the risk scores. The KM curve showed that high-risk patients had a worse prognosis than low-risk patients (P < 0.001) (Supplement Figure 8A). As the risk scores increased, the patient’s survival time tended to decline (Supplement Figure 8B and C).
Risk Score is an Independent Prognostic Factor for Patients with HCC
We performed univariate and multivariate Cox regression analyses to investigate whether the risk score was an independent prognostic factor for OS. Univariate Cox analysis showed that risk scores, BCLC stage, cirrhosis and TNM stage were associated with OS in patients with HCC (All P-values < 0.05) (Supplement Figure 9A). Multivariate Cox analysis showed that only risk scores were associated with OS in patients with HCC (Supplement Figure 9B). Therefore, our results indicate that after adjusting for these factors, the risk score is an independent prognostic factor for OS.
ROC Curve Based on TCGA Database
The ROC curve showed the predictive performance of the eight MALs on the prognosis of patients with HCC (Supplement Figure 10). The AUC of risk score was 0.773, which was significantly higher than that of age (AUC = 0.454), gender (AUC = 0.506), stage (AUC = 0.743), T stage (AUC = 0.752), M stage (AUC = 0.508), N stage (AUC = 0.508), BCLC stage (AUC = 0.759), cirrhosis (AUC = 0.740) and grade (AUC = 0.475). These results indicate that the use of a risk model of the eight MALs improves the ability to predict survival in patients with HCC compared with the use of clinical factors.
Association Between the Eight MALs and Risk Scores and Major Clinical Parameters
We further explored the association between the eight MALs and risk scores and major clinical parameters (ie, age, gender, stage, grade, BCLC, cirrhosis and TNM stage). The result is shown in the Supplement Tables 2 and 3. These eight MALs were closely connected with most parameters, particularly those linked with tumour progression. Based on clinical data and TCGA dataset, of the eight MALs, three were differentially expressed in the T stage and tumor stage (ie, risk, riskscore and NRSN2-AS1), three (ie, NRSN2-AS1, GMDS-DT and riskscore) in tumor grade, four (ie, FOXP4-AS1, LINC01160, SEMA6A-AS1, ZBED5-AS1) in gender, 3 (ie, ADPGK-AS1, LAMTOR5-AS1, SEMA6A-AS1) in the M stage, one (ie, risk) in the M stage, three (ie, FOXP4-AS1, riskscore and risk) in the BCLC, and two (ie, FOXP4-AS1 and riskscore) in the cirrhosis.
Discussion
With the establishment of next-generation sequencing technologies and the opening of the era of precision medicine, various treatment methods for liver cancer have also been developed. However, due to the small number of useful biomarkers, we usually cannot predict the effects of treatment. The malignant behaviour of HCC is a complex and precise process that requires the abnormal expression of specific genes to provide cancer cells the corresponding ability.23–25 Therefore, changes affecting the prognosis of patients with HCC may occur long before the detectable clinical pathological abnormalities, highlighting the important role of prognostic biomarkers in treating patients with HCC.
This is the first study that has established a macrophage-associated prognostic model for HCC. In this study, we used microarrays to detect the differential expression of lncRNAs in M1 and M2 macrophages. Subsequently, we screened eight lncRNAs from differentially expressed lncRNAs and constructed a PI model. The previous study of our group has shown that some lncRNAs are related to the prognosis of HCC.26–28 Furthermore, some lncRNAs were involved in the occurrence of various cancers, such as colorectal cancer and nasopharyngeal carcinoma.29,30 Bioinformatics analyses were performed to elucidate the possible mechanisms of the eight MALs in HCC. KEGG pathway enrichment analysis of these genes was further performed. These genes were significantly enriched in spliceosomes, ubiquitin-mediated proteolysis, cell cycle and endocytosis, among others. These pathways have been reported to be related to HCC.31,32
Clinical staging is essential as it helps in making decisions regarding available treatment options. Although there are some new HCC staging systems have been developed in different parts of the world, such as the Cancer of the Liver Italian Programme (CLIP) score, Model to Estimate Survival in Ambulatory HCC patients (MESIAH) score and BCLC staging.33 However, there is no globally accepted staging system because all systems are developed based on different populations and only perform well in similar populations. The BCLC staging system is considered the most comprehensive, considering all basic clinical parameters, and provides prognostic guidance for available treatment options. However, it represents only a treatment decision algorithm but not a prognostic evaluation.34 The later-developed classification systems have their inherent limitations and need further external validation in different population cohorts.35,36 In this study, we compared the ability of the PI model with clinical staging systems, such as BCLC and TMN, and other clinical features to assess the prognosis of liver cancer. The results indicate that the use of the risk model of the eight MALs improves the ability to predict survival in patients with HCC compared with the use of clinical factors.
The most significant advantage of this study is the universal applicability of the eight MALs in prognostic prediction because the robustness of our model has been verified in an independent dataset. The use of paired and unpaired HCC samples from TCGA database strictly guarantees the specificity and representativeness of MALs. More importantly, the MALs used for prognostic evaluation are also key lncRNAs for predicting the occurrence and development of HCC.
This study has some limitations. First, this was a retrospective study, so the findings in this study should be tested prospectively. Second, although we performed enrichment analysis to identify potential pathways, we did not validate these pathways. Despite these limitations, our results showed that the moderate prognostic efficacy of the PI model is better than that of other clinical features.
Data Sharing Statement
The datasets supporting the conclusions of this article are included within the article and its additional files.
Ethics Approval and Consent to Participate
The study methodologies conformed to the standards set by the Declaration of Helsinki, and the study was approved by the Ethics Committee of the Affifiliated Tumor Hospital of Guangxi Medical University. Written informed consent was obtained from the patients to utilize their tissue samples.
Acknowledgments
We thank Guangxi Medical University for providing liver cancer tissue samples. We thank enago for its linguistic assistance during the preparation of this manuscript.
Author Contributions
All authors made a significant contribution to the work reported, whether that is in the conception, study design, execution, acquisition of data, analysis and interpretation, or in all these areas; took part in drafting, revising or critically reviewing the article; gave final approval of the version to be published; have agreed on the journal to which the article has been submitted; and agree to be accountable for all aspects of the work.
Funding
This research received no specific grant from any funding agency.
Disclosure
The authors declare that they have no conflicts of interest.
References
1. Siegel RL, Miller KD, Jemal A. Cancer statistics, 2020. CA Cancer J Clin. 2020;70(1):7–30. doi:10.3322/caac.21590
2. Wu J, Yang S, Xu K, et al. Patterns and trends of liver cancer incidence rates in Eastern and Southeastern Asian Countries (1983–2007) and predictions to 2030. Gastroenterology. 2018;154(6):1719–1728e5. doi:10.1053/j.gastro.2018.01.033
3. Yang L, Zhang Y. Tumor-associated macrophages, potential targets for cancer treatment. Biomark Res. 2017;5:25. doi:10.1186/s40364-017-0106-7
4. Allavena P, Sica A, Garlanda C, Mantovani A. The Yin-Yang of tumor-associated macrophages in neoplastic progression and immune surveillance. Immunol Rev. 2008;222:155–161. doi:10.1111/j.1600-065X.2008.00607.x
5. Mantovani A, Locati M. Macrophage metabolism shapes angiogenesis in tumors. Cell Metab. 2016;24(5):653–654. doi:10.1016/j.cmet.2016.10.016
6. Daley D, Mani VR, Mohan N, et al. Dectin 1 activation on macrophages by galectin 9 promotes pancreatic carcinoma and peritumoral immune tolerance. Nat Med. 2017;23(5):556–567. doi:10.1038/nm.4314
7. Guo X, Zhao Y, Yan H, et al. Single tumor-initiating cells evade immune clearance by recruiting type II macrophages. Genes Dev. 2017;31(3):247–259. doi:10.1101/gad.294348.116
8. Mantovani A, Marchesi F, Malesci A, Laghi L, Allavena P. Tumour-associated macrophages as treatment targets in oncology. Nat Rev Clin Oncol. 2017;14(7):399–416. doi:10.1038/nrclinonc.2016.217
9. Mahmoud SM, Lee AH, Paish EC, Macmillan RD, Ellis IO, Green AR. Tumour-infiltrating macrophages and clinical outcome in breast cancer. J Clin Pathol. 2012;65(2):159–163. doi:10.1136/jclinpath-2011-200355
10. Hu Y, He MY, Zhu LF, et al. Tumor-associated macrophages correlate with the clinicopathological features and poor outcomes via inducing epithelial to mesenchymal transition in oral squamous cell carcinoma. J Exp Clin Cancer Res. 2016;35:12. doi:10.1186/s13046-015-0281-z
11. Mello SS, Sinow C, Raj N, et al. Neat1 is a p53-inducible lincRNA essential for transformation suppression. Genes Dev. 2017;31(11):1095–1108. doi:10.1101/gad.284661.116
12. Durruthy-Durruthy J, Sebastiano V, Wossidlo M, et al. The primate-specific noncoding RNA HPAT5 regulates pluripotency during human preimplantation development and nuclear reprogramming. Nat Genet. 2016;48(1):44–52. doi:10.1038/ng.3449
13. Huarte M. The emerging role of lncRNAs in cancer. Nat Med. 2015;21(11):1253–1261. doi:10.1038/nm.3981
14. Leung A, Natarajan R. Long noncoding RNAs in diabetes and diabetic complications. Antioxid Redox Signal. 2018;29(11):1064–1073. doi:10.1089/ars.2017.7315
15. Schonrock N, Harvey RP, Mattick JS. Long noncoding RNAs in cardiac development and pathophysiology. Circ Res. 2012;111(10):1349–1362. doi:10.1161/circresaha.112.268953
16. Thum T. Noncoding RNAs and myocardial fibrosis. Nat Rev Cardiol. 2014;11(11):655–663. doi:10.1038/nrcardio.2014.125
17. Prensner JR, Chinnaiyan AM. The emergence of lncRNAs in cancer biology. Cancer Discov. 2011;1(5):391–407. doi:10.1158/2159-8290.CD-11-0209
18. Sun W, Yang Y, Xu C, Guo J. Regulatory mechanisms of long noncoding RNAs on gene expression in cancers. Cancer Genet. 2017;216–217:105–110. doi:10.1016/j.cancergen.2017.06.003
19. Luo HL, Chen J, Luo T, et al. Downregulation of macrophage-derived T-UCR uc.306 associates with poor prognosis in Hepatocellular carcinoma. Cell Physiol Biochem. 2017;42(4):1526–1539. doi:10.1159/000479269
20. Shannon P, Markiel A, Ozier O, et al. Cytoscape: a software environment for integrated models of biomolecular interaction networks. Genome Res. 2003;13(11):2498–2504. doi:10.1101/gr.1239303
21. Yu G, Wang LG, Han Y, He QY. ClusterProfiler: an R package for comparing biological themes among gene clusters. OMICS. 2012;16(5):284–287. doi:10.1089/omi.2011.0118
22. Walter W, Sánchez-Cabo F, Ricote M. GOplot: an R package for visually combining expression data with functional analysis. Bioinformatics. 2015;31(17):2912–2914. doi:10.1093/bioinformatics/btv300
23. Lee M, Ko H, Yun M. Cancer metabolism as a mechanism of treatment resistance and potential therapeutic target in Hepatocellular carcinsoma. Yonsei Med J. 2018;59(10):1143–1149. doi:10.3349/ymj.2018.59.10.1143
24. Sukowati CH, Rosso N, Crocè LS, Tiribelli C. Hepatic cancer stem cells and drug resistance: relevance in targeted therapies for hepatocellular carcinoma. World J Hepatol. 2010;2(3):114–126. doi:10.4254/wjh.v2.i3.114
25. Wang N, Wang S, Li MY, et al. Cancer stem cells in hepatocellular carcinoma: an overview and promising therapeutic strategies. Ther Adv Med Oncol. 2018;10:1758835918816287. doi:10.1177/1758835918816287
26. Wang D, Bai T, Chen G, et al. Upregulation of long non-coding RNA FOXP4-AS1 and its regulatory network in hepatocellular carcinoma. Onco Targets Ther. 2019;12:7025–7038. doi:10.2147/OTT.S220923
27. Wang D, Du X, Bai T, et al. Decreased expression of long non-coding RNA GMDS Divergent Transcript (GMDS-DT) is a potential biomarker for poor prognosis of Hepatocellular carcinoma. Med Sci Monit. 2019;25:6221–6229. doi:10.12659/MSM.917663
28. Yu S, Li N, Wang J, et al. Correlation of long noncoding RNA SEMA6A-AS1 expression with clinical outcome in HBV-related Hepatocellular carcinoma. Clin Ther. 2020;42(3):439–447. doi:10.1016/j.clinthera.2020.01.012
29. Zaniani NR, Oroujalian A, Valipour A, Peymani M. LAMTOR5 expression level is a biomarker for colorectal cancer and lncRNA LAMTOR5-AS1 predicting miRNA sponging effect. Mol Biol Rep. 2021;48(8):6093–6101. doi:10.1007/s11033-021-06623-3
30. Jiang HY, Wang ZJ. ADPGK-AS1 promotes the progression of colorectal cancer via sponging miR-525 to upregulate FUT1. Eur Rev Med Pharmacol Sci. 2020;24(5):2380–2386. doi:10.26355/eurrev_202003_20505
31. Shuai S, Suzuki H, Diaz-Navarro A, et al. The U1 spliceosomal RNA is recurrently mutated in multiple cancers. Nature. 2019;574(7780):712–716. doi:10.1038/s41586-019-1651-z
32. Shi M, Dai WQ, Jia RR, et al. APC(CDC20)-mediated degradation of PHD3 stabilizes HIF-1a and promotes tumorigenesis in hepatocellular carcinoma. Cancer Lett. 2021;496:144–155. doi:10.1016/j.canlet.2020.10.011
33. Tellapuri S, Sutphin PD, Beg MS, Singal AG, Kalva SP. Staging systems of hepatocellular carcinoma: a review. Indian J Gastroenterol. 2018;37(6):481–491. doi:10.1007/s12664-018-0915-0
34. Chen ZH, Hong YF, Lin J, et al. Validation and ranking of seven staging systems of hepatocellular carcinoma. Oncol Lett. 2017;14(1):705–714. doi:10.3892/ol.2017.6222
35. Parikh ND, Scaglione S, Li Y, et al. A comparison of staging systems for Hepatocellular carcinoma in a multicenter US cohort. Clin Gastroenterol Hepatol. 2018;16(5):781–782. doi:10.1016/j.cgh.2017.10.001
36. Yang JD, Kim WR, Park KW, et al. Model to estimate survival in ambulatory patients with hepatocellular carcinoma. Hepatology. 2012;56(2):614–621. doi:10.1002/hep.25680
 © 2022 The Author(s). This work is published and licensed by Dove Medical Press Limited. The
full terms of this license are available at https://www.dovepress.com/terms
and incorporate the Creative Commons Attribution
- Non Commercial (unported, 3.0) License.
By accessing the work you hereby accept the Terms. Non-commercial uses of the work are permitted
without any further permission from Dove Medical Press Limited, provided the work is properly
attributed. For permission for commercial use of this work, please see paragraphs 4.2 and 5 of our Terms.
© 2022 The Author(s). This work is published and licensed by Dove Medical Press Limited. The
full terms of this license are available at https://www.dovepress.com/terms
and incorporate the Creative Commons Attribution
- Non Commercial (unported, 3.0) License.
By accessing the work you hereby accept the Terms. Non-commercial uses of the work are permitted
without any further permission from Dove Medical Press Limited, provided the work is properly
attributed. For permission for commercial use of this work, please see paragraphs 4.2 and 5 of our Terms.