Back to Journals » Pharmacogenomics and Personalized Medicine » Volume 14
Prognostic Value of LHFPL Tetraspan Subfamily Member 6 (LHFPL6) in Gastric Cancer: A Study Based on Bioinformatics Analysis and Experimental Validation
Authors Liu YJ ![]() , Yin SY, Zeng SH, Hu YD, Wang MQ, Huang P, Li JP
, Yin SY, Zeng SH, Hu YD, Wang MQ, Huang P, Li JP ![]()
Received 2 August 2021
Accepted for publication 26 October 2021
Published 20 November 2021 Volume 2021:14 Pages 1483—1504
DOI https://doi.org/10.2147/PGPM.S332345
Checked for plagiarism Yes
Review by Single anonymous peer review
Peer reviewer comments 4
Editor who approved publication: Dr Martin H Bluth
Yuan-Jie Liu,1– 3,* Sheng-Yan Yin,2,3,* Shu-Hong Zeng,2,3 Yi-Dou Hu,1 Meng-Qi Wang,2,3 Pan Huang,1 Jie-Pin Li1– 3
1Department of Oncology, Zhangjiagang TCM Hospital Affiliated to Nanjing University of Chinese Medicine, Zhangjiagang, Jiangsu, 215600, People’s Republic of China; 2Affiliated Hospital of Nanjing University of Chinese Medicine, Jiangsu Province Hospital of Chinese Medicine, Nanjing, Jiangsu, 210029, People’s Republic of China; 3No. 1 Clinical Medical College, Nanjing University of Chinese Medicine, Nanjing, Jiangsu, 210023, People’s Republic of China
*These authors contributed equally to this work
Correspondence: Jie-Pin Li; Pan Huang
Department of Oncology, Zhangjiagang TCM Hospital Affiliated to Nanjing University of Chinese Medicine, Chang ‘an South Road No. 77, Zhangjiagang, Jiangsu, 215600, People’s Republic of China
Tel +8615150224526
; +8613921976647
Email [email protected]; [email protected]
Purpose: The identification of biomarkers and effective therapeutic targets for gastric cancer (GC), the most common cause of cancer-related deaths around the world, is currently a major focus in research. Here, we examined the utility of LHFPL6 as a prognostic biomarker and therapeutic target for GC.
Methods: We explored the clinical relevance, function, and molecular role of LHFPL6 in GC using the MethSurv, cBioPortal, TIMER, Gene Expression Profiling Interactive Analysis, ONCOMINE, MEXPRESS, and EWAS Atlas databases. The GSE118919, GSE29272, and GSE13861 datasets were used for differential expression analysis. Using The Cancer Genome Atlas, we developed a Cox regression model and assessed the clinical significance of LHFPLs. In addition, we used the “CIBERSORT” algorithm to make reliable immune infiltration estimations. Western blot and immunohistochemistry were used to examine protein expression. Cell migration and invasion were assessed using transwell experiments. THP-1-derived macrophages and GC cells were co-cultured in order to model tumor–macrophage interactions in vitro. The levels of CD206 and CD163 were measured using immunofluorescence assays. The results were visualized with the “ggplot2” and “circlize” packages.
Results: Our results showed that in GC, LHFPL6 overexpression was significantly associated with a poor prognosis. Our findings also suggested that LHFPL6 may be involved in the activation of the epithelial–mesenchymal transition. Furthermore, LHFPL6 expression showed a positive correlation with the abundance of M2 macrophages, which are potent immunosuppressors.
Conclusion: LHFPL6 could be a prognostic biomarker and therapeutic target for GC.
Keywords: gastric cancer, LHFPL6, biomarker, EMT, M2 macrophages
Graphical Abstract:

Introduction
Gastric cancer (GC), one of the most common malignant tumors in the world, was the fourth-largest contributor to cancer-related deaths worldwide in 2021.1 Etiologically, GC is caused by the combined effects of genetic factors that lead to susceptibility and environmental factors such as age, socio-economic status, poor dietary habits, and Helicobacter pylori infection.2 The occurrence of GC is a complex process involving multiple genetic networks. Complex diseases such as GC are often not attributed to mutations or dysfunctions of individual genes, but rather to abnormalities in the functions of related regulatory networks. From a therapeutic perspective, the identification of key nodes in this molecular network is of great importance. With the development of gene chips and high-throughput sequencing technologies, bioinformatics analysis of gene expression profiles has become a popular tool for exploring potential diagnostic markers and therapeutic targets.3 Through repeated mining of tumor-related databases, our group has identified several biomarkers that play an important role in GC,4–6 resulting in significant progress towards understanding the molecular mechanism of GC development and devising therapeutic strategies for improving the prognosis of this disease. Workflow of this study is shown in Figure 1
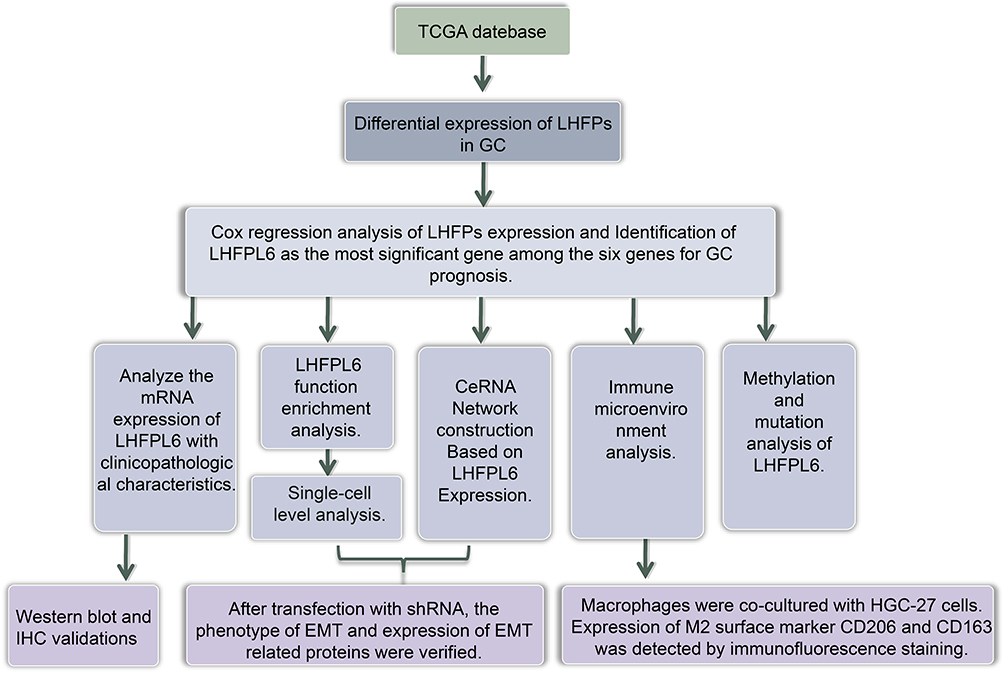 |
Figure 1 Workflow of this study. |
Little is known about the molecular function of the human lipoma high-speed actin fusion chaperone protein (LHFP) subfamily, a member of the LHFP-like family and a subset of the four-transmembrane protein-encoding gene superfamily. LHFPL1, LHFPL2, LHFPL3, LHFPL4, LHFPL5, and LHFPL6 are the six members of the LHFP subfamily.7 LHFPL6 was first identified as a translocation partner of the high mobility group A2 (HMGA2) gene in benign lipomas. HMGA2, a non-histone structural transcription factor, acts as a proto-oncogene and plays an important role in the occurrence and development of many epithelial and mesenchymal tumors.8,9 Numerous studies have shown that HMGA2 is involved in the occurrence and malignant progression of GC.10–12 However, there have been few studies on the role of LHFPLs in GC development and prognosis. Hence, in this study, we analyzed data from public databases using bioinformatics methods to explore the expression and effect of LHFPLs, especially LHFPL6, in GC.
Materials and Methods
Antibodies and Reagents
A complete list of reagents and antibodies, and experimental details are provided in Supplementary Table S1. Concentrations of the antibodies and reagents used have also been provided in Supplementary materials. All concentrations were chosen based on previous studies or manufacturer’s instructions.
Cell Culture
AGS (moderately differentiated GC cells), HGC27 (undifferentiated GC cells), GES-1 (healthy gastric epithelial cells), and THP-1 cells (human monocytic cells) were purchased from the cell bank of the Chinese Academy of Sciences (Shanghai, China). MKN74 and MKN45 cells (well and poorly differentiated GC cells, respectively) were purchased from the Japanese Collection of Research Bioresources Cell Bank. GC and THP-1 cells were cultured in RPMI-1640 medium with 10% fetal bovine serum (FBS), and GES-1 cells were cultured in DMEM with 10% FBS. All cells were incubated at 37°C in 5% CO2.
Ethics Statement and Specimen Collection
The study’s protocol was approved by the ethics committee of the Jiangsu Province Hospital of Chinese Medicine, and informed consent was obtained from clinicians and patients (2019NL-166-02). This study conformed to the principles outlined in the Declaration of Helsinki (World Medical Association Declaration of Helsinki). GC tissues and the surrounding non-tumorous tissues (margin, 5 cm) were collected during surgery from 10 previously treatment-naïve patients with GC at the Jiangsu Provincial Hospital of Traditional Chinese Medicine. Tumors were staged and graded based on the 8th edition of the American Joint Committee on Cancer tumor-node-metastasis (TNM) staging system.13 After extraction, tissue specimens were washed with cold phosphate-buffered saline and immediately placed in liquid nitrogen. They were then transferred and stored at −80°C until further examination using immunohistochemistry (IHC) and Western blot analysis.
Immunohistochemistry
The protocol used for IHC was based on earlier studies.14 Images were obtained using a NIKON Eclipse Ni-E microscope (NIKON, Japan) (original magnification, ×400). The H-SCORE (range 0–300, higher scores indicating stronger positive staining) was calculated as described previously.15
Western Blot Assessment
The protocol for Western blotting was based on previous studies.16 Target/β-actin bands were identified using a gel image processing system (ChemiDoc XRS+). Subsequently, relative protein levels were calculated.
Lentiviral Vector Construction and Transfection
We used lentiviral vectors for overexpressing and knocking down LHFPL6. Viruses were designed, synthesized, and produced by GeneChem Corporation. Transfection was performed according to the supplier’s protocol. The target sequences for the lentivirus are summarized in Supplementary materials. We used this sequence to construct a lentiviral vector expressing LHFPL6 shRNA (named sh-LHFPL6) and employed a non-targeting sequence lentiviral vector as the control (named NC). For overexpression, a lentivirus with the complete LHFPL6 nucleotide sequence was constructed (named oe-LHFPL6). The expression of LHFPL6 was highest in HGC27 cells; therefore, HGC27 cells were selected for subsequent experiments. HGC27 cells were transduced with the recombinant lentivirus using 2 μg/mL polybrene for 24 h. Subsequently, we identified stable transfected GFP-expressing cells using 1.5 μg/mL puromycin. We assessed LHFPL6 overexpression and knockdown as well as transduction efficiency using Western blots.
Enzyme-Linked Immunosorbent Assay (ELISA)
We examined cell supernatants for LHFPL6 expression using the LHFPL6 ELISA Kit based on the given instruction manual. A microplate reader (BioTek Synergy HT) was used to examine optical density at 450 nm.
Colony Formation Assays
We assessed the clonogenic ability of cells using a clone formation assay, as described previously.17 The number of colonies was counted using a compound light microscope (Olympus BX53, Japan).
Transwell Assay
Cell migration and invasion were assessed using a transwell assay based on a previously published protocol.18 The membrane in the chamber was cut and imaged using a light microscope (Olympus BX53, Japan) (×200 magnification), and cell counts were obtained using Image J software.
Establishment of a Co-Culture System
THP-1 monocytes were differentiated into macrophages using phorbol 12-myristate 13-acetate (PMA). THP-1 cells (1 × 10⁵ cells/mL) were treated with PMA (10 ng/mL) for 48 h to allow them to differentiate into M0 macrophages and become attached to the inserts placed in 6-well plates.19 PMA-containing medium was replaced with serum-free medium, and the cells were cultured for 24 hours. To reproduce the tumor–macrophage interaction at in vitro scale, co-culture experiments were performed by seeding GC cells (6 × 10⁵) into the upper chamber and macrophages (M0 macrophages) into the lower chamber of a 6-well transwell apparatus with a 0.4-μm pore size. After an additional 48 h of co-culturing, macrophages were obtained from the lower chamber, and immunofluorescence staining was performed.
Immunofluorescence Staining
The protocol used for immunofluorescence staining was based on earlier studies.20 Immunofluorescence staining was observed using an epi-fluorescence microscope (Olympus, BX60-32FB2-A03) and different filters and imaged using an Olympus, DP50 camera (×400 magnification).
Statistical Analysis
Data were reported as mean ± standard deviation. We used t-tests and one-way ANOVA to perform comparisons between two groups and among multiple groups, respectively. All data were analyzed using SPSS 26.0 (SPSS Inc., USA) and illustrated using GraphPad Prism 8.0 (GraphPad Software, Inc., USA). All experiments were carried out at least thrice. **P < 0.01 and *P < 0.05 were defined as statistically significant.
Expression Analysis
The ONCOMINE (www.oncomine.org)21 and TCGA databases22 (https://portal.gdc.cancer.gov/) were first used to assess the transcriptomic expression of LHFPLs in tumor tissue and normal tissue. For the ONCOMINE analysis, the parameters were set as follows: P-value, 0.05; fold change, 1.5; and gene ranking, all. The GSE118919,23 GSE29272,24 and GSE1386125 datasets from the Gene Expression Omnibus (GEO) database were used to confirm the differential expression of LHFPL6 between tumors and normal tissues. In addition, Gene Expression Profiling Interactive Analysis (GEPIA2)26 was conducted to evaluate the expression of LHFPLs at different pathological stages. Finally, the “pROC” package was used to plot receiver operating characteristic (ROC) curves to determine the diagnostic value of LHFPL6 and LHFPL2 expression in distinguishing between different pathological stages of GC.
Survival Curve Analysis
Based on the LHFPL6 gene expression levels obtained from GEPIA2, we analyzed overall survival (OS) and disease-free survival (DFS) in patients with GC using TCGA-Stomach Adenocarcinoma (STAD) cohort data. Using a group cutoff of “median,” Kaplan–Meier curves were plotted. We also pooled GC cases from the GSE14210, GSE15459, GSE22377, GSE29272, GSE51105, and GSE62254 datasets and analyzed OS and post-progression survival (PPS) using the Kaplan–Meier plotter tool. We used the automatically selected best cutoff. Subsequently, Log rank tests were performed. In addition, survival curves based on TCGA-STAD data were also plotted using the “Survminer” package to assess the effect of LHFPL6 expression on disease-specific survival (DSS), disease-free interval (DFI), and progression-free interval (PFI).
Cox Model and Clinical Value Analysis
Univariate and multivariate Cox regression analyses of TCGA-STAD data were performed to identify which LHFPLs were independent prognostic factors for GC.
Forest plots were constructed, with P-values of < 0.05 indicating significant differences. Hazard ratios (HRs) and 95% confidence intervals (CIs) were calculated for each variable via the “forestplot” R package.
Kaplan–Meier analyses were performed followed by Log rank tests to compare survival differences between LHFPL6 high vs low expression groups. Time-dependent ROC analysis was used to measure the predictive accuracy of LHFPL6 expression levels. Based on Kaplan–Meier curves, P-values and HRs with 95% CIs were obtained using Log rank tests and univariate Cox proportional hazards regression.
LHFPL6 Functional Enrichment Analysis
The GENEMANIA database was used to identify the genes associated with LHFPL6 in order to preliminarily explore its potential function.27 Genes co-expressed with LHFPL6 were obtained using TCGA-STAD data and the criteria |logFC > 3| and p < |0.05|. We then conducted functional enrichment analysis for the LHFPL6 gene and its co-expressors using the Enrichr database.28 An adjusted P-value < 0.05 was considered to be statistically significant. In addition, the GSE134520 dataset was used to further study the potential function of LHFPL6 at the single-cell level.
CeRNA Network Construction Based on LHFPL6 Expression
Using the “DEseq2” package, we identified the differential mRNAs (DEmRNAs), miRNAs (DEmiRNAs), and lncRNAs (DElncRNAs) that showed significantly different expression levels between LHFPL6 high and LHFPL6 low expression groups. These DEmRNAs, DEmiRNAs, and DElncRNAs were identified by setting the inclusion criteria to an absolute fold change (FC) more than 1 and a false discovery rate (FDR) less than 0.05. LncRNA–miRNA interactions were predicted using the starBase database, and miRNA–mRNA interactions were predicted using miRTarBase,29 miRDB,30 and TargetScan.31 In order to improve the reliability of the ceRNA network, only miRNA-targeted mRNAs from these three databases were included along with DEmRNAs. The ceRNA network was visualized with the Cytoscape software.32 The Cytoscape plug-in cytoHubba was used to identify the hub RNAs in the network, and the TAM tool33 was used to identify the potential function of these hub RNAs.
Immune Microenvironment Analysis
CIBERSORT, a high-performance computational method used for quantifying cellular components from bulk tissue gene expression profiles, was utilized to estimate the abundance of immune infiltration.34 All the results obtained using the above analysis methods and the R package were analyzed with the “ggplot2” and “pheatmap” packages. We first divided the GC patients into high- and low-expression groups based on the median LHFPL6 expression level. Subsequently, we performed differential analysis to identify differentially abundant immune cells and differentially expressed immune checkpoints (ICPs) in these patients. The sample Gene Set Enrichment Analysis (ssGSEA) algorithm35 was used to calculate the correlation between LHFPL6 expression and the abundance of immune cell infiltration, whereas the TIMER database36 was used to calculate the correlation between the expression levels of LHFPL6 and those of ICPs. Subsequently, GSE29272 and GSE13861 were used to further assess the relationship between LHFPL6 levels and macrophage polarization based on the CIBERSORT algorithm.
Genetic Mutation and DNA Methylation Analysis
The methylation status of LHFPL6 was analyzed using GC cases from TCGA-STAD cohorts and the MEXPRESS database.37 The cBioPortal database was used to identify the frequency, type, and location of LHFPL6 mutations along with their clinical significance.37,38 Pearson’s tests were conducted to determine the correlation between DNA methylation and LHFPL6 gene expression. Correlation coefficients (R) and Benjamini-Hochberg-adjusted P-values were determined for different methylation probes. The MethSurv tool was used to visualize the methylation of LHFPL6, and Kaplan–Meier plots of the relationship between LHFPL6 hyper/hypomethylation and OS were constructed.39
Finally, we analyzed the relationship between LHFPL6 promoter methylation levels and LHFPL6 expression levels using TCGA-STAD data and plotted survival curves (OS, PFI, and DFI).
Results
Expression Levels of LHFPLs in GC
In order to evaluate the distinct prognostic and prospective therapeutic significance of different LHFP members in GC, the ONCOMINE database was accessed and the mRNA expression of these genes was assessed using the available GC repository. We found that the expression levels of LHFPL2 and LHFPL6 were up-regulated in GC, while those of LHFPL1, LHFPL4, and LHFPL5 were down-regulated (Figure 2A).
 |
Figure 2 Expression of LHFPLs in gastric cancer (GC). (A) Differences in the expression of LHFPLs between different types of human cancers. (B) Correlation analyses among LHFPLs. (C–H) Association between the expression of LHFPLs and the pathological stages of GC, examined using the GEPIA database. (I) Expression of LHFPLs in normal and tumor tissues based on TCGA-STAD data. (J) TCGA-based receiver operating characteristic (ROC) curves demonstrating the value of LHFPL2 and LHFPL6 in distinguishing between different pathological stages of GC. *P < 0.05, **P < 0.01, ***P < 0.001. Abbreviation: NS, no significance. |
Correlation analyses revealed that LHFPL2 and LHFPL6 showed the highest correlation coefficients among all the LHFPLs (Figure 2B). The association between LHFPL expression and tumor stage (GEPIA2 database) is shown in Figure 2C–H. GEPIA2 analysis showed that the expression of LHFPL2 and LHFPL6 was positively correlated with pathological stage (P = 0.0204 and P = 0.00266, respectively). Furthermore, TCGA data showed that LHFPL2, LHFPL3, and LHFPL5 were highly expressed in GC tumor tissues (Figure 2I).
The areas under the ROC curve (AUCs) depicting the accuracy of LHFPL2 and LHFPL6 expression in distinguishing among different pathological stages of GC were 0.506 and 0.513 (stage I vs stage II), 0.607 and 0.681 (stage I vs stage III), 0.487 and 0.570 (stage I vs stage IV), 0.627 and 0.630 (stage II vs stage III), 0.619 and 0.623 (stage II vs stage IV), and 0.525 and 0.553 (stage III vs stage IV), respectively (Figure 2J).
Cox Regression Analysis in GC
The univariate Cox regression analysis showed that OS and PFS were negatively correlated with T, N, and M stages (OS: HR = 1.719, 1.925, and 2.254, respectively; P=0.011, 0.002, and 0.004, respectively; PFS: HR = 1.705, 1.640, and 2.224, respectively; P = 0.018, 0.022, and 0.012, respectively). Further, univariate analysis also revealed that a high expression of LHFPL6 was related with poor OS (HR = 1.522; P = 0.013) (Figure 3A) and a high expression of LHFPL1, LHFPL5, and LHFPL6 was related with poor PFS (HR = 1.508, 1.504, and 1.404, respectively; P = 0.024, 0.025, and 0.049, respectively) (Figure 3C). Multivariate Cox regression analysis showed that PFS was negatively correlated with N and M stages (HR = 1.719 and 2.048, respectively; P = 0.019 and 0.015, respectively) and that a high expression of LHFPL6 was related with poor OS and PFS (HR = 1.496 and 1.458, respectively; P = 0.031 and 0.046, respectively) (Figures 3B and D). Both univariate and multivariate analyses revealed that a high expression of LHFPL6 was associated with poor OS (HR = 1.522 and 1.496, respectively; P = 0.013 and 0.031, respectively) and PFS (HR = 1.404 and 1.458, respectively; P = 0.049 and 0.046, respectively) (Figure 3A–D). Taken together, the data indicated that LHFPL6 expression was closely related to survival among GC patients.
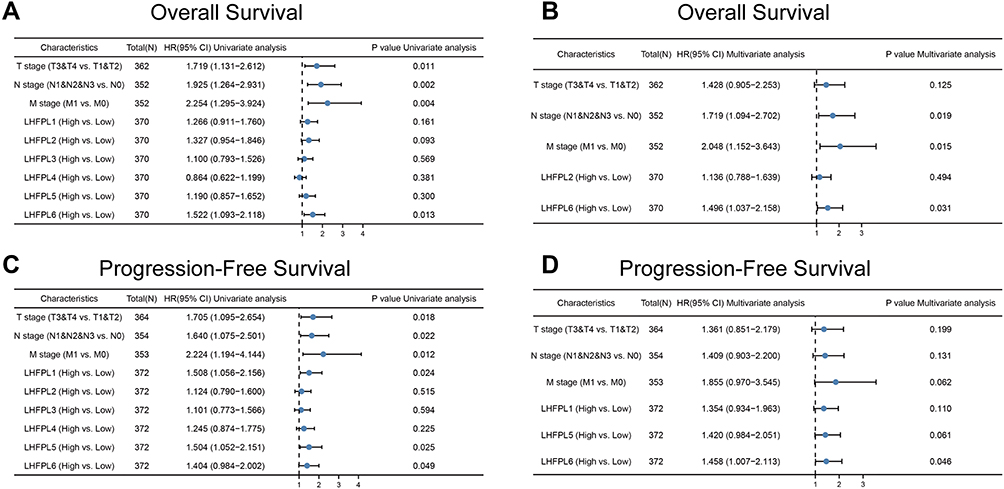 |
Figure 3 Univariate and multivariate Cox regression analysis of LHFPLs expression, and clinicopathological factors related to gastric cancer (GC) prognosis. Hazard ratios and P-values are shown. (A) Univariate forest plot illustrating the expression of LHFPLs and the clinicopathological factors related to Overall Survival (OS) in GC. (B) Multivariate forest plot showing LHFPL2 and LHFPL6 expression and the clinicopathological factors related to OS in GC. (C) Univariate forest plot illustrating the expression of LHFPLs and the clinicopathological factors related to Progression-Free Survival (PFS) in GC. (D) Multivariate forest plot showing LHFPL1, LHFPL5, and LHFPL6 expression and the clinicopathological factors related to PFS in GC. |
Relationship of LHFPL6 mRNA Expression with GC Patient Survival
To evaluate the association of LHFPL6 expression levels with GC patient survival, we employed the GEPIA and Kaplan–Meier plotter databases. As indicated in Figure 4A–D, we observed lower rates of OS (Log rank test, P = 0.019) and DFS (Log rank test, P=0.044) in the high LHFPL6 expression group than in the low LHFPL6 expression group. Survival curves drawn using Kaplan–Meier plotter data suggested that the OS (Log rank test, P = 3.8e-05) and PPS (Log rank test, P = 5.2e-05) were remarkably higher in patients with low LHFPL6 expression.
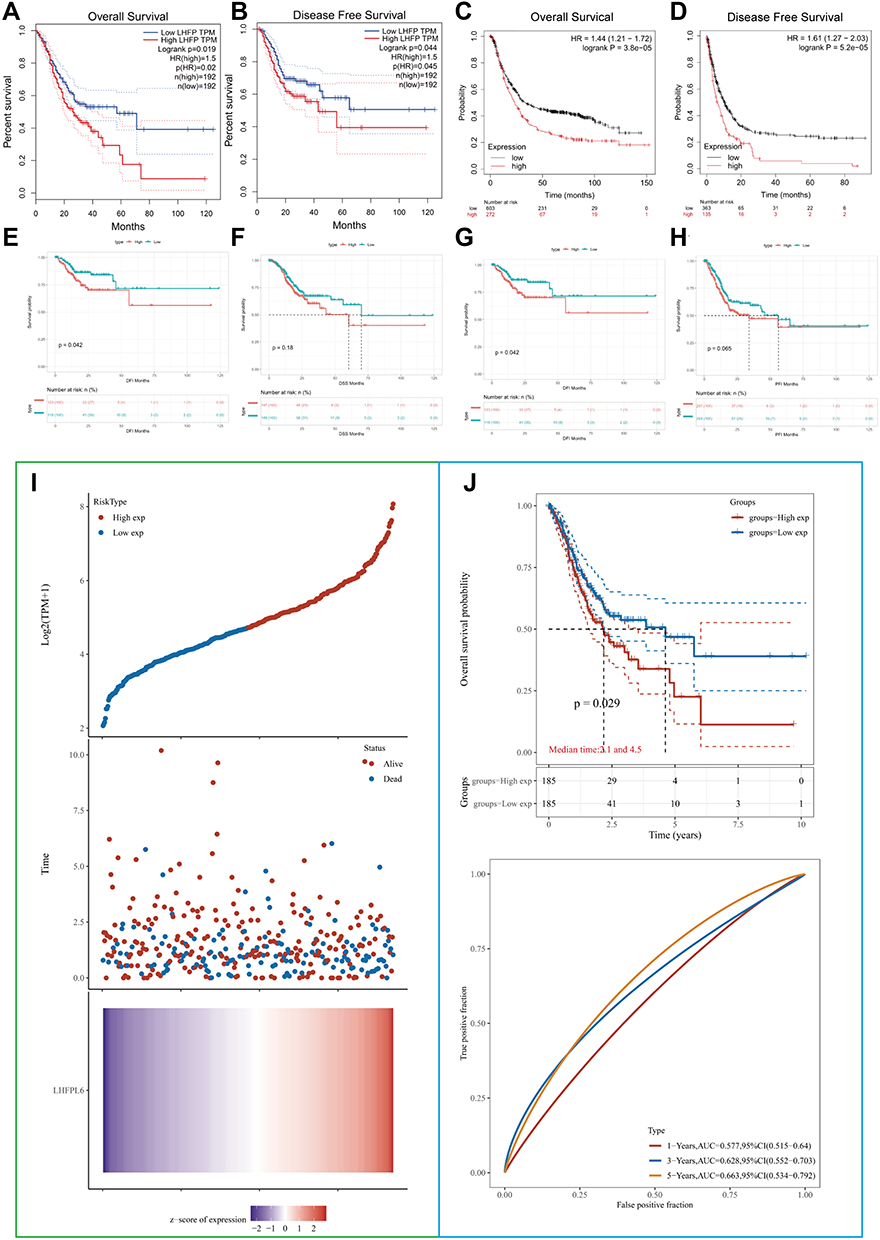 |
Figure 4 Comparison of survival between patients showing high vs low LHFPL6 expression using Kaplan–Meier curves based on three probe sets from the Gene Expression Profiling Interactive Analysis (GEPIA) and Kaplan–Meier plotter databases. (A) Overall survival (OS) based on the GEPIA database. (B) Disease-free survival (DFS) based on the GEPIA database.(C) OS based on the Kaplan–Meier plotter database. (D) Post-progression survival (PPS) based on the Kaplan–Meier plotter database. (E–H) OS, disease-free interval (DFI), disease-specific survival (DSS), and progression-free interval (PFI) based on The Cancer Genome Atlas-STAD database. (I) Risk score curves. Patients were divided into low- and high-risk groups according to their median LHFPL6 expression. The relationship between survival status and survival duration (years) is illustrated. The horizontal coordinates all represent samples, and the samples are ordered consecutively. (J) Kaplan–Meier survival analysis and time-dependent receiver operating characteristic analysis based on LHFPL6 expression. |
In addition, we also analyzed TCGA-STAD data independently. As shown in Figure 4E–H, high LHFPL6 expression levels in GC patients were associated with low rates of OS (Log rank test, P = 0.016), DSS (Log rank test, P = 0.18), DFI (Log rank test, P = 0.042), and PFI (Log rank test, P = 0.065).
Patients from the TCGA-STAD cohort were divided into high- and low-risk groups based on the median expression levels of LHFPL6 (Figure 4I). Survival duration in the low-risk group was longer than that in the high-risk group (P < 0.05). Finally, based on TCGA-STAD data, the expression levels of LHFPL6 were used to predict the OS of GC patients. The AUCs for predicting 1-, 3-, and 5-year survival were 0.577, 0.628, and 0.663, respectively (Figure 4J).
Expression Levels of LHFPL6 in GC and Clinicopathological Parameters in Patients with GC
Using both Western blotting and ELISA, we observed that LHFPL6 was over-expressed in GC cells and tissue (Figure 5A–D). The different intensities of IHC staining are shown in Figure 5E. The mean H-SCORE for LHFPL6 expression in GC cancer tissue was 97.5 ± 18.79, while that for paracancerous tissue was 8.26 ± 2.92 (Figure 5F). We observed that LHFPL6 mRNA was over-expressed in GC tissue (Figure 5G–I). Then, we studied the relationship between LHFPL6 mRNA expression and clinicopathological features in GC patients, including age, race, sex, histologic grade, primary therapy outcome, and T/N/M stage (Figure 5J–Q). As shown in Figure 5P, the mRNA expression of LHFPL6 was significantly correlated with T stage. The lowest mRNA levels of LHFPL6 were observed at the T1 stage (P < 0.05, P < 0.01, P < 0.001).
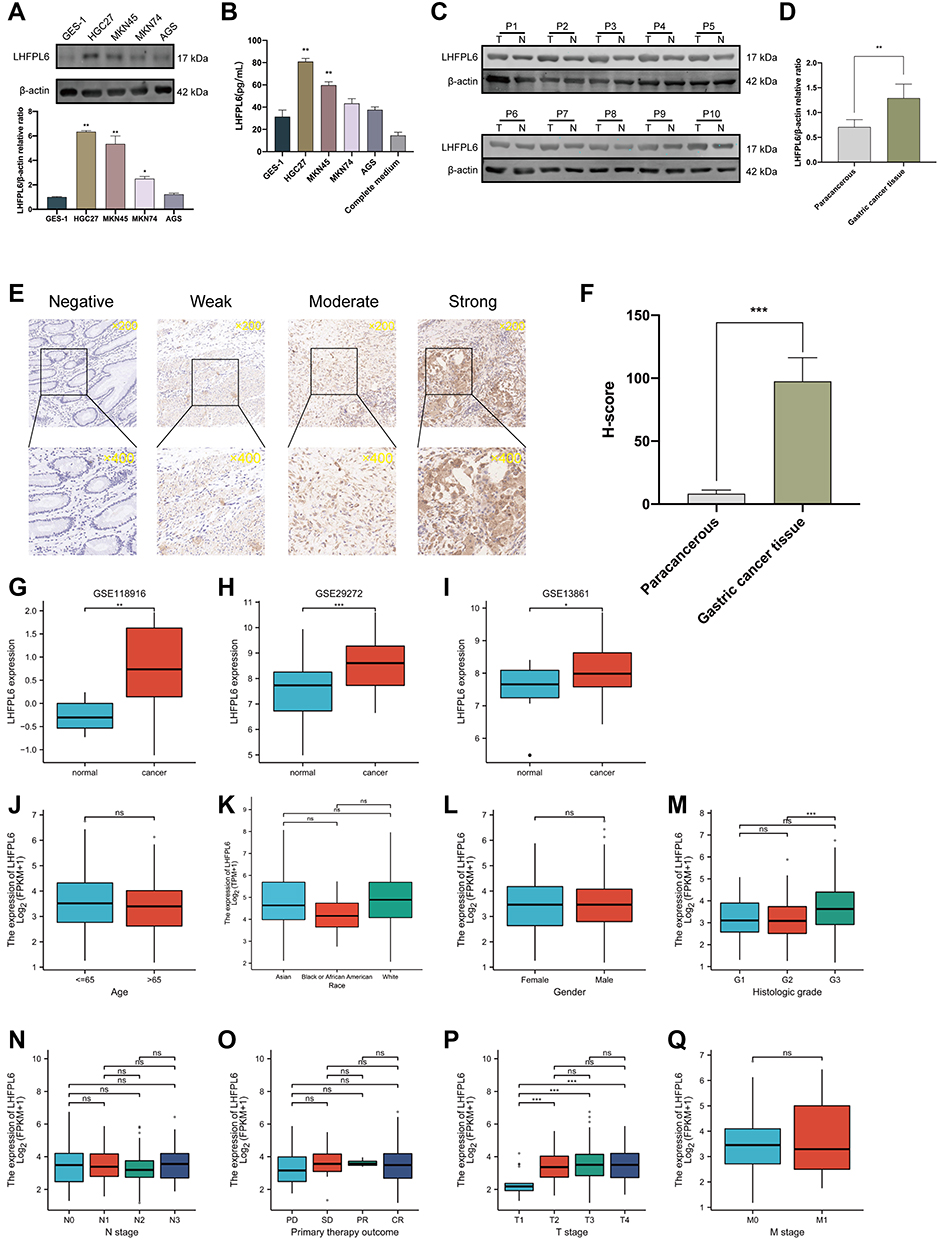 |
Figure 5 Expression levels of LHFPL6 in gastric cancer (GC), and the mRNA expression of LHFPL6 in different sample types and patients with different clinicopathological characteristics. (A and B) Differential expression of LHFPL6 in normal gastric epithelial cells and GC cells.(C and D) Western blots demonstrating LHFPL6 protein expression in cancerous tissues and adjacent non-cancerous tissues.(E) Representative images of tissues with different LHFPL6 immunohistochemical staining intensities.(F) Statistical comparison of LHFPL6 expression levels (H-SCORE) between paracancerous and GC tissue (n=10).(G–I) mRNA expression of LHFPL6 in gastric cancer (GC) vs normal gastric tissue, obtained based on three independent GSE datasets. (J–Q) Association of LHFPL6 expression with age, sex, race, histologic grade, T/N/M stage, and the primary treatment outcome of GC patients. *P < 0.05, **P < 0.01, ***P < 0.001. Abbreviation: NS, no significance. |
Analysis of the Potential Functions of LHFPL6
GENEMANIA and its functional association data revealed the neighboring genes of LHFPL6; the shared physical interactions, co-expression, co-localization, pathways involved, genetic interactions, and shared protein domains were also identified (Figure 6A). We constructed a protein–protein interaction network (PPI) based on TCGA-STAD data to further identify genes co-expressed with LHFPL6 and obtained a total of 172 genes whose expression was positively correlated with that of LHFPL6 (Figure 6B and C). LHFPL6 and related genes were imported into the Metascape database to conduct enrichment analysis, and the results showed that LHFPL6 may be involved in the following: “Wnt signaling pathway”, “TGF-beta signaling pathway”, “Regulation of actin cytoskeleton”, “Proteoglycans in cancer”, “PI3K/Akt signaling pathway”, “Focal adhesion”, “ECM–receptor interaction”, “extracellular structure organization”, and “extracellular matrix organization” (Figure 6D and E). Subsequently, we calculated the correlation between LHFPL6 expression and that of six epithelial–mesenchymal transition (EMT)-related factors and found a significant positive correlation between LHFPL6 expression and TGFB1, MMP2, MMP9, CDH2, and VIM expression. We also found a significant negative correlation between LHFPL6 expression and CDH1 expression (Figure 6F).
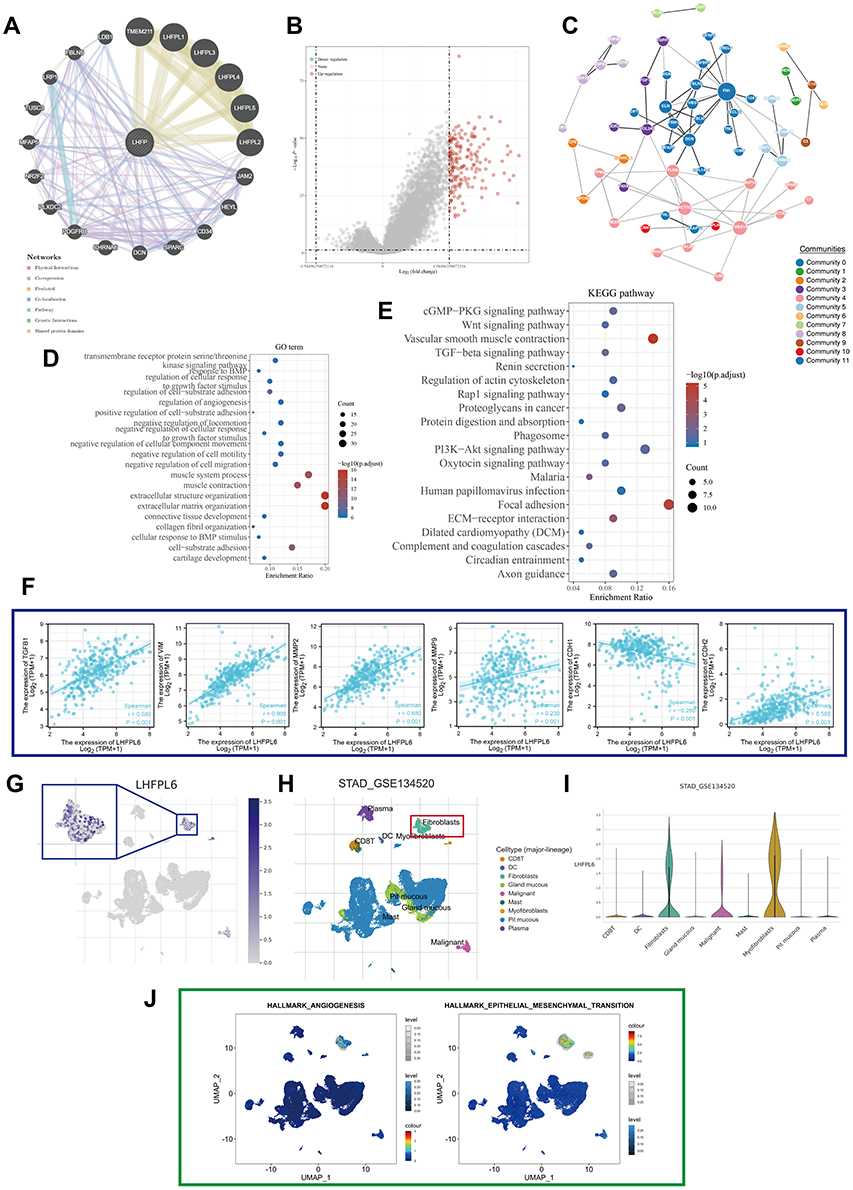 |
Figure 6 Protein–protein interaction network and enrichment analysis. (A) LHFPL6 and its neighboring genes; physical interactions, co-expression patterns, predicted expression, co-localization, pathways, genetic interactions, and shared protein domains are illustrated. (B) Volcano map of genes differentially expressed in response to changes in LHFPL6 expression. Red dots represent upregulated genes, and blue dots represent downregulated genes. The abscissa indicates variations in gene expression between different samples (log2 fold change), and the ordinate indicates the significance of the differences (−log10 padj). (C) Network of LHFPL6 and the genes that show a positive correlation with its expression, based on the GeNets database. (D and E) Gene ontology (GO) and Kyoto Encyclopedia of Genes Pathway (KEGG) enrichment analysis of differentially expressed genes.(F) Relationship between LHFPL6 and six EMT-related factors. (G) Uniform manifold approximation and projection (UMAP) plots showing the expression of LHFPL6 clusters. (H) UMAP plots showing the landscape of gastric cancer cells. Nine cell clusters were identified across 56,440 cells after quality control, dimensionality reduction, and clustering. (I) Violin plots for gastric cancer cell cluster marker genes and LHFPL6 across different cell types. The expression is measured as log 2 (TP10K+1). (J) Enrichment score for genes in the Hallmark hypoxia gene set of each cell, obtained using gene set variation analysis. |
Because enrichment analyses suggested that LHFPL6 may be associated with the activation of the EMT phenotype, we proceeded with analyses at the single-cell level. We found that LHFPL6 was mainly expressed in fibroblasts, which are important players in EMT (Figure 6G–I). This was consistent with our earlier findings. We also observed that cells expressing LHFPL6 tended to express genes related to EMT as well as angiogenesis (Figure 6J). In summary, these results suggested that LHFPL6 may be involved in EMT-related pathways.
Construction of ceRNA Network Based on LHFPL6 Expression
All mRNAs, lncRNAs, and miRNAs that showed differential expression between LHFPL6 high vs low expression groups were identified (Figure 7A–C). The expression heat maps of 15 lncRNAs, miRNAs, and mRNAs with the most significant differences (highest P-values) are shown in Figure 7D–F. In total, 202 lncRNA–miRNA pairs including 47 lncRNAs and 23 miRNAs were identified through the starBase database. Subsequently, 885 DEmRNAs were identified across all target genes based on the 23 previously identified miRNAs obtained from the three prediction databases. Finally, we constructed a ceRNA network based on lncRNA–miRNA and mRNA–miRNA pairs, which included 885 mRNAs, 23 miRNAs, and 47 lncRNAs (Figure 7G). Enrichment results for the whole network are presented in Figure 7H–K. The DERNAs participating in the network were particularly enriched in the “regulation of transcription”, “focal adhesion”, “Wnt signaling pathway”, and “pathways in cancer” (Figure 7H–K). Further enrichment analysis of the top 10 hub RNAs revealed that the network may be involved in cell proliferation, immune response, and EMT (Figure 7L).
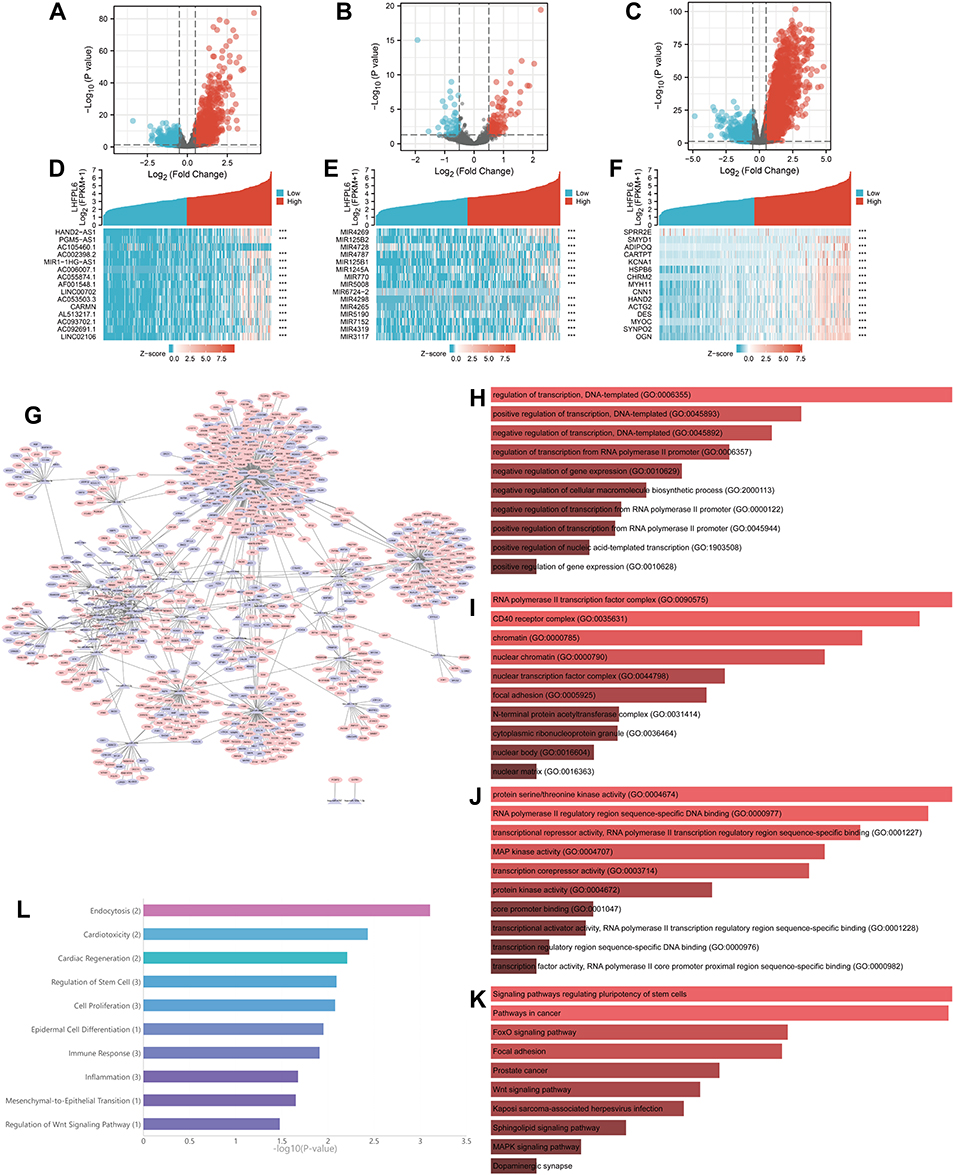 |
Figure 7 Analysis of upstream events associated with LHFPL6 overexpression in gastric cancer (GC). (A–C) Volcano plots and heatmaps showing DElncRNAs, DEmiRNAs, and DEmRNAs in GC samples with high vs low LHFPL6 expression. Red represents upregulated genes and blue represents downregulated genes. The volcano plots describe: (A) DElncRNAs (|log2 fold change| > 0.5 and adjusted P-value < 0.05). (B) DEmiRNAs (|log2 fold change| > 0.5 and adjusted P-value < 0.05). (C) DEmRNAs (|log2 fold change| > 0.5 and adjusted P-value < 0.05). (D–F) The horizontal axis of the heatmap indicates the samples, and the vertical axis indicates the 15 significant differentially expressed genes (DEGs). (G) ceRNA network based on DEGs. (H–K) Biological Processes (BP), Cellular Components (CC), Molecular Functions (MF), and Kyoto Encyclopedia of Genes and Genomes (KEGG) enrichment analysis for ceRNA network members. (L) Enrichment analysis for all hub miRNAs. |
To further determine the prognostic value of the ceRNA network in GC, we analyzed the expression levels of hub RNAs from the triple regulatory network in cancerous and adjacent normal stomach tissues using STAD data. We found three upregulated miRNAs (hsa-miR-4645-3p, hsa-miR-203a-3p, and hsa-miR-4728-3p) in GC (Figure 8A–O). Then, Kaplan–Meier analysis and Log rank tests were conducted to perform OS analysis using the STAD cohort. A total of two miRNAs (hsa-miR-199a-5p and hsa-miR-203a-3p) were found to be associated with prognosis after excluding miRNAs whose expression levels were too low to be analyzed (Figure 8P–U).
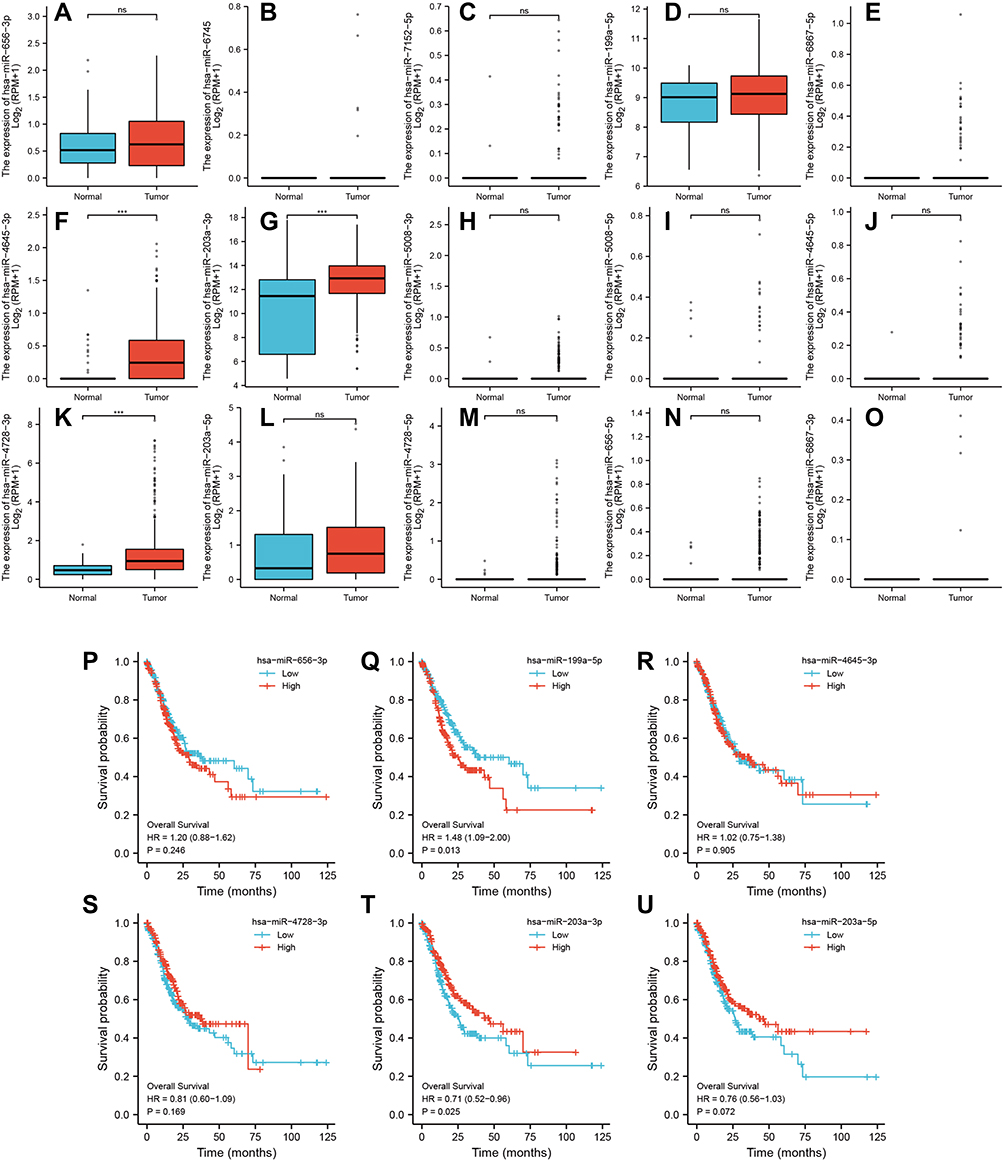 |
Figure 8 Expression of differential hub-miRNAs. (A–O) Hub-miRNA expression in stomach adenocarcinoma (STAD) and adjacent normal stomach tissue. (P–U) Kaplan–Meier curves for overall survival in gastric cancer patients based on expression levels of Hub-miRNAs. ***P < 0.001. |
Association Between LHFPL6 Overexpression and EMT
We further conducted in vitro experiments to validate the association between LHFPL6 and EMT. First, LHFPL6 expression was validated after the stable transfection of the LHFPL6 constructs in HGC27 cells using Western blots and GFP expression (Figure 9A) (P < 0.05, P < 0.01). We observed that LHFPL6 knockdown decreased HGC27 cell migration, invasion, and clone formation capacity (Figure 9B and C). Next, we detected EMT-associated markers in the control, NC, LHFPL6 knockdown, and LHFPL6 overexpression groups. LHFPL6 silencing upregulated E-cadherin and downregulated TGFβ1, MMP2, MMP9, N-cadherin, and vimentin. In contrast, the overexpression of LHFPL6 caused an opposite trend in the expression of these markers in HGC27 cells (Figure 9D and E). Taken together, these results suggest that LHFPL6 regulates EMT in HGC27 cells.
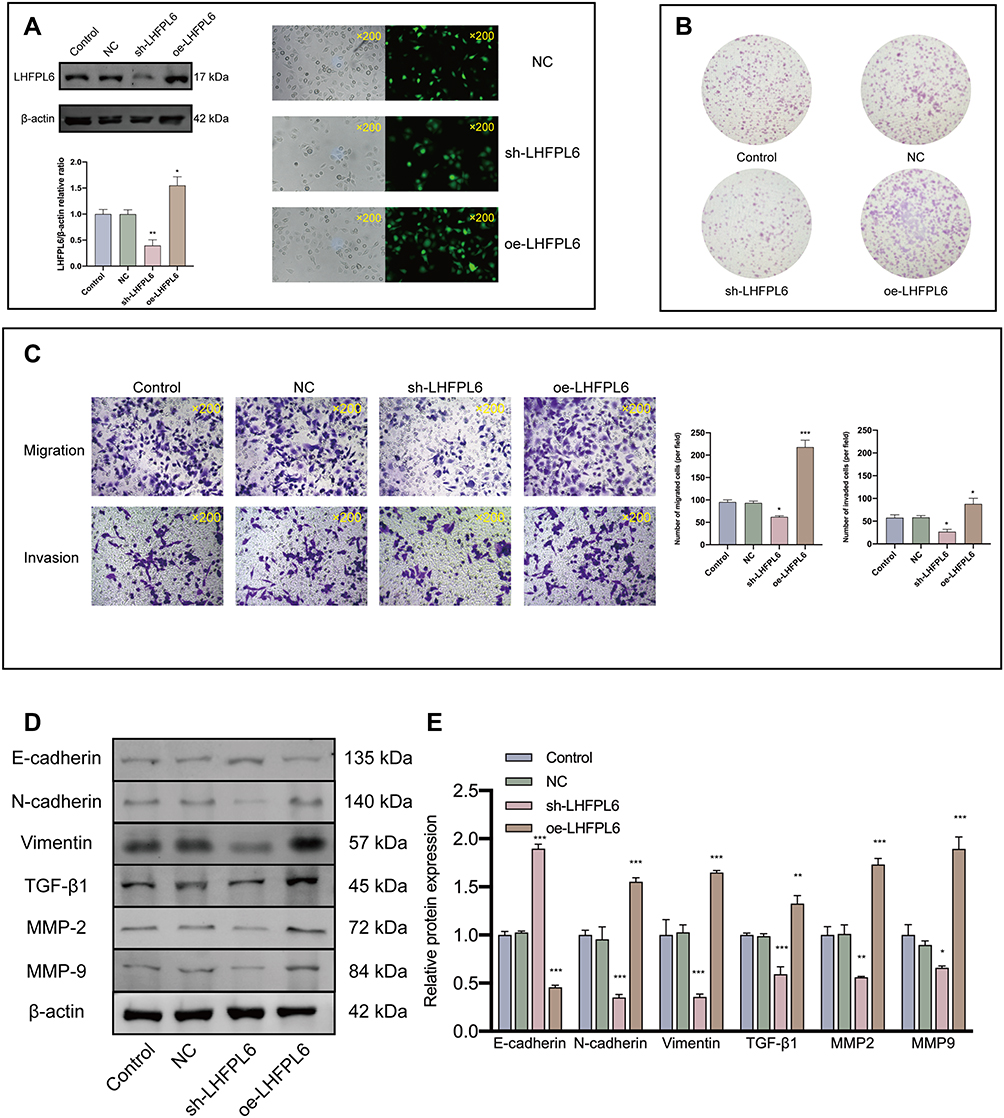 |
Figure 9 Effect of LHFPL6 on cell invasion and migration and its relationship with epithelial–mesenchymal transition (EMT)-related proteins. (A) Validation of LHFPL6 transfection efficiency in HGC-27 cells. (B) Representative image of cell clone formation. (C) Representative images of transwell migration and invasion (×200). The number of migrating and invading cells was quantified using five random microscopic fields for each treatment group. (D and E) After transfection, the expression of EMT-related proteins was evaluated using Western blot analysis. *P < 0.05, **P < 0.01, ***P < 0.001. |
Immune Microenvironment Analysis
We attempted to explore the possible molecular mechanism underlying the involvement of immune cell infiltration in the pathogenesis of GC. First, we assessed the proportion of tumor-infiltrating immune cell subsets based on TCGA-STAD data using the CIBERSORT algorithm. Twenty-two immune cell profiles for GC samples were constructed to detect the influence of LHFPL6 expression on immune cells (Figure 10A). We observed that the expression level of LHFPL6 correlated with the infiltration abundance of activated memory CD4+ T cells, follicular helper T cells, memory B cells, activated mast cells, monocytes, neutrophils, activated myeloid dendritic cells, M2 macrophages, and resting mast cells (P < 0.05) (Figure 10B). Further, the ssGSEA algorithm was used to calculate the correlation between LHFPL6 expression and the degree of infiltration of several immune cells (Figure 10C).
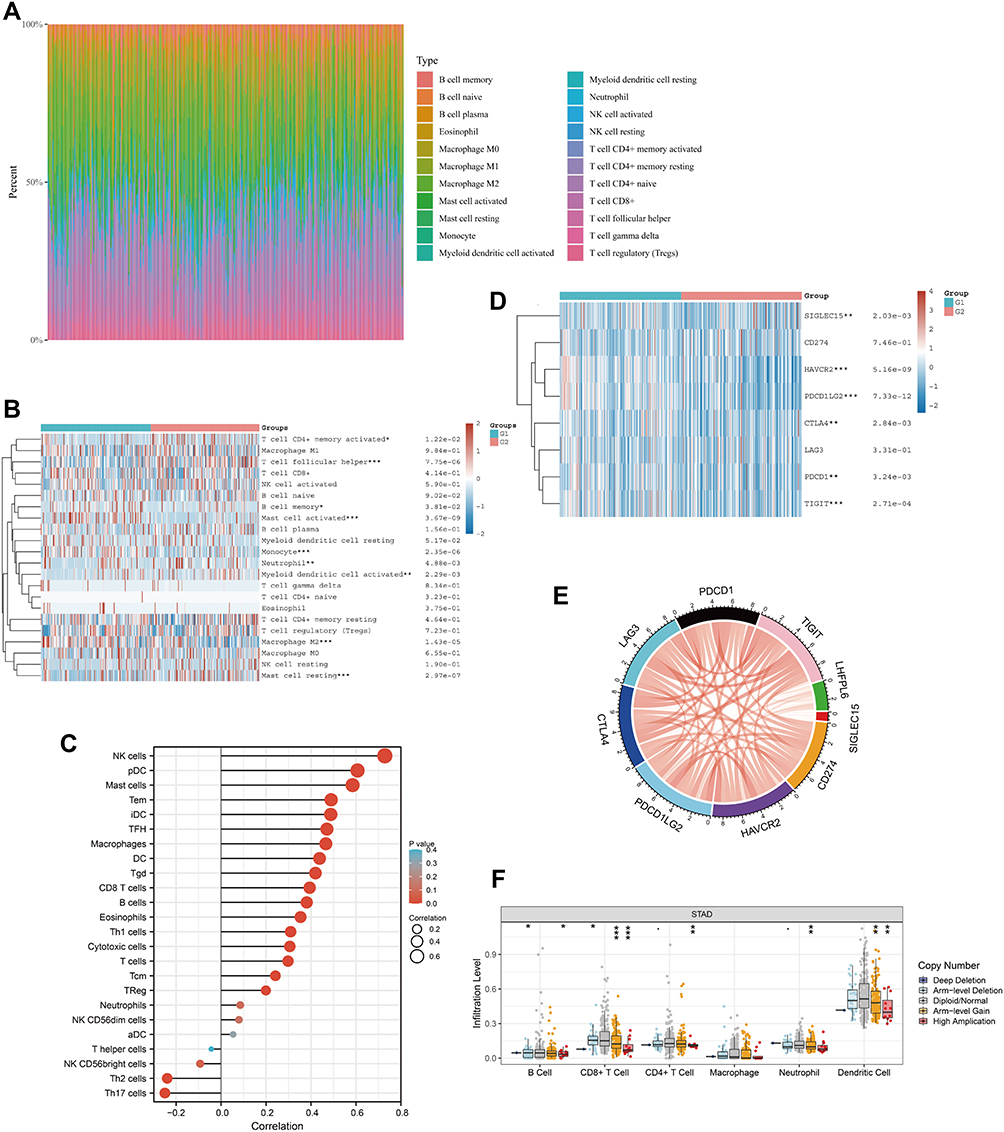 |
Figure 10 Correlation between LHFPL6 expression and the abundance of immune cell infiltration. (A) Percentage abundance of tumor-infiltrating immune cells in each sample, with different colors representing different types of immune cells. The abscissa represents the sample, and the ordinate represents the percentage of immune cells in a single sample. (B) Immune cell score heat map, where different colors represent expression trends in different samples, where the asterisk represents the degree of significance. The significance in the two groups of samples passed the Wilcox test. (C) Spearman correlation between LHFPL6 expression and 24 types of immune cells; positive correlation, red lollipop; negative correlation, blue lollipop. (D) Relationship between LHFPL6 expression and that of common immune checkpoints (ICPs). Red represents the LHFPL6 high expression group and blue represents the LHFPL6 low expression group (*P < 0.05, **P < 0.01, ***P < 0.001). (E) Relationship between LHFPL6 expression and that of eight ICPs. Red lines represent positive correlations and blue lines represent negative correlations. (F) Association between copy-number variation in LHFPL6 and infiltrating immune cells. *P < 0.05, **P < 0.01, and ***P < 0.001. |
To evaluate the immunotherapy responses based on LHFPL6 expression, we explored the correlation of LHFPL6 levels with those of common immune checkpoints (ICPs), such as CD274, CTLA4, HAVCR2, LAG3, PDCD1, PDCD1LG2, TIGIT, and SIGEC15. We found a high expression of ICPs in the high LHFPL6 expression group (Figure 10D). The relationship between LHFPL6 and ICPs is shown in Figure 9E. The box plots in Figure 9F demonstrate the distributions of all immune subsets based on LHFPL6 copy number status.
Relationship Between LHFPL6 and M2 Macrophage Abundance
Considering that LHFPL6 appeared to be associated with the abundance of M2 macrophages, we further assessed the relationship between LHFPL6 expression and macrophage abundance using the GSE29272 and GSE13861 datasets. After excluding normal samples from these two datasets, 22 immune cell profiles for GC samples were obtained (Figure 11A and C). Further investigations showed that in GSE29272, LHFPL6 expression levels were independent of M0 and M1 macrophage abundance but positively correlated with M2 macrophage abundance (Figure 11B). In GSE13861, LHFPL6 expression levels were not correlated with M0 macrophage abundance, but they were negatively correlated with M1 macrophage abundance and positively correlated with M2 macrophage abundance (Figure 11D). Finally, we calculated the correlation of LHFPL6 with M1 and M2 surface markers using the online TIMER database and found that LHFPL6 expression was significantly and positively correlated with that of MRC1 (CD206) (R = 0.439, P < 1.6e-32) and CD163 (R = 0.462, P < 1.6e-32) (Figure 11E)—M2 macrophage markers that are highly specific and inextricably linked to tumor cell proliferation and metastasis. This series of results suggested the presence of a positive association between LHFPL6 expression and M2 macrophage infiltration. To further investigate the influence of LHFPL6 overexpression on M2 macrophage abundance in GC, we established a tumor–macrophage co-culture model using a transwell non-contact co-culture unit (Figure 11F). We observed that LHFPL6 overexpression significantly up-regulated the surface markers of M2 tumor-associated macrophages (TAMs) (CD206 and CD163) in THP-1 macrophages (Figure 11G–H).
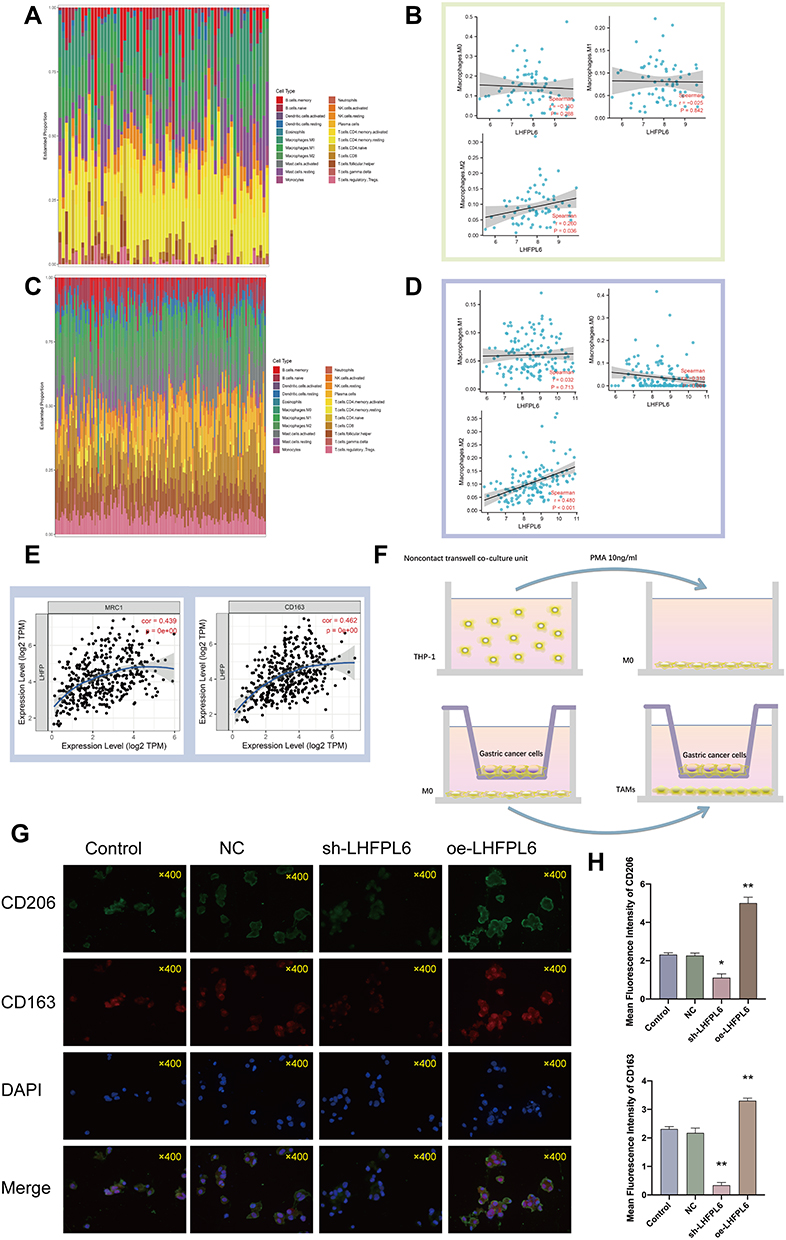 |
Figure 11 Immune landscape of gastric cancer (GC) samples with different levels of LHFPL6, and the relationship between LHFPL6 expression and M2 tumor-associated macrophage infiltration. (A) Proportion of 22 types of tumor-initiating cells (TICs) in GC samples based on GSE29272 data.(B) Correlation between LHFPL6 expression levels and macrophage abundance based on GSE29272 data. (C) Proportion of 22 types of TICs in GC tumor samples based on GSE13861 data.(D) Correlation between LHFPL6 expression levels and macrophage abundance based on GSE13861 data. (E) Correlation of LHFPL6 expression levels with M2 macrophage markers. (F) Schematic diagram showing the tumor–macrophage co-culture system. (G) Double immunofluorescence staining for CD206 (green) and CD163 (red), which are specific markers of M2 macrophages; nuclei are stained with DAPI (blue). (H) Immunofluorescence intensities expressed as mean intensity ± SD. *P < 0.05, **P < 0.01. |
Methylation and Mutation Analysis of LHFPL6
Considering the importance of methylation as an epigenetic modification, we next investigated whether LHFPL6 expression levels were affected by LHFPL6 DNA methylation in GC. Based on methylation data from TCGA-STAD cohorts, we observed that methylation observed using the probes cg07890490, cg01183053, cg01370014, cg08228917, cg09492086, and cg21284880 was negatively correlated with the expression of the LHFPL6 gene (Figure 12A). Subsequently, as shown in Figure 11B and C, we found that LHFPL6 promoter methylation was negatively correlated with LHFPL6 gene expression. Survival curves based on LHFPL6 promoter methylation status revealed a significant association between LHFPL6 promoter hypomethylation and worse OS (P < 0.05), although no significant effect on DFI and DSI was observed (Figure 12D–F).
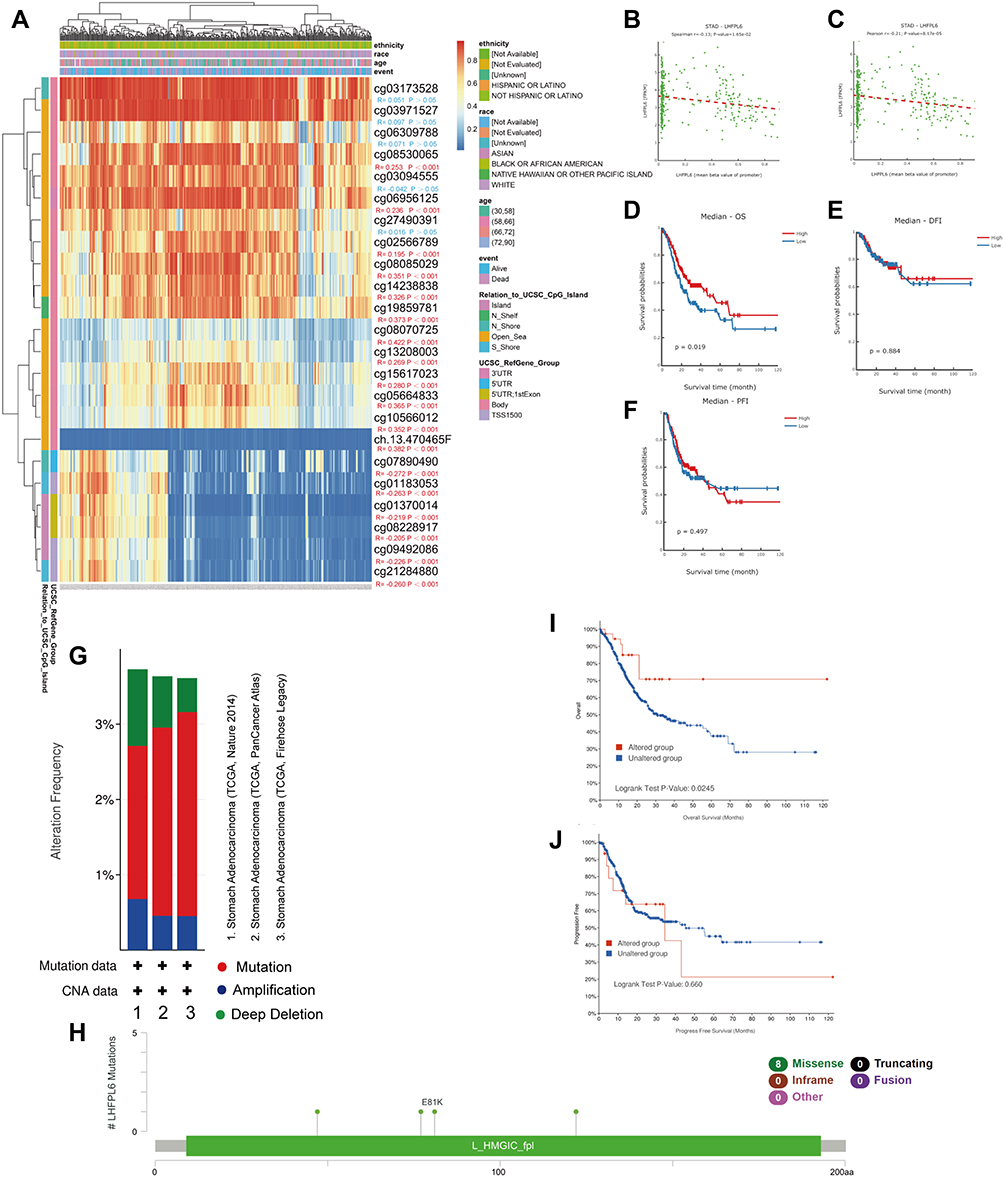 |
Figure 12 Analysis of LHFPL6 methylation in gastric cancer (GC). (A) Waterfall plot for the methylation levels of the LHFPL6 gene. The correlations between LHFPL6 methylation and expression levels were also analyzed. (B and C) Pearson’s correlation coefficient (B) and Spearman correlation coefficient (C) for the relationship between LHFPL6 promoter methylation levels and LHFPL6 expression levels. Association of LHFPL6 promoter methylation with (D) Overall Survival (OS), (E) Disease-Free Interval (DFI), and (F) Progression-Free Interval (PFI) in patients with GC. (G) Frequencies of LHFPL6 mutations and copy number alternations (CNA) in the three datasets. (H) The mutation site profile of the LHFPL6 gene is shown. (I and J) OS and PFS analyses according to the mutation status of the LHFPL6 were performed. |
We analyzed genetic alteration in LHFPL6 and their associations with OS among GC patients. A total of 1213 samples from TCGA datasets across three studies were included for detecting the mutation frequency in GC. As shown in Figure 12G, the mutation rate of LHFPL6 was about 3%. The sites and types of mutations are shown in Figure 12H. Furthermore, Kaplan–Meier analysis showed that mutations in LHFPL6 were associated with longer OS (P = 0.0245) in GC patients (Figure 12I) but had no effect on PFS (Figure 12J). These results implied that genetic alterations in LHFPL6 could also affect patient prognosis in GC and that patients with mutated LHFPL6 might have a better OS.
Finally, survival analysis based on methylation sites was conducted to screen for methylation markers with a prognostic value in GC. As shown in Figure S1, hypomethylation at cg07890490, cg03173528, cg01370014, ch.13.470465F, cg27490391, cg01183053, cg08228917, cg14238838, cg10566012, cg21284880, cg05664833, cg09492086, cg03094555, and cg02566789 in the LHFPL6 gene was correlated with a poor prognosis. These results were consistent with our previous survival analysis.
Discussion
GC is currently one of the most prevalent and lethal tumors in the world, and it causes a serious economic burden.40 Increasing attention is being focused on finding effective therapeutic targets and sensitive biomarkers in order to improve the 5-year survival and quality of life in GC patients. LHFPL6, a member of the LHFP family, was first identified as the translocation partner of HMGA2 in benign lipomas.7 Numerous studies have shown that HMGA2 plays an important role in the occurrence and malignant progression of GC.11,41 Therefore, it is possible that LHFPL6 and other members of the LHFP family could be involved in the progression of GC. Therefore, we speculated that LHFPLs may be involved in GC progression, and accordingly, we performed a series of preliminary data mining studies.
We included six members of the LHFP-like family in the Cox regression model and found that LHFPL6 may be an independent prognostic factor in patients with GC. Therefore, we focused our investigation on LHFPL6. Results from multiple datasets suggested that LHFPL6 may be highly expressed in GC, and TCGA-STAD cohort data suggested that patients with high LHFPL6 expression had lower survival rates. In the present study, we identified remarkable differences in LHFPL6 protein expression levels between gastric epithelial cells and GC cells. IHC and Western blots confirmed that LHFPL6 protein expression was remarkably elevated in GC tissues. We therefore hypothesized that LHFPL6 may be involved in the progression of GC and preliminarily explored the potential molecular mechanisms of LHFPL6 involvement in this process.
Accordingly, we constructed a PPI network centered around LHFPL6 as the core gene and found an association between the expression of LHFPL6 and PDGFRB, which increases the growth and survival of tumor cells and promotes their migration and invasion. PDGFRB has been found to be a potential prognostic factor for GC.42 We then screened for genes showing a positive correlation with LHFPL6 using the TCGA-STAD database. The enrichment analysis suggested that LHFPL6 and these genes may be involved in multiple pathways related to focal adhesion and the extracellular matrix, which are closely related to EMT.43 EMT is also associated with the transformation of early non-invasive tumors into aggressive malignant tumors.44 We found that in the majority of GC cases, a subset of fibroblasts expressed LHFPL6. Fibroblasts located within or near the tumor mass are also known as cancer-associated fibroblasts (CAFs). Fibroblasts can be subdivided into different subsets. For example, muscle fibroblasts are considered a subset of activated fibroblasts.45 A large number of studies have demonstrated that CAFs participate in the EMT of tumor cells by secreting several growth factors, chemokines, and matrix metalloproteinase.46 Interestingly, we found that the cells expressing LHFPL6 were enriched for EMT genes, consistent with recently reported results. These findings suggested that LHFPL6 may be one of the important players in EMT.
Numerous studies suggest that networks mediated by lncRNAs, microRNAs, and mRNAs play an important role in tumorigenesis and development.47,48 Herein, a ceRNA based on LHFPL6 expression was constructed to further explore the possible mechanistic regulation of LHFPL6. Enrichment analysis of the ceRNA network indicated that the network was involved in regulating tumor-related pathways such as blood vessel development, responses to growth factors, and pathways in cancer. Interestingly, across the ceRNA network, two hub RNAs were found to be significantly associated with the prognosis of GC patients. It has been demonstrated that miR-199a-5p functions as an oncogene by expediting metastasis and also modulates EMT in GC.49,50 In contrast, hsa-miR-203a-3p acts as a GC suppressor.51 These findings revealed a complex mechanism underlying the functional contribution of LHFPL6 to GC. Furthermore, our in vitro study also confirmed that LHFPL6 overexpression or knockdown could significantly facilitate or suppress the EMT phenotype, respectively. These results together indicate that LHFPL6 is an important player in the process of EMT.
In recent years, immunotherapy has improved the survival of patients with advanced GC.52,53 Considering that immune cells, including tumor-infiltrating lymphocytes, TAMs, dendritic cells, and myeloid-derived suppressor cells,54 are important components of the immune microenvironment, we further evaluated TCGA-STAD data using the CIBERSORT algorithm to explore the relationship between LHFPL6 and immune cell infiltration. We found a high abundance of infiltrating follicular helper T cells, activated mast cells, monocytes, M2 macrophages, and resting mast cells. In addition, we found that the expression levels of LHFPL6 were positively correlated with those of some ICPs, suggesting that LHFPL6 plays a key role in the regulation of immune-affected cells and GC patients with higher LHFPL6 expression levels may benefit more from immunotherapy.
M2 macrophages, which also act as TAMs in the immune microenvironment, have been extensively studied for their key role in tumor progression, which affects the growth and metastasis of tumors.55 Several studies have shown that TAMs can have a positive effect on cancer-promoting factors in malignant tumors and create a microenvironment that supports metastasis and EMT.56 We evaluated the correlation between LHFPL6 and macrophage infiltration abundance based on the GSE29272 and GSE13861 datasets and found that LHFPL6 levels were significantly and positively correlated with M2 macrophage abundance. Correlation analysis based on the TIMER database also showed that LHFPL6 was positively correlated with the M2 macrophage markers MRC1 (CD206) and CD163. In a tumor–macrophage co-culture system, we verified that LHFPL6 promotes the expression of the M2 macrophage surface markers CD163 and CD206 (MRC1). These results indicated that LHFPL6 may be associated with M2 macrophage activation.
DNA methylation and mutations are closely associated with the development of GC.57,58 In the current study, we found that patients with mutations in the LHFPL6 gene had a higher OS rate. Further, hypomethylation at several LHFPL6 loci (cg21284880, cg09492086, cg08228917, cg01370014, cg01183053, and cg07890490) and hypermethylation at several other loci (cg08530065, cg06956125, cg02566789, cg08085029, cg14238838, and cg19859781) were associated with high LHFPL6 expression and poor survival outcomes. As methylation of the DNA promoter region is the main focus of current research and is significantly associated with the inactivation of certain oncogenes, we analyzed the relationship between LHFPL6 promoter methylation and LHFPL6 expression levels and found a negative correlation between the two. Furthermore, GC patients with hypomethylation at the LHFPL6 promoter showed a lower OS rate, suggesting that LHFPL6 promoter methylation plays a role in GC progression.
It must be noted that the results of our study are only preliminary. Efforts are currently underway to collect a large number of GC samples from patients for whom long-term follow up and clinical information is available. This will help us better determine the prognostic value of LHFPL6 in GC. Moreover, the exact mechanistic role of LHFPL6 in GC is being intensively investigated in our laboratory and will be further detailed in follow-up research articles.
Conclusion
Our findings suggest that the overexpression of LHFPL6 is associated with several clinicopathological features and a poor prognosis in GC and is an independent prognostic factor for GC. LHFPL6 may be an important player in the complex gene regulatory mechanisms that drive GC through processes such as EMT and M2 macrophage infiltration. In addition, hypomethylation of the LHFPL6 gene is associated with high LHFPL6 expression and a poor clinical prognosis. However, our study has a few limitations. First, in vivo experimental evidence was limited, and most of the data analyzed in this study came from online databases. Moreover, the clinical sample size examined in this study was small, and further studies with more samples are needed to validate our findings. Nevertheless, our findings provide exciting novel clues that lay the foundation for more focused studies aimed at elucidating the molecular mechanisms related to LHFPL6 involvement in GC.
Data Sharing Statement
We declare that all the data in this article are authentic, valid, and available upon reasonable request.
Ethical Standards
The study was approved by the Jiangsu Province Hospital of Chinese Medicine, Affiliated Hospital of Nanjing University of Chinese Medicine, Ethics and Research Committee (protocol number: 2019NL-166-02). This study conformed to the principles outlined in the Declaration of Helsinki (World Medical Association Declaration of Helsinki).
Acknowledgments
The present study was supported by the Youth Science and Technology Project of Suzhou (No. KJXW2019059); the Suzhou Science and Technology Development Plan (No. SYSD2019006); and the Zhangjiagang TCM Hospital Youth Science and Technology Project (No. ZZYQ1915).
Author Contributions
All authors made a significant contribution to the work reported, whether in study conception, design, and execution; data acquisition, analysis, and interpretation; or all these areas. All authors were involved in drafting, revising, or critically reviewing the article; gave final approval for the version to be published; have agreed on the journal to which the article has been submitted; and agree to be accountable for all aspects of the work. Yuan-Jie Liu and Sheng-Yan Yin are co-first authors. Dr. Pan Huang and Dr. Jie-Pin Li are designated conjointly as corresponding authors.
Disclosure
The authors have declared no conflicts of interest.
References
1. Singh H, Lane AA, Correll M, et al. Putative RNA-splicing gene LUC7L2 on 7q34 represents a candidate gene in pathogenesis of myeloid malignancies. Blood Cancer J. 2013;3:e117. doi:10.1038/bcj.2013.16
2. Luo Y, You S, Wang J, et al. Association between sumoylation-related gene rs77447679 polymorphism and risk of gastric cancer (GC) in a Chinese population. J Cancer. 2017;8:3226–3231. doi:10.7150/jca.20587
3. Johnson CH, Ivanisevic J, Siuzdak G. Metabolomics: beyond biomarkers and towards mechanisms. Nat Rev Mol Cell Biol. 2016;17:451–459. doi:10.1038/nrm.2016.25
4. Li JP, Zeng SH, Zhang YH, et al. Bioinformatics-based analysis of the association between the A1-chimaerin (CHN1) gene and gastric cancer. Bioengineered. 2021;12:2874–2889. doi:10.1080/21655979.2021.1940621
5. Liu YJ, Li JP, Zhang Y, et al. FSTL3 is a prognostic biomarker in gastric cancer and is correlated with M2 macrophage infiltration. Onco Targets Ther. 2021;14:4099–4117. doi:10.2147/OTT.S314561
6. Liu YJ, Li JP, Zeng SH, et al. DZIP1 expression as a prognostic marker in gastric cancer: a bioinformatics-based analysis. Pharmgenomics Pers Med. 2021;14:1151–1168.
7. Petit MM, Schoenmakers EF, Huysmans C, et al. LHFP, a novel translocation partner gene of HMGIC in a lipoma, is a member of a new family of LHFP-like genes. Genomics. 1999;57:438–441. doi:10.1006/geno.1999.5778
8. Zhang S, Mo Q, Wang X. Oncological role of HMGA2 (Review). Int J Oncol. 2019;55:775–788.
9. Wang X, Wang J, Wu J. Emerging roles for HMGA2 in colorectal cancer. Transl Oncol. 2021;14:100894. doi:10.1016/j.tranon.2020.100894
10. Dong J, Wang R, Ren G, et al. HMGA2-FOXL2 axis regulates metastases and epithelial-to-mesenchymal transition of chemoresistant gastric cancer. Clin Cancer Res. 2017;23:3461–3473. doi:10.1158/1078-0432.CCR-16-2180
11. Sun J, Sun B, Zhu D, et al. HMGA2 regulates CD44 expression to promote gastric cancer cell motility and sphere formation. Am J Cancer Res. 2017;7:260–274.
12. Li W, Li J, Mu H, et al. MiR-503 suppresses cell proliferation and invasion of gastric cancer by targeting HMGA2 and inactivating WNT signaling pathway. Cancer Cell Int. 2019;19:164. doi:10.1186/s12935-019-0875-1
13. Ji X, Bu ZD, Yan Y, et al. The 8th edition of the American Joint Committee on Cancer tumor-node-metastasis staging system for gastric cancer is superior to the 7th edition: results from a Chinese mono-institutional study of 1663 patients. Gastric Cancer. 2018;21:643–652. doi:10.1007/s10120-017-0779-5
14. Nizioł M, Zińczuk J, Zaręba K, et al. Immunohistochemical analysis of the expression of adhesion proteins: TNS1, TNS2 and TNS3 in correlation with clinicopathological parameters in gastric cancer. Biomolecules. 2021;11:640. doi:10.3390/biom11050640
15. Yang Y, Xiao M, Song Y, et al. H-score of 11β-hydroxylase and aldosterone synthase in the histopathological diagnosis of adrenocortical tumors. Endocrine. 2019;65:683–691. doi:10.1007/s12020-019-02022-8
16. Hnasko TS, Hnasko RM. The western blot. Methods Mol Biol. 2015;1318:87–96.
17. Li W, Li DM, Chen K, et al. Development of a gene therapy strategy to target hepatocellular carcinoma based inhibition of protein phosphatase 2A using the α-fetoprotein promoter enhancer and pgk promoter: an in vitro and in vivo study. BMC Cancer. 2012;12:547. doi:10.1186/1471-2407-12-547
18. Chen J, Zhu H, Liu Q, et al. DEPTOR induces a partial epithelial-to-mesenchymal transition and metastasis via autocrine TGFβ1 signaling and is associated with poor prognosis in hepatocellular carcinoma. J Exp Clin Cancer Res. 2019;38:273. doi:10.1186/s13046-019-1220-1
19. Genin M, Clement F, Fattaccioli A, et al. M1 and M2 macrophages derived from THP-1 cells differentially modulate the response of cancer cells to etoposide. BMC Cancer. 2015;15:577. doi:10.1186/s12885-015-1546-9
20. Donaldson JG. Immunofluorescence staining. Curr Protoc Cell Biol. 2015;69:
21. Rhodes DR, Yu J, Shanker K, et al. ONCOMINE: a cancer microarray database and integrated data-mining platform. Neoplasia. 2004;6:1–6. doi:10.1016/S1476-5586(04)80047-2
22. Wang Z, Jensen MA, Zenklusen JC. A practical guide to The Cancer Genome Atlas (TCGA). Methods Mol Biol. 2016;1418:111–141.
23. Dai YC, Hu GF, Zhang XF, et al. Molecular epidemiology of norovirus gastroenteritis in children in Jiangmen, China, 2005-2007. Arch Virol. 2011;156:1641–1646. doi:10.1007/s00705-011-1010-3
24. Wang Z, Nilsson RH, Lopez-Giraldez F, et al. Tasting soil fungal diversity with earth tongues: phylogenetic test of SATe alignments for environmental ITS data. PLoS One. 2011;6:e19039. doi:10.1371/journal.pone.0019039
25. Shao JW, Dai YC, Xue JP, et al. In vitro and in vivo anticancer activity evaluation of ursolic acid derivatives. Eur J Med Chem. 2011;46:2652–2661. doi:10.1016/j.ejmech.2011.03.050
26. Tang Z, Kang B, Li C, et al. GEPIA2: an enhanced web server for large-scale expression profiling and interactive analysis. Nucleic Acids Res. 2019;47:W556–w560. doi:10.1093/nar/gkz430
27. Franz M, Rodriguez H, Lopes C, et al. GeneMANIA update 2018. Nucleic Acids Res. 2018;46:W60–w64. doi:10.1093/nar/gky311
28. Kuleshov MV, Jones MR, Rouillard AD, et al. Enrichr: a comprehensive gene set enrichment analysis web server 2016 update. Nucleic Acids Res. 2016;44:W90–97. doi:10.1093/nar/gkw377
29. Hsu SD, Lin FM, Wu WY, et al. miRTarBase: a database curates experimentally validated microRNA-target interactions. Nucleic Acids Res. 2011;39:D163–169. doi:10.1093/nar/gkq1107
30. Chen Y, Wang X. miRDB: an online database for prediction of functional microRNA targets. Nucleic Acids Res. 2020;48:D127–d131. doi:10.1093/nar/gkz757
31. Riffo-Campos ÁL, Riquelme I, Brebi-Mieville P. Tools for sequence-based miRNA target prediction: what to choose? Int J Mol Sci. 2016;17. doi:10.3390/ijms17121987
32. Doncheva NT, Morris JH, Gorodkin J, et al. Cytoscape stringapp: network analysis and visualization of proteomics data. J Proteome Res. 2019;18:623–632. doi:10.1021/acs.jproteome.8b00702
33. Li J, Han X, Wan Y, et al. TAM 2.0: tool for MicroRNA set analysis. Nucleic Acids Res. 2018;46:W180–w185. doi:10.1093/nar/gky509
34. Kawada JI, Takeuchi S, Imai H, et al. Immune cell infiltration landscapes in pediatric acute myocarditis analyzed by CIBERSORT. J Cardiol. 2021;77:174–178. doi:10.1016/j.jjcc.2020.08.004
35. Shen Y, Peng X, Shen C. Identification and validation of immune-related lncRNA prognostic signature for breast cancer. Genomics. 2020;112:2640–2646. doi:10.1016/j.ygeno.2020.02.015
36. Pan JH, Zhou H, Cooper L, et al. LAYN is a prognostic biomarker and correlated with immune infiltrates in gastric and colon cancers. Front Immunol. 2019;10:6. doi:10.3389/fimmu.2019.00006
37. Koch A, Jeschke J, Van Criekinge W, et al. MEXPRESS update 2019. Nucleic Acids Res. 2019;47:W561–w565. doi:10.1093/nar/gkz445
38. Sun CC, Li SJ, Hu W, et al. Comprehensive analysis of the expression and prognosis for E2Fs in human breast cancer. Mol Ther. 2019;27:1153–1165. doi:10.1016/j.ymthe.2019.03.019
39. Modhukur V, Iljasenko T, Metsalu T, et al. MethSurv: a web tool to perform multivariable survival analysis using DNA methylation data. Epigenomics. 2018;10:277–288. doi:10.2217/epi-2017-0118
40. Smyth EC, Nilsson M, Grabsch HI, et al. Gastric cancer. Lancet. 2020;396:635–648. doi:10.1016/S0140-6736(20)31288-5
41. Jun KH, Jung JH, Choi HJ, et al. HMGA1/HMGA2 protein expression and prognostic implications in gastric cancer. Int J Surg. 2015;24:39–44. doi:10.1016/j.ijsu.2015.10.031
42. Yoshida K, Yasui W, Ito H, et al. Growth factors in progression of human esophageal and gastric carcinomas. Exp Pathol. 1990;40:291–300. doi:10.1016/S0232-1513(11)80316-6
43. De Craene B, Berx G. Regulatory networks defining EMT during cancer initiation and progression. Nat Rev Cancer. 2013;13:97–110. doi:10.1038/nrc3447
44. Pastushenko I, Blanpain C. EMT transition states during tumor progression and metastasis. Trends Cell Biol. 2019;29:212–226. doi:10.1016/j.tcb.2018.12.001
45. Huelsken J, Hanahan D. A subset of cancer-associated fibroblasts determines therapy resistance. Cell. 2018;172:643–644. doi:10.1016/j.cell.2018.01.028
46. Fiori ME, Di Franco S, Villanova L, et al. Cancer-associated fibroblasts as abettors of tumor progression at the crossroads of EMT and therapy resistance. Mol Cancer. 2019;18:70. doi:10.1186/s12943-019-0994-2
47. Bhan A, Soleimani M, Mandal SS. Long noncoding RNA and cancer: a new paradigm. Cancer Res. 2017;77:3965–3981. doi:10.1158/0008-5472.CAN-16-2634
48. Rupaimoole R, Slack FJ. MicroRNA therapeutics: towards a new era for the management of cancer and other diseases. Nat Rev Drug Discov. 2017;16:203–222. doi:10.1038/nrd.2016.246
49. He XJ, Ma YY, Yu S, et al. Up-regulated miR-199a-5p in gastric cancer functions as an oncogene and targets klotho. BMC Cancer. 2014;14:218. doi:10.1186/1471-2407-14-218
50. Zhao X, He L, Li T, et al. SRF expedites metastasis and modulates the epithelial to mesenchymal transition by regulating miR-199a-5p expression in human gastric cancer. Cell Death Differ. 2014;21:1900–1913. doi:10.1038/cdd.2014.109
51. Wang Z, Zhao Z, Yang Y, et al. MiR-99b-5p and miR-203a-3p function as tumor suppressors by targeting IGF-1R in gastric cancer. Sci Rep. 2018;8:10119. doi:10.1038/s41598-018-27583-y
52. Coutzac C, Pernot S, Chaput N, et al. Immunotherapy in advanced gastric cancer, is it the future? Crit Rev Oncol Hematol. 2019;133:25–32. doi:10.1016/j.critrevonc.2018.10.007
53. Kamath SD, Kalyan A, Benson AB
54. Petitprez F, Meylan M, de Reyniès A, et al. The tumor microenvironment in the response to immune checkpoint blockade therapies. Front Immunol. 2020;11:784. doi:10.3389/fimmu.2020.00784
55. Lin Y, Xu J, Lan H. Tumor-associated macrophages in tumor metastasis: biological roles and clinical therapeutic applications. J Hematol Oncol. 2019;12:76. doi:10.1186/s13045-019-0760-3
56. Li W, Zhang X, Wu F, et al. Gastric cancer-derived mesenchymal stromal cells trigger M2 macrophage polarization that promotes metastasis and EMT in gastric cancer. Cell Death Dis. 2019;10:918. doi:10.1038/s41419-019-2131-y
57. Kulis M, Esteller M. DNA methylation and cancer. Adv Genet. 2010;70:27–56.
58. Alexandrov LB, Nik-Zainal S, Wedge DC, et al. Signatures of mutational processes in human cancer. Nature. 2013;500:415–421. doi:10.1038/nature12477
 © 2021 The Author(s). This work is published and licensed by Dove Medical Press Limited. The
full terms of this license are available at https://www.dovepress.com/terms
and incorporate the Creative Commons Attribution
- Non Commercial (unported, 3.0) License.
By accessing the work you hereby accept the Terms. Non-commercial uses of the work are permitted
without any further permission from Dove Medical Press Limited, provided the work is properly
attributed. For permission for commercial use of this work, please see paragraphs 4.2 and 5 of our Terms.
© 2021 The Author(s). This work is published and licensed by Dove Medical Press Limited. The
full terms of this license are available at https://www.dovepress.com/terms
and incorporate the Creative Commons Attribution
- Non Commercial (unported, 3.0) License.
By accessing the work you hereby accept the Terms. Non-commercial uses of the work are permitted
without any further permission from Dove Medical Press Limited, provided the work is properly
attributed. For permission for commercial use of this work, please see paragraphs 4.2 and 5 of our Terms.