Back to Journals » Cancer Management and Research » Volume 10
Prognostic value of inflammation-based prognostic index in patients with nasopharyngeal carcinoma: a propensity score matching study
Authors Oei RW, Ye L, Kong F, Du C, Zhai R, Xu T, Shen C, Wang X, He X ![]() , Kong L, Hu C, Ying H
, Kong L, Hu C, Ying H ![]()
Received 16 April 2018
Accepted for publication 27 May 2018
Published 17 August 2018 Volume 2018:10 Pages 2785—2797
DOI https://doi.org/10.2147/CMAR.S171239
Checked for plagiarism Yes
Review by Single anonymous peer review
Peer reviewer comments 2
Editor who approved publication: Dr Antonella D'Anneo
Ronald Wihal Oei,1,2,* Lulu Ye,1,2,* Fangfang Kong,1,2 Chengrun Du,1,2 Ruiping Zhai,1,2 Tingting Xu,1,2 Chunying Shen,1,2 Xiaoshen Wang,1,2 Xiayun He,1,2 Lin Kong,1,2 Chaosu Hu,1,2 Hongmei Ying1,2
1Department of Radiation Oncology, Fudan University Shanghai Cancer Center, Shanghai, People’s Republic of China; 2Department of Oncology, Shanghai Medical College, Shanghai, People’s Republic of China
*These authors contributed equally to this work
Purpose: The aim of this article is to investigate the significance of pretreatment prognostic nutritional index (PNI), systemic immune-inflammation index (SII), and their combination in nasopharyngeal carcinoma (NPC) patients receiving intensity-modulated radiotherapy (IMRT).
Materials and methods: A total of 585 patients were included. PNI and SII were calculated within 2 weeks prior to treatment. The optimal cutoff points were determined based on receiver operating characteristics curve analysis. The correlation between variables was analyzed. Kaplan–Meier method and Cox proportional hazards model were performed to evaluate the impact of both indices on overall survival (OS), progression-free survival (PFS) and distant metastasis-free survival (DMFS). Further propensity score matching (PSM) was carried out to minimize the effects of confounders.
Results: The optimal cutoff point of 53.0 for PNI and 527.20 for SII were selected. Pearson correlation coefficient showed an inverse correlation between PNI and SII (r = –0.232, P < 0.001). Multivariate analysis demonstrated that pretreatment PNI was an independent prognostic factor for OS (P = 0.047) and DMFS (P = 0.002) while pretreatment SII was an independent prognostic factor for OS (P = 0.003), PFS (P = 0.002), and DMFS (P = 0.002). After PSM, both parameters remained as independent prognosticators of survival. Additional prognostic value was observed in the combined use of PNI and SII.
Conclusion: Pretreatment PNI and SII are promising indicators of survival in NPC patients undergoing IMRT. They can be utilized to refine current TNM staging system in predicting prognosis and developing an individualized treatment in these patients.
Keywords: prognostic nutritional index, systemic immune-inflammation index, nasopharyngeal carcinoma, intensity-modulated radiotherapy, prognostic factor, survival
Introduction
Nasopharyngeal carcinoma (NPC) is a malignancy arising from the epithelium of nasopharynx. It differs from other head and neck cancer due to its unique pathology, epidemiology, and clinical attributes. Despite being rare globally, NPC is prevalent in South China and Southeast Asia, with the incidence rate of 6.4 and 4.7 per 100,000 people in Southeast Asia and China, respectively.1,2 Due to its proximity to the skull base and high chemoradiosensitivity, radiotherapy, with or without chemotherapy, is regarded to be the primary treatment for nondisseminated NPC.
In recent years, important breakthroughs in diagnostic imaging, radiotherapy technique, and chemotherapy regimens have significantly improved the treatment outcome of NPC. Especially, intensity-modulated radiotherapy (IMRT) has gradually become the primary technique of radiotherapy. Compared to two-dimensional conventional radiotherapy, it has yielded better locoregional control, but no significant improvement is found in the rate of distant metastasis.3–5 Moreover, the current TNM staging system, which is the most commonly used parameters in treatment decision and predicting treatment outcomes for NPC patients, does not take the biological variety of the tumor into account.6 This results in heterogeneous treatment outcomes in patients with identical TNM staging.6,7 Therefore, identification of an accurate prognosticator is crucial to improve the clinical management of NPC.
There has been increasing evidence that systemic inflammation plays a crucial role in development and progression of cancer, including proliferation and survival of cancer cells, angiogenesis, tumor metastasis, and reducing responses to anticancer agents.8,9 Recently, several hematological markers indicating systemic inflammatory responses have been found to be significantly associated with poor prognosis in patients with various malignancies, including lactate dehydrogenase; neutrophil to lymphocyte ratio (NLR); platelet to lymphocyte ratio (PLR); a combination of albumin and lymphocyte count as prognostic nutritional index (PNI); and a combination of neutrophil, platelet, and lymphocyte count as systemic immune-inflammation index (SII).10–13 Among these, PNI and SII are two novel systemic inflammation-based prognostic score. To the best of our knowledge, the impact of PNI and SII on mortality in NPC have been rarely investigated.14–17 Moreover, the correlation and combined prognostic value of these indices on these patients has not yet been addressed.
A total of 585 nonmetastatic NPC patients undergoing IMRT with or without chemotherapy were included in this retrospective study. The objective of our study was to evaluate the prognostic significance of pretreatment PNI and SII in these patients. In addition, in order to overcome selection bias and reduce the effects of confounders, we performed propensity score matching (PSM) analysis to evaluate the true impact of both indices on the prognosis of patients. We further investigated the combined prognostic value of these indices and their correlation, which aimed to enhance the survival prediction and promote development of individualized treatment approach for NPC patients receiving IMRT.
Materials and methods
Study cohort
This retrospective study was approved by the Institutional Review Board of Fudan University Shanghai Cancer Center and conducted in accordance with institutional policy and the principles of Declaration of Helsinki and its amendments. Due to retrospective nature of the study, which only the clinical databases were studied and very small risks to the patients involved, we requested and were granted a waiver of written informed consent from the institutional review board. Nevertheless, patient confidentiality was maintained by anonymizing patient data to remove any identifying information.
Between January 2010 and December 2013, the medical records of 585 newly diagnosed NPC patients receiving definitive IMRT-based therapy at Fudan University Shanghai Cancer Center were reviewed. The inclusion criteria were 1) aged ≥16; 2) pathological evidence of non-keratinizing and/or undifferentiated NPC (World Health Organization type II/III); 3) Karnofsky performance status scale ≥80; 4) no radiological evidence of distant metastasis and concomitant tumors at diagnosis; 5) no prior malignancies and history of anticancer therapy; 6) sufficient liver (total bilirubin and alanine aminotransferase level ≤1.5× the normal limit) and renal (creatinine level ≤1.5× the normal limit) function; 7) completion of prescribed treatment; 8) complete data of hematological and biochemical parameters, including serum albumin level, neutrophil, platelet, and lymphocyte count.
Pretreatment workup and data collection
All patients completed a full pretreatment evaluation, including patient history; routine physical examination; contrast-enhanced MRI or computed tomography (CT) scan of nasopharynx and neck, chest radiography, abdominal ultrasonography; a whole-body bone scan using single-photon emission CT; complete blood count; and serum biochemistry profile. Clinical stage of the patients was classified according to the seventh edition of American Joint Committee on Cancer (AJCC) staging system.
Peripheral fasting blood sample was taken through a venipuncture to the median cubital vein to assess the pretreatment serum albumin level and complete blood count. It was obtained within 2 weeks prior to treatment. Serum albumin level was determined using chemistry analyzer cobas 8000 (Roche, Basel, Switzerland), while complete blood count was measured using automated hematology analyzer Sysmex XT-4000i (Sysmex, Kobe, Japan). PNI was defined as follows: serum albumin level (g/L) + 5 × total lymphocyte count (109/L), whereas SII was calculated using the following formula: total platelet count (109/L) × total neutrophil count (109/L) ÷ total lymphocyte count (109/L).
Treatment protocol
Treatment strategy was determined using our institution guidelines depending on clinical stage and general condition of each patient. Based on standardized treatment of our institution, radiotherapy alone was suggested for patients with stage I, whereas combined chemoradiotherapy was prescribed for those with stage II and above. In detail, concurrent chemoradiotherapy was recommended for patients with stage II and either concurrent chemoradiotherapy or neoadjuvant + adjuvant chemotherapy for those with stage III or IV disease. However, chemotherapy was not administered to patients with following conditions: 1) aged ≥70; 2) one or more comorbidities, including without limitation low blood counts and active tuberculosis.
All patients underwent radical IMRT and finished the prescribed radiotherapy as scheduled. The total prescribed dose was 66–70.4 Gy to the planning target volume (PTV) of the gross tumor volume of nasopharynx (GTVnx), 66–70 Gy to the PTV of the gross tumor volume of positive neck lymph nodes (GTVnd), 60 Gy to the PTV of the high-risk sites of microscopic extension defined as clinical target volume 1 (CTV1), and 54 Gy to the PTV of the low-risk sites of microscopic extension defined as clinical target volume 2 (CTV2). PTVs were delineated by adding 5 mm and 3 mm to GTV and CTV, respectively. The radiation was prescribed in a fractionated dose of 2 to 2.2 Gy, 1 fraction per day, 5 days per week.
The regimens administered for neoadjuvant and adjuvant chemotherapy were mainly: 1) TPF regimen: docetaxel 60 mg/m2/day on day 1 + cisplatin 25 mg/m2/day on day 1–3 + 5-fluorouracil 0.5 g/m2/day on day 1–3, 2) TP regimen: docetaxel 60 mg/m2/day on day 1 + cisplatin 25 mg/m2/day on day 1–3, 3) GP regimen: gemcitabine 1 g/m2/day on day 1 and 8 + cisplatin 25 mg/m2/day on day 1–3. TPF and TP regimens were the first-line chemotherapy regimens. However, GP regimen was chosen if patients had following medical history: peptic ulcer, gastrointestinal tract bleeding, cardiac disease, diabetes, and food or drug allergy. Neoadjuvant and adjuvant chemotherapy were administered every 3 weeks for two to three cycles. Besides, concurrent chemotherapy consisted of cisplatin 80 mg/m2 every 3 weeks or 30 mg/m2 on weekly basis.
Follow-up and clinical endpoints
After completion of treatment, patients returned for follow-up appointments at our outpatient clinic at 3-month intervals during the first 2 years, every 6 months between the third to fifth year, and annually thereafter. A complete physical examination, including indirect nasopharyngeal speculum and palpation of neck lump examination, was performed at each clinic visit. In addition, contrast-enhanced MRI of nasopharynx, chest radiography, and abdominal ultrasonography were performed at 6-month intervals during the first 5 years and annually thereafter. Further investigations would be arranged if any sign of locoregional recurrence or distant metastasis were detected. Patients with confirmation of locoregional or distant failures would be treated according to their medical conditions.
The primary outcome of this study was overall survival (OS), while the secondary outcomes were progression-free survival (PFS) and distant metastasis-free survival (DMFS). OS was defined as the time that had elapsed between the initial treatment time and death from any cause. PFS was defined as the time interval between initial treatment and the date of disease progression or death from any cause. DMFS was defined as the elapsed time between initial treatment date and the first appearance of distant failure.
Statistical analysis
The Statistical Packages for Social Sciences version 22.0 (IBM, Armonk, NY) was used for all statistical analysis. Receiver operating characteristics (ROC) curve was performed to determine the most appropriate threshold value for PNI and SII. χ2 test (or Fisher’s exact test, if indicated) was used to explore the baseline balance between low PNI/SII and high PNI/SII groups. Correlation between variables was assessed using Pearson correlation coefficient. Actuarial rates for OS, PFS, and DMFS were generated using Kaplan–Meier method. Furthermore, differences between curves were analyzed with log-rank test. Univariate and multivariate analysis were calculated using Cox proportional hazards model (multivariate analysis consisted of variables with P value < 0.05 in univariate analysis). Proportional hazard assumption was explored using log-minus-log plots. A two-tailed P value < 0.05 was considered statistically significant.
In addition, PSM and correlogram was done using R version 3.4.0 (The R Foundation of Statistical Computing, Vienna, Austria). PSM was carried out using nearest neighbor 1-to-1 matching in MatchIt package and correlogram was created using corrplot package.
Results
Patient characteristics and follow-up
Clinical features of 585 NPC patients reviewed are provided in Table 1. The majority of the patients were male (71.8%). The median age was 49 years old and ranged from 17 to 82 years old. Based on the 7th edition of AJCC staging system, 2.1% of the patients had stage I, 18.5% stage II, 45.0% stage III, while 34.5% had stage IV disease. Among them, 84.8% of the patients received combined chemoradiotherapy. Additionally, the median value of PNI and SII were 53.3 (range: 38.3–69.8) and 475.20 (range: 119.3–4000).
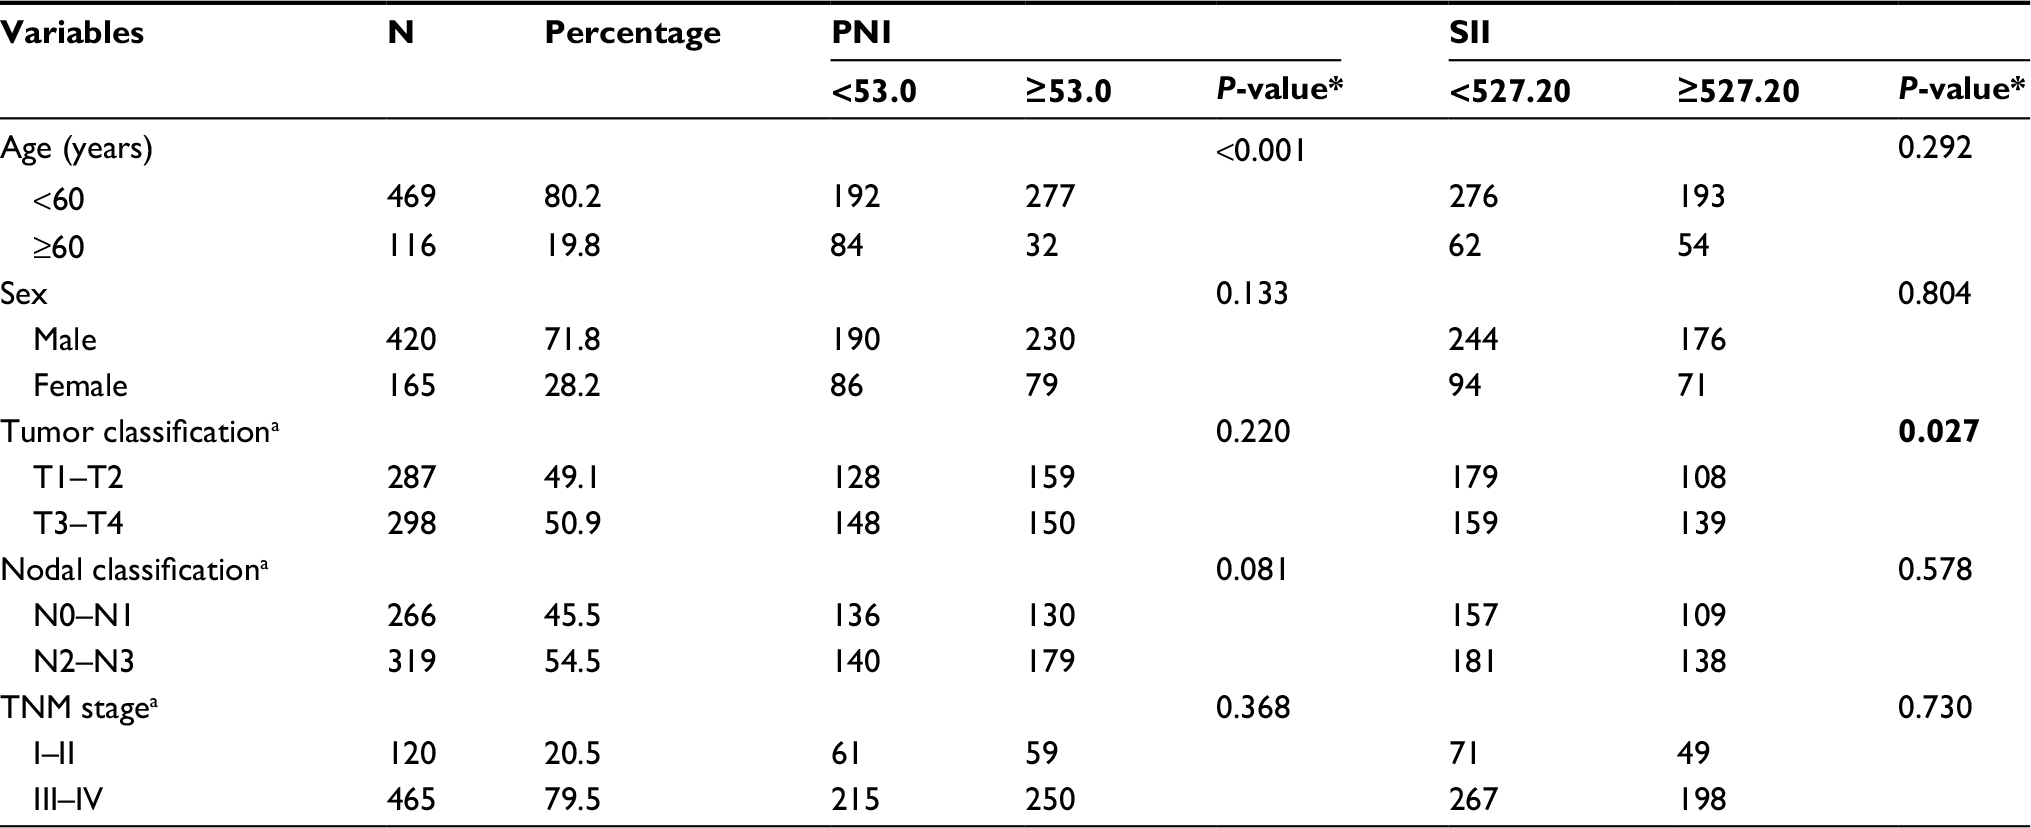 | Table 1 Association of PNI and SII with clinical characteristics in the study cohort Notes: Bolding shows P value < 0.05. *Chi-square (χ2) test, P < 0.05. aTNM staging system according to the American Joint Committee on Cancer (7th edition). Abbreviations: PNI, prognostic nutritional index; SII, systemic immune-inflammation index. |
In general, the median follow-up time was 63.3 months, which ranged from 4.8 to 86.4 months. Throughout the time, 12.5% of the patients developed locoregional recurrence, 13.5% experienced distant metastasis, and 14.5% patients were dead. The 5-year OS, PFS, and DMFS were 85.6%, 75.9%, and 86.1%, respectively.
ROC curve analysis
ROC curve analysis was performed to evaluate the optimal cutoff value of PNI and SII for mortality (Figure 1). The area under the curve were 0.597 (95% CI: 0.535–0.659, P = 0.004) and 0.618 (95% CI: 0.553–0.682, P = 0.001) for PNI and SII, respectively. A cutoff value of 53.0 (sensitivity: 63.5%, specificity: 55.6%) was chosen for PNI, while a threshold value of 527.20 (sensitivity: 60.0%, specificity: 60.8%) was selected for SII.
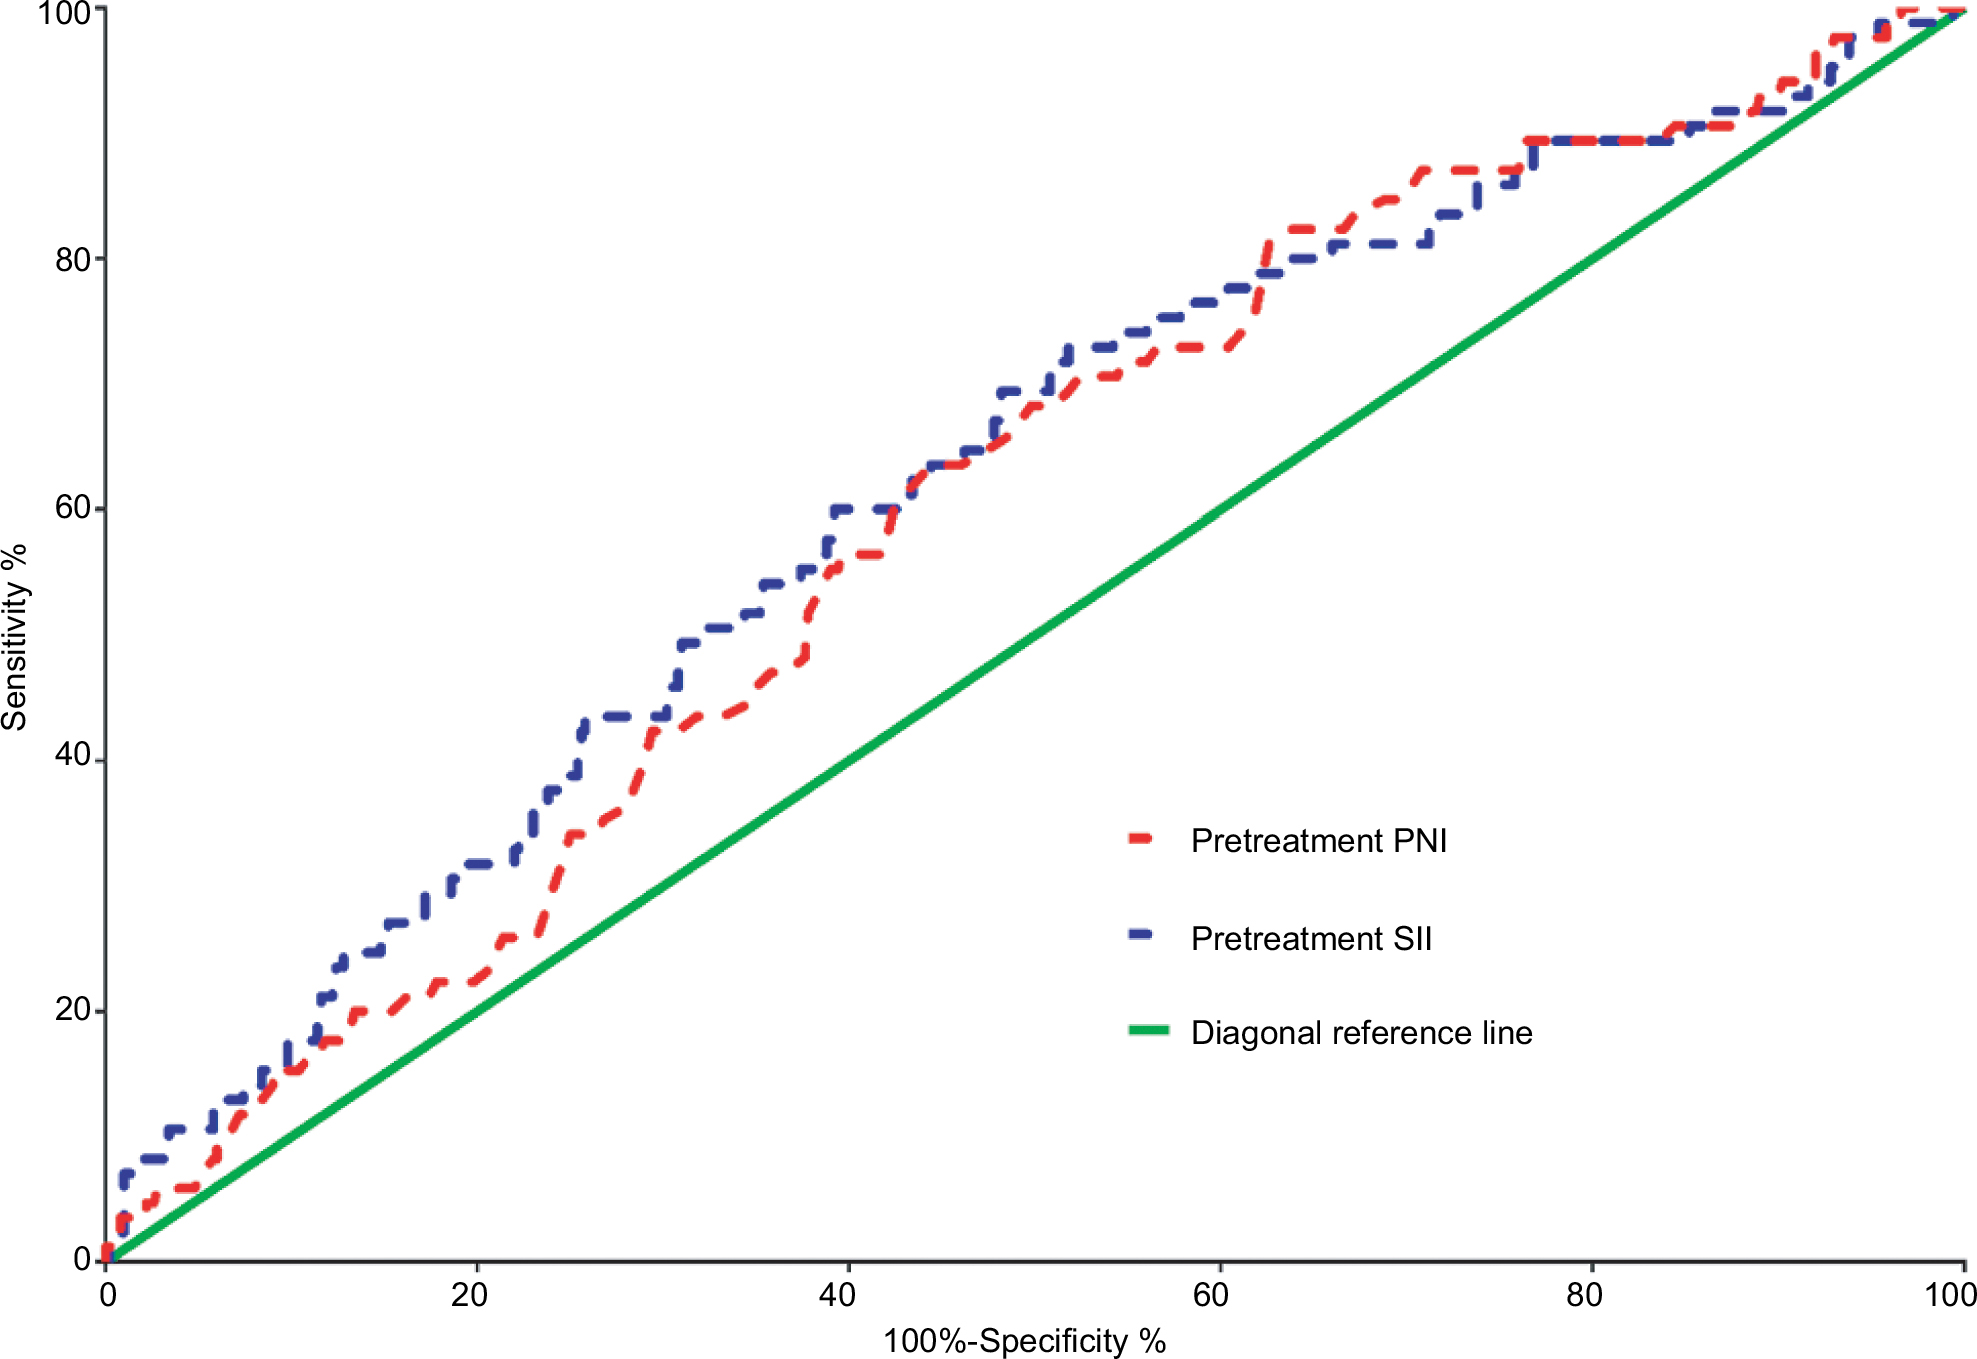 | Figure 1 Receiver operating characteristic curves for pretreatment PNI and SII based on OS. Abbreviations: OS, overall survival; PNI, prognostic nutritional index; SII, systemic immune-inflammation index. |
Association between PNI/SII and clinical features of the patients
Baseline characteristics of each PNI and SII group together with the comparisons between groups are shown in Table 1. There was a higher proportion of older patients with low PNI (<53.0). Besides, patients with high SII (≥527.20) had significantly more advanced T classification.
A correlogram provided in Figure S1 indicates the correlation between variables. There was an inverse correlation between PNI and SII. A scatter plot showed that the correlation between PNI and SII could be modelled as a linear (Figure S2). Although the correlation was weak, the correlation level still reached statistical significance (r = –0.232, P < 0.001).
Univariate analysis
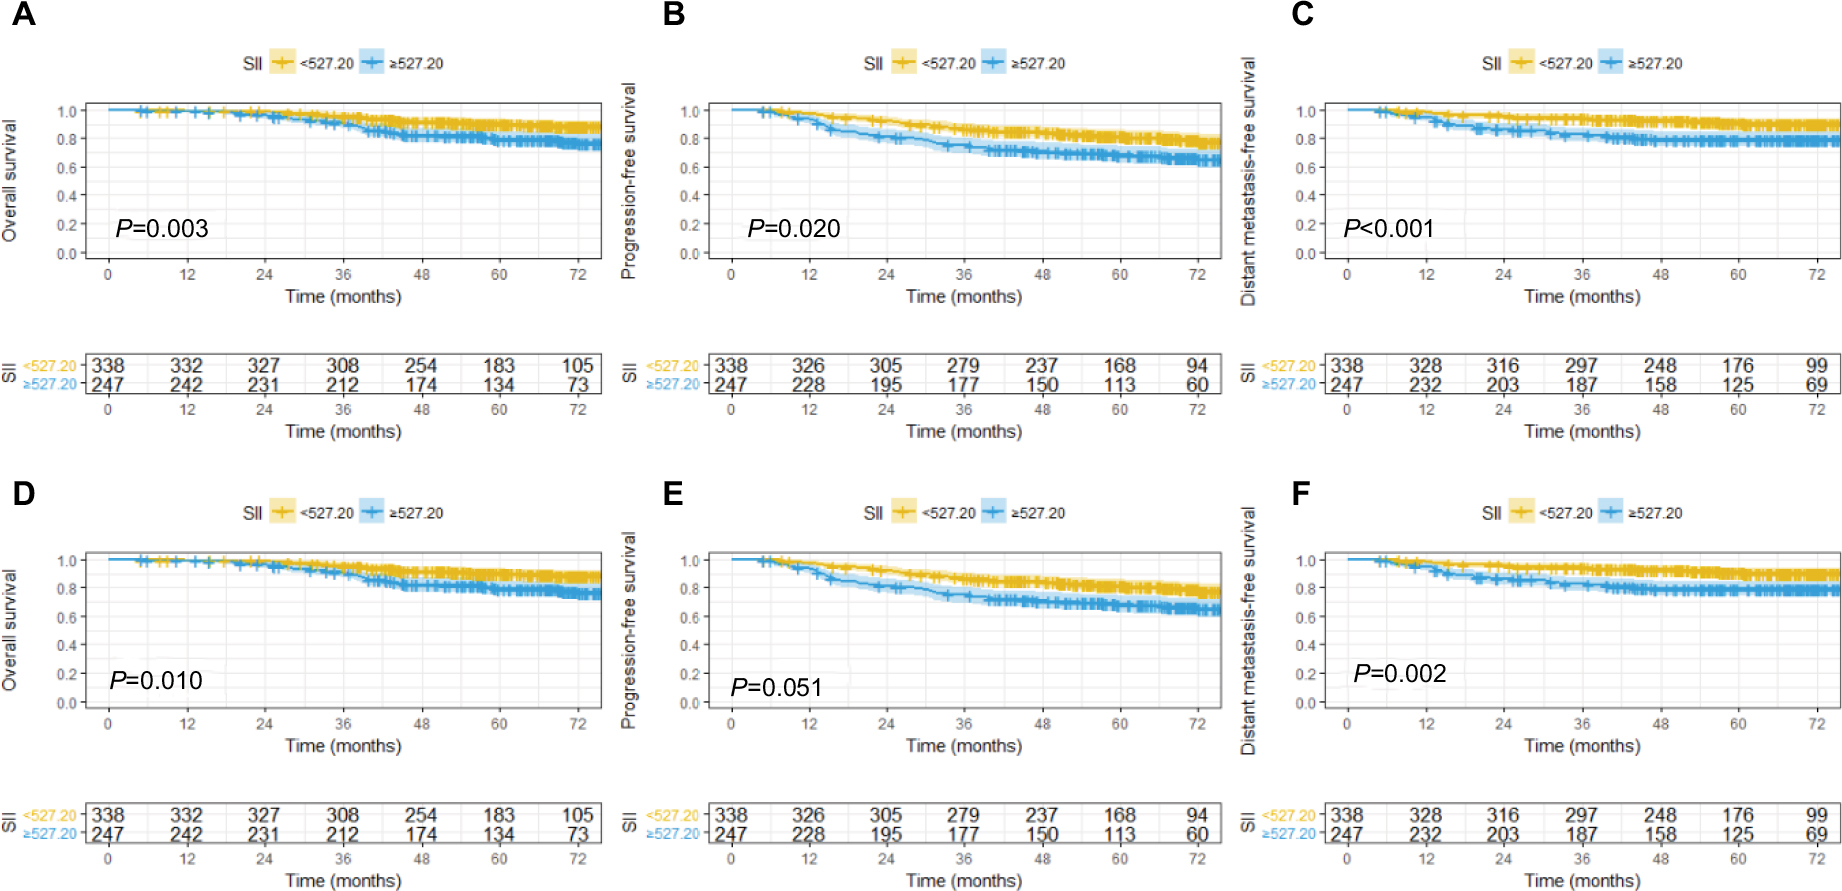
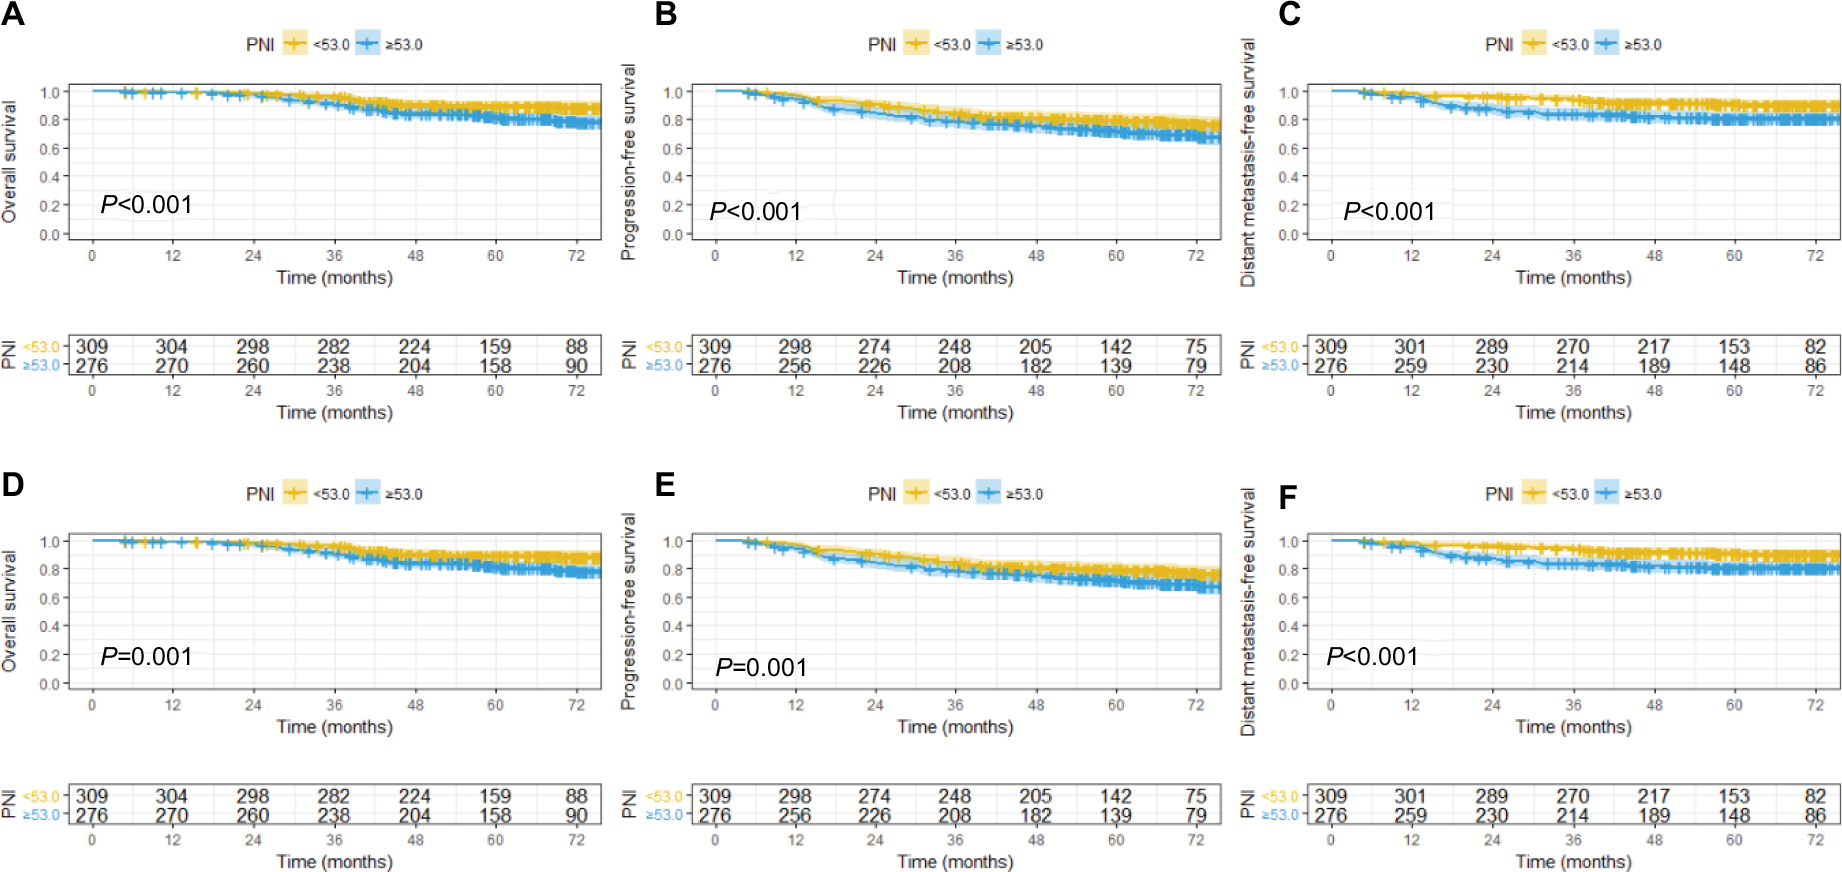
According to the optimal cutoff value of PNI, there were 276 patients (47.2%) in low PNI group and 309 patients (52.8%) in high PNI group. On the other hand, according to the best threshold value of SII, there were 338 patients (57.8%) in low SII group and 247 patients (42.2%) in high SII group. In terms of PNI, survival comparisons between the two groups showed that the patients with low PNI had inferior OS (5-year OS: 81.5% versus 89.4%, P = 0.003), PFS (5-year PFS: 71.9% versus 79.6%, P = 0.020), and DMFS (5-year DMFS: 80.7% versus 90.9%, P < 0.001) (Figure 2). With regard to SII, survival comparisons between two groups revealed that the patients with high SII also had poorer OS (5-year OS: 79.3% versus 90.3%, P < 0.001), PFS (5-year PFS: 68.3% versus 81.4%, P < 0.001), and DMFS (5-year DMFS: 79.3% versus 91.0%, P < 0.001) (Figure 3).
 | Figure 2 Kaplan–Meier survival curves of OS, PFS, and DMFS classified into two groups according to PNI before (A–C) and after (D–F) PSM. Log-rank test, P < 0.05. Abbreviations: DMFS, distant metastasis–free survival; OS, overall survival; PFS, progression–free survival; PNI, prognostic nutritional index; PSM, propensity score matching. |
 | Figure 3 Kaplan–Meier survival curves of OS, PFS, and DMFS classified into two groups according to SII before (A–C) and after (D–F) PSM. Log-rank test, P < 0.05. Abbreviations: DMFS, distant metastasis–free survival; OS, overall survival; PFS, progression–free survival; PSM, propensity score matching; SII, systemic immune-inflammation index. |
Cox univariate analysis showed that both low PNI and high SII were significantly associated with worse OS, PFS, and DMFS (Table 2). The HR of low PNI (<53.0 versus ≥53.0) on decreased OS, PFS, and DMFS were 1.943 (95% CI: 1.249–3.024, P = 0.003), 1.472 (95% CI: 1.061–2.042, P = 0.021) and 2.272 (95% CI: 1.427–3.617, P = 0.001), respectively. Moreover, the HR of high SII (≥527.20 versus <527.20) on inferior OS, PFS, and DMFS were 2.139 (95% CI: 1.386–3.302, P = 0.001), 1.879 (95% CI: 1.356–2.605, P < 0.001), and 2.558 (95% CI: 1.619–4.042, P < 0.001).
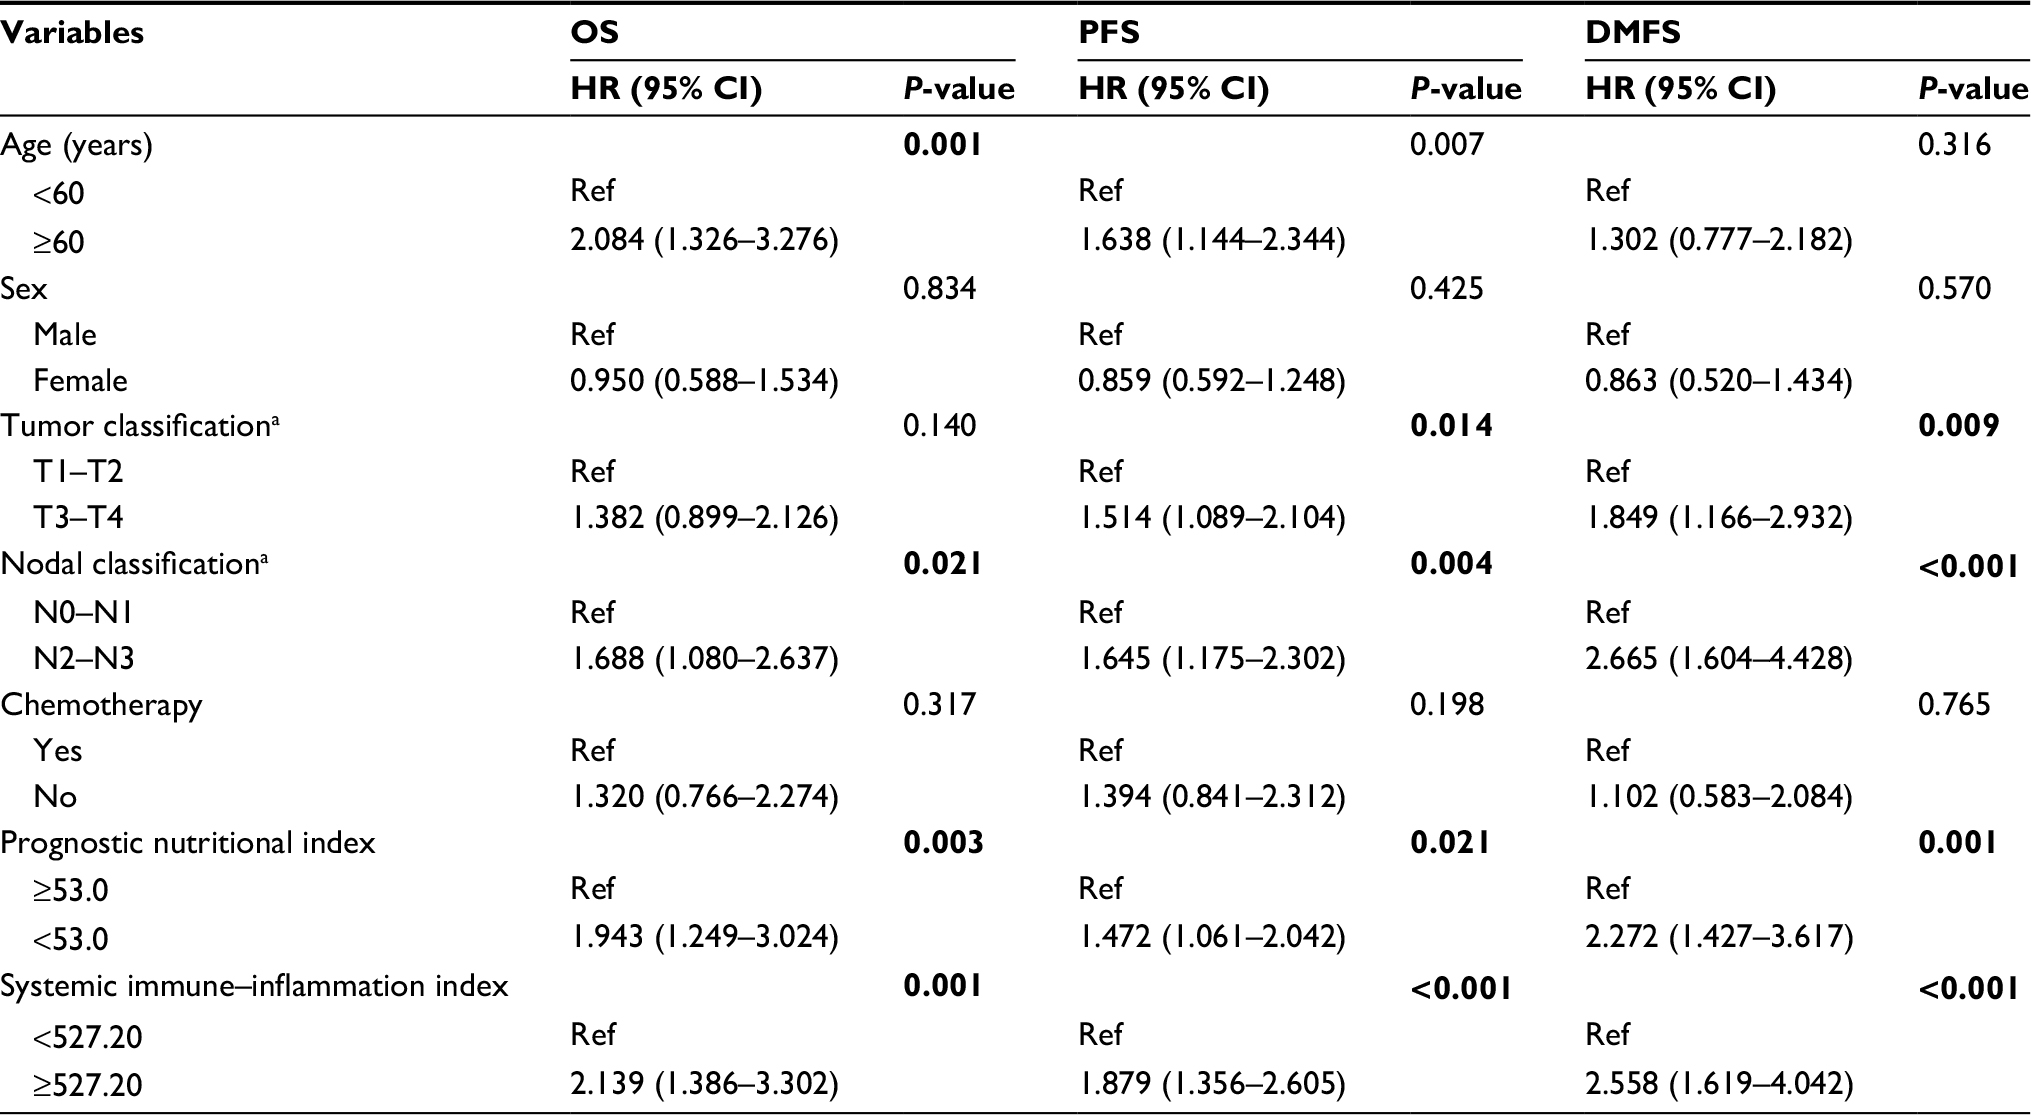 | Table 2 Univariate Cox regression analysis of potential factors affecting OS, PFS, and DMFS Notes: Bolding shows P value < 0.05. aTNM staging system according to the American Joint Committee on Cancer (7th edition). Abbreviations: DMFS, distant metastasis–free survival; OS, overall survival; PFS, progression–free survival; Ref, reference. |
Multivariate analysis
All variables that reached statistical significance were included in multivariate Cox proportional hazards regression analysis. The complete result of the analysis is provided in Table 3. PNI was found to be an independent prognostic factor for OS (HR: 1.602, 95% CI: 1.006–2.549, P = 0.047) and DMFS (HR: 2.134, 95% CI: 1.332–3.421, P = 0.002). On the other hand, high SII was independently correlated with poor OS (HR: 1.950, 95% CI: 1.256–3.028, P = 0.003), PFS (HR: 1.706, 95% CI: 1.223–2.379, P = 0.002), and DMFS (HR: 2.089, 95% CI: 1.310–3.331, P = 0.002). Apart from that, following variables were also confirmed as independent prognostic factors: age (P = 0.009) and nodal classification (P = 0.008) for OS; age (P = 0.025), tumor classification (P = 0.017), and nodal classification (P = 0.001) for PFS; tumor classification (P = 0.014) and nodal classification (P < 0.001) for DMFS.
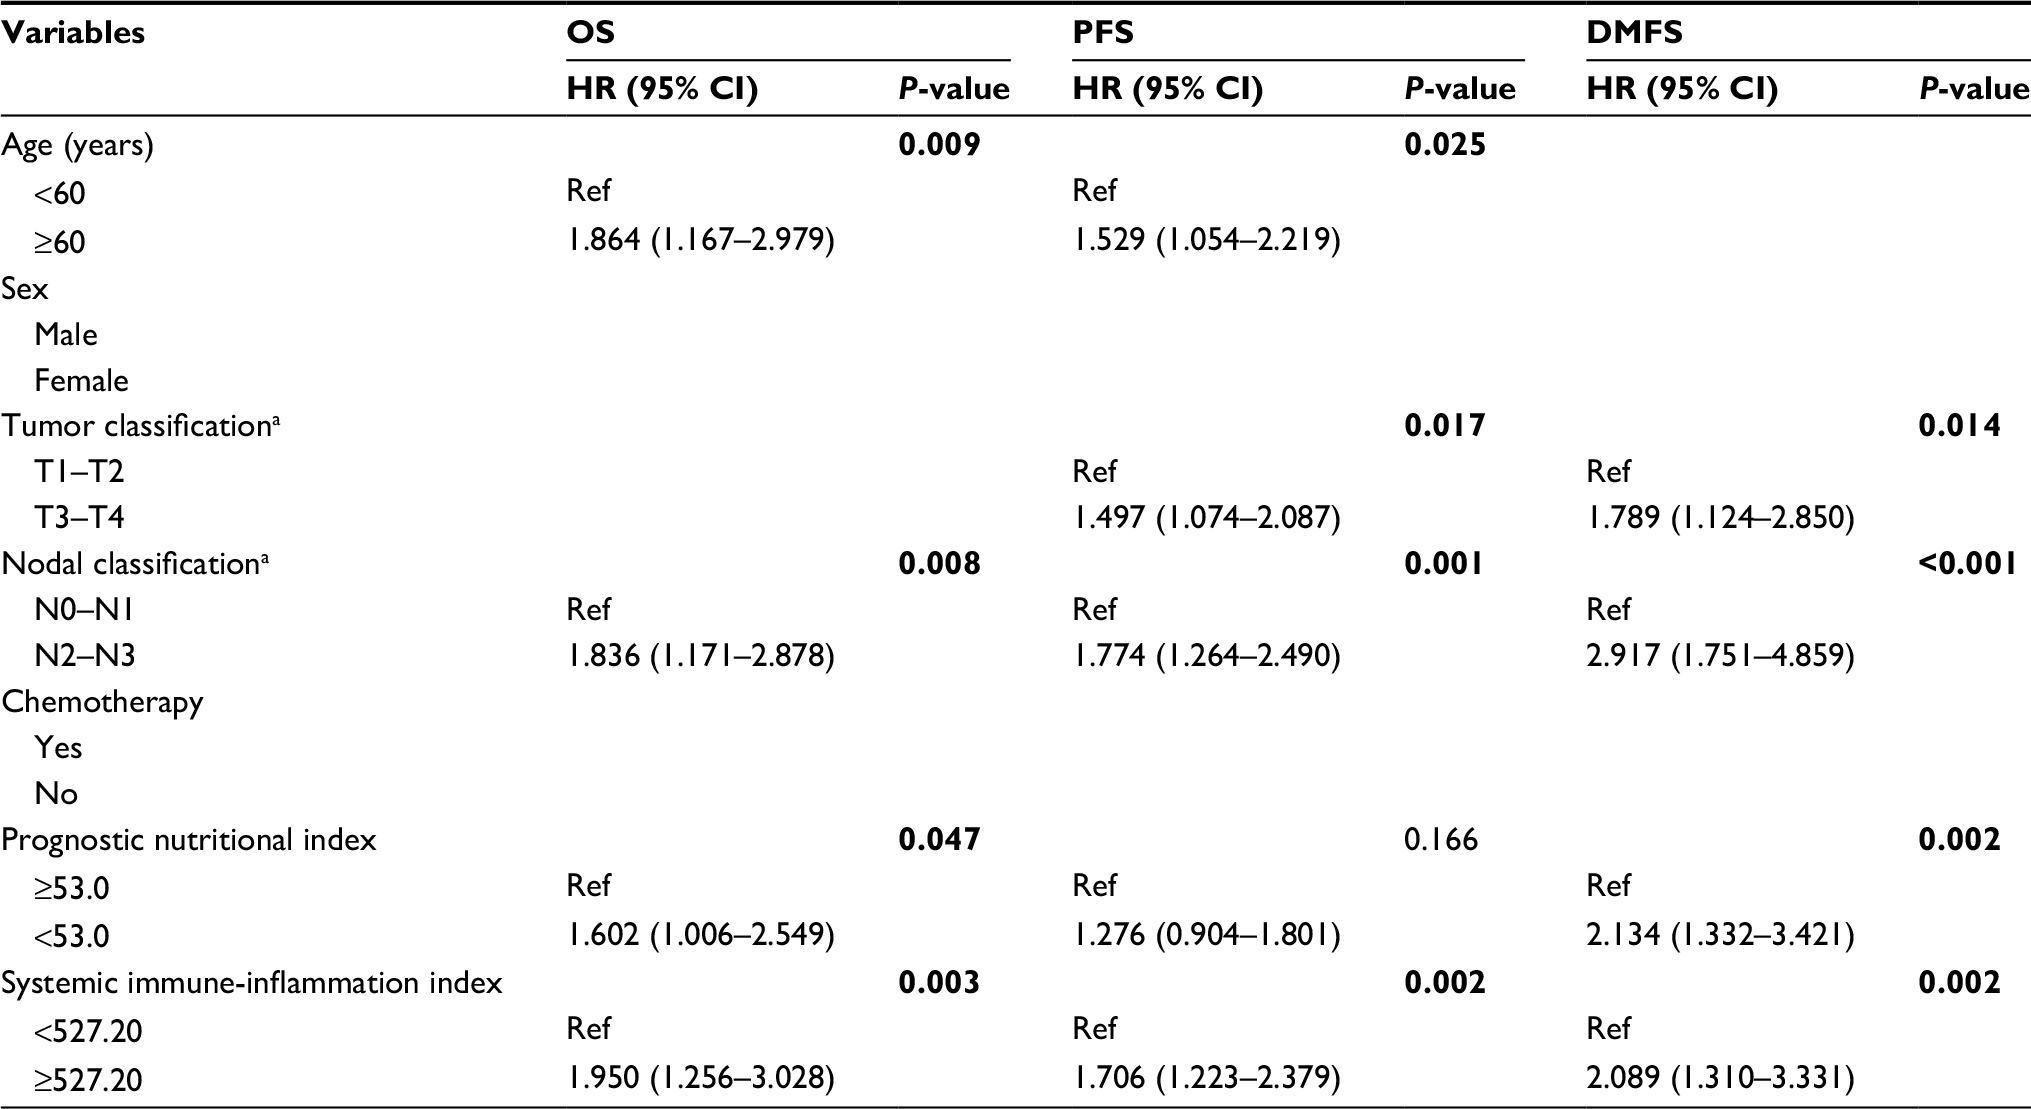 | Table 3 Multivariate Cox regression analysis of potential factors affecting OS, PFS, and DMFS Notes: Bolding shows P value < 0.05. aTNM staging system according to the American Joint Committee on Cancer (7th edition). Abbreviations: DMFS, distant metastasis–free survival; OS, overall survival; PFS, progression–free survival; Ref, reference. |
PSM analysis
Due to the disparity in the baseline characteristics between subgroups, PSM was performed to assemble a balanced study cohort that balanced on following variables: age, sex, T classification, N classification, TNM stage, and radiation dose. After PSM, the new patient cohorts consisted of 276 pairs for PNI group and 247 pairs for SII group. The distribution of propensity scores before and after matching can be seen in Figure S3. The distribution on the left differed significantly, while the distribution after matching on the right was quite similar.
Kaplan–Meier analysis after PSM showed that low PNI still remained as the risk factor for predicting poor OS (5-year OS: 81.5% versus 88.5%, P = 0.010) and DMFS (5-year DMFS: 80.7% versus 90.1%, P = 0.002) but not for poor PFS, which just was very close to being statistically significant (5-year PFS: 71.9% versus 78.6%, P = 0.051). Similarly, high SII was still significantly associated with worse OS (5-year OS: 79.3% versus 91.1%, P = 0.001), PFS (5-year PFS: 68.3% versus 80.7%, P = 0.001), and DMFS (5-year DMFS: 79.3% versus 90.1%, P < 0.001). The unadjusted and adjusted Cox regression analysis were summarized in Table 4. The adjusted Cox regression analysis revealed that low PNI was still independently associated with poor OS (HR: 1.658, 95% CI: 1.047–2.626, P = 0.031) and DMFS (HR: 2.225, 95% CI: 1.375–3.599, P = 0.001). It also showed that high SII was still an independent prognosticator for worse OS (HR: 2.195, 95% CI: 1.350–3.569, P = 0.002), PFS (HR: 1.790, 95% CI: 1.255–2.553, P = 0.001), and DMFS (HR: 2.279, 95% CI: 1.389–3.737, P = 0.001).
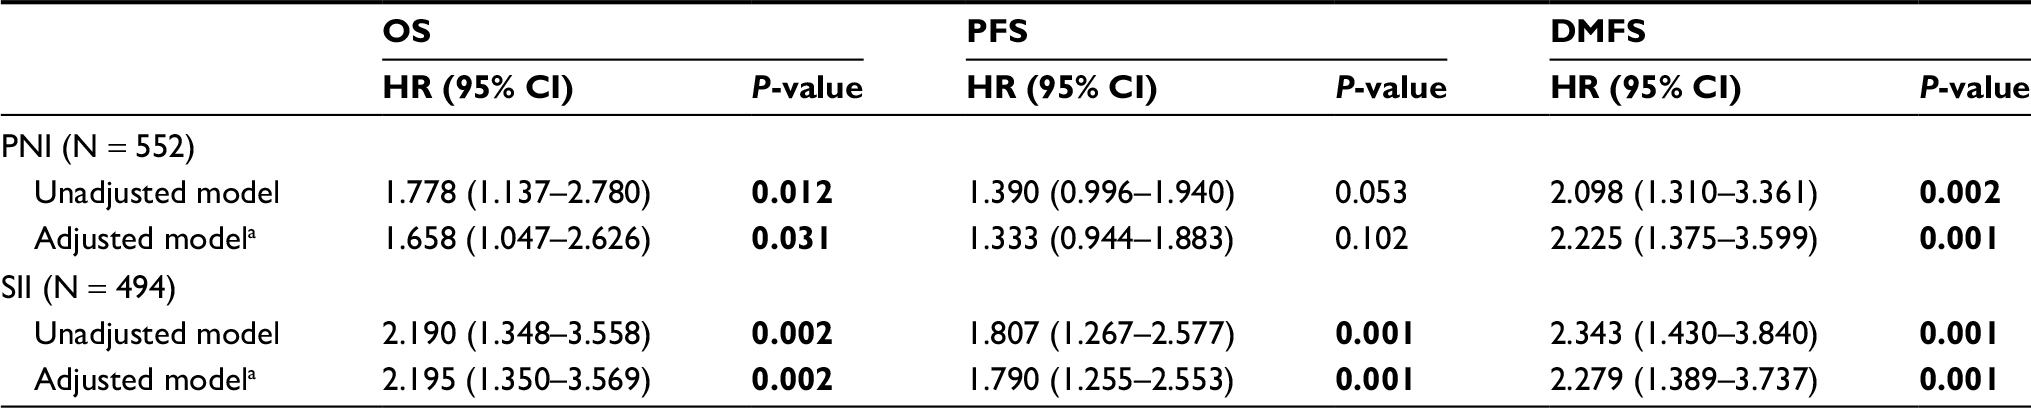 | Table 4 Cox regression analysis of the association between PNI, SII, and survival after PSM Notes: Bolding shows P value < 0.05. aAdjusted for sex (male versus female), age (<60 years versus ≥60 years), tumor classification (T1–T2 versus T3–T4), nodal classification (N0–N1 versus N2–N3), and radiotherapy dose (continuous variable). Abbreviations: DMFS, distant metastasis–free survival; OS, overall survival; PFS, progression–free survival; PNI, prognostic nutritional index; PSM, propensity score matching; Ref, reference; SII, systemic immune-inflammation index. |
Combined prognostic value of PNI and SII
The combined prognostic value of PNI and SII was assessed by dividing the patients into the following three groups: high PNI–low SII group defined as group 1, low PNI–low SII, or high PNI–high SII group defined as group 2 and low PNI–high SII group defined as group 3. The number of patients in each group were 204 (34.9%), 239 (40.9%), and 142 (24.3%).
The data showed that group 1 had the best OS in comparison with group 2 and group 3 (5-year OS: 93.0%, 84.6%, and 76.9%, respectively, P < 0.001) (Figure 4A). Similarly, the 5-year PFS was also significantly higher in group 1 than group 2 and group 3 (81.5%, 78.7%, 63.0%, respectively, P < 0.001) (Figure 4B). Moreover, the 5-year DMFS was also remarkably better in group 1 compared to other two groups (93.8%, 85.9%, 74.9%, respectively, P < 0.001) (Figure 4C).
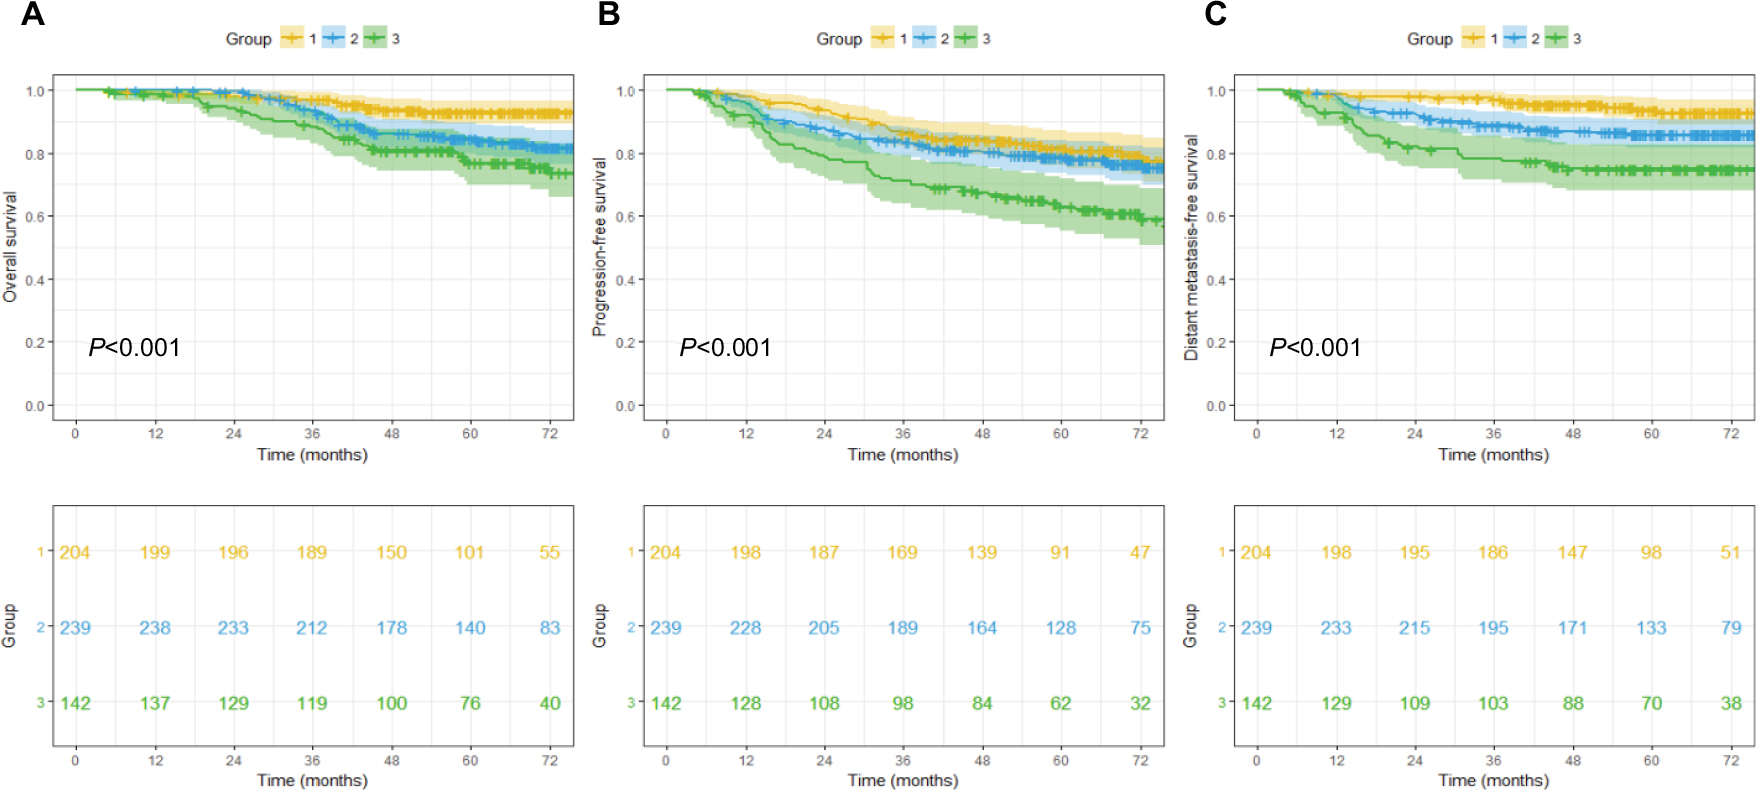 | Figure 4 Kaplan–Meier survival curves of OS (A), PFS (B), and DMFS (C) classified into three groups according to PNI combined with SII. Group 1: PNI ≥53.0 SII <527.20, Group 2: PNI <53.0 SII <527.20 or PNI ≥53.0 SII ≥527.20, Group 3: PNI <53.0 SII ≥527.20. Log-rank test, P < 0.05. Abbreviations: DMFS, distant metastasis–free survival; OS, overall survival; PFS, progression–free survival; PNI, prognostic nutritional index; SII, systemic immune-inflammation index. |
Discussion
In recent years, the management of NPC has yielded significant improvement due to several breakthroughs in diagnostic and therapeutic interventions, together with novel technologies. Since IMRT has become the primary radiation technique for NPC, the major reason of treatment failure has been identified as distant metastasis.18 This may result in incapability of the current TNM staging system, which indicates the scope of the tumor, to identify different population at risk precisely.6 Therefore, identification of other prognostic factors is crucial to perfect the current TNM staging system and optimize the treatment strategies in these patients.
Inflammation has been known as a hallmark of cancer.19 The distinctive feature of cancer-related inflammation includes the presence of inflammatory cells and mediators in tumor mass, tissue remodeling, and angiogenesis.9 The association between inflammation and cancer can be explained by two pathways, which are intrinsic and extrinsic pathway.9,20 Intrinsic inflammatory pathway is driven by genetic events that result in neoplasia and inflammation, while extrinsic inflammation pathway is directed by inflammatory status that increases or even initiates cancer in some cases.20 Both pathways converge, initiating the activation of several transcription factors in cancer cells and subsequently in inflammatory cells, these transcription factors such as nuclear factor-κB, signal transducer, and activator of transcription 3 and hypoxia-inducible factor 1α (HIF-1α).9 These transcription factors promote recruitment inflammatory cells, such as neutrophil and macrophage, and also leads to the production of important inflammatory mediators, including chemokines and cytokines.9 All these events support the formation of cancer-related inflammatory microenvironment and promotes cancer proliferation, subversion of adaptive immunity, and desensitization to anticancer agents.9
PNI, which combines serum albumin and total lymphocyte count, was first proposed by Onodera et al to assess the risk of postoperative complications of patients undergoing gastrointestinal surgery.21 Afterwards, it was widely used to evaluate the immunological and nutritional status of surgery patients.22,23 Today, PNI has taken a new role as a novel prognostic factor in many types of malignancy, including gastric cancer, renal cancer, and lung cancer.24–26 Low PNI represents a decline in serum albumin and/or total lymphocyte count. Serum albumin is a widely used parameter of nutritional status of patients. Besides, accumulating evidence supported that cancer cachexia, which can be assessed through serum albumin, is a result of systemic inflammatory reaction induced either by the tumor itself or as a host response.27 Systemic inflammation increases the resting energy expenditure and also decreases the skeletal muscle mass through several important cytokines, including tumor necrosis factor-α (TNF- α) and interleukin-6 (IL-6) which mediate proteolysis.28,29 These pathophysiological processes result in gradual weight loss and low serum albumin.30 Furthermore, total lymphocyte count as another part of PNI plays a critical role in the host immune response, which mediates immunologic eradication of cancer cells by secreting cytokines and generating cytotoxic cell death.19 The decreased level of lymphocytes may weaken cancer immune surveillance and defense.9 Thus, apart from its initial function as an indicator of nutritional status of a patient, PNI may take another role as a reflection of systemic inflammation.
On the other hand, SII as an integrated parameter based on total platelet, lymphocyte, and neutrophil count is another systemic inflammation score. It was considered to be more powerful and objective than other indexes, such as NLR and PLR.31 Besides, previous studies reported that cancer patients with high SII might benefit from anti-inflammatory drugs, including esophageal cancer and hepatocellular carcinoma.32,33 Its prognostic values have been reported in hepatocellular carcinoma, esophageal cancer, renal cancer, prostate cancer, and gastric cancer.13,31,34–36 The prognostic role of SII may be explained by the function of its components and relationship with circulating tumor cells (CTCs).37 The role of lymphocytes in cancer development has been mentioned before. Platelets can increase the quantity of CTCs, induce its epithelial–mesenchymal transition and further the extravasation of cancer cells to metastatic sites.37 Meanwhile, neutrophils has different levels of cancer development through the secretion of inflammatory mediators, such as IL-6 and TNF. It promotes cancer cells invasion, proliferation, distant metastasis, and enhances tumor cells to evade immune surveillance.9,38 In addition, increasing evidence showed that both platelets and neutrophils enhance adhesion and seeding to distant sites by secreting vascular endothelial growth factor.39,40 Therefore, a high SII demonstrates intense inflammatory and weaker immune response that favors tumor progression and metastasis.
In the present study, two novel inflammation-based prognostic score, PNI and SII, were shown to be independent prognosticators in NPC patients treated with IMRT-based therapy in terms of OS, PFS, and DMFS. However, we did not observe a significant impact of these indices on locoregional recurrence-free survival (LRFS) (5-year LRFS: 88.5% versus 87.6%, log-rank test: P = 0.766 for PNI; 84.7% versus 90.4%, log-rank test: P = 0.050 for SII; survival curve not shown), which may be explained by significant improvement in the locoregional control since the era of IMRT. In addition, we also found significant correlation between these parameters, however, was weak. An inverse but weak correlation was also observed between PNI and SII. This weak correlation may be because both indices share the same component of total lymphocyte count. Moreover, such weak correlation indicated that both parameters are not substitutable for each other, but rather complement each other, which was further proven by the improved prognostic value through the combination of both indices. In terms of PNI, few studies have investigated the impact of PNI on mortality in these patients.14,16,17 On the other hand, we only found one study that reported the prognostic value of SII in NPC patients to date.15 Although our study showed consistent result, some limitations were identified in these past studies that we believed might impede the reliability of these parameters as prognostic indicators in NPC. Some notable shortcomings were diverse radiotherapy techniques used, limited clinical endpoints adopted, and relatively smaller patient population compared to ours. Therefore, since our study was performed specifically in NPC patients treated with IMRT, with greater number of patients, adoption of several clinical endpoints, and similar baseline characteristics between groups, we provided further confirmation of the prognostic value of PNI and SII in these patients. In addition, our study was the first one to perform PSM, which is a popular method used to overcome potential selection bias and reduce confounders in non-randomized retrospective studies.41 We also found that the prognostic significance of PNI and SII could be greatly expanded by the combination of them, which to our knowledge is the first report to demonstrate this importance.
However, there were also some shortages in our study. First, this was a retrospective study performed in single institution. Yet, complete clinicopathological features, long follow-up period, and relatively large study cohort could partly compensate this shortcoming. Second, we only assessed the pretreatment PNI and SII. Consequently, the clinical importance of dynamic change of PNI and SII could not be analyzed in our study. Hence, further large-scale multicenter prospective study is required in order to validate the prognostic impact of PNI and SII together with the combination of them in NPC patients undergoing IMRT.
Conclusion
In summary, we investigated the prognostic value of pretreatment PNI and SII in NPC patients treated with IMRT-based therapy and demonstrated the correlation between them. We also reported the combination of pretreatment PNI and SII, which greatly increased the accuracy of survival prediction. Since both parameters are cost-effective and easy to evaluate from laboratory measures, which are routinely performed in patients, pretreatment PNI and SII, in collaboration with conventional TNM staging system, can guide clinicians in predicting survival and providing more individualized treatment approaches for NPC patients. However, further prospective study is necessary to validate the clinical significance of PNI and SII on treatment outcomes of cancer patients.
Disclosure
The authors report no conflicts of interest in this work.
References
Torre LA, Bray F, Siegel RL, Ferlay J, Lortet-Tieulent J, Jemal A. Global cancer statistics, 2012. CA Cancer J Clin. 2015;65(2):87–108. | ||
Cao SM, Simons MJ, Qian CN. The prevalence and prevention of nasopharyngeal carcinoma in China. Chin J Cancer. 2011;30(2):114–119. | ||
Qiu WZ, Peng XS, Xia HQ, Huang PY, Guo X, Cao KJ. A retrospective study comparing the outcomes and toxicities of intensity-modulated radiotherapy versus two-dimensional conventional radiotherapy for the treatment of children and adolescent nasopharyngeal carcinoma. J Cancer Res Clin Oncol. 2017;143(8):1563–1572. | ||
Zhang MX, Li J, Shen GP, et al. Intensity-modulated radiotherapy prolongs the survival of patients with nasopharyngeal carcinoma compared with conventional two-dimensional radiotherapy: A 10-year experience with a large cohort and long follow-up. Eur J Cancer. 2015;51(17):2587–2595. | ||
Zhao W, Lei H, Zhu X, Li L, Qu S, Liang X. Investigation of long-term survival outcomes and failure patterns of patients with nasopharyngeal carcinoma receiving intensity-modulated radiotherapy: a retrospective analysis. Oncotarget. 2016;7(52):86914–86925. | ||
Lee AW, Ng WT, Chan LK, et al. The strength/weakness of the AJCC/UICC staging system (7th edition) for nasopharyngeal cancer and suggestions for future improvement. Oral Oncol. 2012;48(10):1007–1013. | ||
Chua MLK, Wee JTS, Hui EP, Chan ATC. Nasopharyngeal carcinoma. Lancet. 2016;387(10022):1012–1024. | ||
Diakos CI, Charles KA, McMillan DC, Clarke SJ. Cancer-related inflammation and treatment effectiveness. Lancet Oncol. 2014;15(11):e493–e503. | ||
Mantovani A, Allavena P, Sica A, Balkwill F. Cancer-related inflammation. Nature. 2008;454(7203):436–444. | ||
Cummings M, Merone L, Keeble C, et al. Preoperative neutrophil:lymphocyte and platelet:lymphocyte ratios predict endometrial cancer survival. Br J Cancer. 2015;113(2):311–320. | ||
Pinato DJ, North BV, Sharma R. A novel, externally validated inflammation-based prognostic algorithm in hepatocellular carcinoma: the prognostic nutritional index (PNI). Br J Cancer. 2012;106(8):1439–1445. | ||
Wulaningsih W, Holmberg L, Garmo H, et al. Serum lactate dehydrogenase and survival following cancer diagnosis. Br J Cancer. 2015;113(9):1389–1396. | ||
Wang L, Wang C, Wang J, Huang X, Cheng Y. A novel systemic immune-inflammation index predicts survival and quality of life of patients after curative resection for esophageal squamous cell carcinoma. J Cancer Res Clin Oncol. 2017;143(10):2077–2086. | ||
Du XJ, Tang LL, Mao YP, et al. Value of the prognostic nutritional index and weight loss in predicting metastasis and long-term mortality in nasopharyngeal carcinoma. J Transl Med. 2015;13:364. | ||
Jiang W, Chen Y, Huang J, et al. Systemic immune-inflammation index predicts the clinical outcome in patients with nasopharyngeal carcinoma: a propensity score-matched analysis. Oncotarget. 2017;8(39):66075–66086. | ||
Miao JJ, Xiao WW, Wang L, et al. The value of the prognostic nutritional index (PNI) in predicting outcomes and guiding the treatment strategy of nasopharyngeal carcinoma (NPC) patients receiving intensity-modulated radiotherapy (IMRT) with or without chemotherapy. J Cancer Res Clin. 2017;143(7):1263–1273. | ||
Yang L, Xia L, Wang Y, et al. Low prognostic nutritional index (PNI) predicts unfavorable distant metastasis-free survival in nasopharyngeal carcinoma: a propensity score-matched analysis. PloS one. 2016;11(7):e0158853. | ||
Li AC, Xiao WW, Shen GZ, et al. Distant metastasis risk and patterns of nasopharyngeal carcinoma in the era of IMRT: long-term results and benefits of chemotherapy. Oncotarget. 2015;6(27):24511–24521. | ||
Hanahan D, Weinberg RA. Hallmarks of cancer: the next generation. Cell. 2011;144(5):646–674. | ||
Candido J, Hagemann T. Cancer-related inflammation. J Clin Immunol. 2013;33 Suppl 1:S79–S84. | ||
Onodera T, Goseki N, Kosaki G. [Prognostic nutritional index in gastrointestinal surgery of malnourished cancer patients]. Nihon Geka Gakkai zasshi. 1984;85(9):1001–1005. Japanese [with English abstract] | ||
Kanda M, Fujii T, Kodera Y, Nagai S, Takeda S, Nakao A. Nutritional predictors of postoperative outcome in pancreatic cancer. Br J Surg. 2011;98(2):268–274. | ||
Maeda K, Nagahara H, Shibutani M, et al. A preoperative low nutritional prognostic index correlates with the incidence of incisional surgical site infections after bowel resection in patients with Crohn’s disease. Surg Today. 2015;45(11):1366–1372. | ||
Hofbauer SL, Pantuck AJ, de Martino M, et al. The preoperative prognostic nutritional index is an independent predictor of survival in patients with renal cell carcinoma. Urol Oncol. 2015;33(2):68. | ||
Okada S, Shimada J, Kato D, Tsunezuka H, Teramukai S, Inoue M. Clinical significance of prognostic nutritional index after surgical treatment in lung cancer. Ann Thorac Surg. 2017;104(1):296–302. | ||
Sun KY, Xu JB, Chen SL, et al. Novel immunological and nutritional-based prognostic index for gastric cancer. World J Gastroenterol. 2015;21(19):5961–5971. | ||
Argiles JM, Busquets S, Stemmler B, Lopez-Soriano FJ. Cancer cachexia: understanding the molecular basis. Nat Rev Cancer. 2014;14(11):754–762. | ||
Falconer JS, Fearon KC, Plester CE, Ross JA, Carter DC. Cytokines, the acute-phase response, and resting energy expenditure in cachectic patients with pancreatic cancer. Ann Surg. 1994;219(4):325–331. | ||
Laine A, Iyengar P, Pandita TK. The role of inflammatory pathways in cancer-associated cachexia and radiation resistance. Mol Cancer Res. 2013;11(9):967–972. | ||
McMillan DC. Systemic inflammation, nutritional status and survival in patients with cancer. Curr Opin Clin Nutr Metab Care. 2009;12(3):223–226. | ||
Hu B, Yang XR, Xu Y, et al. Systemic immune-inflammation index predicts prognosis of patients after curative resection for hepatocellular carcinoma. Clin Cancer Res. 2014;20(23):6212–6222. | ||
Sahasrabuddhe VV, Gunja MZ, Graubard BI, et al. Nonsteroidal anti-inflammatory drug use, chronic liver disease, and hepatocellular carcinoma. J Natl Cancer Inst. 2012;104(23):1808–1814. | ||
van Staalduinen J, Frouws M, Reimers M, et al. The effect of aspirin and nonsteroidal anti-inflammatory drug use after diagnosis on survival of oesophageal cancer patients. Brit J Cancer. 2016;114(9):1053–1059. | ||
Huang L, Liu S, Lei Y, et al. Systemic immune-inflammation index, thymidine phosphorylase and survival of localized gastric cancer patients after curative resection. Oncotarget. 2016;7(28):44185–44193. | ||
Lolli C, Basso U, Derosa L, et al. Systemic immune-inflammation index predicts the clinical outcome in patients with metastatic renal cell cancer treated with sunitinib. Oncotarget. 2016;7(34):54564–54571. | ||
Lolli C, Caffo O, Scarpi E, et al. Systemic immune-inflammation index predicts the clinical outcome in patients with mCRPC treated with abiraterone. Front Pharmacol. 2016;7:376. | ||
Mego M, Gao H, Cohen EN, et al. Circulating tumor cells (CTC) are associated with defects in innate and adaptive immunity in inflammatory breast cancer (IBC) patients. J Cancer. 2016;7(9):1095–1104 . | ||
Labelle M, Begum S, Hynes RO. Direct signaling between platelets and cancer cells induces an epithelial-mesenchymal-like transition and promotes metastasis. Cancer Cell. 2011;20(5):576–590. | ||
Kusumanto YH, Dam WA, Hospers GA, Meijer C, Mulder NH. Platelets and granulocytes, in particular the neutrophils, form important compartments for circulating vascular endothelial growth factor. Angiogenesis. 2003;6(4):283–287. | ||
Moses K, Brandau S. Human neutrophils: their role in cancer and relation to myeloid-derived suppressor cells. Semin Immunol. 2016;28(2):187–196. | ||
D’Agostino RB Jr. Propensity score methods for bias reduction in the comparison of a treatment to a non-randomized control group. Stat Med. 1998;17(19):2265–2281. |
Supplementary materials
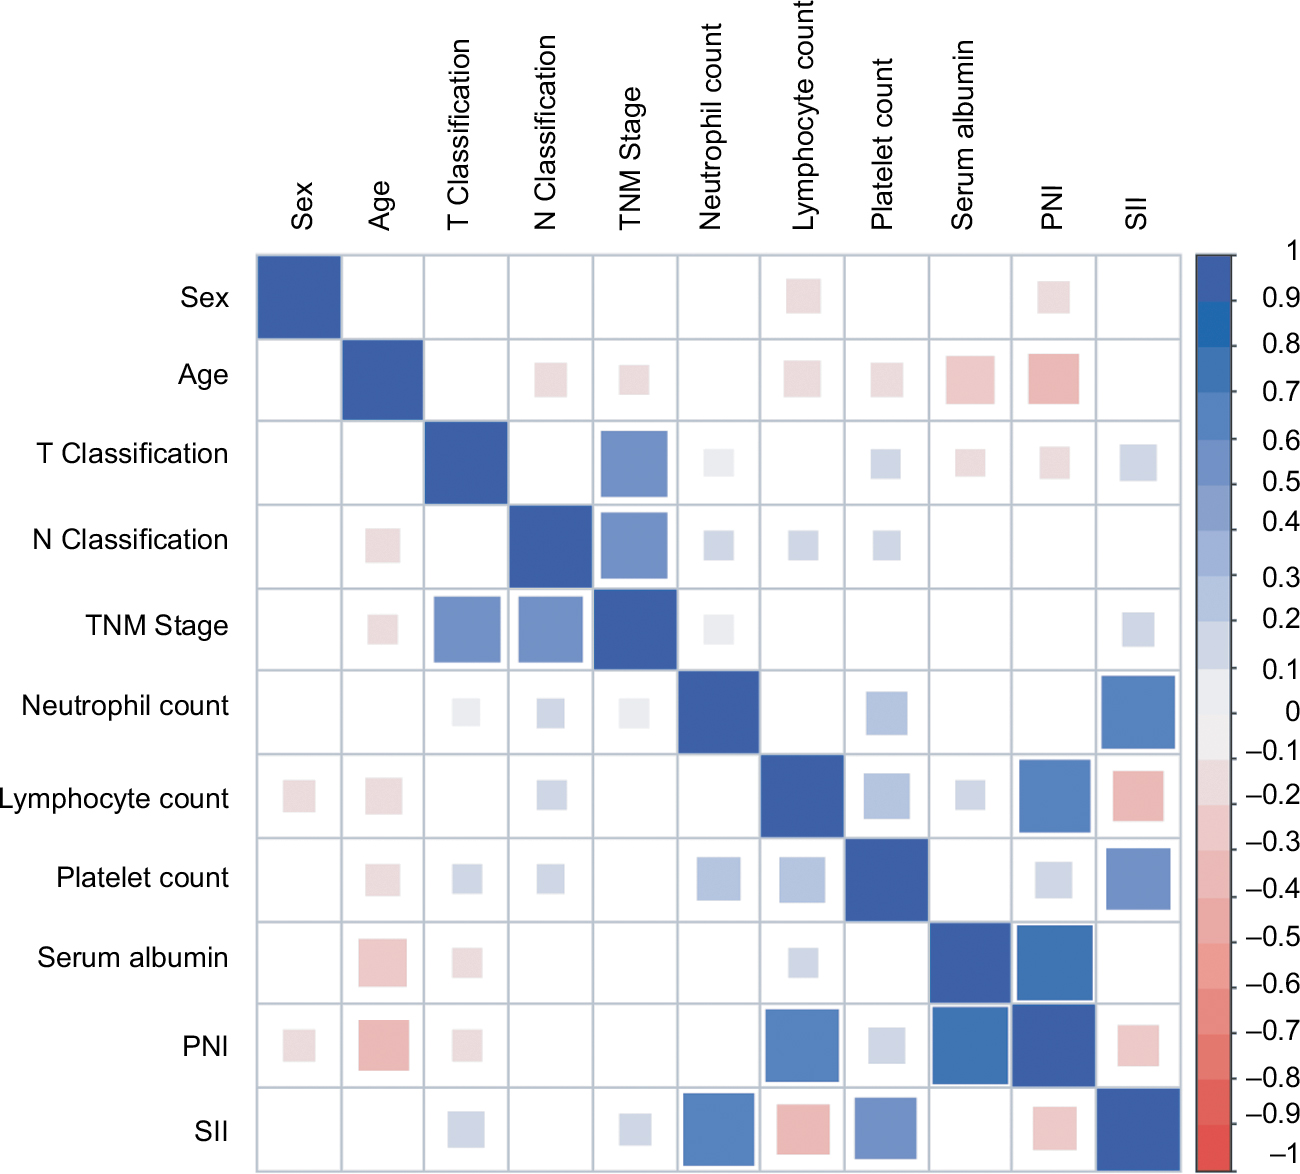 | Figure S1 Correlogram illustrating correlation between clinical features and blood parameters. Insignificant correlation coefficients are left blank. Pearson correlation coefficient, P < 0.05. Abbreviations: PNI, prognostic nutritional index; SII, systemic immune-inflammation index. |
 | Figure S2 Scatter plot of the correlation between PNI and SII. Regression lines are provided in the scatter plot. Pearson correlation coefficient: R = –0.232, P < 0.001. Abbreviations: PNI, prognostic nutritional index; SII, systemic immune-inflammation index. |
 | Figure S3 The distribution of propensity scores across pretreatment PNI and pretreatment SII before (A and C) and after (B and D) PSM. Abbreviations: PNI, prognostic nutritional index; PSM, propensity score matching; SII, systemic immune-inflammation index. |
 © 2018 The Author(s). This work is published and licensed by Dove Medical Press Limited. The
full terms of this license are available at https://www.dovepress.com/terms
and incorporate the Creative Commons Attribution
- Non Commercial (unported, 3.0) License.
By accessing the work you hereby accept the Terms. Non-commercial uses of the work are permitted
without any further permission from Dove Medical Press Limited, provided the work is properly
attributed. For permission for commercial use of this work, please see paragraphs 4.2 and 5 of our Terms.
© 2018 The Author(s). This work is published and licensed by Dove Medical Press Limited. The
full terms of this license are available at https://www.dovepress.com/terms
and incorporate the Creative Commons Attribution
- Non Commercial (unported, 3.0) License.
By accessing the work you hereby accept the Terms. Non-commercial uses of the work are permitted
without any further permission from Dove Medical Press Limited, provided the work is properly
attributed. For permission for commercial use of this work, please see paragraphs 4.2 and 5 of our Terms.