Back to Journals » Cancer Management and Research » Volume 11
Prognostic Role Of Computed Tomography Textural Features In Early-Stage Non-Small Cell Lung Cancer Patients Receiving Stereotactic Body Radiotherapy
Authors Zhang R ![]() , Wang C, Cui K, Chen Y
, Wang C, Cui K, Chen Y ![]() , Sun F, Sun X, Xing L
, Sun F, Sun X, Xing L ![]()
Received 4 July 2019
Accepted for publication 29 October 2019
Published 25 November 2019 Volume 2019:11 Pages 9921—9930
DOI https://doi.org/10.2147/CMAR.S220587
Checked for plagiarism Yes
Review by Single anonymous peer review
Peer reviewer comments 4
Editor who approved publication: Professor Bilikere Dwarakanath
Ran Zhang,1,2 Changbin Wang,2,3 Kai Cui,3,4 Yicong Chen,1,2 Fenghao Sun,2,5 Xiaorong Sun,4 Ligang Xing2
1Cheeloo College of Medicine, Shandong University, Jinan, People’s Republic of China; 2Department of Radiation Oncology, Shandong Key Laboratory of Radiation Oncology, Shandong Cancer Hospital and Institute, Shandong First Medical University and Shandong Academy of Medical Sciences, Jinan, Shandong, People’s Republic of China; 3Department of Clinical Medicine, Jinan University, Jinan, Shandong, People’s Republic of China; 4Department of Nuclear Medicine, Shandong Key Laboratory of Radiation Oncology, Shandong Cancer Hospital and Institute, Shandong First Medical University and Shandong Academy of Medical Sciences, Jinan, Shandong, People’s Republic of China; 5Department of Clinical Medicine, Weifang Medical University, Weifang, Shandong, People’s Republic of China
Correspondence: Xiaorong Sun
Department of Nuclear Medicine, Shandong Key Laboratory of Radiation Oncology, Shandong Cancer Hospital and Institute, Shandong First Medical University and Shandong Academy of Medical Sciences, 440 Jiyan Road, Jinan, Jinan, People’s Republic of China
Tel/Fax +86 531 6762 6419
Email [email protected]
Purpose: The imaging features of patients with early-stage non-small cell lung cancer (NSCLC) receiving stereotactic body radiotherapy (SBRT) are crucial for the decision-making process to establish a treatment plan. The purpose of this study was to predict the clinical outcomes of SBRT from the textural features of pretreatment computed tomography (CT) images.
Patients and methods: Forty-one early-stage NSCLC patients who received SBRT were included in this retrospective study. In total, 72 textural features were extracted from the pretreatment contrast-enhanced CT images. Survival analysis was used to identify high-risk groups for progression-free survival (PFS) and disease-specific survival (DSS). Receiver operating characteristic (ROC) curve analysis was utilized to estimate the diagnostic abilities of the textural parameters. Univariable and multivariable Cox regression analyses were performed to evaluate the predictors of PFS and DSS.
Results: Four parameters, including entropy (P=0.003), second angular moment (SAM) (P=0.04), high-intensity long-run emphasis (HILRE) (P=0.046) and long-run emphasis (LRE) (P=0.042), were significant prognostic features for PFS. In addition, contrast (P=0.008), coarseness (P=0.017), low-intensity zone emphasis (LIZE) (P=0.01) and large number emphasis (LNE) (P=0.046) were significant prognostic factors for DSS. In the ROC analysis, the area under the curve (AUC) of coarseness for local recurrence (LR) was 0.722 (0.528–0.916), and the AUC of entropy for lymph node metastasis (LNM) was 0.771 (0.556–0.987). The four highest AUCs for distant metastasis (DM) were 0.885 (0.784–0.985) for LNE, 0.846 (0.733–0.959) for SAM, 0.731 (0.500–0.961) for LRE and 0.731 (0.585–0.876) for contrast. In the multivariable analysis, smoking and entropy were independent prognostic factors for PFS.
Conclusion: This exploratory study reveals that textual features derived from pretreatment CT scans have prognostic value in early-stage NSCLC patients treated with SBRT.
Keywords: computed tomography imaging, clinical outcomes, non-small cell lung cancer, NSCLC, stereotactic body radiation therapy, textural analysis
Introduction
Stereotactic body radiation therapy (SBRT), delivering a high dose of radiation over a relatively small number of fractions, is the standard treatment for patients with early-stage inoperable non-small cell lung cancer (NSCLC).1 For elderly patients or patients with severe complications, such as chronic obstructive lung disease and coronary artery disease, SBRT has a local control rate of more than 85%.2,3 However, the two-year cumulative incidence rates of nodal failure and distant failure4 after SBRT are 16.1% and 15.5%, respectively. Accordingly, it is important to develop approaches to identify patients at the highest risk for recurrence after SBRT and improve their prognosis with exploratory methods such as adjuvant chemotherapy and immunotherapy.5,6
The major method for disease status evaluation is to complete scheduled follow-ups by chest computed tomography (CT) every 3–6 months in the first three years. Huang et al7 found that the high-risk features of CT images acquired after stereotactic ablative radiotherapy (SABR) enable the accurate prediction of local recurrence (LR). Nevertheless, it is difficult to distinguish between recurrence and radiation-induced lung injuries within the first two years after SBRT, which interferes with the predictive efficiency of posttreatment biomarkers extracted from the CT images. In addition, the delay in identifying high-risk patients could lead to a delay in salvage treatment. Thus, we prefer to apply pretreatment imaging biomarkers to predict the progression of disease, including features extracted from 18F-fluorodeoxyglucose positron emission tomography combined with CT (18FDG-PET/CT) and CT. Some previous studies identified the standard uptake value (SUV) from PET/CT as a predictor of survival,8,9 but others reported that SUV was not an independent predictor of overall survival.10,11 Therefore, a novel approach to quantifiably forecast disease progression in patients after SBRT is necessary to achieve high diagnostic accuracy.
Recently, radiomics, an emerging image processing field, has increasingly become an indispensable method for analyzing large amounts of quantitative features derived from original imaging data12–14 and has been shown to have prognostic power or clinical significance for different types of tumors.15,16 Dennie et al17 reported that CT textural features were found to be predictors of LR for early-stage NSCLC. However, to the best of our knowledge, few studies have reported that features originating from the textural analysis of CT images prior to SBRT can predict progression-free survival (PFS) and disease-specific survival (DSS). Thus, in our study, we aim to analyze the association between the textural features of pretreatment CT images of early-stage NSCLC patients who received SBRT and the clinical outcomes.
Materials And Methods
Patients
From July 2014 to April 2018, clinical data were collected from Shandong Cancer Hospital. Ethical approval was obtained from the institutional review board, and written informed consent was waived for this study due to its retrospective design. All the data was anonymized. The inclusion criteria were as follows: (1) clinical T1-2N0M0 stage NSCLC patients (according to 7th AJCC edition staging), (2) unsuitability for surgery because of complication or age, (3) refusal to undergo surgery, and (4) CT scans performed less than 15 days before radiotherapy. The exclusion criteria were (1) chemotherapy before or after SBRT, (2) presence of other tumors, and (3) incomplete clinical data.
CT Scans
The enhanced CT scans were performed approximately 10 days prior to SBRT and deidentified. The contrast material was injected into the vein before the examination at a dose of 1.3–1.5 mL per kilogram of body weight at the rate of 2 mL/s. CT scanners, such as the 64-MDCT (Definition AS+, Siemens SOMATOM) scanner, were utilized in accordance with the following parameters: slice thickness, 1.00 mm or 3.00 mm; tube-voltage, 120 kVp; and tube current, 160 mAs. Displayed with the standard lung (width, 1600 HU; level, –600 HU) and mediastinal (width, 400 HU; level, 40 HU) window settings, all images were evaluated by two experienced radiologists who were blinded to the histological and clinical data.
SBRT Planning And Delivery
SBRT planning and delivery was used with a hypofractionated scheme.18,19 In brief, the patients were immobilized in a vacuum couch, and a free-breathing simulating CT (e.g., 4D-CT) scan was performed. Abdominal compression was utilized if the tumor motion was greater than 1 cm. Cone-beam CT and portal imaging were used for daily setup and image-guided treatment. The gross tumor volume (GTV) was delineated in the lung window, and an internal target volume (ITV) was generated in light of the target motion using 4D-CT for most patients. Finally, an isotropic margin of 5 mm axially and 1 cm craniocaudally was added to generate the planning target volume (PTV) with no clinical target volume (CTV) margin. The number of radiation fractions ranged from 3 to 12. The median prescribed radiation dose was 58Gy (50–70Gy). For the calculation of the biological effective dose (BED), the value of α/β was defined as 10.20 As shown in Table 1, 61% of the BED for radiation treatment in our study was concentrated in the range of 100–120Gy.21
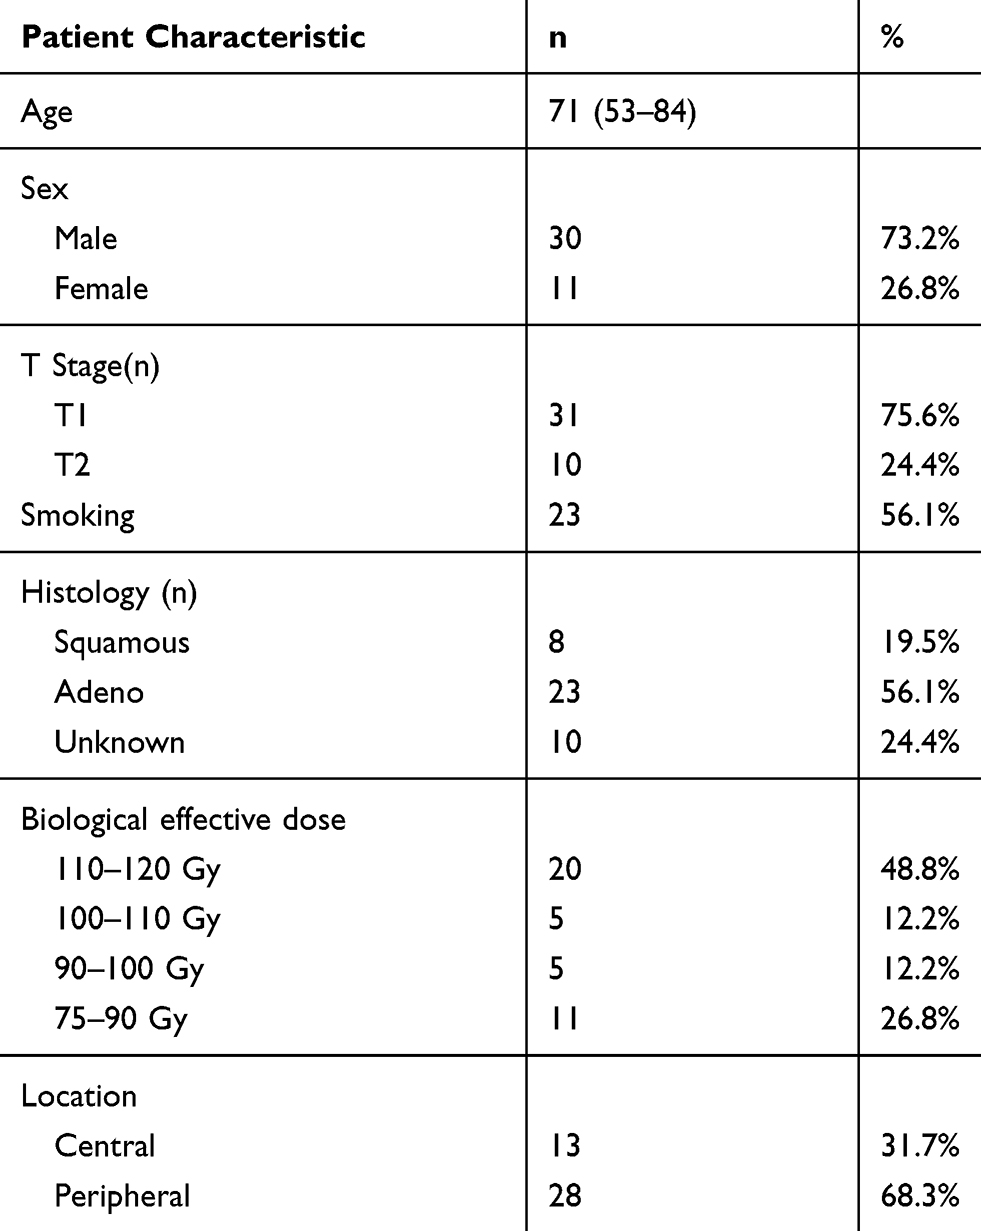 |
Table 1 Patient Characteristics |
Image Analysis
The CT scans were exported from the scanner, and then the region of interest was contoured using CGITA (version 1.0, Taiwan). The entire tumor region of interest was manually outlined by two experienced radiologists and verified by an experienced radiation oncologist. A representative region of interest is shown in Figure 1. The textural feature calculations were performed with the same software. The inter- and intraobserver reproducibility were determined by the inter- and intraclass correlation coefficients (ICCs), in which good agreement was indicated by values greater than 0.75. According to the aforementioned method, a total of 72 features were extracted from the software and could be classified into the following major groups: first-order features, revealing the value of the intensity histogram, and second- and high-order features, depicting the heterogeneity and spatial distributions. Further details on these features, such as their formulas or definitions, can be obtained by contacting the developer of CGITA through the following website (http://code.google.com/p/cgita).
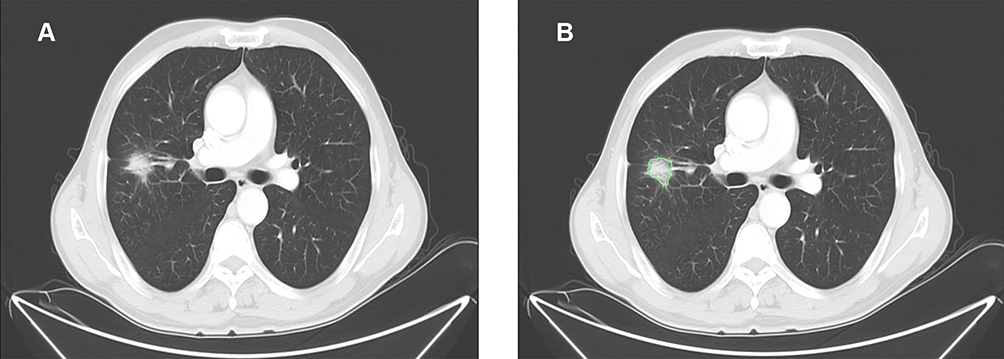 |
Figure 1 Representative computed tomography image of a 60-year-old man with lung adenocarcinoma. (A) A tumor in the left lobe was chosen to delineate region of interest. (B) One radiologist delineated the region of interest, which is shown in green outline. |
Clinical Outcomes And Follow-Up
Complete response (CR), partial response (PR), stable disease (SD) or progressive disease (PD) was recorded according to the Response Evaluation Criteria in Solid Tumors (RECIST) 1.1. The definition of LR complied with PD in the primary tumor without lymphatic metastasis or distant metastasis (DM). PFS was defined as the time between the first day of treatment and the date of PD or unexpected death. DSS was calculated as the time between the first day of treatment and the date of disease-specific death, excluding diseases such as chronic obstructive lung disease and coronary artery disease. If the status of the patients was stable, the final date of PFS and DSS was the last follow-up date. The follow-ups were performed by CT scans or by telephone every 3 months in the first two years and every 6 months thereafter.
Statistical Analysis
Receiver operating characteristic (ROC) analysis was used to obtain the optimal cut-off values of all textural parameters to predict treatment response. Kaplan-Meier (K-M) survival curves were generated, and a log rank test was applied to estimate differences between the two groups stratified by the obtained cut-off value of all features for PFS and DSS. A two-sided level of significance of P<0.05 was used in the survival analysis. As a result, eight features were indicated to be significant in the survival analysis. Then, these features were tested in ROC analyses for their capacity to predict LR, lymph node metastasis (LNM), DM, PFS and DSS. In addition, the area under the curve (AUC) for these parameters was calculated with a 95% confidence interval (CI). Furthermore, univariable and multivariable analyses were carried out using the Cox proportional hazards regression model to confirm the prognostic factors. All the abovementioned statistical analyses were performed with IBM SPSS (version 24.0, IBM SPSS) and MedCalc (version 15.6.1, MedCalc) software.
Results
Patient Characteristics
From August 2013 to April 2018, 41 patients were included according to the inclusion and exclusion criteria. The clinical and pathological characteristics of these patients are listed in Table 1.
Survival Analysis And ROC Analysis
The median follow-up was 18 months (range 3–37 months). All textural parameters were tested by ROC analysis using MedCalc software to determine the thresholds of different endpoints, such as PFS and DSS. Based on the cut-off values, all the data were divided into two groups for the survival analysis. As shown in Table 2, four parameters, namely, entropy, second angular moment (SAM), high-intensity long-run emphasis (HILRE) and long-run emphasis (LRE), were statistically significant prognostic factors for PFS. Moreover, another four parameters, namely, contrast, coarseness, low-intensity zone emphasis (LIZE) and large number emphasis (LNE), were significant prognostic features for DSS. The PFS was longer for patients with low entropy (median PFS: 27.9 months vs 17.1 months, P=0.003), HILRE (median PFS: 28.5 months vs 17.6 months, P=0.046) and LRE (median PFS: 29.2 months vs 19.5 months, P=0.042). A high SAM (median PFS: 26.9 months vs 20.1 months, P=0.04) led to better performance for PFS than a low SAM. Regarding DSS, patients with high contrast (median DSS: 25.6 months vs 34.8 months, P=0.008) and LNE (median DSS: 25.2 months vs 33.7 months, P=0.046) had a shorter DSS than other patients. A favorable DSS was correlated with high LIZE (median DSS: 33.1 months vs 21.5 months, P=0.010) and coarseness (median DSS: 33.1 months vs 21.5 months, P=0.017). The survival curves of the above parameters to distinguish the high-risk factors for PFS and DSS are shown in Figure 2. The other parameters manifested no significant differences in the log rank test.
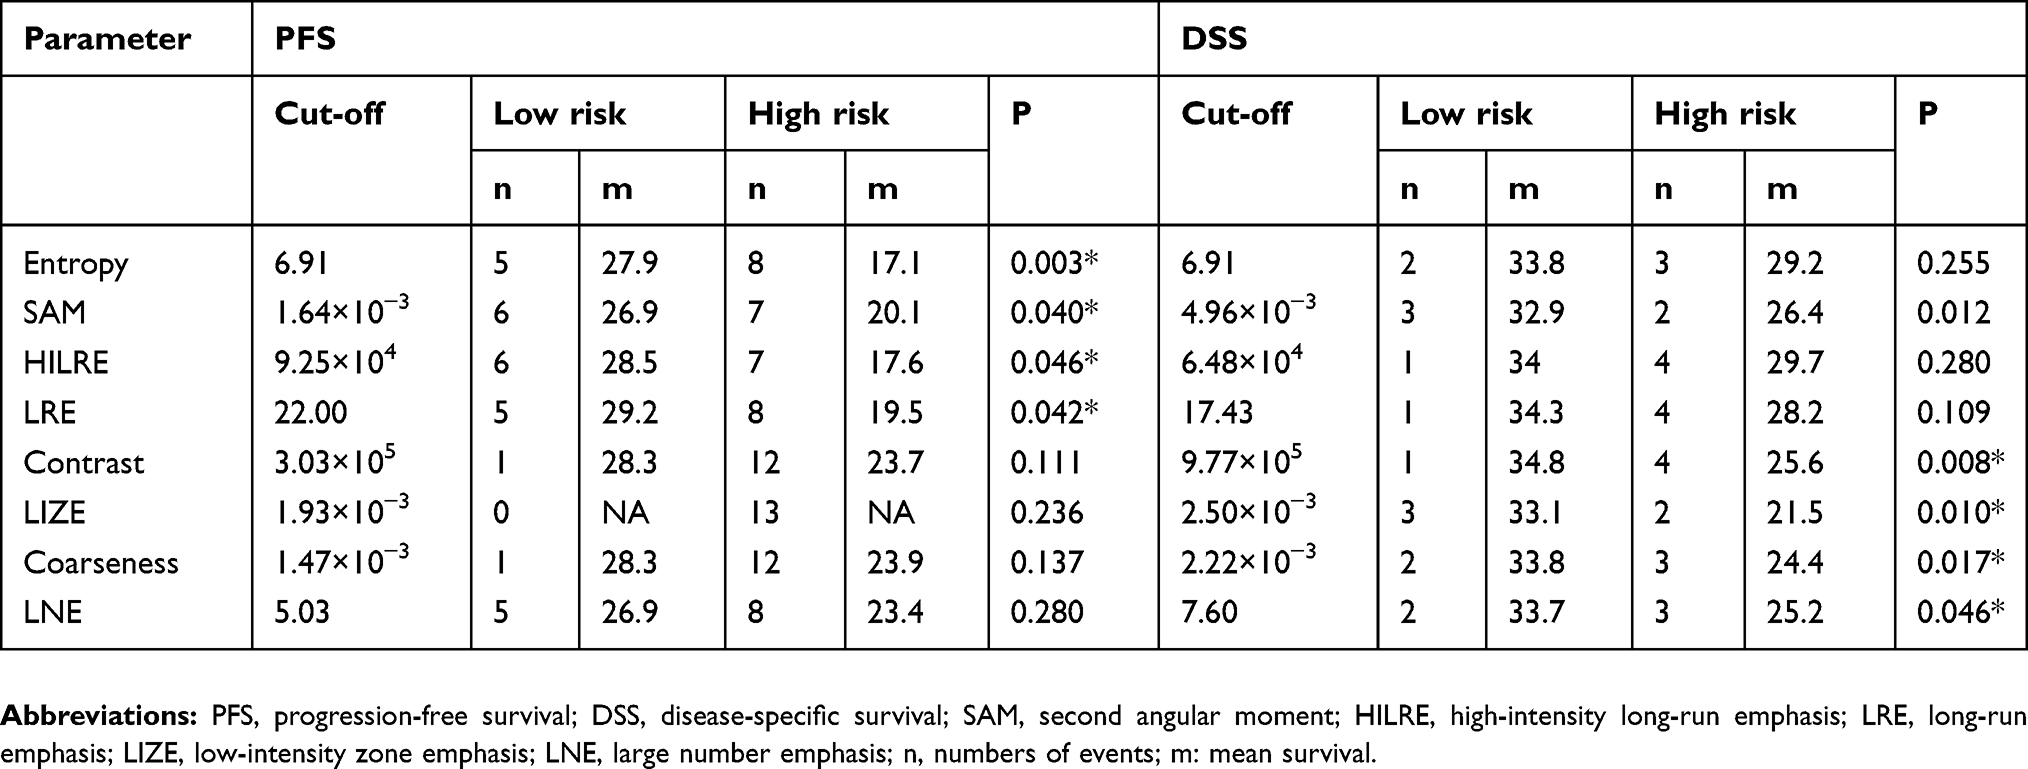 |
Table 2 Kaplan-Meier Analysis Of Progression-Free Survival And Disease-Specific Survival |
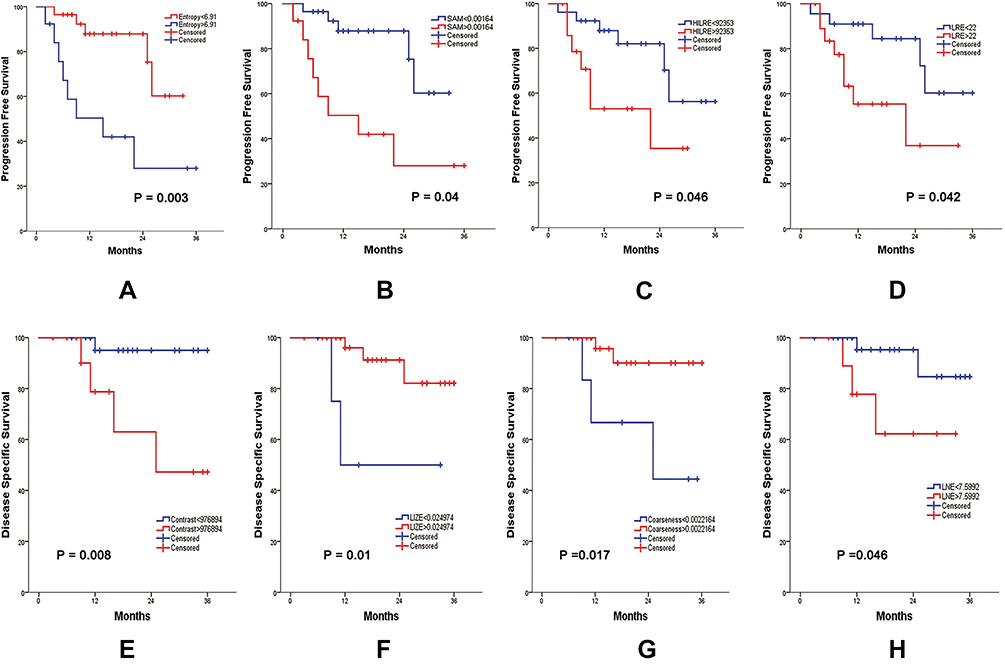 |
Figure 2 Survival curves for PFS and DSS. PFS of the subgroups determined by entropy (A), SAM (B), HILRE (C), and LRE (D). DSS of the subgroups determined by contrast (E), LIZE (F), coarseness (G), and LNE (H). Abbreviations: PFS, progression-free survival; DSS, disease-specific survival; SAM, second angular moment; HILRE, high-intensity long-run emphasis; LRE, long-run emphasis; LIZE, low-intensity zone emphasis; LNE, large number emphasis. |
The numbers of patients with LR, LNM and DM were 5, 6 and 2, respectively. The numbers of patients with calculated PFS and DSS values were 13 and 5, respectively. The diagnostic efficiency of the abovementioned textural parameters to predict curative response was evaluated by ROC analysis, as shown in Table 3. The AUC of coarseness for LR was 0.722 (0.528–0.916), and the AUC of entropy for LNM was 0.771 (0.556–0.987). Furthermore, the four highest AUCs for DM were 0.885 (0.784–0.985) for LNE, 0.846 (0.733–0.959) for SAM, 0.731 (0.500–0.961) for LRE and 0.731 (0.585–0.876) for contrast.
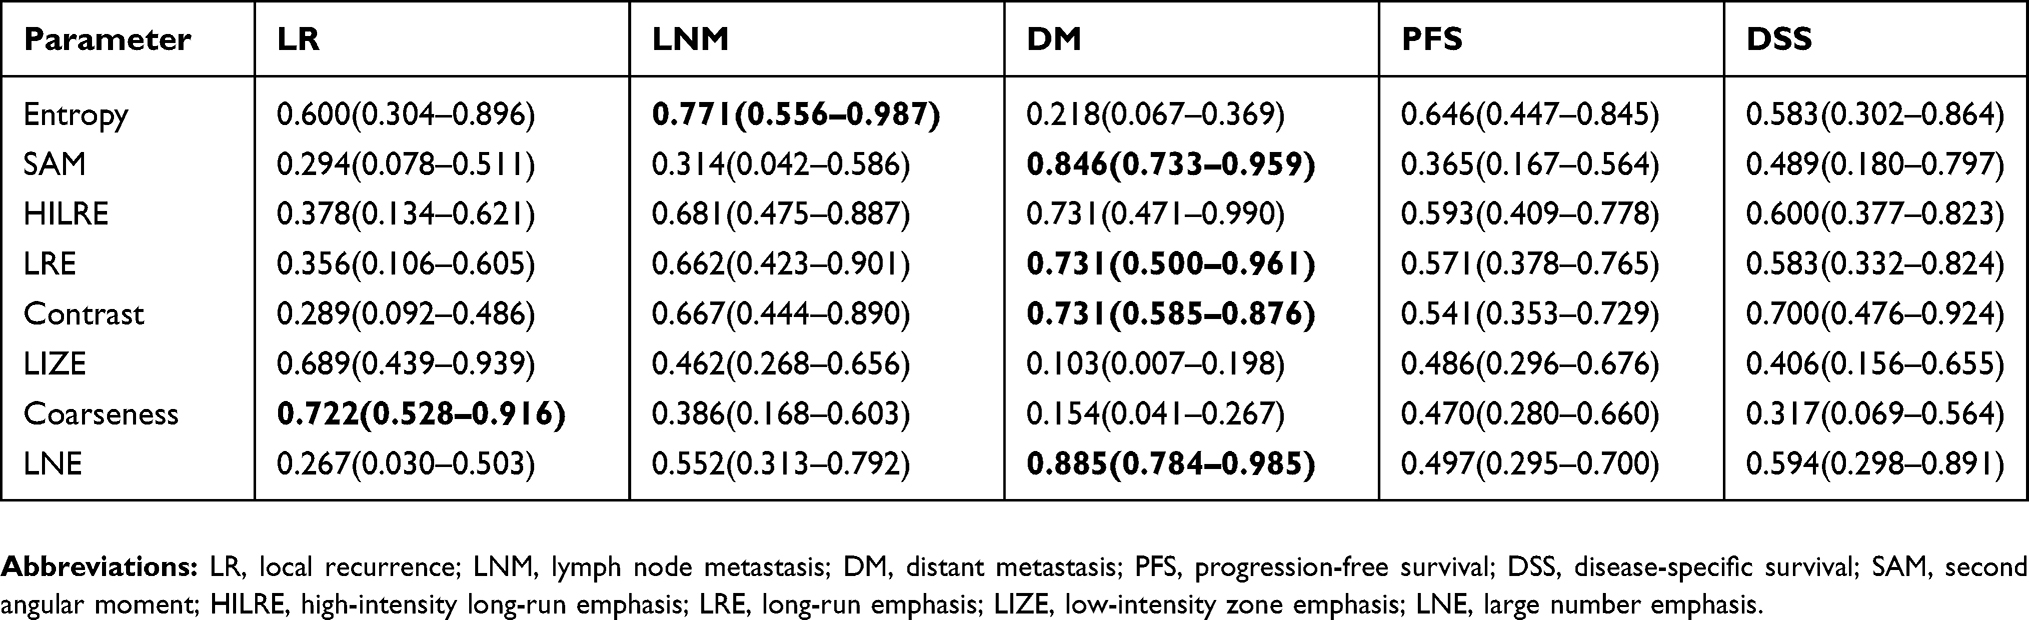 |
Table 3 ROC Analysis Of LR, LNM, DM, PFS And DSS |
Cox Regression Analysis
The eight parameters described above were evaluated by univariable survival analysis to investigate their relationship with PFS and DSS. Age, sex, smoking, tumor size, histology, operability (unwilling to undergo surgery versus inoperable), tumor location (central vs peripheral, BED (>100Gy vs ≤ 100Gy) and T stage were included in the analysis model. However, the univariable Cox regression (shown in Table 4) revealed that none of the included factors were significantly correlated with PFS or DSS. Accordingly, the variables that showed a P value lower than 0.2 were brought into the multivariable Cox regression. Utimately, four independent variables met the criterion, including entropy, smoking, tumor location and LRE. The T stage, which was previously deemed as a predictive factor for prognosis,22,23 was also incorporated in the multivariable model. As a result, Smoking and entropy had significantly independent prognostic value for PFS, and the hazard ratios (HRs) of these factors were 4.725 (95% CI 1.153–19.367, P=0.031) and 6.859 (95% CI 1.147–41.016, P=0.035), respectively.
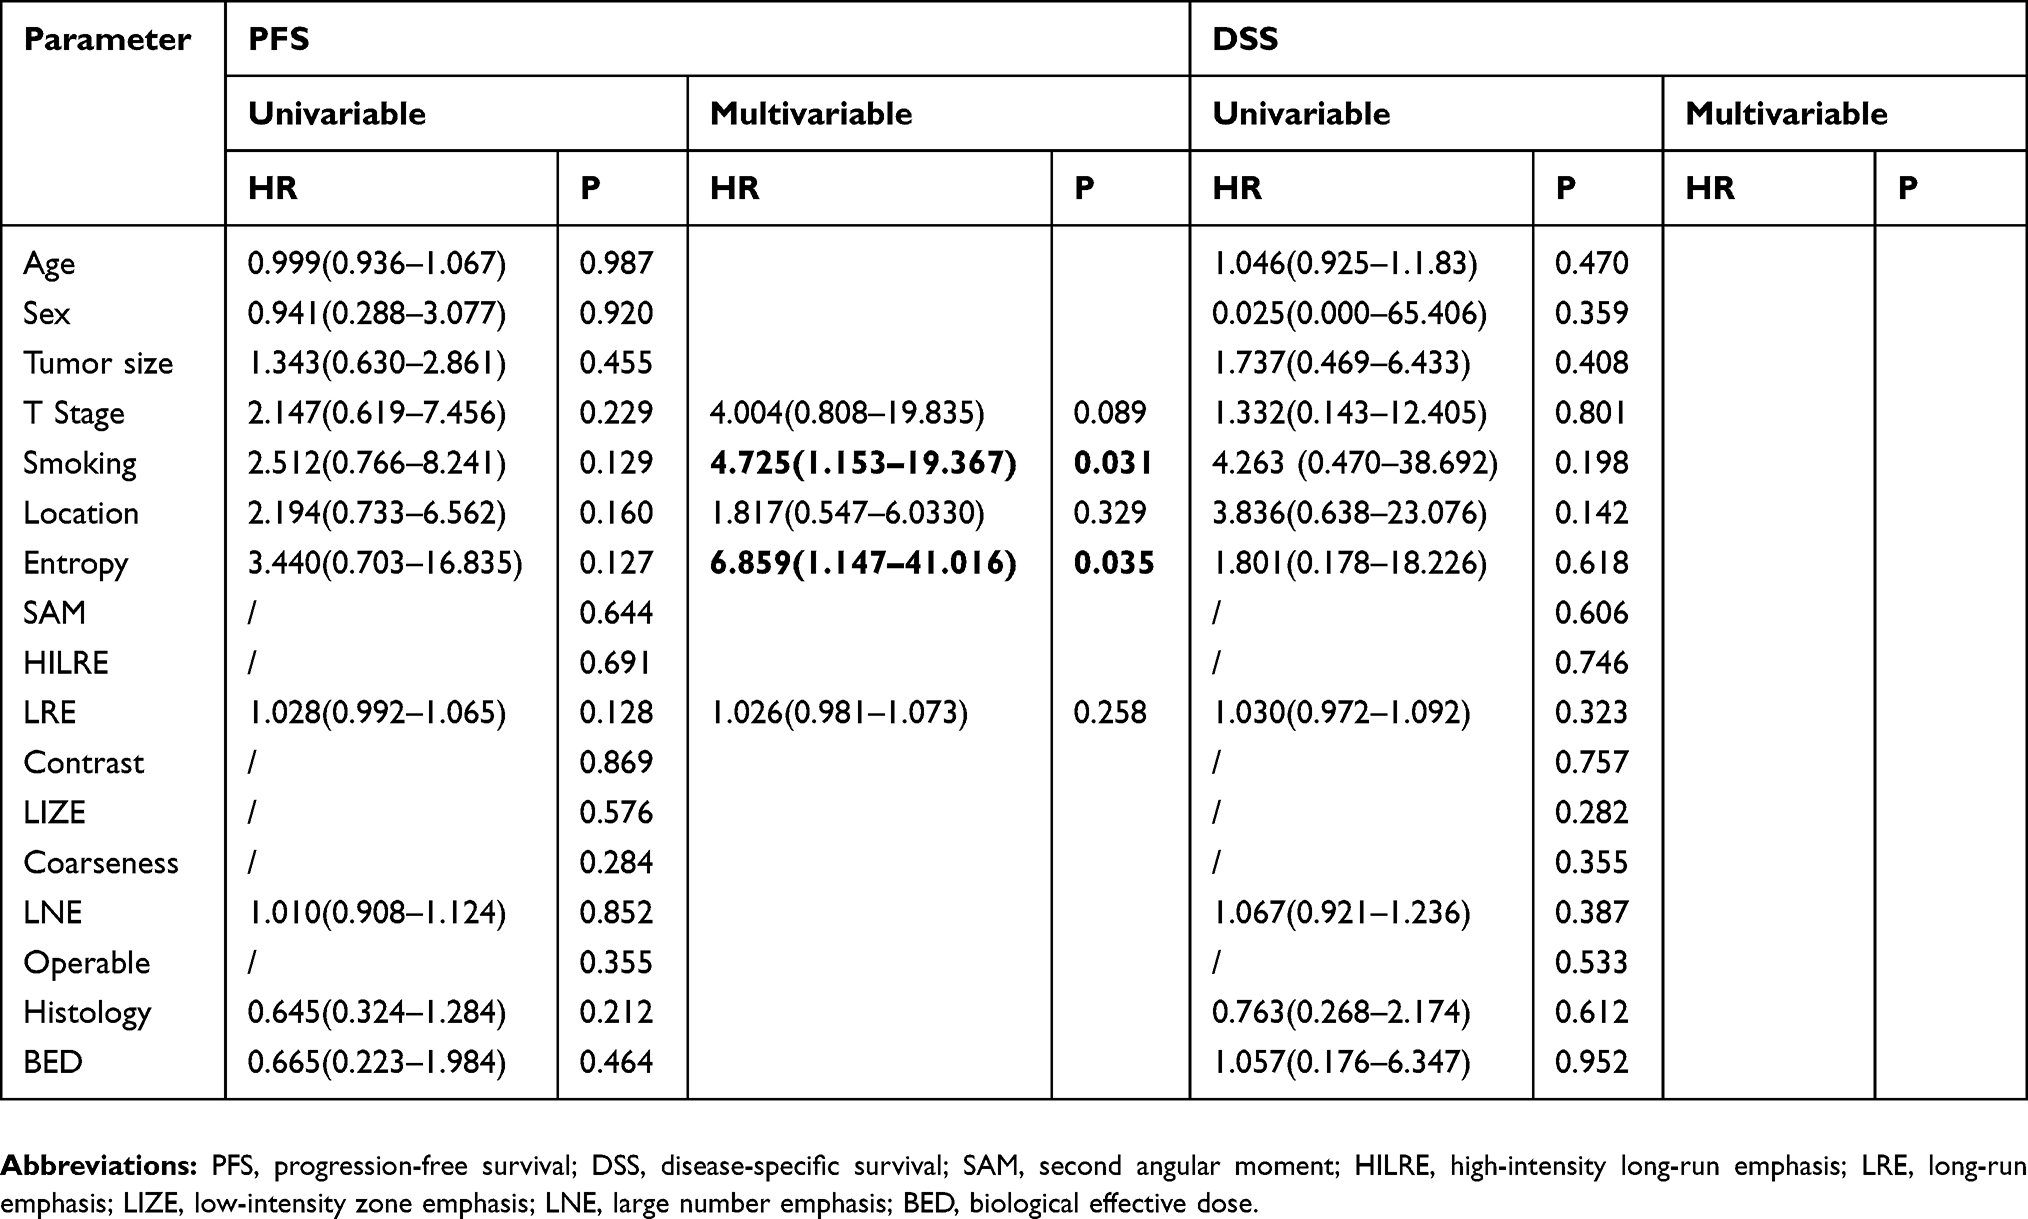 |
Table 4 Univariable And Multivariable Survival Analyses Of PFS And DSS |
Discussion
Based on the quantitative texture analysis of CT images acquired prior to SBRT, we found that textural parameters could offer information about the clinical outcomes of early-stage NSCLC patients. In our study, we discovered that patients could be divided into high- and low-risk groups for PFS and DSS, which benefited the outcome predictions for patients with medically inoperable disease who were receiving SBRT.
Although the features in our present study were extracted from the pretreatment CT images, other studies concentrating on posttreatment imaging features have been reported. Li et al 24 found that radiological texture features extracted from the first follow-up CTs helped to identify patients at high risk for recurrence. However, radiologists found that radiation-induced lung injury,25,26 potentially caused by high-dose radiation therapy, was hard to distinguish from recurrence in the early follow-up CTs, thus weakening the accuracy of these features. Therefore, utilizing the posttreatment textural features of CTs to predict clinical outcomes remains controversial, which highlights the predictive value of pretreatment factors.
As shown in our study, smoking, as a pretreatment clinical factor, was an independent predictor for PFS. Smoking is recognized as a negative factor for disease prognosis. For instance, continued smoking decreased the overall survival (OS) of NSCLC patients who received combined chemotherapy and radiation therapy.27 However, smoking was not considered to correlate with clinical endpoints in other studies.28,29 Moreover, even for the SUVmax from PET/CT images acquired prior to SBRT, the debate is ongoing, and results have been inconclusive.30–32 This finding indicates that forecasting survival from only clinical or other classical parameters is difficult. A novel method for image processing to exploit precision imaging information is needed for treatment optimization.
By exploring tumor heterogeneity, radiomics textual analysis provides a large number of descriptors and is thus viewed as a novel approach in precision medicine to predict the survival endpoints for SBRT patients. To the best of our knowledge, few studies have found radiomics features from CTs associated with PFS. Li et al33 found that the radiomics feature named F2 (short axis × longest diameter) was a significant predictor of recurrence-free survival (RFS). However, this size-related radiomic parameter called F2 is not sufficiently presentative because an increase in tumor size indicates a rise in the malignant risk. In contrast, our studies demonstrated that four textural parameters could help stratify patients into a high-risk group for PFS, and it is worthwhile to note that none of these four features were correlated with tumor size. Following SBRT, patients could also be stratified into a high-risk group for another endpoint, DSS, by four textural features in our study. A retrospective study, however, proved19 that three different radiomic parameters had prognostic value for cancer-specific disease (CSS). A possible reason for the diverse abilities of textural features to predict the same endpoint is that the standardization of all textural features from different kinds of imaging scans is lacking. Thus, future studies should focus on facilitating the widespread adoption of radiomics analysis and standardizing the extraction of textural features from imaging data.
In terms of the textural features in our study, entropy is worthy of discussion because it not only emerged as an independent prognostic factor that could identify patients at high risk for PFS but also showed diagnostic value for PFS and LNM. The term entropy represents a measure of disorder and randomness in the pixels or voxels of medical images. In addition, the degree of disorder may reflect the diversity and heterogeneity of lung cancer phenotypes to a certain extent, which could hint at the irregular distribution of tumor cells. Although entropy from CT images has not been proven to have predictive performance in other studies thus far, entropy extracted from PET/CT scans has been demonstrated to be an independent predictive factor for DSS.22 Regarding another parameter in this study, contrast, patients with a low contrast value had a longer survival time than patients with a high contrast value. Contrast represents the difference in intensity between neighboring pixels. The difference in intensity could be explained by tumor heterogeneity. Thus, a low level of heterogeneity could explain the long survival time. These findings suggest that radiomic parameters can provide potential phenotypic information that cannot be obtained simply from clinical features, such as tumor size.
In the Cox regression analysis, several clinical and radiomics parameters were analyzed in univariable survival analyses to evaluate their ability to predict PFS or DSS. However, none of the variables were significant in univariable analyses for PFS and DSS. T stage and tumor size are correlated and are considered to have prognostic value for PFS; therefore, we chose only T stage, a dichotomous variable reflecting tumor size, to include in the multivariable analysis. To exclude interference from the possible suppressor effect, we set the P value criterion to 0.2 and used a multivariable analysis to include a few parameters, such as tumor location, smoking, entropy and LRE. From this analysis, entropy and smoking were proven to be independent predictors for PFS. Therefore, we believe that the T stage and tumor location were suppressors in this regression analysis. For instance, entropy was regarded to have no relationship with PFS in the univariable analysis, but when we included T stage as a control variable, entropy had a significant correlation. This result could be explained by the fact that the stage T2 tumor nodules may have high entropy and are likely to progress. Thus, we considered that entropy and smoking were independent factors for PFS and that the potential suppressors were T stage and tumor location. In addition, several parameters were unexpectedly significant in the K-M survival analysis; however, these parameters were not significant in the univariable Cox analysis. This finding could be explained by the fact that the features included in the K-M survival analysis were nonparametric variables, whereas the features included in the Cox regression analysis were parametric variables. In addition, there are differences in the formulas and calculation methods between K-M survival analysis and Cox regression analysis. As for the problem of overfitting in Cox regression analysis, the small sample size did lead to a risk of overfitting. However, to reduce the likelihood of overfitting, we included only one feature in the K-M model, and multivariable Cox analysis showed that only two features had significant prognostic value for PFS. Moreover, our results were meant to be hypothesis generating, and we plan to more patients from multiple centers in the future.
Another issue that needs to be discussed is that, as of this writing, there is not yet a consensus on the prescribed radiation scheme and dose of SBRT for early-stage NSCLC. Notably, SBRT showed good performance on the local control of early-stage NSCLC, and the local control rate was better with a BED of 100Gy or more compared with less than 100Gy.21 However, in our study, the number of patients with local recurrences was too small to be representative; therefore, the radiation scheme and dose could not play a determining role in the survival outcomes. Besides, we translated the value of BED into binary data with a cut-off value of 100Gy to analyze its prognostic effect on survival. In the Cox regression analysis, a BED of more than 100Gy showed no predictive value in either PFS or DSS, which also proves that a BED of 100Gy or more could not affect the survival rate of patients in our study. Furthermore, our study included only 72 textural features analyzed by CGITA; in the future, we could utilize other image processing software to obtain hundreds of radiomics features, such as the image biomarker standardization initiative (IBSI).34 However, it is important to consider the algorithmic differences and the reproducibility35 of features between imaging analysis methods.
The findings of the present study can improve and inform clinical-level decisions. For example, adjustments to the treatment plans of early-stage NSCLC patients stratified into the high-risk group by the discussed textural features should be considered. To prolong the survival time and decrease the probability of recurrence, exploratory adjuvant chemotherapy or immunotherapy can be added to enhance the curative effect.36,37
Our study also has a few limitations in addition to its retrospective nature. First, the sample size was relatively small; additional patients are needed to reduce the likelihood of overfitting. The results were derived from a single institution and thus are hypothesis generating. The findings of the current study require further confirmation in a large cohort recruited from multiple institutions. Another limitation of our study is that the median follow-up was 18 months. A randomized study named stereotactic precision and conventional radiotherapy evaluation (SPACE)38 showed an 18-month PFS rate after SBRT of appropriately 55% and an 18-month OS of nearly 75%, suggesting that the follow-up in our current study was suitable for PFS but was probably not sufficient for DSS. Continual follow-up of our patients and further validation are needed. Third, it would be advantageous to utilize an independent validation set to verify these findings. Finally, the field of radiomics still has a few limitations, such as variability in image acquisition and absence of normalization or preprocessing from original imaging data, which need to be improved with better standardization and imaging protocols.
Conclusion
In this study, we demonstrated that textural features extracted from pretreatment CT scans have prognostic value in early-stage NSCLC patients receiving SBRT.
Acknowledgment
This work was financially supported by grants from the National Key Research and Development Project (2018YFC1313200, 2016YFC0904700), the National Natural Science Foundation of China (81572970), the Shandong Key Research and Development Project (2016CYJS01A03), and the Jinan Scientific and Technology Development Project (201805005).
Disclosure
The authors report no conflicts of interest in this work.
References
1. Timmerman R, Paulus R, Galvin J, et al. Stereotactic body radiation therapy for inoperable early stage lung cancer. JAMA. 2010;303(11):1070–1076. doi:10.1001/jama.2010.261
2. Howington JA, Blum MG, Chang AC, Balekian AA, Murthy SC. Treatment of stage I and II non-small cell lung cancer. Chest. 2013;143(5):e278S–e313S. doi:10.1378/chest.12-2359
3. Nanda RH, Liu Y, Gillespie TW, et al. Stereotactic body radiation therapy versus no treatment for early stage non-small cell lung cancer in medically inoperable elderly patients: a national cancer data base analysis. Cancer. 2015;121(23):4222–4230. doi:10.1002/cncr.29640
4. Spratt DE, Wu AJ, Adeseye V, et al. Recurrence patterns and second primary lung cancers after stereotactic body radiation therapy for early-stage non-small-cell lung cancer: implications for surveillance. Clin Lung Cancer. 2016;17(3):177–183. doi:10.1016/j.cllc.2015.09.006
5. Kann BH, Miccio JA, Stahl JM, et al. Stereotactic body radiotherapy with adjuvant systemic therapy for early-stage non-small cell lung carcinoma: a multi-institutional analysis. Radiother Oncol. 2019;132:188–196. doi:10.1016/j.radonc.2018.10.017
6. Verma V, Cushman TR, Selek U, Tang C, Welsh JW. Safety of combined immunotherapy and thoracic radiation therapy: analysis of 3 single-institutional phase I/II trials. Int J Radiat Oncol Biol Phys. 2018;101(5):1141–1148. doi:10.1016/j.ijrobp.2018.04.054
7. Huang K, Senthi S, Palma DA, et al. High-risk CT features for detection of local recurrence after stereotactic ablative radiotherapy for lung cancer. Radiother Oncol. 2013;109(1):51–57. doi:10.1016/j.radonc.2013.06.047
8. Na F, Wang J, Li C, Deng L, Xue J, Lu Y. Primary tumor standardized uptake value measured on F18-fluorodeoxyglucose positron emission tomography is of prediction value for survival and local control in non–small-cell lung cancer receiving radiotherapy: meta-analysis. J Thorac Oncol. 2014;9(6):834–842. doi:10.1097/JTO.0000000000000185
9. Kwon W, Howard BA, Herndon JE, Patz EF. FDG uptake on positron emission tomography correlates with survival and time to recurrence in patients with stage I non-small-cell lung cancer. J Thorac Oncol. 2015;10(6):897–902. doi:10.1097/JTO.0000000000000534
10. Hoang JK, Hoagland LF, Coleman RE, Coan AD, Herndon JE, Patz EF. Prognostic value of fluorine-18 fluorodeoxyglucose positron emission tomography imaging in patients with advanced-stage non–small-cell lung carcinoma. J Clin Oncol. 2008;26(9):1459–1464. doi:10.1200/JCO.2007.14.3628
11. Agarwal M, Brahmanday G, Bajaj SK, Ravikrishnan KP, Wong C-YO. Revisiting the prognostic value of preoperative (18)F-fluoro-2-deoxyglucose ((18)F-FDG) positron emission tomography (PET) in early-stage (I & II) non-small cell lung cancers (NSCLC). Eur J Nucl Med Mol Imaging. 2010;37(4):691–698. doi:10.1007/s00259-009-1291-x
12. Mattonen SA, Palma DA, Haasbeek CJ, Senan S, Ward AD. Early prediction of tumor recurrence based on CT texture changes after stereotactic ablative radiotherapy (SABR) for lung cancer. Med Phys. 2014;41(3):033502. doi:10.1118/1.4866219
13. Fried DV, Mawlawi O, Zhang L, et al. Stage III non–small cell lung cancer: prognostic value of FDG PET quantitative imaging features combined with clinical prognostic factors. Radiology. 2016;278(1):214–222. doi:10.1148/radiol.2015142920
14. Lovinfosse P, Janvary ZL, Coucke P, et al. FDG PET/CT texture analysis for predicting the outcome of lung cancer treated by stereotactic body radiation therapy. Eur J Nucl Med Mol Imaging. 2016;43(8):1453–1460. doi:10.1007/s00259-016-3314-8
15. Aerts HJ, Velazquez ER, Leijenaar RT, et al. Decoding tumour phenotype by noninvasive imaging using a quantitative radiomics approach. Nat Commun. 2014;5:4006. doi:10.1038/ncomms5006
16. van Timmeren JE, van Elmpt W, Leijenaar RTH, et al. Longitudinal radiomics of cone-beam CT images from non-small cell lung cancer patients: evaluation of the added prognostic value for overall survival and locoregional recurrence. Radiother Oncol. 2019;136:78–85. doi:10.1016/j.radonc.2019.03.032
17. Dennie C, Thornhill R, Souza CA, et al. Quantitative texture analysis on pre-treatment computed tomography predicts local recurrence in stage I non-small cell lung cancer following stereotactic radiation therapy. Quant Imaging Med Surg. 2017;7(6):614–622. doi:10.21037/qims
18. Andratschke N, Zimmermann F, Boehm E, et al. Stereotactic radiotherapy of histologically proven inoperable stage I non-small cell lung cancer: patterns of failure. Radiother Oncol. 2011;101(2):245–249. doi:10.1016/j.radonc.2011.06.009
19. Huynh E, Coroller TP, Narayan V, et al. CT-based radiomic analysis of stereotactic body radiation therapy patients with lung cancer. Radiother Oncol. 2016;120(2):258–266. doi:10.1016/j.radonc.2016.05.024
20. Chi A, Wen S, Liao Z, et al. What would be the most appropriate alpha/beta ratio in the setting of stereotactic body radiation therapy for early stage non-small cell lung cancer. Biomed Res Int. 2013;2013:391021. doi:10.1155/2013/391021
21. Onishi H, Shirato H, Nagata Y, et al. Hypofractionated stereotactic radiotherapy (hypoFXSRT) for stage I non-small cell lung cancer: updated results of 257 patients in a japanese multi-institutional study. J Thorac Oncol. 2007;2(7):S94–S100. doi:10.1097/JTO.0b013e318074de34
22. Pyka T, Bundschuh RA, Andratschke N, et al. Textural features in pre-treatment [F18]-FDG-PET/CT are correlated with risk of local recurrence and disease-specific survival in early stage NSCLC patients receiving primary stereotactic radiation therapy. Radiat Oncol. 2015;10:100. doi:10.1186/s13014-015-0407-7
23. Dong X, Sun X, Sun L, et al. Early change in metabolic tumor heterogeneity during chemoradiotherapy and its prognostic value for patients with locally advanced non-small cell lung cancer. PLoS ONE. 2016;11(6):e0157836. doi:10.1371/journal.pone.0157836
24. Li Q, Kim J, Balagurunathan Y, et al. CT imaging features associated with recurrence in non-small cell lung cancer patients after stereotactic body radiotherapy. Radiat Oncol. 2017;12(1):158. doi:10.1186/s13014-017-0892-y
25. Trovo M, Linda A, El Naqa I, Javidan-Nejad C, Bradley J. Early and late lung radiographic injury following stereotactic body radiation therapy (SBRT). Lung Cancer. 2010;69(1):77–85. doi:10.1016/j.lungcan.2009.09.006
26. Palma DA, Senan S, Haasbeek CJA, Verbakel WFAR, Vincent A, Lagerwaard F. Radiological and clinical pneumonitis after stereotactic lung radiotherapy: a matched analysis of three-dimensional conformal and volumetric-modulated arc therapy techniques. Int J Radiat Oncol Biol Phys. 2011;80(2):506–513. doi:10.1016/j.ijrobp.2010.02.032
27. Videtic GMM, Stitt LW, Dar AR, et al. Continued cigarette smoking by patients receiving concurrent chemoradiotherapy for limited-stage small-cell lung cancer is associated with decreased survival. J Clin Oncol. 2003;21(8):1544–1549. doi:10.1200/JCO.2003.10.089
28. Fischer-Valuck BW, Durci M, Katz SR, et al. Influence of patient characteristics on survival following treatment with helical stereotactic body radiotherapy (SBRT) in stage I non-small-cell lung cancer. Thorac Cancer. 2013;4(1):27–34. doi:10.1111/j.1759-7714.2012.00137.x
29. Miller CJ, Martin B, Stang K, et al. Predictors of distant failure after stereotactic body radiation therapy for stages I to IIA non-small-cell lung cancer. Clin Lung Cancer. 2019;20(1):37–42. doi:10.1016/j.cllc.2018.09.002
30. Clarke K, Taremi M, Dahele M, et al. Stereotactic body radiotherapy (SBRT) for non-small cell lung cancer (NSCLC): is FDG-PET a predictor of outcome? Radiother Oncol. 2012;104(1):62–66. doi:10.1016/j.radonc.2012.04.019
31. Takeda A, Sanuki N, Fujii H, et al. Maximum standardized uptake value on FDG-PET is a strong predictor of overall and disease-free survival for non small-cell lung cancer patients after stereotactic body radiotherapy. J Thorac Oncol. 2014;9(1):65–73. doi:10.1097/JTO.0000000000000031
32. Tanaka H, Hayashi S, Hoshi H. Pretreatment maximum standardized uptake value on 18F-fluorodeoxyglucose positron emission tomography is a predictor of outcome for stage I non-small cell lung cancer after stereotactic body radiotherapy. Asia Pac J Clin Oncol. 2016;12(1):e113–117. doi:10.1111/ajco.12128
33. Li Q, Kim J, Balagurunathan Y, et al. Imaging features from pretreatment CT scans are associated with clinical outcomes in nonsmall-cell lung cancer patients treated with stereotactic body radiotherapy. Med Phys. 2017;44(8):4341–4349. doi:10.1002/mp.2017.44.issue-8
34. Zwanenburg ALS, Vallières M, Löck S Image biomarker standardisation initiative. arXiv preprint arXiv:161207003.
35. Zwanenburg A. Radiomics in nuclear medicine: robustness, reproducibility, standardization, and how to avoid data analysis traps and replication crisis. Eur J Nucl Med Mol Imaging. 2019. doi:10.1007/s00259-019-04391-8
36. Chen Y, Guo W, Lu Y, Zou B. Dose-individualized stereotactic body radiotherapy for T1-3N0 non-small cell lung cancer: long-term results and efficacy of adjuvant chemotherapy. Radiother Oncol. 2008;88(3):351–358. doi:10.1016/j.radonc.2008.07.013
37. Bernstein MB, Krishnan S, Hodge JW, Chang JY. Immunotherapy and stereotactic ablative radiotherapy (ISABR): a curative approach? Nat Rev Clin Oncol. 2016;13(8):516–524. doi:10.1038/nrclinonc.2016.30
38. Nyman J, Hallqvist A, Lund JA, et al. SPACE - A randomized study of SBRT vs conventional fractionated radiotherapy in medically inoperable stage I NSCLC. Radiother Oncol. 2016;121(1):1–8. doi:10.1016/j.radonc.2016.08.015
 © 2019 The Author(s). This work is published and licensed by Dove Medical Press Limited. The
full terms of this license are available at https://www.dovepress.com/terms
and incorporate the Creative Commons Attribution
- Non Commercial (unported, 3.0) License.
By accessing the work you hereby accept the Terms. Non-commercial uses of the work are permitted
without any further permission from Dove Medical Press Limited, provided the work is properly
attributed. For permission for commercial use of this work, please see paragraphs 4.2 and 5 of our Terms.
© 2019 The Author(s). This work is published and licensed by Dove Medical Press Limited. The
full terms of this license are available at https://www.dovepress.com/terms
and incorporate the Creative Commons Attribution
- Non Commercial (unported, 3.0) License.
By accessing the work you hereby accept the Terms. Non-commercial uses of the work are permitted
without any further permission from Dove Medical Press Limited, provided the work is properly
attributed. For permission for commercial use of this work, please see paragraphs 4.2 and 5 of our Terms.