Back to Journals » OncoTargets and Therapy » Volume 12
Prognostic implications and oncogenic roles of MYBL2 protein expression in esophageal squamous-cell carcinoma
Authors Qin H, Li Y, Zhang H, Wang F, He H, Bai X, Li S
Received 8 October 2018
Accepted for publication 29 January 2019
Published 8 March 2019 Volume 2019:12 Pages 1917—1927
DOI https://doi.org/10.2147/OTT.S190145
Checked for plagiarism Yes
Review by Single anonymous peer review
Peer reviewer comments 2
Editor who approved publication: Dr Leo Jen-Liang Su
Hui Qin,1 Yunyun Li,1,2 Hongyan Zhang,1 Feng Wang,1 Hongliu He,1 Xue Bai,1 Shanshan Li1
1Department of Pathology, School of Basic Medical Sciences, Zhengzhou University and First Affiliated Hospital of Zhengzhou University, Zhengzhou, Henan 450001, China; 2Department of Stomatology, First Affiliated Hospital of Zhengzhou University, Zhengzhou, Henan 450052, China
Background: The MYBL2 gene, a highly conserved member of the Myb transcription-factor family, has been implicated in the genesis and progression of many types of tumors.
Methods: We analyzed the expression of MYBL2 and Ki67 in tissue samples of esophageal squamous-cell carcinoma (ESCC) patients by immunohistochemistry. We further analyzed the effect of MYBL2 on cell proliferation and DNA replication using a CCK8 assay, 5-ethynyl- 2'-deoxyuridine–retention assay, flow-cytometry analysis, real-time quantitative PCR, Western blot, and a xenograft model of ESCC cells in nude mice.
Results: MYBL2 expression was significantly higher in ESCC tissue when compared to the adjacent normal tissue (P=0.007). MYBL2 was found to be positively correlated with Ki67 (γ=0.286, P=0.003). Furthermore, Kaplan–Meier curves indicated that MYBL2 expression in ESCC tissue was associated with poor patient outcome (P<0.001), with MYBL2-positive patients who exhibited high Ki67 expression in ESCC tissue showing the worst prognosis for overall survival (P=0.003). Our in vitro results showed that downregulation of MYBL2 in ESCC cell lines inhibited cell proliferation and DNA replication (P<0.05 for both). We also found that loss of MYBL2 caused a reduction in levels of cell cycle-related G2/M proteins CDK1 and cyclin B1 in ESCC cells. In contrast, overexpression of MYBL2 caused an increase in these proteins. In vivo, we found that in nude mice that received cells knocked down for MYBL2, tumor growth was inhibited in comparison to the group that received control cells (P<0.05).
Conclusion: MYBL2 overexpression induces tumor proliferation in ESCC cells by regulating cell-cycle at the S and G2/M phase. Therefore, MYBL2 may serve as a novel prognostic biomarker in ESCC patients.
Keywords: MYBL2, esophageal squamous cell carcinoma, Ki-67, tumor proliferation
Introduction
Esophageal squamous-cell carcinoma (ESCC) remains a predominant subtype of esophageal tumors in China. It is a rapidly progressing cancer with poor prognosis, due to frequent tumor recurrence after surgery.1 Improved understanding of the underlying molecular mechanisms of tumorigenesis and progression of ESCC and identification of novel therapeutic targets are of critical clinical importance.
MYBL2, a highly conserved member of the Myb transcription-factor family, is generally expressed in rapidly dividing cells, especially in adult hematopoietic and embryonic stem cells.2–4 MYBL2 upregulates genes that promote cell cycle entry into S and M phases3 and promotes cell proliferation.5,6 Studies have shown that the DREAM (DP, RB-like proteins, E2Fs, and MuvB core) complex, which represses most cell-cycle genes during cellular quiescence,7 binds to the MYBL2 promoter and suppresses MYBL2 expression in the G0/G1 phase. Upon entry into the G1/S phase, the RB-like proteins dissociate from the MuvB core and E2Fs thus allowing activator E2Fs to transactivate MYBL2 in the G1/S phase. Subsequently, MYBL2 is upregulated and becomes associated with the MuvB core and FOXM1 to transactivate late-cell-cycle G2/M genes.7 MYBL2 is aberrantly expressed in various malignancies, including colorectal cancer,8 pancreatic ductal adenocarcinoma,9 and lung cancer.10 MYBL2 has also been linked to patient prognosis in a broad range of tumor types.8–12 These data indicate that MYBL2 is involved in cell proliferation and carcinogenesis. Qin et al showed a close association between MYBL2 and proliferation and migration in ESCC.13 However, the effects of the oncogenic function of MYBL2 in ESCC remain unexplored.
We investigated expression of the MYBL2 protein and the Ki67 proliferation marker in ESCC patients. The correlation between these two proteins was used to characterize the relationship between MYBL2 and ESCC-cell proliferation. Additionally, we also evaluated a correlation between MYBL2 overexpression and the poor prognosis of ESCC patients. Finally, we examined the oncogenic function of MYBL2 in vitro and in vivo.
Methods
Patients and tissue samples
This study was approved by the Ethics Review Committee of the First Affiliated Hospital of Zhengzhou University. The study was performed in accordance with the Declaration of Helsinki and the guidelines of the committee. Written informed consent was obtained from each patient enrolled in the study. Formalin-fixed, paraffin-embedded cancer tissue and adjacent noncancerous tissue from 107 patients with histopathological confirmation of ESCC diagnosed between 2012 and 2013 were obtained. This cohort included samples from 66 males and 41 females with a mean age of 61.5±8.3 years. None of the patients had received preoperative radio- or chemotherapy. Clinicopathological data of the patients is shown in Table 2. Tumor staging was evaluated based on the TNM system of esophageal cancer designed jointly by the Union for International Cancer Control and the American Joint Committee on Cancer.14 Patients were followed up from the date of surgical resection, with an average follow-up of 39.0±1.8 months. Overall survival (OS) was defined as the period between the date of initial surgery and death or the last follow-up.
Cell lines and cell culture
The EC9706, TE7, and EC109 cell lines were purchased from the Tumor Research Institute of the Chinese Academy of Sciences and the KYSE510 cell line purchased from the American Type Culture Collection (Manassas, VA, USA). Cell lines were cultured in RPMI 1640 medium (Solarbio, Beijing, China) supplemented with 10% FBS (Dakewe, Shenzhen, China) in an incubator containing 5% CO2 at 37°C, 100 μg/mL streptomycin, and 100 units/mL penicillin.
Immunohistochemistry and evaluation of staining
Tissue sections were incubated with rabbit anti-MYBL2 polyclonal antibody (1:200; Abcam, Cambridge, UK), anti-Ki67 (1:200; Proteintech, Chicago, IL, USA), anti-CDK1, and anti-cyclin B1 (1:200; Proteintech) according to standard immunoperoxidase-staining procedure. Firstly, 5 μm-thick sections were deparaffinized with xylene, rehydrated in an alcohol gradient, immersed in 3% H2O2, and then incubated with primary antibodies at 4°C overnight. The sections were then developed using a DAB color kit. Sections were evaluated by two independent pathologists. Positive staining of MYBL2 was observed in the nuclei and cytoplasm:15 Ki67 in the nuclei,16 CDK1 and cyclin B1 mainly in the cytoplasm. Five fields of vision were randomly selected (with at least 200 cells per field) per section at 400× magnification. MYBL2, CDK1, and cyclin B1 staining were scored in terms of percentage of positive cells (1, <30%; 2, 30%–70%; 3, >70%) and fluorescence intensity (0, negative; 1, weak; 2, moderate; 3, strong). The product of the intensity score and the distribution score was used as the staining score. Specimens with a final staining score of 0–1 were considered negative and those with scores ≥2 positive. The Ki67 index was defined as the percentage of Ki67-positive cells and categorized as having a low (<5% of cells with positive nuclear staining) or high (≥5% of cells with positive nuclear staining) value.
Quantitative real-time PCR
Total RNA was isolated using Trizol reagent (Takara, Kusatsu, Japan) and cDNA synthesized with random primers and a HiScript II Q RT SuperMix kit (Vazyme Biotech, Nanjing, China). Primer sequences used were MYBL2 (forward 5′-ATGTCCAGTGCCTGGAAGAC-3′, reverse 5′-GATGAGGGTCCGAGATGTGT-3′) and GAPDH (forward 5′-GCTGAACGGGAAGCTCACTG-3′, reverse 5′-GTGCTCAGTGTAGCCCAGGA-3′). mRNA-expression levels were measured with quantitative PCR using the SYBR Green method (Vazyme Biotech) and the 7500 Fast real-time PCR system (Applied Biosystems, Foster City, CA, USA).
Lentivirus-mediated RNA interference
An shRNA (5′-GCCCAAGAGCACACCTGTTAA-3′) was constructed to target MYBL2 in subsequent experiments. Nonsilencing scrambled shRNA (5′-TTCTCCGAACGTGTCACGT-3′) was used as a negative control. shMYBL2 and scrambled shRNA were inserted into a GenePharma supersilencing vector (pGLVH1/GFP + puromycin). Recombinant lentiviruses expressing MYBL2 shRNA or scrambled shRNA (Lv-shMYBL2 and Lv-shNC, respectively) were produced by GenePharma (Shanghai, China). EC9706 cells were transduced with concentrated virus and stable MYBL2-knockdown clones were then selected with puromycin (Solarbio) for 2 weeks.
Construction of plasmids and transfection
Full-length MYBL2 cDNA (GenBank accession number NM_002466) was cloned into the LV5-expression vector (GenePharma), which was then transfected into KYSE510 cells. These cells were cultured with puromycin for 2 weeks to select stable MYBL2-expressing clones. Aspecific sequence-transfected cells (NC) were used as a control.
Cell-proliferation assay
Approximately 0.8×10³ EC9706 cells and 0.5×10³ KYSE510 cells were seeded onto 96-well plates. A CCK8 assay (Dojindo, Kumamoto, Japan) was used to assess cell proliferation according to the manufacturer’s instructions. Cell-proliferation curves were plotted using the absorbance at each time point.
EdU-retention assays
A Fluor 555 5-ethynyl-2′-deoxyuridine (EdU) cell-proliferation assay kit (KeyGen, Nanjing, China) was used to examine the effect of MYBL2 on DNA synthesis. ESCC cells were then seeded onto 24-well plates at a density of 1–2×10⁴ cells per well and cultured for 24 hours. Cells were exposed to 50 μM EdU for 2 hours in an incubator, fixed in 4% paraformaldehyde for 30 minutes, permeabilized with 0.5% Triton X-100 for 10 minutes, and then reacted with an Apollo reaction cocktail (KeyGen) for 30 minutes. Subsequently, the cellular DNA content was stained with Hoechst 33342 (KeyGen) for 30 minutes and visualized under fluorescence microscopy.
Flow-cytometry cell-cycle analysis
ESCC cells were harvested using 0.25% trypsin digestive solution (Salab, Beijing, China) without EDTA. They were then washed twice with PBS and fixed in 70% ethanol at 4°C overnight. Cells were then washed with PBS and incubated in a solution containing 10 mg/mL RNase and 1 mg/mL propidium iodide (KeyGen) at 37°C for 30 minutes in the dark. DNA content was determined using flow cytometry (BD Biosciences), then the percentage of cells in the G0/G1, S, and G2/M phases was determined using CellQuest acquisition software (BD Biosciences).
Western blotting
Cells were lysed using RIPA buffer (Solarbio) and protein concentrations of cell lysates measured in terms of absorbance (OD562) with a BCA protein-assay kit (Biotech Well, Shanghai, China). Total proteins were separated using SDS-PAGE of appropriate density, then transferred onto a polyvinylidene difluoride membrane at 90 mV for 1.5 hours. The blots were blocked and incubated overnight with the primary antibody at 4°C, and then incubated with the secondary antibody for 1.5 hours at room temperature. The primary antibodies and their dilutions were anti-MYBL2 (1:1,000; Abcam), anti-CDK1, anti-cyclin B1, anti-p21 (1:500; Proteintech), and anti-β-actin (1:1,000; Proteintech). Secondary antibodies (1:2,000) were purchased from Bioss (Shanghai, China). All experiments were repeated three times.
Tumor xenografts
Five-week-old female BALB/c nu/nu mice were purchased from Vital River, Beijing, China. All animal experiments were approved by the Laboratory Animal Management Committee of Zhengzhou University. The animal experiments were conducted in accordance with institutional guidelines and the Guide for the Care and Use of Laboratory Animals (NIH 85-23, revised 1996). EC9706 cells transfected with Lv-shNC or Lv-shMYBL2 were injected subcutaneously (5×10⁶ per mouse) into the dorsal region of the mice (n=5 per group). Tumor volume (length × width2 × 0.5) was monitored every 3 days postinjection. Mice were euthanized 22 days postimplantation. Tumors were weighed and tissue processed for H&E staining and immunohistochemistry.
Statistical analysis
SPSS software (version 23.0) was used for statistical analyses. Pearson’s χ2 test was used to analyze the association of MYBL2 expression with clinicopathological features. We used Spearman’s rank-correlation coefficient to determine the correlation between MYBL2 and Ki67 index values. Kaplan–Meier plots and log-rank tests were used for survival analyses. Next, we conducted univariate and multivariate analysis to analyze independent prognostic factors. Two-tailed Student’s t-tests were used to compare means of the groups. Values are presented as a means ± SD of three replicate assays, and P<0.05 was considered statistically significant.
Results
Expression of MYBL2 and Ki67 in ESCC
The expression of MYBL2 and Ki67 was examined in cancer tissue and adjacent noncancerous tissue from 107 patients. Our results indicated that MYBL2 staining was localized to the nuclei and cytoplasm in 71% (76 of 107) of the ESCC tissue (Figure 1A) cells, which was significantly higher than the staining observed in the corresponding nontumor tissue (34 of 107 positivity, 31.8%; P=0.007; Table 2, Figure 1B). Ki67, a cell-proliferation marker, was observed in nuclei in ESCC tissue cells (71 of 107, 66.4%, Figure 1C), but was barely expressed in corresponding nontumor tissue (proportion of positive cells <5%, Figure 1D). Furthermore, high MYBL2 expression was found to be significantly associated with histological differentiation (P=0.022), tumor invasion (P<0.001), lymph-node metastasis (P=0.01), and clinical stage (P<0.001, Table 2). High Ki67 expression was correlated mainly with histological grade (P=0.01, Table 2).
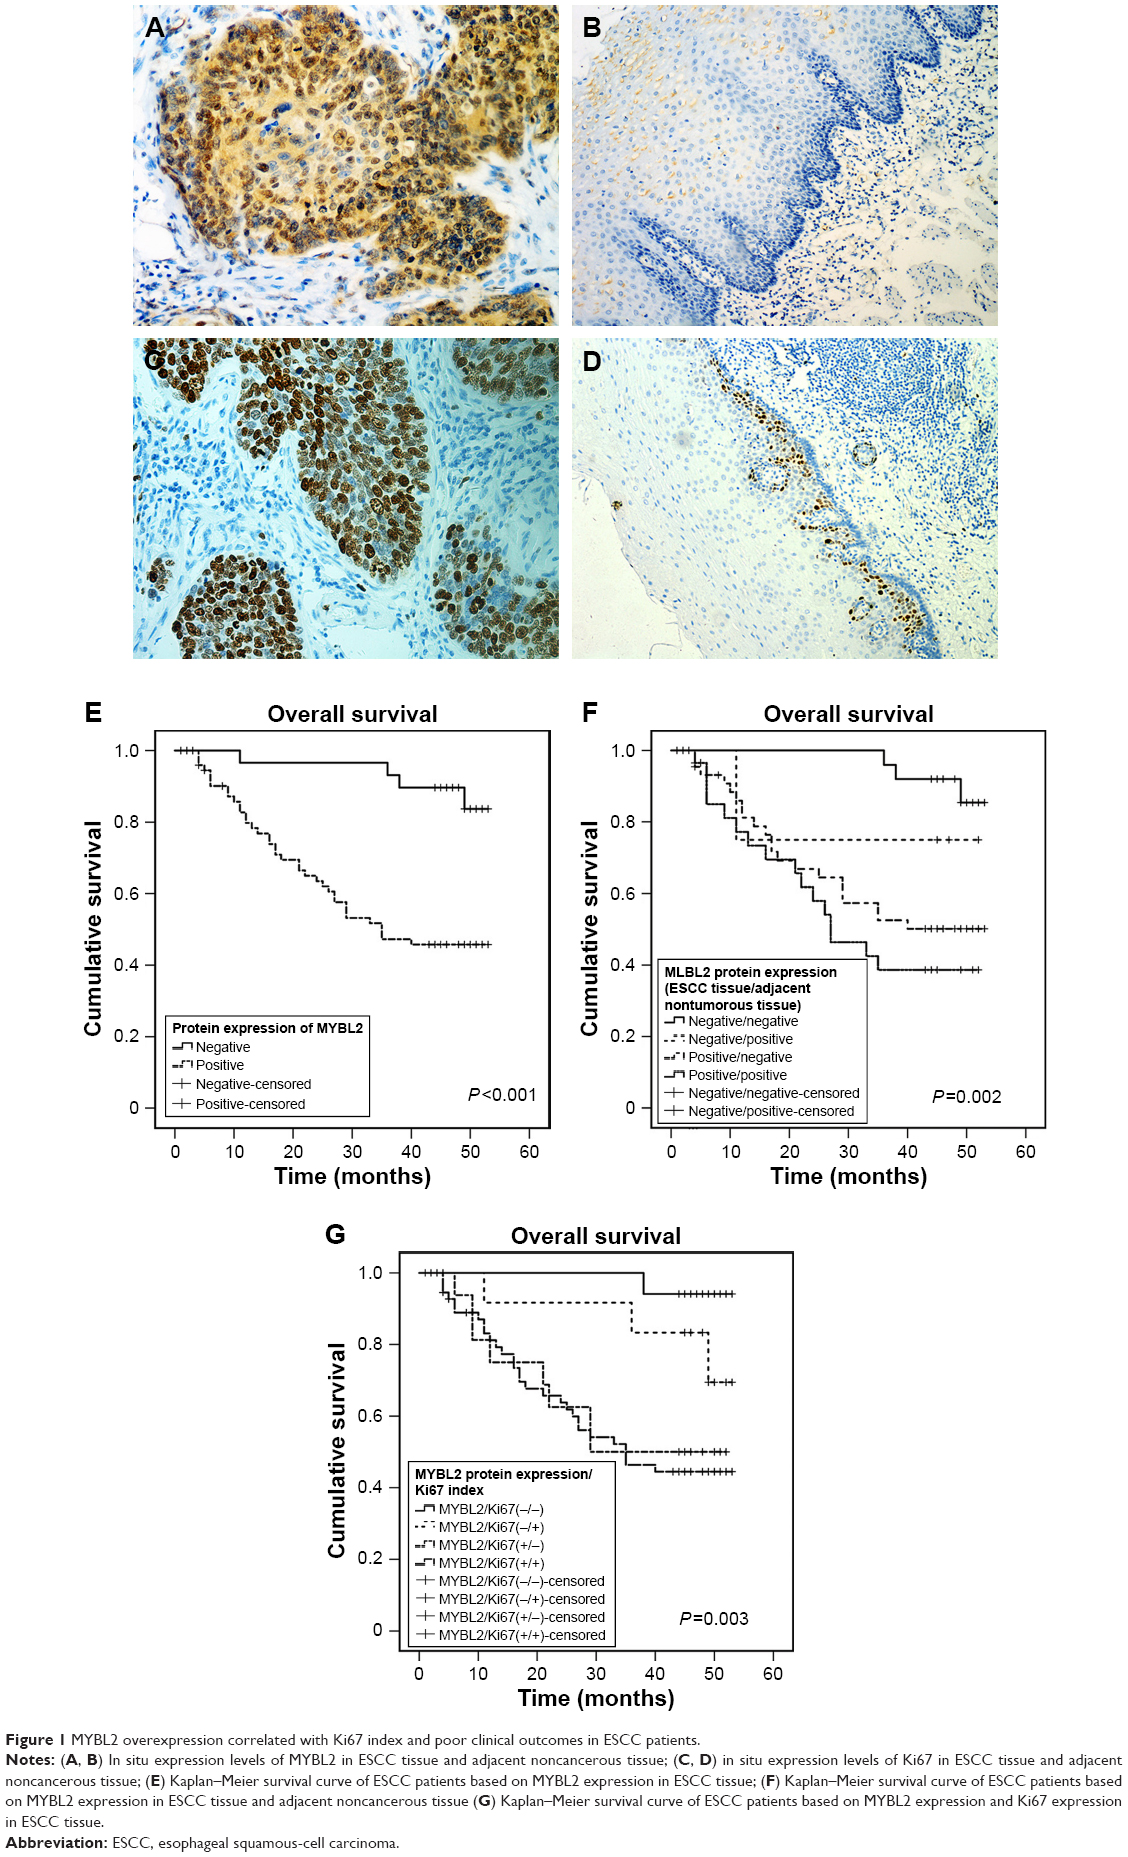 | Figure 1 MYBL2 overexpression correlated with Ki67 index and poor clinical outcomes in ESCC patients. |
To assess the association between MYBL2 expression and Ki67 index in patients with ESCC, patients were divided into two groups based on MYBL2-expression levels. Expression of Ki67 was dramatically higher in ESCC tissue with high MYBL2 expression (57 of 76, 75%) when compared to tissue with low MYBL2 expression (14 of 31, 45.2%; P=0.003; Table 2). Additionally, MYBL2 protein expression was positively correlated with Ki67 index values measured by Spearman’s rank-correlation test (Spearman’s γ=0.286, P=0.003; Table 1).
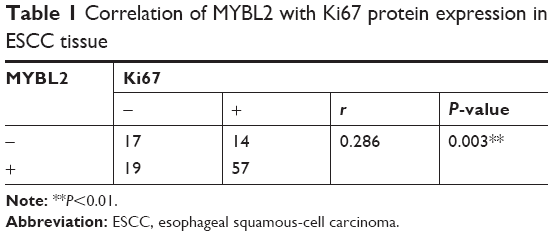 | Table 1 Correlation of MYBL2 with Ki67 protein expression in ESCC tissue |
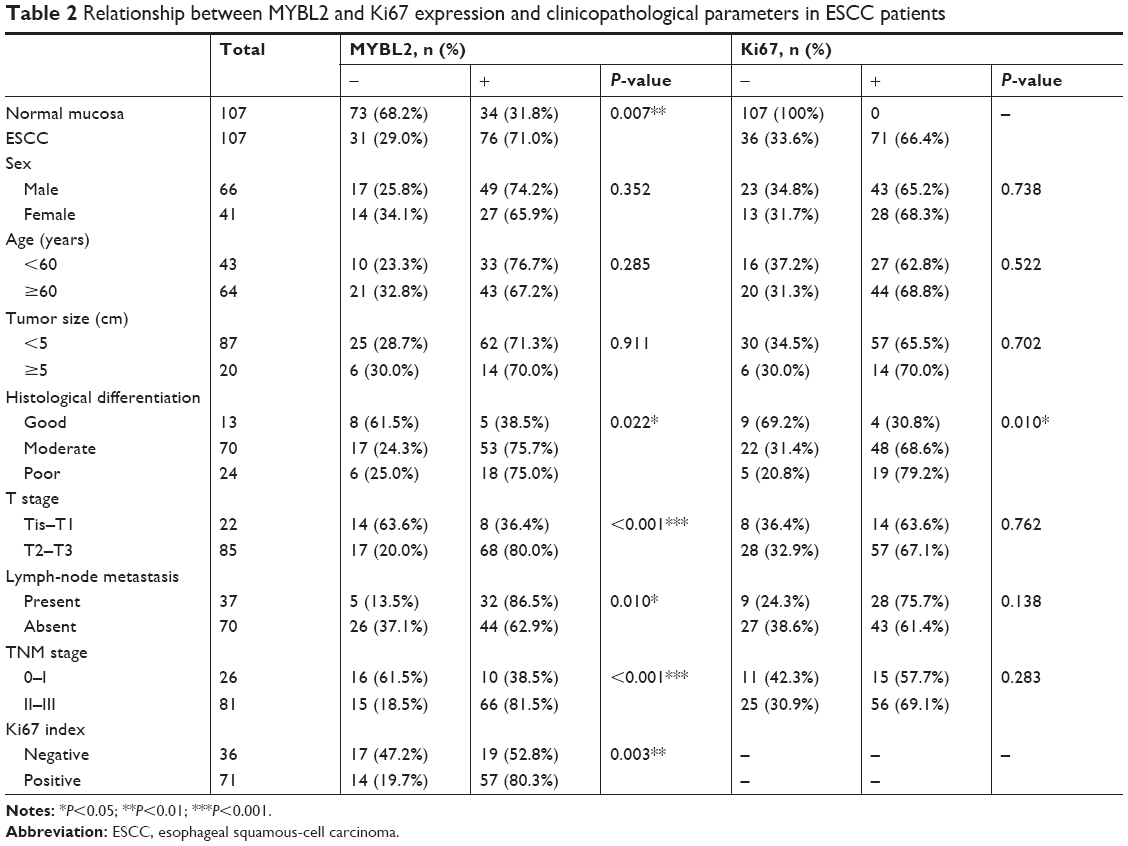 | Table 2 Relationship between MYBL2 and Ki67 expression and clinicopathological parameters in ESCC patients |
High MYBL2 expression correlated positively with poor outcomes in ESCC patients
Kaplan–Meier analysis showed that elevated MYBL2 expression in ESCC tissue was negatively associated with postoperative OS in ESCC patients (P<0.001, Figure 1E). We divided patients into four groups according to the expression of MYBL2 in ESCC tissue and adjacent noncancerous tissue. Patient groups that were positive for MYBL2 in both ESCC tissue and adjacent noncancerous tissue showed the worst prognosis for OS (P=0.002, Figure 1F). We further divided patients into four groups according to the expression of MYBL2 and Ki67. The MYBL2-positive patient group exhibiting higher expression of Ki67 in ESCC tissue showed the worst prognosis for OS (P=0.003, Figure 1G). Univariate Cox regression analysis confirmed that histological differentiation (P=0.005), tumor invasion (P=0.02), lymph-node metastasis (P<0.001), clinical stage (P=0.025), and high Ki67 (P=0.046) and MYBL2 expression (P=0.001) were negatively correlated with postoperative survival in ESCC patients. Variables associated with OS obtained from univariate Cox regression analysis were included in the multivariate analysis using Cox’s proportional-hazard model. The result further confirmed that MYBL2 expression was negatively correlated with postoperative survival, indicating that MYBL2 expression (HR 5.977; 95% CI 1.770–20.185; P=0.004; Table 3) is an independent prognostic marker in ESCC patients.
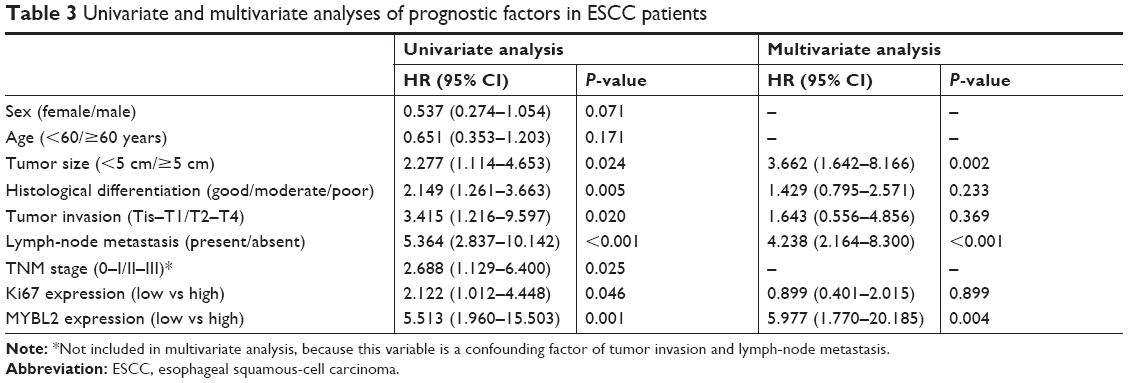 | Table 3 Univariate and multivariate analyses of prognostic factors in ESCC patients |
MYBL2 promoted ESCC-cell proliferation in vitro
Next, we analyzed MYBL2 mRNA and protein levels in TE7, EC9706, EC109, and KYSE510 cell lines (Figure 2A). To examine the function of MYBL2 in ESCC cells, we transduced the EC9706 cell line with Lv-shNC and Lv-shMYBL2 to suppress MYBL2 expression. Further, KYSE510 cell lines were transfected with an MYBL2-expression vector to overexpress MYBL2. The effect of MYBL2 overexpression on ESCC-cell proliferation was measured by CCK8 assay. Results revealed that cell growth was inhibited in cells transfected with Lv-shMYBL2 shRNA in comparison to the cells transfected with control shRNA (P<0.05, Figure 2B). In contrast, overexpression of MYBL2 accelerated cell growth in KYSE510 cells (P<0.05, Figure 2B). We further investigated the effect of MYBL2 expression on ESCC-cell proliferation using the EdU-retention assay. The percentage of EdU-positive EC9706 cells with downregulated MYBL2 was significantly decreased when compared to the control cells (P<0.05, Figure 2C and D). In contrast, KYSE510 cells overexpressing MYBL2 exhibited increased percentages of EdU-positive cells compared to the control cells (P<0.05, Figure 2C and D). Therefore, MYBL2 promoted proliferation and DNA synthesis in ESCC cells.
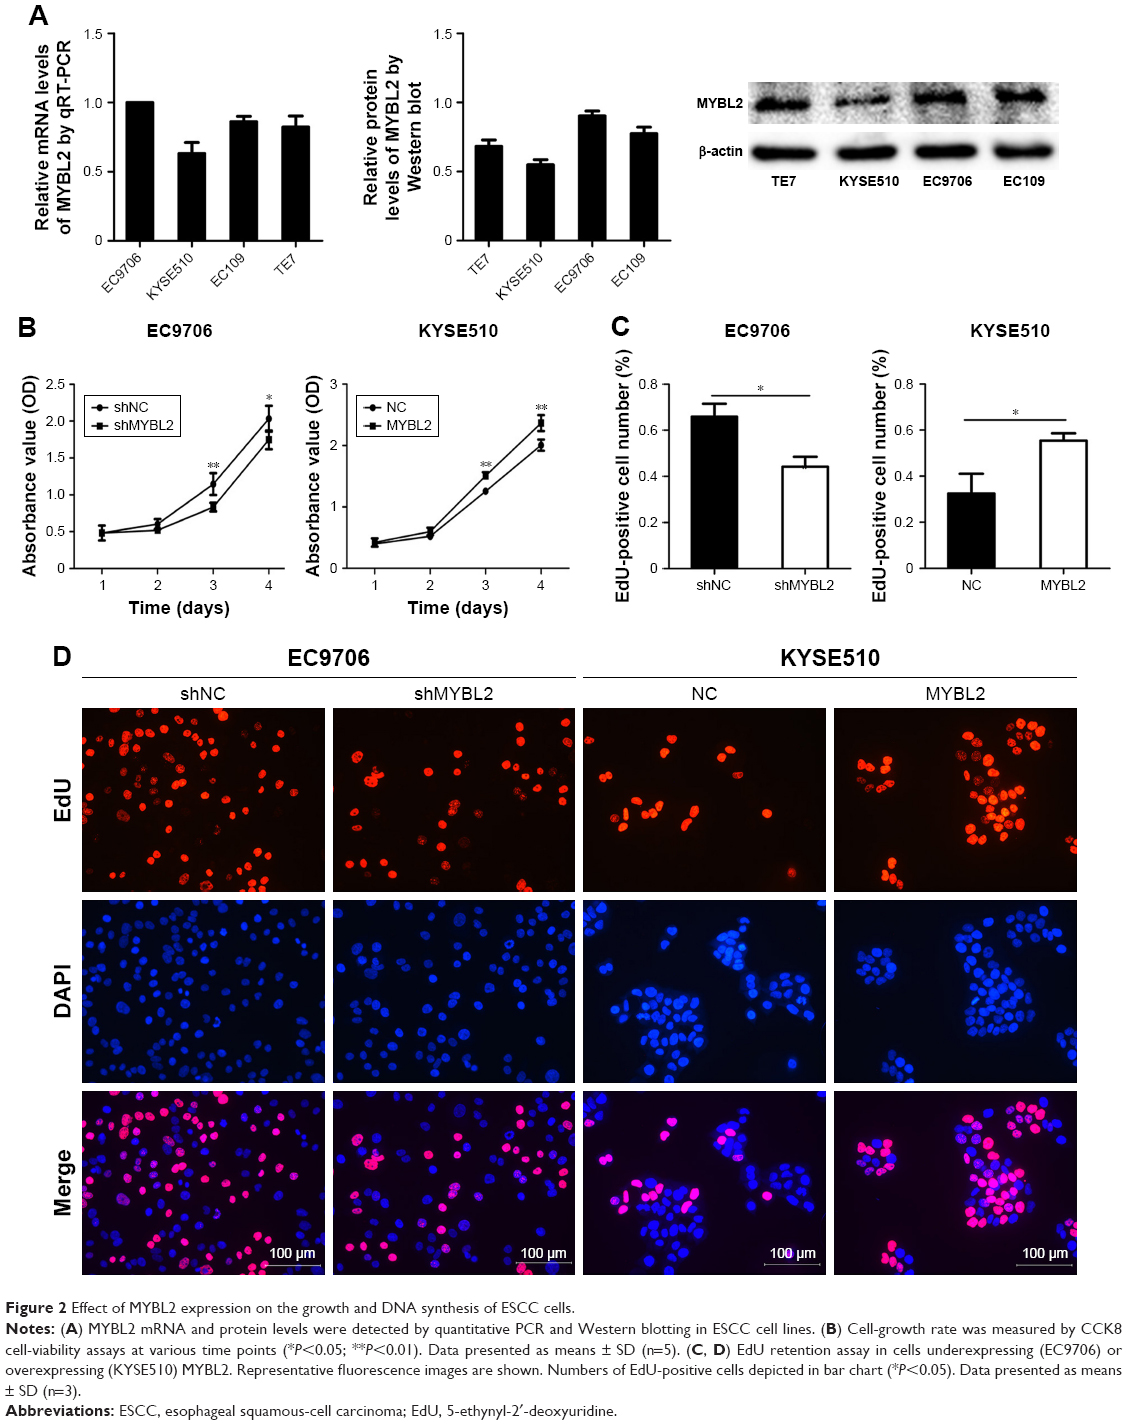 | Figure 2 Effect of MYBL2 expression on the growth and DNA synthesis of ESCC cells. |
Effect of MYBL2 expression on cell cycle in ESCC
The effect of MYBL2 expression on ESCC cell-cycle progression was measured by flow cytometry. We found that the proportion of cells in the G2/M phase was increased in EC9706 cells knocked down for MYBL2. In contrast, the proportion of cells in the S phase was increased in ESCC cells overexpressing MYBL2 (Figure 3A). Furthermore, we detected the expression of the cell-cycle-related G2/M proteins CDK1 and cyclin B1 in ESCC using Western blot. Loss of MYBL2 caused a reduction in CDK1 and cyclin B1 levels in ESCC cells, whereas these proteins were upregulated in KYSE510 cells overexpressing MYBL2 (Figure 3B). We also analyzed the protein expression of the cell-cycle-related gene CDKN1A (p21). We found that p21 level was upregulated in cells with suppressed MYBL2 and downregulated in cells overexpressing MYBL2 (Figure 3B). These results demonstrated that MYBL2 protein levels played a vital role in regulating cell-cycle progression in ESCC.
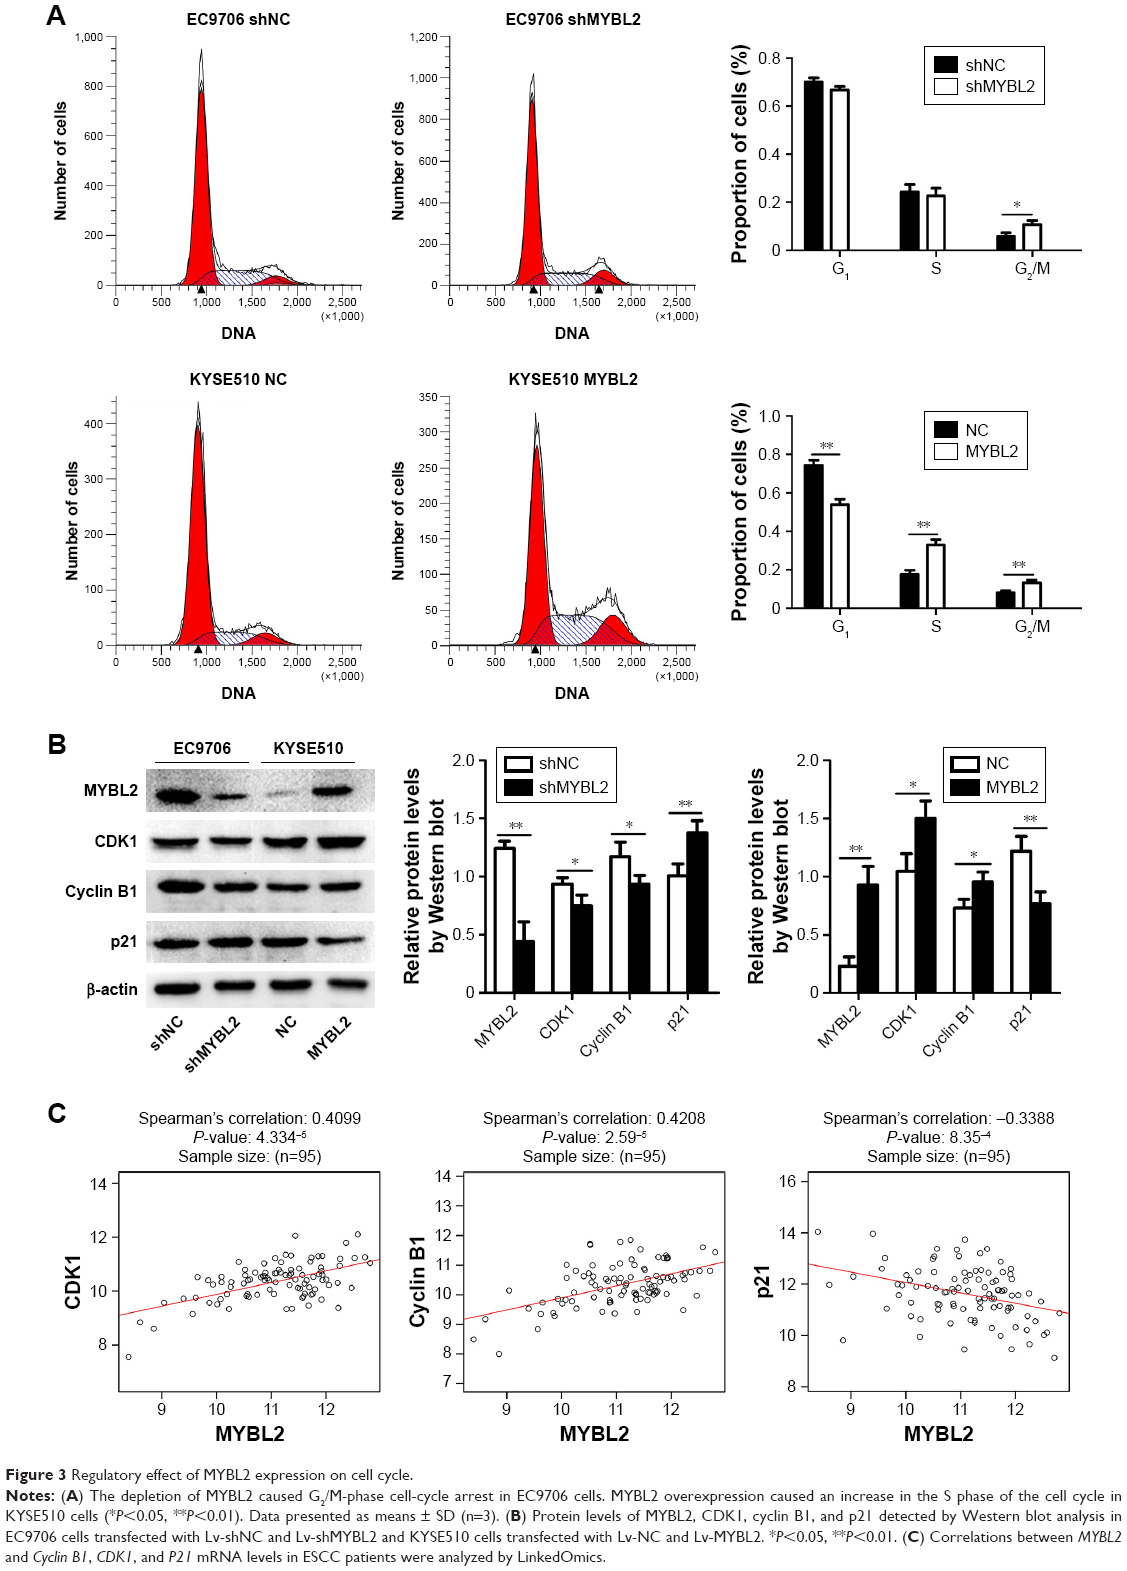 | Figure 3 Regulatory effect of MYBL2 expression on cell cycle. |
Next, we used LinkedOmics (http://www.linkedomics.org) to assess correlations between MYBL2, CyclinB1, CDK1 and p21 mRNA levels in ESCC patients (Figure 3C). We found that MYBL2 was positively correlated with Cyclin B1 and CDK1 and negatively correlated with p21. These findings further confirmed our observations in ESCC cell lines under- or overexpressing MYBL2.
MYBL2 promoted ESCC-cell growth in a xenograft mouse model
In order to assess the effect of MYBL2 on ESCC cells in vivo, we established a xenograft mouse model where EC9706 cells transfected with Lv-shNC or Lv-shMYBL2 were injected subcutaneously into the dorsal region of the mice. We found that in mice that received MYBL2-depleted cells, the xenograft tumors were significantly reduced in terms of weight and volume when compared to the control xenografts (P<0.05, Figure 4A). In addition, immunohistochemistry analysis indicated that MYBL2-depleted tumor tissue had a marked decrease in Ki67 expression, suggesting that the loss of MYBL2 inhibited tumor proliferation (Figure 4B and C). We also found that MYBL2-depleted tumor tissue had a marked decrease in cyclin B1 and CDK1 expression (Figure 4B and C), which further confirmed our findings in vitro. Taken together, our results suggest that MYBL2 plays a role in tumor growth and cell-cycle progression in ESCC cells.
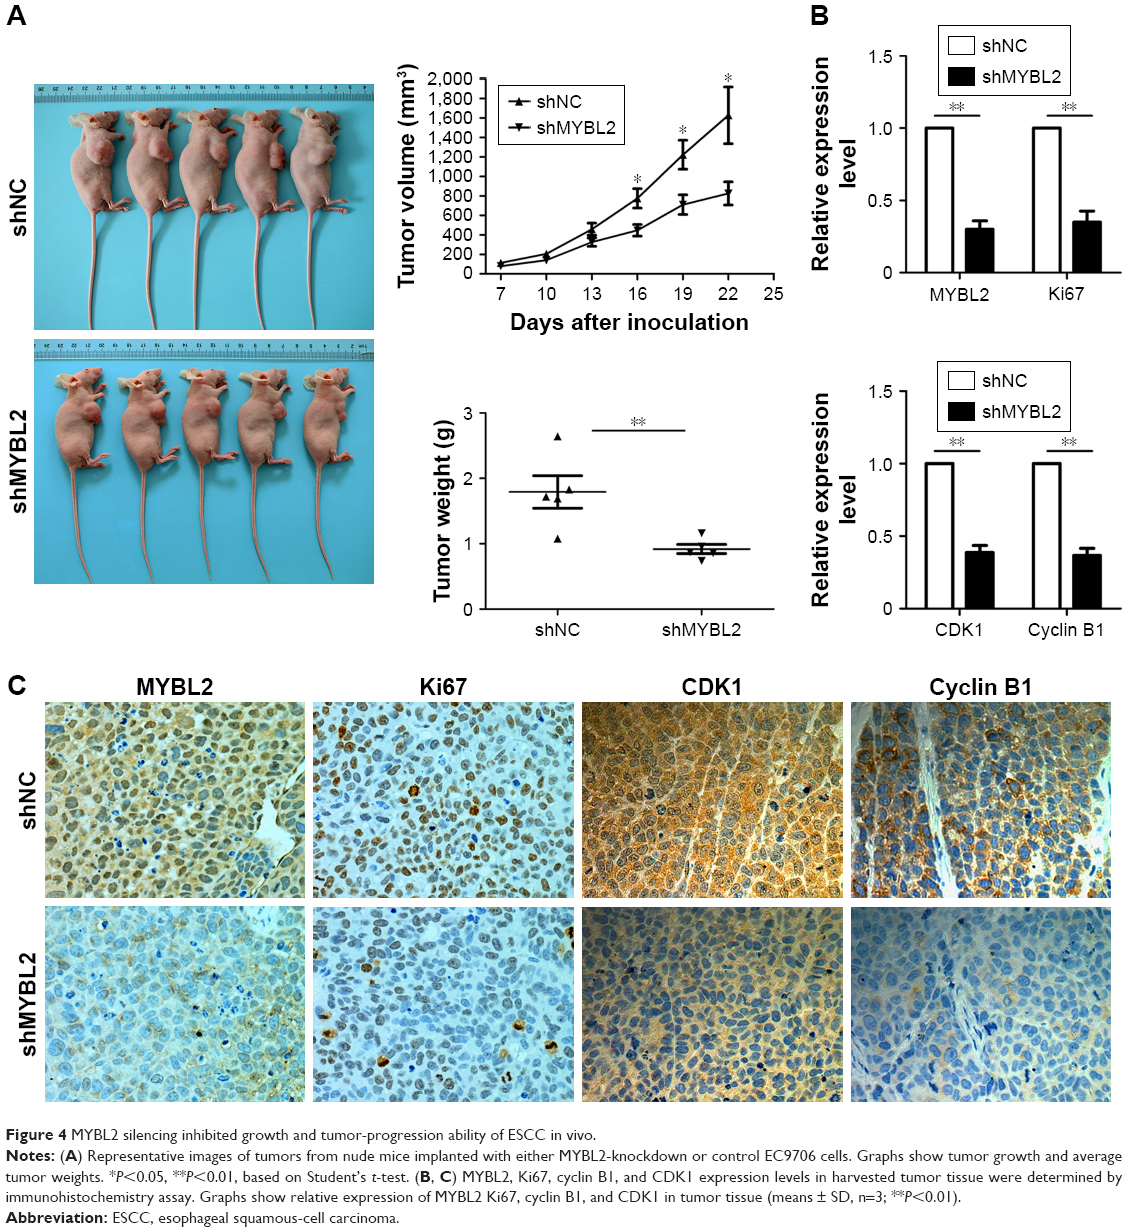 | Figure 4 MYBL2 silencing inhibited growth and tumor-progression ability of ESCC in vivo. |
Discussion
MYBL2 is upregulated in various cancer types and has been implicated in cancer pathogenesis.8–12 Previous studies have found that MYBL2 promotes tumor-cell proliferation in breast cancer and gallbladder cancer.17,18 In our study, elevated MYBL2 expression was observed in ESCC tissue when compared to corresponding nontumor tissue in ESCC patients. This is consistent with a previous study suggesting that MYBL2 may contribute to tumor development in ESCC patients.13
We measured levels of the Ki67 proliferation marker in ESCC tissue and found that MYBL2 expression was positively correlated with Ki67. We also observed that elevated expression of MYBL2 was significantly associated with clinical stage, lymph-node metastasis, and poor outcomes in ESCC patients. Additionally, we found that MYBL2-positive patients who also exhibited a higher expression of Ki67 in ESCC tissue had the worst prognosis in OS. These findings are in agreement with other research that correlated MYBL2 with poor prognosis in patients with colorectal cancer8 and human glioma.11
Considering the relationship between MYBL2 and ESCC proliferation based on our findings, we used in vitro and in vivo experiments to study the effect of MYBL2 on cell proliferation further. Previous studies have shown that the mechanism of carcinogenesis is related to the cell cycle.19 Our flow-cytometry and Western blot analyses demonstrated that suppression of MYBL2 induced G2/M-phase arrest and inhibited the expression of CDK1 and cyclin B1 proteins, which are critical for entry into and progression through mitosis.6,20 In contrast, MYBL2 overexpression caused an increase in the number of cells in the S phase and promoted the expression of CDK1 and cyclin B1. These results are consistent with previous studies showing that MYBL2 together with MuvB and FoxM1 regulates the expression of several key proteins required for G2/M transition.7,21,22 However, our results showed that MYBL2 overexpression also resulted in an increase in cells in the G2/M phase. As the expression of G2/M-phase checkpoint proteins cyclin B1 and CDK1 were increased in cells overexpressing MYBL2, we concluded that the increase in G2/M-phase cells was not due to G2/M-phase arrest. Increases in G2/M-phase cells after overexpression of MYBL2 may be due to a large increase in S-phase cells, which may result in more cells entering the G2/M phase. However, to distinguish between these possibilities, further analysis of cell-cycle progress is needed.
In addition to the classical role of MYBL2 as a transcription factor in G2/M-transition, our results indicate that MYBL2 may also be involved in processes related to DNA synthesis or repair in ESCC. Our results suggested that overexpression of MYBL2 caused an increase in the number of cells in the S phase and promoted DNA synthesis in ESCC cell lines. Furthermore, immunohistochemical analysis of xenograft tumors demonstrated that the level of Ki67 expression was consistent with MYBL2 expression. Collectively, these results suggest another mechanism by which MYBL2 may contribute to the aggressive behavior of ESCC cells by influencing DNA synthesis in the S phase. The direct link between MYBL2 and this potential downstream pathway needs to be studied further.
Conclusion
Our study shows that MYBL2 was overexpressed in ESCC tissue and positively correlated with Ki67, with poor clinical outcomes in patients with ESCC. It played a crucial role in ESCC-cell proliferation in vitro and in vivo. Furthermore, we propose that MYBL2 may play an important role in ESCC progression through regulation of the cell cycle at the S and G2/M phases. Our study reveals a novel mechanism by which MYBL2 may exert its oncogenic role in the progression of ESCC. Our study also suggests that MYBL2 may be utilized as a potential prognostic marker of ESCC and a target for therapeutic intervention in the treatment of ESCC.
Acknowledgments
This study was funded by the National Natural Science Foundation of China (grant 81071970).
Disclosure
The authors report no conflicts of interest in this work.
References
Chang DT, Chapman C, Shen J, Su Z, Koong AC. Treatment of esophageal cancer based on histology: a surveillance epidemiology and end results analysis. Am J Clin Oncol. 2009;32(4):405–410. | ||
Sala A, Watson R. B-Myb protein in cellular proliferation, transcription control, and cancer: latest developments. J Cell Physiol. 1999;179(3):245–250. | ||
Bessa M, Joaquin M, Tavner F, Saville MK, Watson RJ. Regulation of the cell cycle by B-Myb. Blood Cells Mol Dis. 2001;27(2):416–421. | ||
Tarasov KV, Tarasova YS, Tam WL, et al. B-Myb is essential for normal cell cycle progression and chromosomal stability of embryonic stem cells. PLoS One. 2008;3(6):e2478. | ||
Mowla SN, Lam EW, Jat PS. Cellular senescence and aging: the role of B-Myb. Aging Cell. 2014;13(5):773–779. | ||
Sala A. B-MYB, a transcription factor implicated in regulating cell cycle, apoptosis and cancer. Eur J Cancer. 2005;41(16):2479–2484. | ||
Sadasivam S, Decaprio JA. The DREAM complex: master coordinator of cell cycle-dependent gene expression. Nat Rev Cancer. 2013;13(8):585–595. | ||
Ren F, Wang L, Shen X, et al. MYBL2 is an independent prognostic marker that has tumor-promoting functions in colorectal cancer. Am J Cancer Res. 2015;5(4):1542–1552. | ||
Yu R, Li C, Lin X, et al. Clinicopathologic features and prognostic implications of MYBL2 protein expression in pancreatic ductal adenocarcinoma. Pathol Res Pract. 2017;213(8):964–968. | ||
Jin Y, Zhu H, Cai W, et al. B-Myb is up-regulated and promotes cell growth and motility in non-small cell lung cancer. Int J Mol Sci. 2017;18(6):860. | ||
Zhang X, Lv QL, Huang YT, Zhang LH, Zhou HH. Akt/FoxM1 signaling pathway-mediated upregulation of MYBL2 promotes progression of human glioma. J Exp Clin Cancer Res. 2017;36(1):105. | ||
Guan Z, Cheng W, Huang D, Wei A. High MYBL2 expression and transcription regulatory activity is associated with poor overall survival in patients with hepatocellular carcinoma. Curr Res Transl Med. 2018;66(1):27–32. | ||
Qin HD, Liao XY, Chen YB, et al. Genomic characterization of esophageal squamous cell carcinoma reveals critical genes underlying tumorigenesis and poor prognosis. Am J Hum Genet. 2016;98(4):709–727. | ||
Donohoe CL, Phillips AW. Cancer of the esophagus and esophagogastric junction: an 8th edition staging primer. J Thorac Dis. 2017;9(3):E282–E284. | ||
Dedić Plavetić N, Jakić-Razumović J, Kulić A, Vrbanec D. Prognostic value of proliferation markers expression in breast cancer. Med Oncol. 2013;30(2):523. | ||
Wen H, Ma H, Li P, et al. Expression of far upstream element-binding protein 1 correlates with c-Myc expression in sacral chordomas and is associated with tumor progression and poor prognosis. Biochem Biophys Res Commun. 2017;491(4):1047–1054. | ||
Thomas C, Robinson C, Dessauvagie B, et al. Expression of proliferation genes in formalin-fixed paraffin-embedded (FFPE) tissue from breast carcinomas. Feasibility and relevance for a routine histopathology laboratory. J Clin Pathol. 2017;70(1):25–32. | ||
Liang H-B, Cao Y, Ma Q, et al. MYBL2 is a potential prognostic marker that promotes cell proliferation in gallbladder cancer. Cell Physiol Biochem. 2017;41(5):2117–2131. | ||
Hanahan D, Weinberg RA. Hallmarks of cancer: the next generation. Cell. 2011;144(5):646–674. | ||
Knight AS, Notaridou M, Watson RJ. A Lin-9 complex is recruited by B-Myb to activate transcription of G2/M genes in undifferentiated embryonal carcinoma cells. Oncogene. 2009;28(15):1737–1747. | ||
Guiley KZ, Liban TJ, Felthousen JG, et al. Structural mechanisms of DREAM complex assembly and regulation. Genes Dev. 2015;29(9):961–974. | ||
Down CF, Millour J, Lam EW, Watson RJ. Binding of FoxM1 to G2/M gene promoters is dependent upon B-Myb. Biochim Biophys Acta. 2012;1819(8):855–862. |
 © 2019 The Author(s). This work is published and licensed by Dove Medical Press Limited. The
full terms of this license are available at https://www.dovepress.com/terms
and incorporate the Creative Commons Attribution
- Non Commercial (unported, 3.0) License.
By accessing the work you hereby accept the Terms. Non-commercial uses of the work are permitted
without any further permission from Dove Medical Press Limited, provided the work is properly
attributed. For permission for commercial use of this work, please see paragraphs 4.2 and 5 of our Terms.
© 2019 The Author(s). This work is published and licensed by Dove Medical Press Limited. The
full terms of this license are available at https://www.dovepress.com/terms
and incorporate the Creative Commons Attribution
- Non Commercial (unported, 3.0) License.
By accessing the work you hereby accept the Terms. Non-commercial uses of the work are permitted
without any further permission from Dove Medical Press Limited, provided the work is properly
attributed. For permission for commercial use of this work, please see paragraphs 4.2 and 5 of our Terms.