Back to Journals » ImmunoTargets and Therapy » Volume 14
Profiling Shared Cytotoxic Immune Signatures in SLE-Associated Coronary Injury Through Transcriptomics and Machine Learning
Authors Chen Y, Tso SM, Wu F, Xu Y, Cui L
Received 30 May 2025
Accepted for publication 22 October 2025
Published 4 November 2025 Volume 2025:14 Pages 1247—1266
DOI https://doi.org/10.2147/ITT.S539756
Checked for plagiarism Yes
Review by Single anonymous peer review
Peer reviewer comments 2
Editor who approved publication: Dr Flavio Salazar-Onfray
Yongkang Chen,1,* Shuk Ming Tso,2,* Feng Wu,2 Yue Xu,3 Liyan Cui1
1Department of Laboratory Medicine, Peking University Third Hospital, Beijing, People’s Republic of China; 2Heersink School of Medicine, The University of Alabama at Birmingham, Birmingham, AL, USA; 3Department of Rheumatology, Beijing Hospital, National Center of Gerontology, Beijing, People’s Republic of China
*These authors contributed equally to this work
Correspondence: Liyan Cui, Department of Laboratory Medicine, Peking University Third Hospital, Beijing, People’s Republic of China, Email [email protected]
Purpose: This study investigated shared molecular pathways linking systemic lupus erythematosus (SLE) and coronary artery disease (CAD) to uncover mechanisms of coronary injury in SLE.
Patients and Methods: Bulk transcriptomic datasets (GSE45291 for SLE, GSE61145 for CAD) were analyzed to identify differentially expressed genes (DEGs), immune cell infiltration patterns, and co-expression networks. A diagnostic model was constructed and validated using external cohorts (GSE49454 for SLE, GSE179789 for CAD). Machine learning prioritized core genes, validated in both external cohorts and in SLE patients with coronary injury (GSE264125). Cellular localization and intercellular communication were explored by analyzing single-cell RNA-seq data (GSE135779). qPCR was used to validate the gene expression in peripheral blood mononuclear cells (PBMCs) from patients.
Results: We identified 146 common DEGs enriched in immune pathways related to cell toxicity, and found shared dysregulation in cytotoxic lymphocytes such as natural killer (NK) cells and CD8+ T cells. Through co-expression analysis and DEG intersection, we pinpointed 11 hub genes (eg, GZMK, KLRK1, GNLY). A diagnostic model based on these genes showed strong performance (SLE: AUC 0.881 training, 0.666 validation; CAD: AUC 0.897 training, 0.781 validation). Machine learning highlighted GZMK and KLRK1 as core genes, which were further validated for their combined diagnostic utility (AUC: 0.782– 1.000) in SLE-related coronary injury. Single-cell analysis revealed that these genes are primarily active in cytotoxic CD8+ T cells and NK cells, with GZMK linked to CLEC-mediated signaling and KLRK1 to HLA activation. Finally, we confirmed higher expression of these genes in blood cells from SLE patients with coronary artery disease using qPCR.
Conclusion: SLE and CAD share a cytotoxic lymphocyte-driven molecular axis, with GZMK/KLRK1-mediated immune dysregulation as a key contributor to coronary injury in SLE. GZMK and KLRK1 may represent promising biomarkers for early detection and risk stratification of SLE-associated coronary complications. Notably, the discrimination (AUC=1.000) was observed in a limited subgroup of SLE patients with coronary microvascular dysfunction (n=4), warranting further validation in expanded cohorts.
Keywords: systemic lupus erythematosus, coronary artery disease, diagnostic model, cytotoxic lymphocyte, cell interactions
Introduction
Systemic lupus erythematosus (SLE) is a complex autoimmune disease characterized by multisystem involvement, predominantly affecting young adult women.1 Patients with SLE are more susceptible to early atherosclerosis, with cardiovascular diseases (CVD) risk significantly elevated and myocardial infarction occurring at rates up to ten times higher than in the general population.2 Despite extensive research, the mechanisms driving this heightened cardiovascular risk remain incompletely understood.3 While traditional cardiovascular risk factors, such as those identified in the Framingham Heart Study, are more prevalent in patients with SLE, they fail to fully account for the disproportionate burden of CVD observed in this population.4,5 This highlights the need for reliable biomarkers to stratify cardiovascular risk in SLE, which could inform targeted therapeutic strategies aimed at reducing CVD incidence and mortality.
Emerging evidence indicates that immune-mediated mechanisms play a central role in the pathogenesis of atherosclerosis and endothelial injury in SLE.6–9 Low-density granulocytes and neutrophils contribute to endothelial dysfunction in SLE by inducing apoptosis and impairing vascular repair.10 Transcriptomic analyses have revealed overlapping immune signatures between SLE and myocardial infarction, including dysregulated genes such as CSF3R, LRG1, and DYSF, which are closely linked to neutrophil-driven inflammation.11 Furthermore, expanded cytotoxic CD8+ T cells and intermediate monocytes in SLE-associated coronary artery disease (CAD) contribute to vascular inflammation and endothelial dysfunction via elevated CXCR1/2, CX3CR1, and type I interferon signaling.12 These findings suggest that immune dysregulation, rather than traditional risk factors alone, may underlie the high incidence of CAD in SLE. Identifying shared immune signatures between SLE and CAD offers a promising strategy for screening hub genes and uncovering mechanistic links relevant to disease progression.
However, studies on biomarkers of atherosclerosis in SLE remain challenging, partly due to low efficiency arising from fragmented methodologies and limited data integration.13 While bioinformatic tools have increasingly improved analytical throughput, most sequencing-based investigations still rely on bulk transcriptomic data or isolated disease models, which obscure cellular heterogeneity and constrain insights into shared immune mechanisms across diseases. To address these limitations and efficiently identify molecular pathways linking SLE and CAD, we employ an integrative strategy that combines transcriptomic datasets with machine learning, uncovering regulatory networks and biomarkers through advanced pattern recognition. In this study, we investigate immune-related genetic alterations involved in disease progression and establish a foundation for identifying predictive biomarkers and intercellular communication pathways that may drive CAD development in SLE, offering new perspectives for future therapeutic strategies. An overview of the methodological workflow is presented in Figure 1.
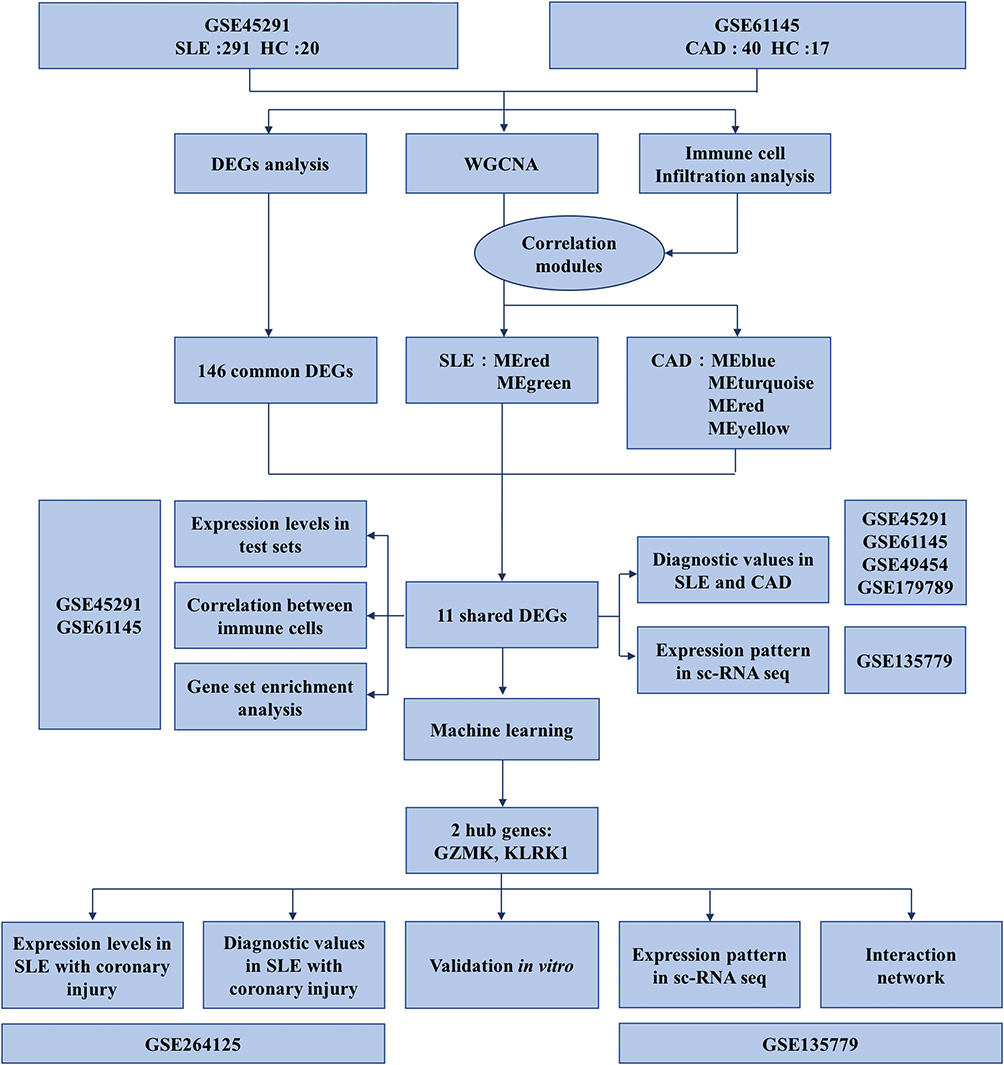 |
Figure 1 Flow diagram of this study. This flowchart illustrates an integrated bioinformatics workflow designed to uncover shared molecular mechanisms between SLE and CAD. The study begins with two GEO datasets: GSE45291, which includes 291 SLE patients and 20 healthy controls, and GSE61145, comprising 40 CAD patients and 17 healthy controls. First, DEG analysis was performed separately on each dataset, resulting in 146 common DEGs identified through intersection. Concurrently, WGCNA and immune cell infiltration analysis were conducted, revealing modules significantly correlated with immune cell scores—specifically, MEred and MEgreen in the SLE dataset, and MEblue, MEturquoise, MEred, and MEyellow in the CAD dataset. By further intersecting these key co-expression modules with the DEGs, 11 shared genes were ultimately selected. Subsequently, using the internal datasets (GSE45291 and GSE61145), we analyzed the expression patterns of these 11 genes, assessed their correlations with immune cells, performed functional enrichment analysis, and preliminarily evaluated their diagnostic potential for both SLE and CAD. To validate generalizability, the diagnostic value of these genes was further verified using external independent datasets (GSE49454 and GSE179789). Moreover, leveraging the single-cell dataset GSE135779, we investigated the distribution and localization of these genes across immune cell subsets. Based on machine learning approaches, two core genes, GZMK and KLRK1, were ultimately identified and validated at multiple levels: their expression levels and diagnostic efficacy were assessed in a cohort of SLE patients with coronary artery injury (GSE264125); their immune cell localization and roles in cell-cell communication were further delineated using the GSE135779 single-cell data; finally, mRNA expression levels of GZMK and KLRK1 were confirmed in peripheral blood samples from real-world SLE patients with coronary injury, thereby strengthening the reliability and biological significance of the study’s conclusions. |
Material and Methods
Human Specimens
We included SLE patients who were attending Beijing Hospital. The inclusion criteria were meeting the 1997 criteria of the American College of Rheumatology (ACR),14 aged between 18–70 years, and had not received any prior treatment. Blood samples were collected, and plasma and peripheral blood mononuclear cells (PBMCs) were separated within 2 hours and preserved at −80°C for molecular analysis. The study protocol has been approved by the Medical Ethics Committee of Beijing Hospital (Ethical Review Number: 2022BJYYEC-176-01). All participants had provided written informed consent before participation. And all procedures were conducted in accordance with the ethical standards outlined in the Declaration of Helsinki.
Data Collection
We retrieved GSE45291 from the GEO database as the training dataset for SLE and GSE61145 as the training dataset for CAD, while GSE49454 and GSE179789 were used as external validation datasets for the diagnostic prediction model, analyzing their consistency and robustness. They all met the following conditions: a) containing microarray-based gene expression data; B) the study design included patients and healthy controls. Specifically, the GSE45291 dataset includes 291 SLE patients and 20 healthy controls. In comparison, GSE49454 consists of 157 SLE patients and 20 controls. Similarly, the GSE61145 dataset includes 40 CAD patients and 17 healthy controls. By contrast, GSE179789 is composed of 8 CAD patients and 8 controls. Additionally, GSE264125 was used to validate the core genes after machine learning and not only contains SLE (n=11) and healthy controls (n=10), but it was also divided into SLE with (n=4) and without (n=7) coronary microvascular disease (CMD) based on the cardiac magnetic resonance imaging (CMR) results. Although the CMD subgroup was limited in size, this dataset was the most recently available and the only cohort testing CMD at the time of analysis. The single-cell sequencing dataset GSE135779 contains 8 SLE patients and 6 healthy controls, which is used for the study of cell localization and cell interaction of core genes. Table 1 provides detailed information about these datasets.
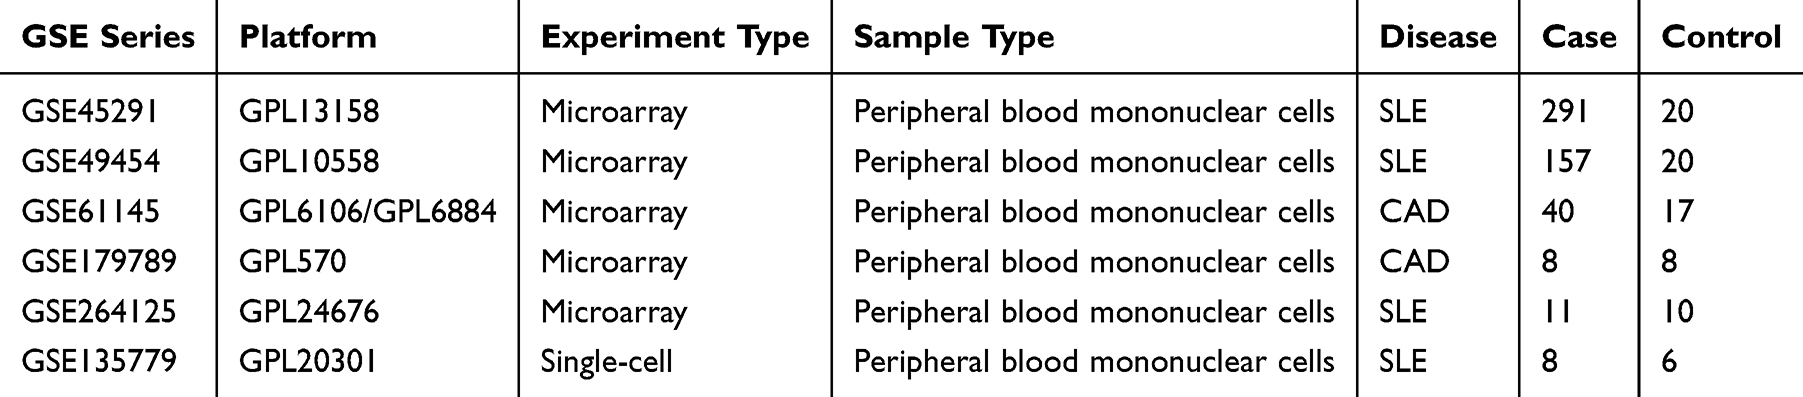 |
Table 1 Basic Information of GEO Datasets Used in the Study |
Data Preprocessing and Batch Correction
Raw probe-level data were annotated using the most recent platform annotation files. Where multiple probes mapped to the same gene, the median expression value was retained. To harmonize across platforms, the intersection of gene symbols was used. Batch effects were corrected using ComBat with disease status included in the design matrix, thereby removing technical variation while preserving biological differences. Quality control was rigorously performed through principal component analysis (PCA) to evaluate sample clustering and confirm successful batch adjustment (Supplementary Figure S1A and B). Additionally, density distribution plots and sample-wise boxplots were inspected to verify normalization efficacy and identify outlier samples based on predefined thresholds (Supplementary Figure S1C and D).
Differential Expression Analysis
Differentially expressed genes (DEGs) between cases and controls were identified using the limma package. Gene expression data were obtained from GSE45291 (SLE dataset) and GSE61145 (CAD dataset). Linear models were fitted separately for each dataset, and empirical Bayes moderation was applied. P values were adjusted using the Benjamini–Hochberg false discovery rate (FDR) method. Genes were considered significant if they met both FDR < 0.05 and |log2 fold change| > 0.32. These thresholds were consistently applied across datasets. For visualization, we generated comprehensive heatmaps showing hierarchical clustering of samples and genes, and volcano plots illustrating the magnitude and statistical significance of expression changes. Common DEGs between SLE and CAD were identified by intersecting the significant genes from both analyses, with separate lists maintained for upregulated and downregulated genes.
Immune Cell Infiltration Analysis
Immune cell abundance was quantified using the MCPcounter algorithm, which provides robust estimation of immune cell populations from transcriptomic data. We evaluated the abundance of various cell types including T cells, CD8+ T cells, cytotoxic lymphocytes, NK cells, B lineage cells, monocytic lineage cells, myeloid dendritic cells, neutrophils, endothelial cells, and fibroblasts. Statistical comparison between disease and control groups was performed using non-parametric Wilcoxon rank-sum tests with Benjamini-Hochberg correction. Cell types with adjusted p-values < 0.05 were considered significantly different between groups. Effect sizes were calculated using Cliff’s delta to quantify the magnitude of differences. Common patterns of immune cell alterations between SLE and CAD were identified by comparing significantly changed cell types across both conditions.
Weighted Gene Co-Expression Network Analysis (WGCNA)
Gene co-expression networks were constructed using WGCNA. Scale-free topology was assessed using the pickSoftThreshold function. For SLE samples, the network was constructed with soft-thresholding power = 8 and maximum block size = 15,000; for CAD, power = 3 and maximum block size = 14,000. Eight computational threads were used for efficiency. Unless otherwise specified, default unsigned network parameters were applied. Modules were defined by dynamic tree cutting, and module eigengenes were calculated. Module size distributions and the percentage of unassigned (“grey”) genes were reported. Module eigengenes were correlated with immune cell infiltration scores, with significant associations defined as |ρ| > 0.3 and FDR < 0.05.
Module-Immune Cell Correlation Analysis
The relationships between gene modules and immune cell infiltration were investigated through Spearman correlation analysis between module eigengenes and immune cell abundance scores. Significant module-cell type associations were identified using thresholds of |correlation| > 0.3 and adjusted p-value < 0.05 after Benjamini-Hochberg correction. For significantly correlated modules, we extracted their constituent genes and performed comparative analysis to identify genes common to both SLE and CAD conditions. These module-associated genes were further analyzed for overlap with previously identified common DEGs to highlight potential key regulators of immune cell infiltration.
Pathway Enrichment Analysis
Gene Set Enrichment Analysis (GSEA) was conducted using the clusterProfiler R package with multiple reference databases including Gene Ontology (GO), KEGG, MSigDB Hallmark gene sets. For each disease, genes were ranked based on their t-statistics from differential expression analysis. Enrichment analysis parameters included minimum gene set size of 10, maximum size of 500, and adjusted p-value cutoff of 0.05. We focused on pathways significantly enriched in both diseases with concordant enrichment direction (same sign of Normalized Enrichment Score). These common pathways were filtered to identify those containing overlapping genes between disease-specific modules and common DEGs. Pathway visualization included enrichment score plots and network representations of pathway relationships.
Machine Learning-Based Feature Selection
To identify robust diagnostic features, three complementary algorithms were implemented. (i) LASSO regression: We applied cv.glmnet with α = 1 under a binomial model, using 10-fold cross-validation and class-balanced weights to penalize underrepresented groups. Genes with non-zero coefficients at λ_min were retained. (ii) SVM-RFE: Recursive feature elimination with support vector machines (radial kernel) was performed using the caret package, with 5-fold cross-validation and centered/scaled predictors. The optimal feature subset was selected based on cross-validated accuracy. (iii) Random forest: Models were trained with 1,000 trees, using stratified sampling with equal sample sizes per class to address imbalance. Features were ranked by both MeanDecreaseGini and MeanDecreaseAccuracy, and the top-ranked predictors were selected.
Independent Dataset Validation with GSE264125
Model validation employed Gene Set Variation Analysis (GSVA) to calculate enrichment scores for our gene signature in both validation cohorts. Statistical significance of enrichment scores between disease and control groups was assessed using Wilcoxon rank-sum tests with Benjamini-Hochberg correction. Effect sizes were quantified using Cliff’s delta. The receiver operator characteristic (ROC) curve analysis evaluated the diagnostic potential of both individual signature genes and the overall signature score.
Naive Bayes Model Development
Following feature selection, we developed and validated Naive Bayes classification models using the Mime R package.15 Training sets consisted of GSE45291 (SLE) and GSE61145 (CAD), with GSE49454 (SLE) and GSE179789 (CAD) serving as independent validation cohorts. Data preprocessing included standardization and format conversion for model compatibility. For GSE179789, post-treatment samples were excluded to ensure baseline condition assessment. Model performance was evaluated through multiple metrics including accuracy, sensitivity, specificity, and precision. ROC curves were generated and area under the curve (AUC) values calculated in both training and validation sets for model evaluation.
Single-Cell RNA Sequencing Validation
Single-cell RNA sequencing data from GSE135779 was analyzed to validate expression patterns of signature genes in SLE patients at cellular resolution. Raw counts data were processed using the Seurat v4.0 pipeline. Quality control filtering removed cells with fewer than 500 or more than 2,500 genes, UMI counts outside 2,000–10,000, and mitochondrial gene percentage exceeding 10%. After normalization and scaling, dimensionality reduction was performed using Principal Component Analysis followed by Uniform Manifold Approximation and Projection (UMAP).
Cell Type Annotation and Selection
Cell type annotation employed SingleR with five reference databases (DatabaseImmuneCellExpressionData, BlueprintEncodeData, MonacoImmuneData, HumanPrimaryCellAtlasData, and NovershternHematopoieticData). We specifically focused on cells consistently labeled as NK or CD8+ T cells across all reference databases. Additional filtering based on UMAP coordinates removed potential outlier populations, with NK cells filtered by UMAP2 ≥ 5 and CD8+ T cells filtered by UMAP1 ≤ 3.5 and UMAP2 ≥ −5.
Fluorescent Quantitative Polymerase Chain Reaction
The R6831-01-E.Z.N.A. Kit (Omega bio-tek, Georgia, USA) was used according to the manufacturer’s instructions to extract total RNA from PBMCs. Subsequently, following the manufacturer’s guidance, RNA was converted to cDNA using the MicroElute Total RNA Kit (Omega Bio-tek, Georgia, USA) and PrimeScript™ RT Reagent Kit (Takara, Japan). Thereafter, qPCR was performed using RR820A SYBR®Premix Ex Taq™II (Tli RNaseH Plus) (Takara, Japan) and Applied BiosystemsTM QuantStudioTM 3 (ThermoFisher Scientific, Massachusetts, USA). GAPDH was used as the internal control gene, and the expression level of the target gene was calculated using the 2−ΔΔCt method. The specific primers for the target genes are shown in Table 2.
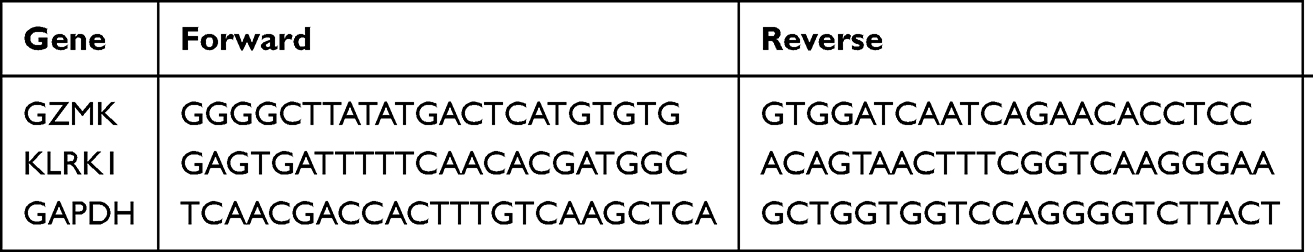 |
Table 2 The Primer Sequences Used in qPCR |
Statistical Analysis
All analyses were conducted in R (version as reported in sessionInfo). Core packages included GEO query, sva, limma, WGCNA, glmnet, randomForest, caret, and pROC, among others. Unless otherwise noted, all statistical tests were two-sided, and P values were adjusted for multiple comparisons using the Benjamini–Hochberg procedure. Intermediate artifacts (eg, power analysis plots, ROC curves) were exported, and all code was version-controlled to ensure reproducibility.
Result
Identification of Differentially Expressed Genes Between SLE and CAD DEGs
We performed differential expression analysis on the SLE dataset GSE45291 using the limma R software package and identified 2837 differentially expressed genes (DEGs). The volcano plot displayed the expression changes of these genes, with 1168 genes upregulated and 1669 genes downregulated based on the log fold change(FC) values (Figure 2A). In addition, a heatmap further exhibited the expression patterns of these DEGs (Figure 2B). For the CAD-related dataset GSE61145, we similarly determined 875 differentially expressed genes and observed 491 genes upregulated and 384 genes downregulated (Figure 2C). The heatmap provided a detailed expression pattern visualization for these DEGs (Figure 2D). By comparing the differentially expressed genes between the two datasets, we found that 146 genes showed overlapping expression, with 43 upregulated and 103 downregulated, as shown in Figure 2E, which may reveal some common biological pathways between SLE and CAD.
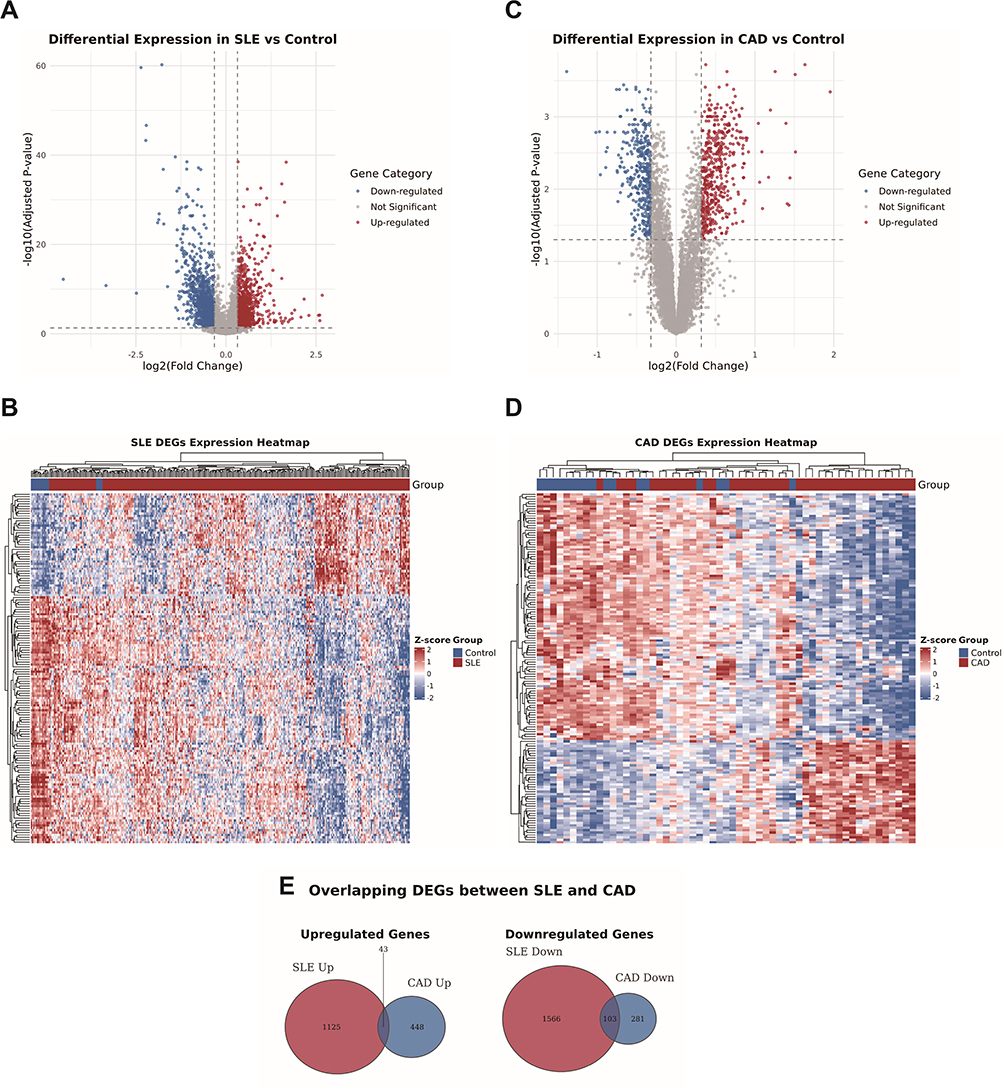 |
Figure 2 Identification of differentially expressed genes between SLE and CAD DEGs. (A) Volcano plot illustrating differential gene expression between SLE patients and controls in the GSE45291 dataset. (B) Expression patterns of differentially expressed genes (DEGs) in SLE compared with controls within the GSE45291 dataset. (C) Volcano plot displaying differential gene expression between CAD patients and controls in the GSE61145 dataset. In both plots, the x-axis represents log2(fold change) and the y-axis corresponds to -log (adjusted p-value), with |log2FC| > 0.32 indicating statistically significant differential expression. Genes are color-coded to distinguish significantly up-regulated (red), down-regulated (blue), and non-significant (grey) expressions. (D) Expression patterns of DEGs in CAD compared with controls within the GSE61145 dataset. Rows represent genes clustered by expression similarity, and columns represent samples grouped by disease and control conditions. The color gradient reflects Z-score normalized expression levels, with red indicating high expression and blue indicating low expression. (E) Overlay of DEGs of GSE45291 and GSE61145. In the up-regulated set, 43 genes were common to both diseases out of 1125 SLE-related and 448 CAD-related up-regulated genes. In the down-regulated set, 103 genes overlapped between SLE (1566 genes) and CAD (281 genes). |
Identification of Immune Cells Shared by SLE and CAD
SLE is a disease characterized by abnormal function of peripheral immune cells. We wonder that whether both diseases share similar clusters of differentially expressed immune cells. Immunological infiltration analysis shows that the relative levels of four immune cells in SLE, B lineage, cytotoxic lymphocytes, endothelial cells, and NK cells, are significantly different from those in the control group (Figure 3A and B). Neutrophils is negatively correlated with T cells (cor = −0.58), cytotoxic lymphocytes (cor = −0.46), B lineage (cor = −0.42) and CD8 T cells (cor = −0.37), while cytotoxic lymphocytes are highly correlated with NK cells (cor = 0.73) (Figure 3C). Similarly, in CAD, the relative levels of six immune cells: B lineage, cytotoxic lymphocytes, neutrophils, and T cells are significantly different from those in the control group (Figure 3D and E). Neutrophils is negatively correlated with T cells (cor = −0.83), cytotoxic lymphocytes (cor = −0.68) and NK cells (cor = −0.38), while cytotoxic lymphocytes are highly correlated with NK cells (cor = 0.68) (Figure 3F).
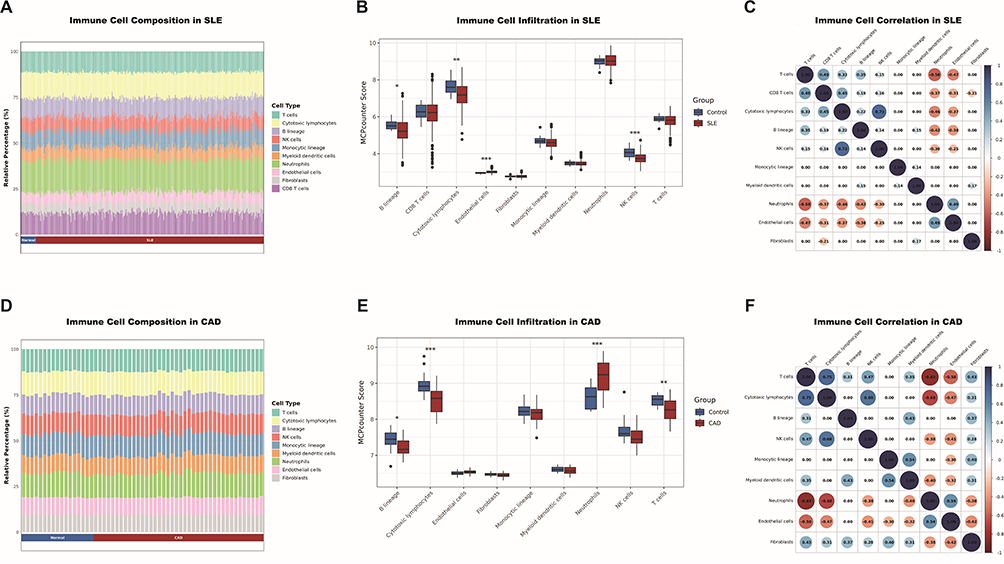 |
Figure 3 Identification of immune cells shared by SLE and CAD. (A) Barplot showing immune cell expression in SLE and healthy control. A pronounced reduction in T cells and cytotoxic lymphocytes is observed in SLE. (B) Violin plot showing the difference in immune cell expression in SLE and healthy control using MCP-counter scores. The most pronounced significant differences between groups were observed in cytotoxic lymphocytes and NK cells. (C) Circle plot showing correlation of immune cells in SLE. A correlation heatmap of immune cells in SLE, including only statistically significant associations after Benjamini–Hochberg correction (adjusted p < 0.05). (D) Barplot showing immune cell expression in CAD and healthy control. The chart highlights a substantial decrease in T cells and cytotoxic lymphocytes in CAD. (E) Violin plot showing the difference in immune cell expression in CAD and healthy control using MCP-counter scores. Significant elevations in infiltration scores are observed in CAD patients, most notably in cytotoxic lymphocytes, neutrophils, and T cells (F) Circle plot showing correlation of immune cells in CAD. *p<0.05;**p<0.01;***p<0.001. |
Identification of Shared Immune Cell-Related Genes in SLE and CAD
We employed the WGCNA method to delve into the potential relationships between four shared immune cells (B lineage, cytotoxic lymphocytes, endothelial cells, and NK cells) and gene expression levels in two datasets. After eliminating the influence of batch effects, by performing clustering analysis on the gene expression data, we successfully grouped the patients based on their expression patterns, with each cluster representing a set of samples with similar expression patterns (Figure 4A and 5A). Through systematic evaluation, we identified an optimal soft threshold of 7 in SLE dataset (GSE45291, Figure 4B) and 2.5 in CAD dataset (GSE61145, Figure 5B). In SLE, on the basis of module correlation ≥0.3, MEgreen was highly correlated with B lineage, and MEred was highly correlated with cytotoxic lymphocytes (Figure 4C and D). On the other hand, in CAD, MEyellow was highly correlated with endothelial cells, and MEturquoise and MEred modules were highly correlated with cytotoxic lymphocytes, with module correlation ≥0.3 (Figure 5C and D). After removing repetitive sequences, a total of 23 genes related to cytotoxic lymphocytes were obtained in both diseases.
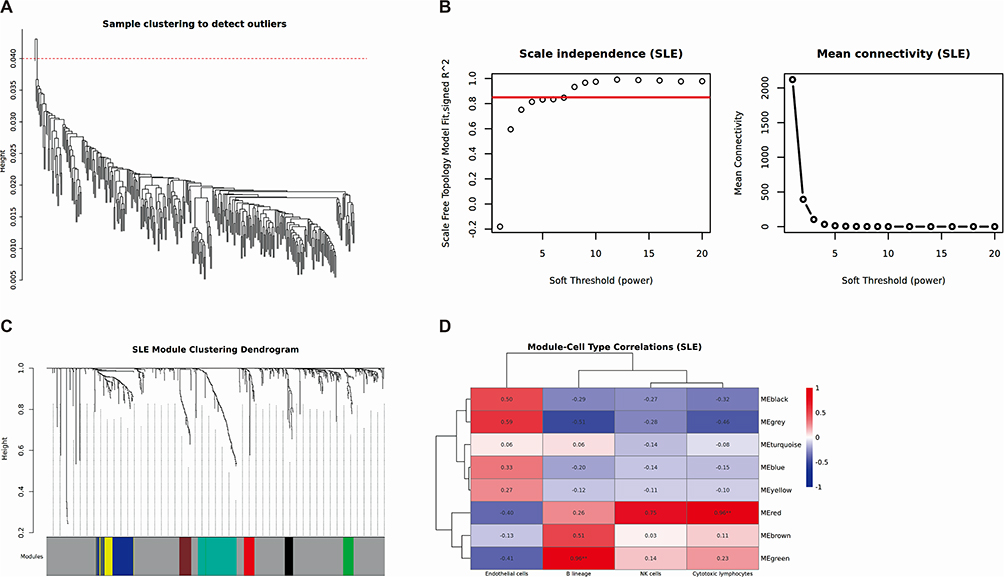 |
Figure 4 Weighted gene co-expression network analysis of SLE. (A) Clustering based on the expression level of samples after de-batching. Each branch represents one sample in the dataset and there is one outlier sample in GSE45291. (B) Left: Determination of soft-threshold power of samples. Right: Average connectivity of soft threshold power functions. (C) Clustered dendrograms of co-expression network modules. (D) Heatmap of the correlation between the gene co-expression modules and significant immune cell types. The color gradient represents Pearson correlation values, ranging from −1 (blue, negative correlation) to +1 (red, positive correlation), with numerical values indicated within each cell. **p<0.01. |
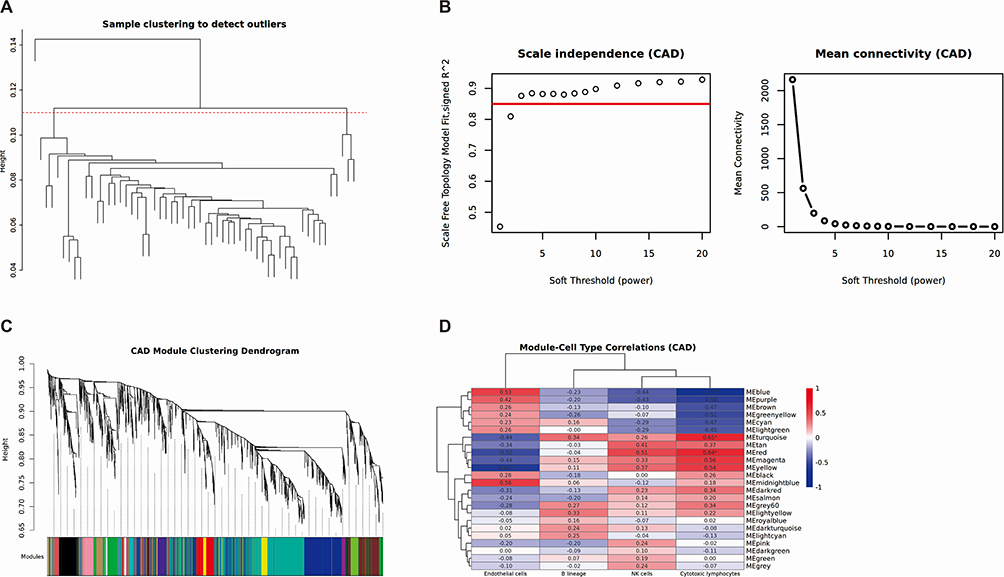 |
Figure 5 Weighted gene co-expression network analysis of CAD. (A) Clustering based on the expression level of samples after de-batching. Each branch represents one sample in GSE61145. (B) Left: Determination of soft-threshold power of samples. Right: Average connectivity of soft threshold power functions. (C) Clustered dendrograms of co-expression network modules. (D) Heatmap of the correlation between the gene co-expression modules and significant immune cell types. The color gradient represents Pearson correlation values, ranging from −1 (blue, negative correlation) to +1 (red, positive correlation), with numerical values indicated within each cell. *p<0.05;**p<0.01. |
Validation of Key Gene Expression Differences and Correlation Analysis with Immune Cells
By screening the intersection of genes in the cytotoxic lymphocytes module identified by WGCNA analysis with the common DEGs in the two diseases, we ultimately determined 11 common intersecting genes (Figure 6A). To verify the expression of Hub genes in SLE and CAD, we plotted the corresponding expression box plots. In both SLE and CAD, CCL5, CD160, GNLY, GZMA, GZMB, GZMK, KLRD1, KLRK1, NKG7, PRF1, and PRSS23 were significantly downregulated. The similar expression trends of these 11 key genes in SLE (Figure 6B) and CAD (Figure 6C) suggest that they are associated with the similar underlying mechanisms in both diseases. Correlation analysis revealed significant associations between key genes and immune cells in SLE (Supplementary Figure S2) and CAD (Supplementary Figure S3). All 11 Hub genes in SLE were significantly associated with NK cells, T cells, CD8+ T cells and cytotoxic lymphocytes. The other 10 key genes besides CCL5 were significantly associated with B lineage. GZMA, GZMB, PRF1, and NKG7 were significantly associated with the monocytic lineage; GNLY, PRF1, NKG7, and GZMB with myeloid dendritic cells; and GNLY and GZMB with fibroblasts. Conversely, all 11 Hub genes were significantly negatively associated with neutrophils. The other 10 genes except CCL5 were significantly negatively associated with endothelial cells. In CAD, all 11 Hub genes were significantly associated with cytotoxic lymphocytes, T cells, and NK cells, while only KLRK1 was significantly associated with fibroblasts. Conversely, all 11 Hub genes were significantly negatively associated with neutrophils and endothelial cells. The associations of all 11 hub genes with monocytic lineage, B lineage, and myeloid dendritic cells were not significant. Clearly, cytotoxic lymphocytes, T cells, and NK cells are significant in both diseases and are highly related to the 11 genes we identified. After performing GSEA analysis on SLE and CAD-related genes using the KEGG, GO, and Hallmark databases, we observed significant enrichment phenomena in various biological pathways for both SLE and CAD. The GO gene enrichment analysis reveals that the high expression of the 11-gene signature is primarily enriched in the adaptive immune response, regulation of T cell/leukocyte activation, regulation of leukocyte cell-cell adhesion, and positive regulation of T cell/leukocyte activation in SLE and CAD (Figure 6D). The results of the KEGG and Hallmark analysis indicate that SLE and CAD are both significantly enriched in graft-versus-host disease (Figure 6E and F).
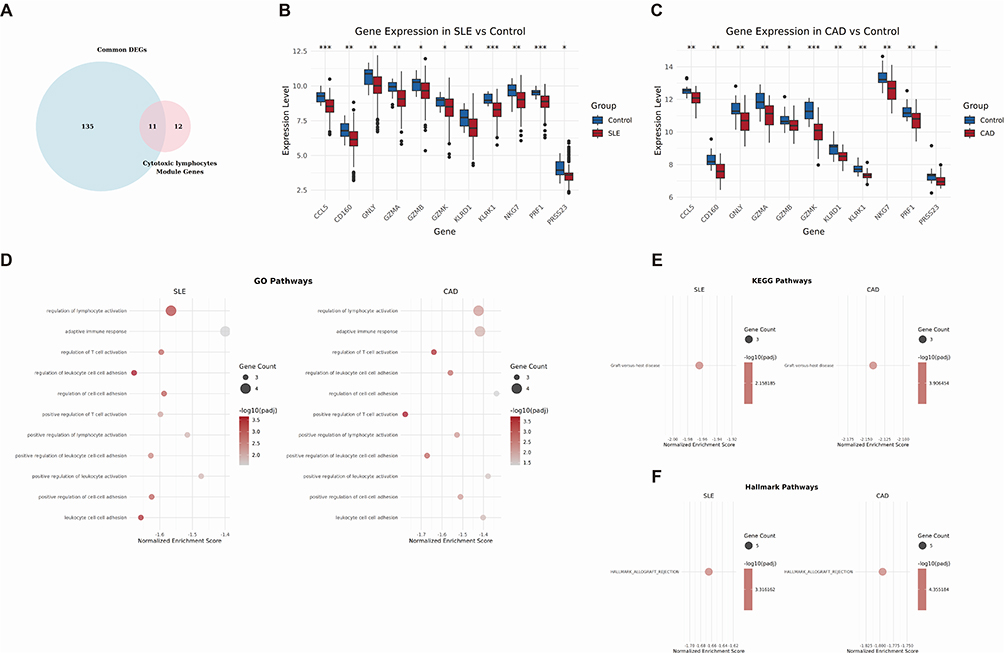 |
Figure 6 Validation of key gene expression differences and correlation analysis with immune cells. (A) Venn diagram showing the intersection of DEGs and cytotoxic lymphocytes related genes common to SLE and CAD. (B) Box plots showing the expression of 11 genes between SLE and healthy control in dataset GSE45291. (C) Box plots showing the expression of 11 genes between CAD and healthy control in dataset GSE61145. (D) GSEA enrichment of the 11 genes in SLE and CAD based on GO pathways. (E) GSEA enrichment of the 11 genes in SLE and CAD based on KEGG and Hallmark pathways. (F) GSEA enrichment of the 11 genes in SLE and CAD based on KEGG and Hallmark pathways. *p<0.05,**p<0.01,***p<0.001. |
Constructing a Diagnostic Prediction Model Based on 11 Hub Genes
Using the Naïve Bayes algorithm, a prediction model based on 11 Hub genes was constructed. We validated the model on the SLE training set (GSE45291) and a separate validation set (GSE49454). The model achieved sensitivities of 97.9% and 92.8%, with specificities of 20.3% and 36.0% (Figure 7A), which corresponded to AUC values of 0.881 and 0.666, respectively (Figure 7B). The model was also validated on the CAD training set (GSE61145) and a separate validation set (GSE179789). The AUC values were 0.897 and 0.781 (Figure 7C), with corresponding sensitivities of 92.6% and 83.3%, and specificities of 57.7% and 70.0% (Figure 7A). The model demonstrated good disease recognition capability.
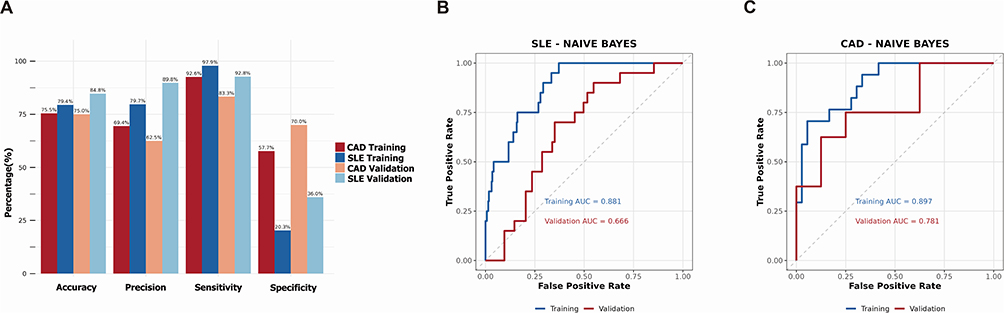 |
Figure 7 Naive Bayes-based diagnostic model construction using 11 key genes. (A) The bar chart showing diagnostic performance of constructed model in SLE and CAD datasets, including accuracy, precision, sensitivity and specificity. (B) ROC analysis showing diagnostic performance of 11 key genes in the training set (GSE45291) and validating set (GSE49454) using machine learning (Naive Bayes). (C) ROC analysis showing performance of 11 key genes in the training set (GSE61145) and validating set (GSE179789) using machine learning (Naive Bayes). |
Machine Learning Analysis Identifies Shared Key Genes in SLE and CAD
To identify genes that play a crucial role in SLE and CAD, this study employed three machine learning techniques—Random Forest, LASSO, and SVM-RFE—to screen for key genes. In the SLE study, we utilized the Random Forest algorithm and SVM-RFE to rank the importance of 11 candidate genes (Figure 8A and B). Through LASSO logistic regression analysis, we selected 4 key genes from differentially expressed genes (Figure 8C). Similarly, in the CAD study, we also ranked the importance of 11 candidate genes using the Random Forest algorithm and SVM-RFE (Figure 9A and B), and selected 4 key genes from differentially expressed genes through LASSO logistic regression analysis (Figure 9C). After comparative analysis, multi-model validation prioritizes cytotoxic cell signatures, KLRK1 and GZMK, across all algorithms.
 |
Figure 8 Integrated machine learning analysis for hub genes selection in SLE. This composite figure summarizes the performance and variable importance results from three distinct machine learning algorithms [Random Forest (A), SVM-RFE (B), and LASSO (C)] applied to SLE transcriptomic data. (A) Random Forest outcomes, including performance metrics (accuracy, recall, F1-score), out-of-bag (OOB) error as a function of tree number, and feature importance ranking. (B) SVM-RFE outcomes, including accuracy and root mean square error (RMSE) across feature subsets, along with corresponding feature importance scores. (C) LASSO regression analysis showing coefficient evolution paths across regularization parameters, cross-validation results, and key feature contributions. |
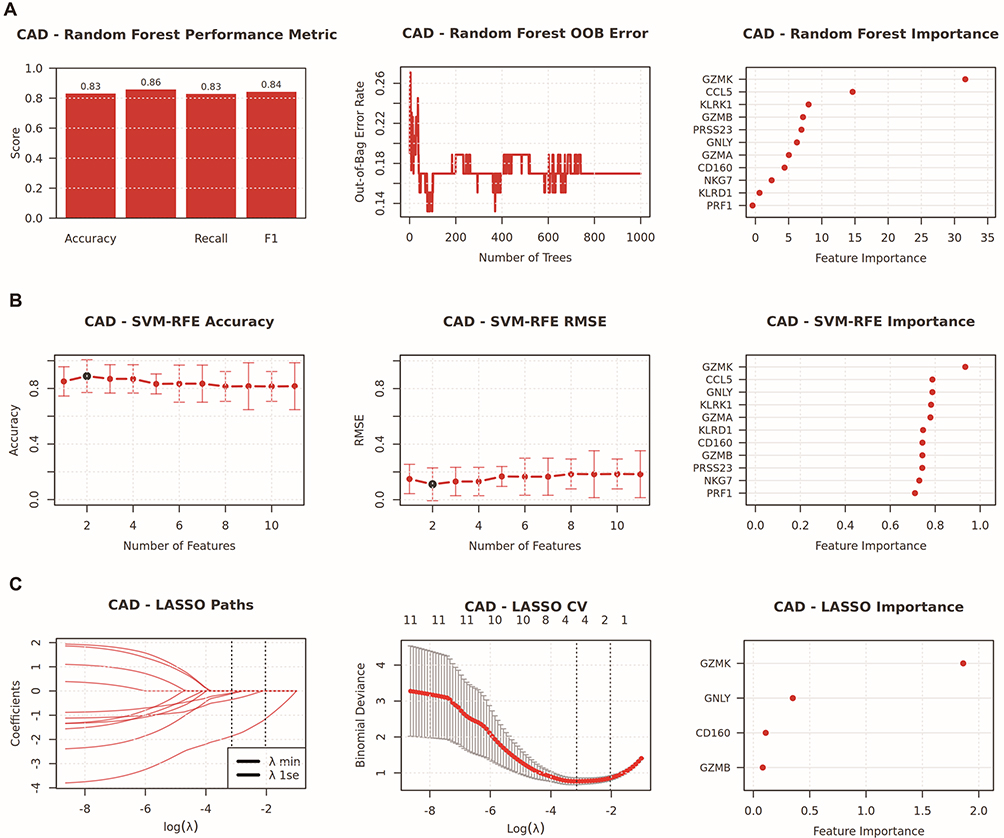 |
Figure 9 Integrated machine learning analysis for hub genes selection in CAD. This composite figure summarizes the performance and variable importance results from three distinct machine learning algorithms [Random Forest (A), SVM-RFE (B), and LASSO (C)] applied to CAD transcriptomic data. (A) Random Forest outcomes, including performance metrics (accuracy, recall, F1-score), out-of-bag (OOB) error as a function of tree number, and feature importance ranking. (B) SVM-RFE outcomes, including accuracy and root mean square error (RMSE) across feature subsets, along with corresponding feature importance scores. (C) LASSO regression analysis showing coefficient evolution paths across regularization parameters, cross-validation results, and key feature contributions. |
GZMK and KLRK1 are Predictive Biomarkers for Coronary Injury in Patients with SLE
Although the 11 candidate genes have been promising as diagnostic biomarkers for SLE and CAD, our goal is to study the mechanism of coronary involvement in SLE patients. In GSE264125, SLE patients with coronary microvascular dysfunction (CMD) (n=4) and those without CMD (n=7) were distinguished based on cardiac MRI, and gene features were analyzed using whole blood RNA samples. The analysis found that the GSVA scores of GZMK and KLRK1 were lower in SLE patients than in healthy individuals (adj p=0.0295, Effect size=−0.56, Figure 10A). Furthermore, patients with CMD had lower scores than those without CMD (adj p=0.0121, Effect size=−1.00, Figure 10B). Predictive ROC models were constructed using single genes, with GZMK distinguishing SLE from healthy individuals (Figure 10C) and CMD from non-CMD SLE patients (Figure 10D), yielding AUCs of 0.691 and 0.893, respectively, while KLRK1 yielded 0.791 and 0.821, respectively. The combined use of GZMK and KLRK1 yielded AUCs of 0.782 (SLE vs healthy) and 1.000 in distinguishing CMD from non-CMD SLE patients (n=4 vs n=7), though this exceptional performance should be interpreted with caution given the small subgroup size. This further confirms that GZMK and KLRK1 are likely involved in the occurrence of coronary involvement in SLE patients.
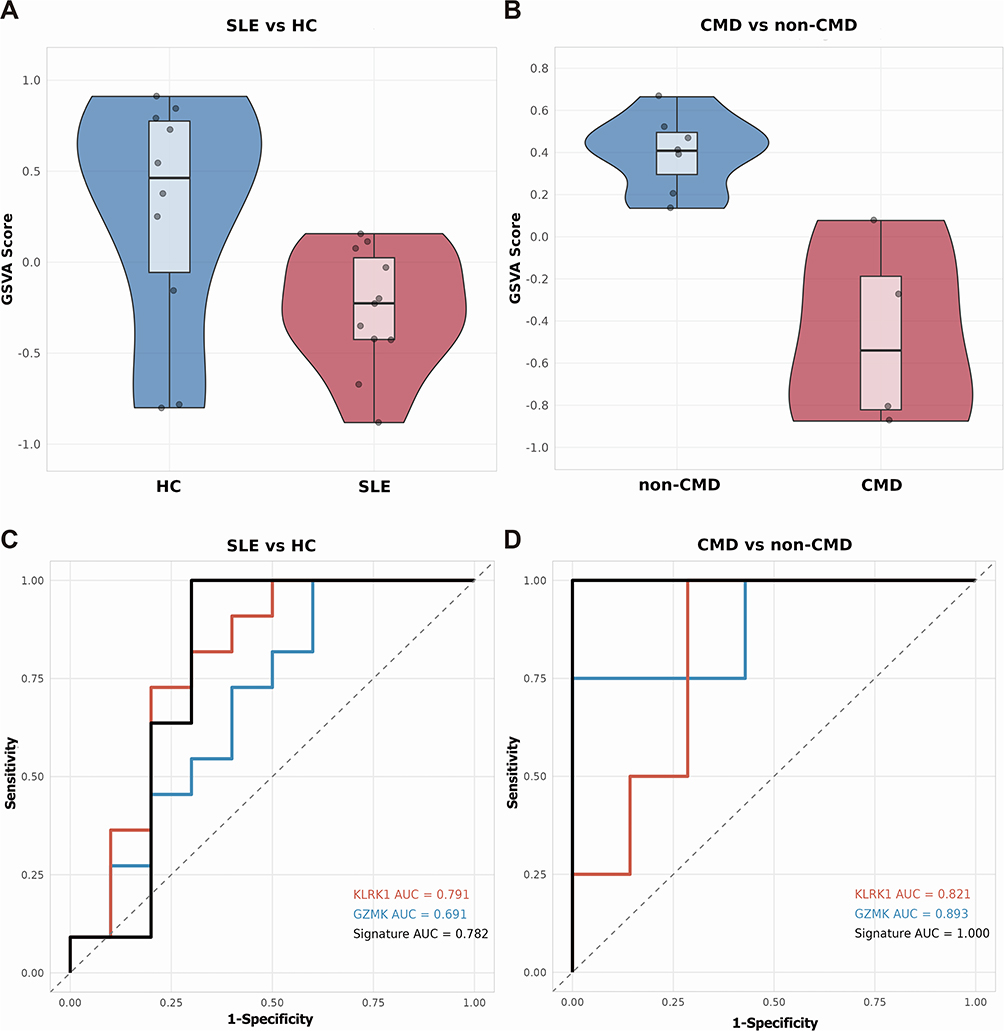 |
Figure 10 GZMK and KLRK1 can predict coronary injury in SLE. (A) GSVA analysis separately demonstrates the activity scores of gene sets (GZMK and KLRK1) in healthy controls and SLE patients using dataset GSE264125. (B) GSVA analysis separately displays the activity scores of gene sets (GZMK and KLRK1) in SLE patients with CMD and those without CMD using dataset GSE264125. (C) ROC curves illustrate the discriminative ability of GZMK and KLRK1 in distinguishing healthy controls from SLE patients. (D) ROC curves indicate the discriminative power of GZMK and KLRK1 in differentiating SLE patients with CMD from those without CMD. |
Single Cell Analysis Localization and Function Analysis of Hub Genes
In addition to PBMC Bulk-sequencing, we utilized scRNA-seq technology to study the relationship between hub genes and the immune microenvironment. The data was reduced, clustered, and normalized (Figure 11A, B and Supplementary Figure S4).With the help of the SingleR software package, we labeled these cell clusters with cell types and identified and classified 14 different cell populations: B cells, basophils, CD4+ T cells, CD8+ T cells, common myeloid progenitors (CMPs), dendritic cells, eosinophils, granulocytes, hematopoietic stem cell, megakaryocytes, megakaryocyte-erythroid progenitors (MEPs), monocytes, NK cells, and NKT cells (Figure 11C). Through scRNA-seq analysis, we found that CCL5, CD160, GNLY, GZMA, GZMB, KLRD1, NKG7, PRF1, and PRSS23 are particularly enriched in CD8+ T cells and NK cells (Figure 11D). The GZMK is prominently distributed in CD4+ T cells, CD8+ T cells, and NK cells. Moreover, the non-uniform distribution of GZMK in NK cell and CD8+ T cell clusters suggests the existence of two subtypes with high and low expression of GZMK in these clusters. KLRK1 is primarily expressed in a small group of CD8+ T cells and NK cells. We conducted an in-depth study of intercellular interactions at the single-cell level using the CellChat R package. As shown in the magnified view in Figure 11E and the complete image in Supplementary Figure S5, the network bubble plot revealed that among immune cells with different levels of GZMK expression, CD8+ T cells interact with each other most frequently. Specifically, GZMK highly expressing CD8+ T cells are connected to other CD8+ T cells via the CLEC2B/KLRB1 and CLEC2C/KLRB1 pathways, while GZMK lowly expressing CD8+ T cells lack this connection. The chord diagram (Figure 11F) showed that in GZMK highly expressing CD8+ T cells, the expression of CD69 and CLEC2B genes is higher than that of cells with low GZMK expression. Similarly, as shown in the magnified view in Figure 11G and the complete image in Supplementary Figure S6, among the immune cells with different KLRK1 expression, the communication between CD8+ T cells is also the most frequently. KLRK1 highly expressing CD8+ T cells connect with another part of CD8+ T cells through HLA-A/CD8B, HLA-B/CD8B, HLA-C/CD8B, and HLA-F/CD8B, while KLRK1 lowly expressing CD8+ T cells lack this connection. The chord diagram (Figure 11H) shows that in KLRK1 highly expressing CD8+ T cells, the expression of HLA-A, HLA-B, HLA-C, HLA-E, and HLA-F genes is higher than that of cells with low KLRK1 expression. These connections indicate that GZMK and KLRK1 are closely related to the activation of signaling pathways in CD8+ T cells.
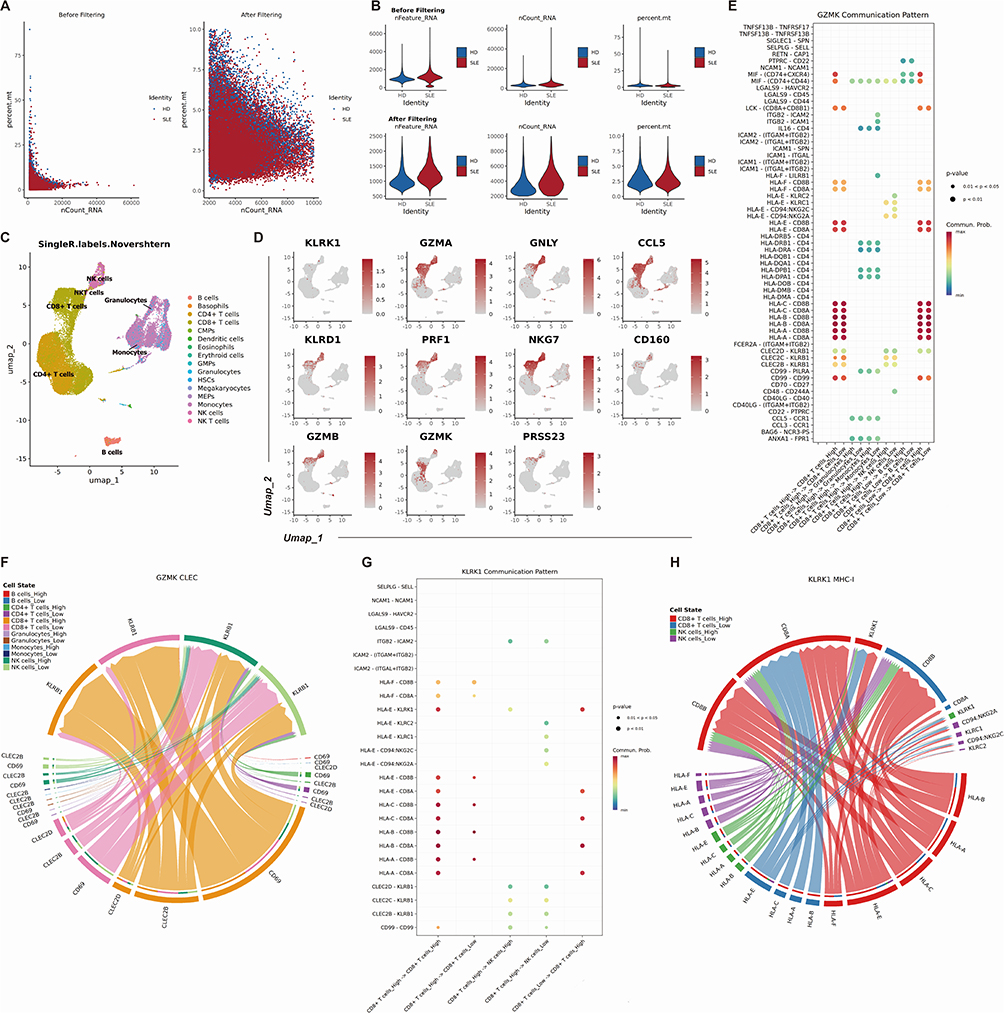 |
Figure 11 Single cell analysis localization and function analysis of hub genes. (A) A scatter plot comparing RNA counts and mitochondrial read percentage in single cell sequencing data before and after quality filtering, illustrating effective removal of low-quality cells. (B) Violin plots showing the distribution of gene counts and mitochondrial RNA content in single cell sequencing data pre- and post-filtering, confirming improved data quality. (C) Cell type composition through UMAP projection based on Novershtern hematopoietic reference data. Distinct clusters represent major blood cell lineages. (D) UMAP visualization of 11 hub genes expression in different clusters from SLE patients. (E) The bubble plot shows the relationship between cell types and ligand-receptor based on the GZMK expression level. (F) CLEC signaling pathway network between several cell types on the GZMK expression level. (G)The bubble plot shows the relationship between cell types and ligand-receptor based on the KLRK1 expression level. (H) MHC-I signaling pathway network between several cell types on the KLRK1 expression level. |
Validating the Expression Levels of GZMK and KLRK1 Using qPCR
To validate the key genes, we retrospectively collected clinical samples from SLE patients, including a total of 6 patients with coronary injury. Through propensity score matching, we included 8 patients without coronary involvement in SLE, and the baseline clinical information is shown in Table 3. We used qPCR to analyze the expression levels of GZMK and KLRK1 in PBMC from both groups of patients. Consistent with our findings, a significant down-regulation of GZMK and KLRK1 gene expression levels was exhibited in SLE patients with coronary injury (p<0.05, Figure 12A and B).
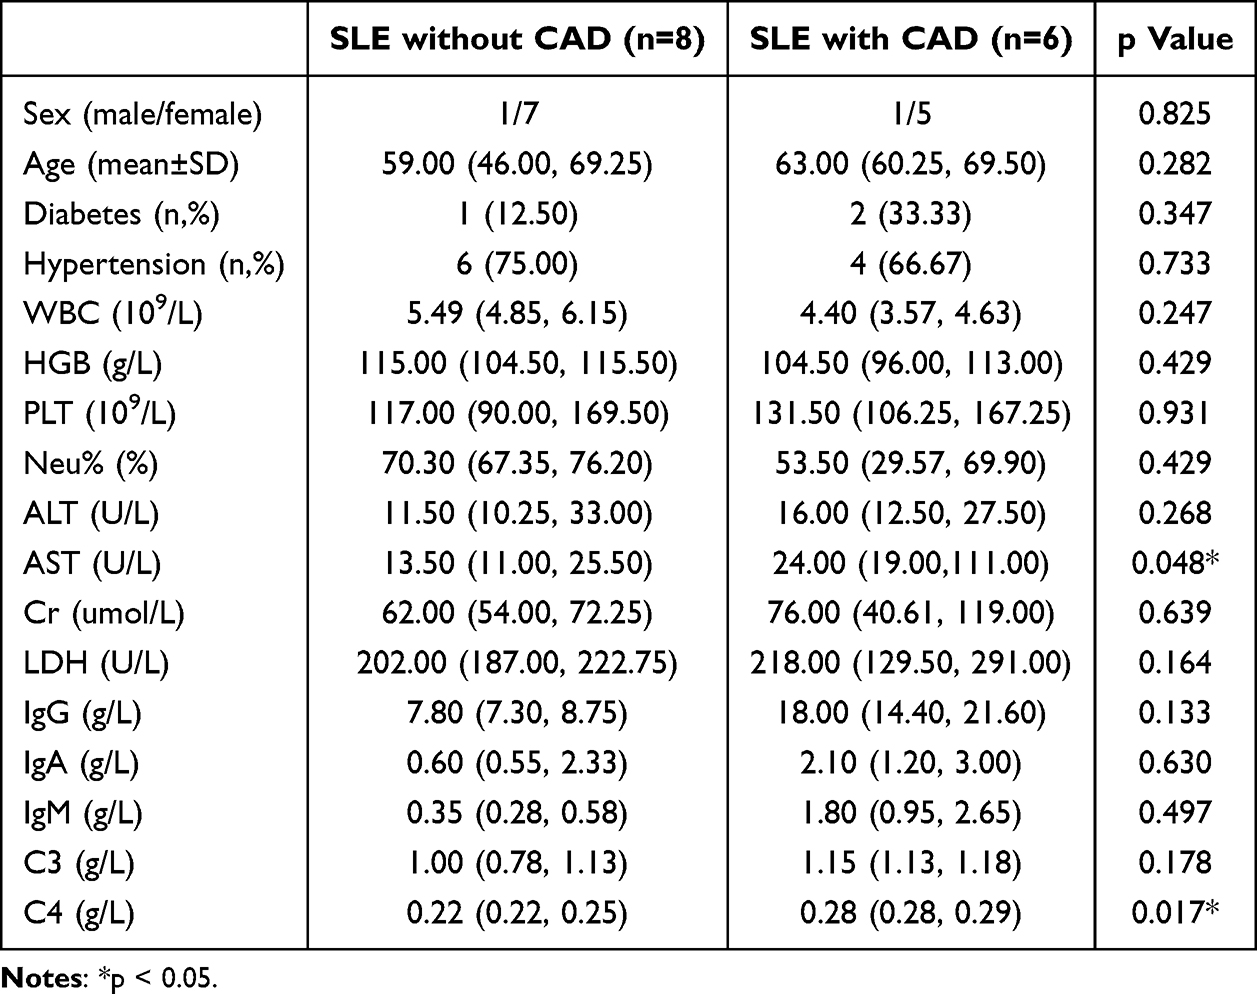 |
Table 3 The Clinical Features and Laboratory Indicators of SLE Patients Involved in This Study |
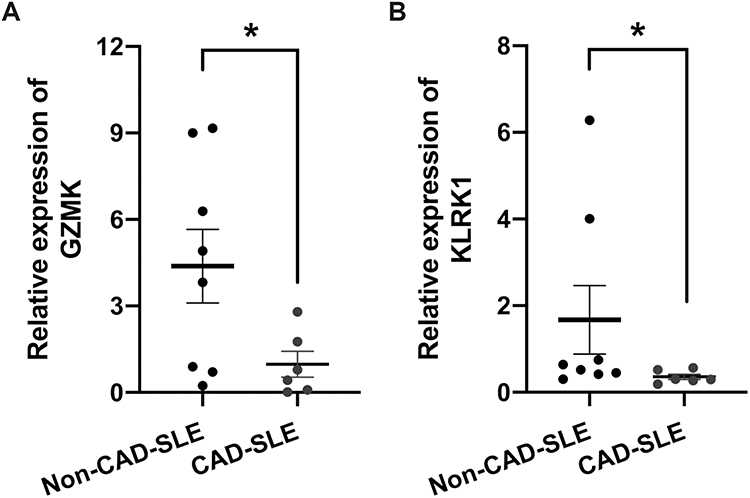 |
Figure 12 Validation of GZMK and KLRK1 expression by qPCR in a real-world SLE cohort. (A) Relative mRNA expression levels of GZMK in PBMC of SLE patient with CAD (n = 6) and non-CAD-SLE patients (n = 8). (B) Relative mRNA expression levels of KLRK1 in PBMC of SLE patient with CAD (n = 6) and non-CAD-SLE patients (n = 8). Mean ± SEM are plotted; *p < 0.05. |
Discussion
This study systematically reveals, for the first time, the molecular intersection mechanism between CAD and SLE at the gene regulatory network level by integrating bulk transcriptomic and single-cell transcriptomic sequencing data. It provides a new perspective for elucidating the unique pathophysiological processes of coronary injury in SLE patients. Notably, despite the distinct clinical manifestations and traditional risk profiles of SLE and CAD, our findings reveal a high degree of synergy in key pathways, particularly those involving dysfunction of cellular subpopulations. This cross-disease molecular convergence suggests that SLE-related coronary involvement may not be solely driven by traditional cardiovascular risk factors, but rather arises from a “double hit” effect of specific cell types under the background of autoimmunity. This finding challenges the previous hypothesis that SLE cardiovascular complications are attributed to accelerated atherosclerosis and emphasizes the central role of disease-specific microenvironmental remodeling.
Studies have shown that traditional risk factors such as obesity, diabetes, dyslipidemia, metabolic syndrome, smoking, and homocysteine are closely associated with the development of CAD in patients with SLE, and they are all recognized as independent risk indicator factors.16 In addition, some auto-antibodies such as antiphospholipid, anti-double-stranded DNA, and anti-endothelial cell antibodies, as well as soluble mediators and regulatory T cells (Tregs), are also associated with the progression of subclinical atherosclerosis and CAD, and possess the ability to independently predict the development of both.16,17 However, our findings suggest that beyond these established factors, molecular features in peripheral blood may provide novel predictive insights. Specifically, we identified reduced GSVA scores of cytotoxic T-cell-related genes GZMK and KLRK1 in SLE patients compare with healthy controls (adj p=0.0295, Effect size=−0.56), with further suppression in those with CMD (adj p=0.0121, Effect size=−1.00). This molecular evidence complements current understanding but also highlights critical gaps.
Existing research has primarily focused on manifestations of risk factors after cardiovascular damage becomes detectable, and has not established reliable tools for early risk stratification. Traditional Framingham Risk Score (FRS) and Systemic Coronary Risk Evaluation (SCORE), while useful in the general population, show limited applicability in SLE patients.18 For instance, a study using coronary artery calcification as an endpoint found no difference in FRS-predicted risk between lupus patients and controls.19 Our data propose a paradigm shift: integrating gene expression signatures like GZMK/KLRK1 with clinical parameters could overcome these limitations. The AUCs of 0.782 (SLE vs healthy) and 1.000 (CMD vs non-CMD) demonstrate their potential as components of a SLE-specific risk scoring system, enabling earlier intervention before overt cardiovascular damage occurs. For clinical translation, GZMK/KLRK1 testing could revolutionize SLE cardiovascular risk stratification. A validated blood-based qPCR assay could enable integration into routine rheumatology visits for high-risk SLE patients, particularly those with active nephritis or elevated anti-dsDNA. Furthermore, combining these biomarkers with advanced imaging like CMR and clinical scores such as SLEDAI may enhance early detection of subclinical coronary injury, thereby guiding preemptive immunosuppression or cardioprotective therapies. However, these findings should be viewed as preliminary evidence rather than definitive clinical insights. The robust biomarker performance in limited validation cohorts – particularly the AUC=1.000 in the CMD subgroup (n=4) – underscores the need for replication in prospective, multi-center studies with sample sizes sufficient to ensure statistical rigor. Essential next phases include developing standardized, cost-effective clinical detection kits; validating cutoff thresholds in independent cohorts (≥500 patients); and prospectively assessing biomarker performance against conventional risk tools including FRS and SCORE.
The specific mechanisms that promote atherosclerosis in SLE have not yet been fully understood. Building on the encouraging findings, we sought to explore potential pathogenic pathways using the same analytical framework. Research suggests that endothelial dysfunction attracts macrophages and T lymphocytes to the vascular wall. These immune cells, through the activation of pro-inflammatory cytokines, stimulate other cellular populations to participate in the inflammatory process, thereby driving the progression of atherosclerosis, which is the traditional pathogenesis of CAD.20 Our study extends this paradigm by identifying 23 shared cytotoxic lymphocyte-related genes through cross-disease WGCNA analysis (Figures 4 and 5), with GZMK and KLRK1 emerging as central players in SLE with coronary injury. Strikingly, combined use of these two genes achieved perfect discrimination (AUC=1.000) between SLE patients with and without coronary injury (Figure 10D), suggesting their synergistic role in coronary injury pathogenesis. The latest research shows that CD8+ T lymphocytes play a significant role in the pathogenesis of SLE.21 Our single-cell analysis revealed nuanced functional partitioning: GZMK showed bimodal expression in both NK and CD8+ T cells, while KLRK1 expression was restricted to cytotoxic subsets (Figure 11D). Notably, GZMKhigh CD8+ T cells exhibited unique intercellular communication via CLEC2B/KLRB1 (Figure 11E and F), whereas KLRK1high cells relied on HLA-CD8B interactions (Figure 11G and H). This differential signaling may explain their distinct contributions to disease progression.
In human peripheral blood, CD8+ effector memory T cells (TEM) can be divided into two groups: CD45RA negative and positive, with the latter being referred to as CD45RA re-expressing effector memory T cells (TEMRA). Compared with TEMRA cells, TEM cells differentiate earlier and carry a lower level of cytotoxicity and exhaustion genes.22,23 The CD8+GZMK+ subset corresponds to CD8+ TEM cells, characterized by high expression of GZMK, CXCR3, and IL6R, and lack of CCR7,24 while CD8+GZMB+ TEMRA cells represent a highly cytotoxic subtype expanded in SLE.24 Our findings align with but refine this model: peripheral GZMK downregulation in SLE-CMD patients (Effect size=−1.00, Figure 10B) may reflect accelerated differentiation from GZMK+ TEM to GZMB+ TEMRA cells, a transition potentially amplified by coronary involvement. This hypothesis is supported by the intermediate CD8+GZMK+ state observed in pseudo-temporal analyses,24 though direct quantification of GZMK+ T cell depletion in CMD requires future validation. In CAD pathogenesis, while increased CD8+ T cell infiltration is noted in high-risk patients,25,26 our cross-disease analysis bridges this observation with SLE comorbidity. The shared cytotoxic lymphocyte gene signature (including GZMBhigh TEMRA cells in CAD27 and SLE) suggests convergent immunopathological mechanisms. Paradoxically, SLE-CMD patients show further GZMK suppression despite general TEMRA expansion, implying coronary-specific exhaustion of protective TEM subsets or compensatory cytotoxicity amplification – a dichotomy demanding mechanistic exploration.
The role of KLRK1 (also known as natural killer cell group 2D, NKG2D) extends beyond its classical immune functions. Our single-cell interactome analysis uncovered that KLRK1high CD8+ T cells dominate HLA-CD8B-mediated communication networks (Figure 11G and H), potentially facilitating cytotoxic synapse formation. This aligns with its established role in cytolysis28,29 but introduces spatial organization insights. In SLE, NKG2D dysfunction manifests as impaired NK cell activation30 and expanded pro-inflammatory CD4+NKG2D+ subsets.31–33 We observed analogous intercellular crosstalk perturbations in SLE-CMD patients (Figure 11E–H), where diminished KLRK1-associated signaling (adj p=0.0121, Figure 10B) may disrupt immune homeostasis through dual pathways: 1) impaired NKG2D-NKG2DL-dependent Treg regulation,32 and 2) reduced HLA-CD8B interactions necessary for cytotoxic coordination. Notably, the concurrent GZMK/KLRK1 downregulation in CMD suggests synergistic failure of cytotoxicity regulation and intercellular communication – a “double-hit” mechanism potentially driving coronary endothelial injury. These findings contextualize prior observations of Treg deficiencies in CAD.34 The KLRK1-associated HLA signaling deficit (Figure 11H) may exacerbate CAD-related Treg impairment by disrupting immune-inhibitory checkpoints. Furthermore, the spatial segregation of GZMK/KLRK1 expression in cytotoxic subsets (Figure 11D) highlights the need for single-cell-resolution therapeutic targeting to preserve protective TEM subsets while mitigating TEMRA-mediated damage.
While our study identifies GZMK/KLRK1 as promising biomarkers, several limitations require emphasis. The perfect diagnostic accuracy (AUC=1.000) for coronary injury was achieved in a very small CMD subgroup (n=4), which increases overfitting risk and necessitates validation in larger cohorts. Similarly, external validation cohorts for CAD (GSE179789, n=8 controls/8 cases) and qPCR verification (n=14 total) had limited statistical power. These constraints preclude definitive clinical translation at this stage. Additionally, the cross-sectional design precludes causal inference regarding whether these signatures precede or result from coronary injury. Moreover, mechanistic insights into how GZMK/KLRK1 dysregulation drives endothelial damage remain speculative. Essential future directions comprise: establishing large-scale longitudinal cohorts to track GZMK/KLRK1 dynamics during SLE progression correlating with cardiovascular events; conducting functional validation through in vitro endothelial injury models and animal studies (eg, SLE-prone mice with GZMK/KLRK1 knockdown); implementing multi-omics integration (proteomics, epigenetics) to dissect upstream regulators of this cytotoxic axis; and expanding ethnic diversity beyond our Chinese cohort to assess biomarker generalizability.
Conclusion
This study reveals the molecular intersection mechanism of SLE and CAD in cytotoxic immune dysregulation, challenges the traditional cardiovascular risk assessment paradigm, and emphasizes the core role of disease-specific immune microenvironment remodeling. The functional defect of the GZMK/KLRK1 axis suggests a new mechanism in which the imbalance of CD8+ T cell differentiation and the abnormal HLA/CLEC signaling synergistically drive coronary artery injury in SLE. However, clinical implementation of GZMK and KLRK1 testing for predicting coronary involvement in SLE patients requires validation across larger-scale, multi-center cohorts. Future research must prioritize mechanistic links to endothelial damage and practical integration into SLE management algorithms.
Abbreviations
SLE, Systemic lupus erythematosus; CVD, Cardiovascular disease; CAD, Coronary artery disease; RNA, Ribonucleic acid; ACR, the American College of Rheumatology; PBMCs, Peripheral blood mononuclear cells; GEO, Gene Expression Omnibus; PCA, Principal component analysis; DEGs, Differentially expressed genes; WGCNA, Weighted gene co-expression network analysis; GSEA, Gene set enrichment analysis; GO, Gene ontology; KEGG, Kyoto Encyclopedia of Genes and Genomes; SVM-RFE, Support Vector Machine with Recursive Feature Elimination; GSVA, Gene Set Variation Analysis; ROC, Receiver operator characteristic curve; UMAP, Uniform Manifold Approximation and Projection; FC, fold change; NK, Nature killer; CMD, Coronary microvascular dysfunction; CMPs, Common myeloid progenitors; MEPs, Megakaryocyte-erythroid progenitors; Tregs, Regulatory T cells; FRS, Framingham Risk Score; SCORE, Systemic Coronary Risk Evaluation; TEM, Effector memory T cells; TEMRA, Re-expressing effector memory T cells.
Author Contributions
All authors made a significant contribution to the work reported, whether that is in the conception, study design, execution, acquisition of data, analysis and interpretation, or in all these areas; took part in drafting, revising or critically reviewing the article; gave final approval of the version to be published; have agreed on the journal to which the article has been submitted; and agree to be accountable for all aspects of the work.
Disclosure
The authors report no conflicts of interest in this work.
References
1. Atzeni F, Rodriguez-Pinto I, Cervera R. Cardiovascular disease risk in systemic lupus erythematous: certainties and controversies. Autoimmun Rev. 2024;23(10):103646. doi:10.1016/j.autrev.2024.103646
2. Mendoza-Pinto C, Munguia-Realpzo P, Garcia-Carrasco M, et al. Asymptomatic coronary artery disease assessed by coronary computed tomography in patients with systemic lupus erythematosus: a systematic review and meta-analysis. Eur J Intern Med. 2022;100:102–109. doi:10.1016/j.ejim.2022.04.001
3. Oliveira CB, Kaplan MJ. Cardiovascular disease risk and pathogenesis in systemic lupus erythematosus. Semin Immunopathol. 2022;44(3):309–324. doi:10.1007/s00281-022-00922-y
4. Esdaile JM, Abrahamowicz M, Grodzicky T, et al. Traditional Framingham risk factors fail to fully account for accelerated atherosclerosis in systemic lupus erythematosus. Arthritis Rheum. 2001;44(10):2331–2337. doi:10.1002/1529-0131(200110)44:10<2331::AID-ART395>3.0.CO;2-I
5. Lee AB, Godfrey T, Rowley KG, et al. Traditional risk factor assessment does not capture the extent of cardiovascular risk in systemic lupus erythematosus. Intern Med J. 2006;36(4):237–243. doi:10.1111/j.1445-5994.2006.01044.x
6. Pan L, Lu MP, Wang JH, Xu M, Yang SR. Immunological pathogenesis and treatment of systemic lupus erythematosus. World J Pediatr. 2020;16(1):19–30. doi:10.1007/s12519-019-00229-3
7. Guzman-Martinez G, Maranon C, Network CR. Immune mechanisms associated with cardiovascular disease in systemic lupus erythematosus: a path to potential biomarkers. Front Immunol. 2022;13:974826. doi:10.3389/fimmu.2022.974826
8. Frostegard J. Systemic lupus erythematosus and cardiovascular disease. J Intern Med. 2023;293(1):48–62. doi:10.1111/joim.13557
9. Yennemadi AS, Jordan N, Diong S, Keane J, Leisching G. The Link Between Dysregulated Immunometabolism and Vascular Damage: implications for the Development of Atherosclerosis in Systemic Lupus Erythematosus and Other Rheumatic Diseases. J Rheumatol. 2024;51(3):234–241. doi:10.3899/jrheum.2023-0833
10. Carlucci PM, Purmalek MM, Dey AK, et al. Neutrophil subsets and their gene signature associate with vascular inflammation and coronary atherosclerosis in lupus. Jci Insight. 2018;3(8). doi:10.1172/jci.insight.99276.
11. Ding H, Zhu G, Lin H, et al. Screening of Potential Circulating Diagnostic Biomarkers and Molecular Mechanisms of Systemic Lupus Erythematosus-Related Myocardial Infarction by Integrative Analysis. J Inflamm Res. 2023;16:3119–3134. doi:10.2147/JIR.S404066
12. Li C, Osmani L, Gu J, et al. POS1390 Single-cell Profiling Identifies Peripheral Immune Signature of Coronary Artery Disease in SLE Patients. Ann Rheu Dis. 2024;83:929. doi:10.1136/annrheumdis-2024-eular.412
13. Blachut D, Przywara-Chowaniec B, Tomasik A, Kukulski T, Morawiec B. Update of Potential Biomarkers in Risk Prediction and Monitoring of Atherosclerosis in Systemic Lupus Erythematosus to Prevent Cardiovascular Disease. Biomedicines. 2023;11(10):2814. doi:10.3390/biomedicines11102814
14. Hochberg MC. Updating the American College of Rheumatology revised criteria for the classification of systemic lupus erythematosus. Arthritis Rheum. 1997;40(9):1725. doi:10.1002/art.1780400928
15. Liu H, Zhang W, Zhang Y, et al. Mime: a flexible machine-learning framework to construct and visualize models for clinical characteristics prediction and feature selection. Comput Struct Biotechnol J. 2024;23:2798–2810. doi:10.1016/j.csbj.2024.06.035
16. Tselios K, Sheane BJ, Gladman DD, Urowitz MB. Optimal Monitoring For Coronary Heart Disease Risk in Patients with Systemic Lupus Erythematosus: a Systematic Review. J Rheumatol. 2016;43(1):54–65. doi:10.3899/jrheum.150460
17. Tselios K, Sarantopoulos A, Gkougkourelas I, Boura P. T regulatory cells: a promising new target in atherosclerosis. Crit Rev Immunol. 2014;34(5):389–397. doi:10.1615/CritRevImmunol.2014010802
18. Tselios K, Urowitz MB. Cardiovascular and Pulmonary Manifestations of Systemic Lupus Erythematosus. Curr Rheumatol Rev. 2017;13(3):206–218. doi:10.2174/1573397113666170704102444
19. Chung CP, Oeser A, Avalos I, Raggi P, Stein CM. Cardiovascular risk scores and the presence of subclinical coronary artery atherosclerosis in women with systemic lupus erythematosus. Lupus. 2006;15(9):562–569. doi:10.1177/0961203306071870
20. Hansson GK. Inflammation, atherosclerosis, and coronary artery disease. N Engl J Med. 2005;352(16):1685–1695. doi:10.1056/NEJMra043430
21. McKinney EF, Lyons PA, Carr EJ, et al. A CD8+ T cell transcription signature predicts prognosis in autoimmune disease. Nat Med. 2010;16(5):586–591. doi:10.1038/nm.2130. 581p following 591.
22. Lanzavecchia A, Sallusto F. Dynamics of T lymphocyte responses: intermediates, effectors, and memory cells. Science. 2000;290(5489):92–97. doi:10.1126/science.290.5489.92
23. Sallusto F, Geginat J, Lanzavecchia A. Central memory and effector memory T cell subsets: function, generation, and maintenance. Annu Rev Immunol. 2004;22(1):745–763. doi:10.1146/annurev.immunol.22.012703.104702
24. Xiong H, Cui M, Kong N, et al. Cytotoxic CD161(-)CD8(+) T(EMRA) cells contribute to the pathogenesis of systemic lupus erythematosus. EBioMedicine. 2023;90:104507. doi:10.1016/j.ebiom.2023.104507
25. Guo S, Gong Z, Sun X, et al. Consensus Clustering Analysis Identifies Ferroptosis-Related Patient Clusters and Predictive Signature Construction Based on Ferroptosis-Related Genes in Ischemic Cardiomyopathy. J Inflamm Res. 2024;17:6797–6814. doi:10.2147/JIR.S475645
26. Dai C, Wang D, Tao Q, et al. CD8(+) T and NK cells characterized by upregulation of NPEPPS and ABHD17A are associated with the co-occurrence of type 2 diabetes and coronary artery disease. Front Immunol. 2024;15:1267963. doi:10.3389/fimmu.2024.1267963
27. Iqneibi S, Saigusa R, Khan A, et al. Single cell transcriptomics reveals recent CD8T cell receptor signaling in patients with coronary artery disease. Front Immunol. 2023;14:1239148. doi:10.3389/fimmu.2023.1239148
28. Liu J, Dai K, Saliu MA, et al. Sodium valproate enhances efficacy of NKG2D CAR-T cells against glioblastoma. Front Immunol. 2024;15:1519777. doi:10.3389/fimmu.2024.1519777
29. Yang D, Wang H, Ni B, et al. Mutual activation of CD4+ T cells and monocytes mediated by NKG2D-MIC interaction requires IFN-gamma production in systemic lupus erythematosus. Mol Immunol. 2009;46(7):1432–1442. doi:10.1016/j.molimm.2008.12.010
30. Hervier B, Ribon M, Tarantino N, et al. Increased Concentrations of Circulating Soluble MHC Class I-Related Chain A (sMICA) and sMICB and Modulation of Plasma Membrane MICA Expression: potential Mechanisms and Correlation With Natural Killer Cell Activity in Systemic Lupus Erythematosus. Front Immunol. 2021;12:633658. doi:10.3389/fimmu.2021.633658
31. Dai Z, Turtle CJ, Booth GC, et al. Normally occurring NKG2D+CD4+ T cells are immunosuppressive and inversely correlated with disease activity in juvenile-onset lupus. J Exp Med. 2009;206(4):793–805. doi:10.1084/jem.20081648
32. Yang D, Tian Z, Zhang M, et al. NKG2D(+)CD4(+) T Cells Kill Regulatory T Cells in a NKG2D-NKG2D Ligand- Dependent Manner in Systemic Lupus Erythematosus. Sci Rep. 2017;7(1):1288. doi:10.1038/s41598-017-01379-y
33. Wang T, Wei L, Meng S, et al. Coordinated Priming of NKG2D Pathway by IL-15 Enhanced Functional Properties of Cytotoxic CD4(+)CD28(-) T Cells Expanded in Systemic Lupus Erythematosus. Inflammation. 2023;46(5):1587–1601. doi:10.1007/s10753-023-01860-z
34. Huang L, Zheng Y, Yuan X, et al. Decreased frequencies and impaired functions of the CD31(+) subpopulation in T(reg) cells associated with decreased FoxP3 expression and enhanced T(reg) cell defects in patients with coronary heart disease. Clin Exp Immunol. 2017;187(3):441–454. doi:10.1111/cei.12897
 © 2025 The Author(s). This work is published and licensed by Dove Medical Press Limited. The
full terms of this license are available at https://www.dovepress.com/terms
and incorporate the Creative Commons Attribution
- Non Commercial (unported, 4.0) License.
By accessing the work you hereby accept the Terms. Non-commercial uses of the work are permitted
without any further permission from Dove Medical Press Limited, provided the work is properly
attributed. For permission for commercial use of this work, please see paragraphs 4.2 and 5 of our Terms.
© 2025 The Author(s). This work is published and licensed by Dove Medical Press Limited. The
full terms of this license are available at https://www.dovepress.com/terms
and incorporate the Creative Commons Attribution
- Non Commercial (unported, 4.0) License.
By accessing the work you hereby accept the Terms. Non-commercial uses of the work are permitted
without any further permission from Dove Medical Press Limited, provided the work is properly
attributed. For permission for commercial use of this work, please see paragraphs 4.2 and 5 of our Terms.