Back to Journals » Clinical Ophthalmology » Volume 16
Productivity Loss and Predictive Factors Among Visually Impaired Adults in Tertiary Eye Care Centers, Addis Ababa, Ethiopia: A Dual-Center Cross-Sectional Study
Authors Anbesse DH, W/Yohannes G, Assefa M
Received 3 August 2022
Accepted for publication 17 October 2022
Published 7 November 2022 Volume 2022:16 Pages 3661—3671
DOI https://doi.org/10.2147/OPTH.S383600
Checked for plagiarism Yes
Review by Single anonymous peer review
Peer reviewer comments 2
Editor who approved publication: Dr Scott Fraser
Dereje Hayilu Anbesse,1 Getachew W/Yohannes,2 Milisha Assefa3
1Department of Ophthalmology, St. Paul’s Hospital Millennium Medical College, Addis Ababa, Ethiopia; 2School of Public Health, Yekatit 12 Hospital Medical College, Addis Ababa, Ethiopia; 3Department of Biomedical, Yekatit 12 Hospital Medical College, Addis Ababa, Ethiopia
Correspondence: Dereje Hayilu Anbesse, POB 1271, Tel +251-9-10-04-69-30, Email [email protected]
Introduction: Visual impairment has a profound impact on loss of economy and productivity, which can impair health-related quality of life.
Objective: The purpose of this study was to determine productivity loss and its predictive factors among adults with visual impairment in Addis Ababa tertiary eye care centers, Ethiopia.
Methods: An institution-based cross-sectional study was conducted between February and July 30, 2021. A total of 425 samples were retrieved using systematic random sampling. Data collection included socio-demographic information, employment status, job absenteeism, presenteeism and reduced work participation. Analysis was done by SPSS version 23, and binary logistic regression was employed for statistical analysis. P-values less than 0.05 were used to state significant associations between dependent and outcome variables.
Results: A total of 416 study participants were involved in the study, with a response rate of 97.88%. The mean age was 48± 14.3 years. The total productivity loss was $775,325.51, with a median of $358.02. Maximum productivity loss was contributed by reduced workforce participation, which was about $746,337.45, with a median of $1,432.10. Regarding predictor factors, gender, monthly income, degree and duration of visual impairment and support of family to get job were statistically associated with high productivity loss.
Conclusion: In general, the current study revealed that there is a profound annual loss of productivity due to visual impairment. The predictor factors for higher productivity loss were gender, monthly income, degree of visual impairment, duration of visual impairment and presence of support from family to get job or achieve better performance on job activities. Rehabilitation for visually impaired adults is recommended to enhance their quality of life by increasing their workplace participation to the maximum potential.
Keywords: productivity loss, visual impairment, Ethiopia
Introduction
Visual impairment affecting the sight of one or both eyes can lead to inability to correctly see and identify objects in the field of view and/or surrounding area. It can be caused by different ocular diseases which affect the visual systems of the eye and its visual functions such as visual acuity, field of vision, perception and discrimination of color, depth or three-dimensional view of an object and contrast sensitivity.1–3 Globally, 36 million people are blind; 217 million have moderate to severe visual impairment and 188.5 have mild visual impairment.2 In Ethiopia, the prevalence rate of blindness is 1.6% and that of moderate to severe visual impairment, which can be termed low vision, is 3.7%.4
Productivity costs are costs related to production loss and replacement costs due to illness, disability and death of productive persons, both paid and unpaid, and it can be explained as certain millions per year. It can be measured in different ways such as unemployment, job absenteeism, and reduced workforce participation.5–8
Individuals with impaired vision have low employment status and their job participation and potential financial gain are reduced in comparison to those who have normal sight in both eyes. The world economic loss occurring as a result of impact of visual impairment was about 42 billion USD in 2000 and estimated to rise to 110 billion USD in 2020.9–11 More than 90% of global visual impairment burden is in developing countries. However the highest loss of productivity and economic burdens due to visual impairment were reported from developed countries and there were insufficient data in developing nations regarding visual impairment burden on economic productivity.12
Better quality of life, economic independence and community acceptance are dependent on having private business or employment with acceptable financial gain, which can be affected if somebody has impaired vision. So, it is recommended to explore the economic loss occurring due to visual impairment by determining participation in paid jobs, financial independence and health-related impact of visual impairment on quality life of individuals, families and society in general.7–9 There is also insufficient information about the potential factors which can predict or explain the amount of loss of productivity due to visual impairment.
The purpose of this study was to estimate the loss of productivity due to visual impairments in terms of job absenteeism, presenteeism with limited performance and reduced workforce participation and explore potential predictive factors among visually impaired people.
Methods
Study Design and Setting
A cross-sectional design study was conducted at tertiary eye care centers found in Addis Ababa city from February up to July, 2021. There are two tertiary eye care centers, namely, Menelik II Referral Hospital Department of Ophthalmology and St. Paul’s Hospital Millennium Medical College Department of Ophthalmology. These two centers have sub-specialty clinics which make it possible to examine a patient with eye conditions to the end stage because of availability of high profile ophthalmic professionals and equipment so that every patient can get their maximum possible diagnosis and treatment. Both centers are serving as final referral centers for people of Addis Ababa, which is about 6 million, and surrounding regions of Ethiopia.
Population and Sampling
All study populations with confirmed diagnosis of visual impairments and working age groups (15–64 years old) were part of the study and they were selected from source population who were all patients with eye diseases at the two centers. Subjects who were unable to give answers to interview were excluded from the study. There is no similar study with the same setting and design in Ethiopia or another country with related socio-economic status, so the sample was determined using single population proportion formula in consideration of (Z α/2)2, 50% proportion, 5% marginal error and 95% confidence interval. The calculation was done as follows:
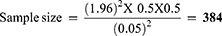
By considering 10% response rate, the total and final sample size obtained was 425.
Systematic random sampling technique was used to select the study sample. The samples were collected from Menelik II Referral Hospital Department of Ophthalmology and St. Paul’s Hospital Millennium Medical College Department of Ophthalmology by proportional sample size allocation. From the current information obtained from triage offices of the two centers every day, about 500 (300 from Menelik II Referral Hospital and 200 from St. Paul’s) patients got ophthalmic medical services. From the study conducted in St. Paul’s in 2018, the prevalence of visual impairment was 17.65%.13 That means every day 52.95 visually impaired people received services in Black lion Hospital and 35.3 visually impaired people in St. Paul’s; the proportion of the two cases was 1.53. Therefore, the sample at Menelik II Referral Hospital was 425/1.53 = 278 and that of St. Paul’s was 425–278 = 147.
Each day at Menelik II Referral Hospital about 53 visually impaired subjects are getting service and in eight weeks it is about 2120; in St. Paul’s it is 35 subjects per day, which equals 1400 in eight weeks. Therefore the total study population was 3520 within the study period. From 3520 study subjects, 425 were retrieved using systematic random sampling. The interval of selection or k-value was determined by the formula: total study population/sample size =3 520/425 = 8; using 8 as a sampling interval, every 8th subject was selected from everyday visually impaired subjects found at the two centers. The first sample was selected randomly from one up to eight subjects and then every 8th sample was retrieved.
Ethics and Data Collection Procedures
Ethical approval was obtained from the institutional review board of Yekatit 12 medical college. Supporting letter and permission were obtained from Addis Ababa city administration research and publication offices and St. Paul’s Hospital Millennium Medical College IRB offices to proceed with the data collection. The Declaration of Helsinki ethical principles were under consideration in the ethical process of the study. Oral informed consent was obtained from all participants. For those participants aged 15–18 years, consent were obtained from family/guardian and as well they were to show their willingness. The oral informed consent was accepted and approved by ethics review board prior to data collection.
Data collection was done using standardized and structured questionnaires and data extraction format. Data collection questionnaire includes socio-demographic information, employment status, job absenteeism, presenteeism and reduced work participation. Absenteeism was described as number of missed working days in the last 30 days due to visual impairment. Reduced workforce participation was assessed as an excess and early retirement from a job due to visual impairment. Presenteeism was assessed by 8-item work limitation questionnaire, which was validated and checked for reliability.14 It expresses the percentage of difficulties on a job labeled into five categories (all of the time [100%], most of the time [75%], some of the time [50%], very short time [25%], none of the time [0%] and not applicable), and all subjects were questioned on these categories. The score of 0% represented that an individual experienced difficulties none of the time and 100% represented all of the time.
Clinical characteristics include best corrected visual acuity for both eyes, primary diagnosis confirmed by physician as primary cause for visual impairment and secondary diagnoses extracted from medical charts. The data was collected by trained optometrists working at selected hospitals.
Operational Definitions
Mild visual impairment: Best corrected visual acuity from 6/18 to 6/60 in better seeing eye. Moderate visual impairment: Best corrected visual acuity less from than 6/60 to 3/60 in better seeing eye. Severe visual impairment/blindness: Best corrected visual acuity from less than 3/60 to no light perception in better seeing eye. Visual rehabilitation: Includes any vision-enhancing service like access to low vision aids and council regarding coping with visual impairment.
Job absenteeism: measured by converting money loss due to days of work missed because of visual impairment. Reduced work participation: measured by the sum of money loss due to premature exit from a labor market due to visual impairment that is before the age of 65 and unemployment rate. Presenteeism: measured by 8-item work limitation questionnaire and converted to money loss by taking percentage of activity limitations multiplied by average monthly income.
Productivity loss was determined in terms of absenteeism from a job due to visual impairment, reduced workforce participation and presenteeism with limited work activities in the workplace.
Statistical Analysis
Data entry was done using Epidata version 3.1 and analysis was done by SPSS version 23. Descriptive statistics such as mean, median and standard deviation were calculated to summarize descriptive data. Productivity loss was retrieved by cumulative frequency of absenteeism, reduced workforce participation and presenteeism. It was classified as high and low based on median value. Predictive factors associated with high productivity loss were analyzed by binary logistic regression. Variables with p-value less than 20% at bi-variables logistic regression were entered into multivariable logistic regression to identify statistically significant variables for productivity loss. P-values less than 5% with 95% confidence interval were used to declare statistically significant associations between the variables.
Results
A total of 416 study participants were involved in the study, with a response rate of 97.88%. The mean age of the study participants was 48 years, with a 14.3 SD. From all participants, nearly half or 200 (48.1%) were between the ages of 56 and 64 years. More than half (242, 58.2%) were male and about 299 (71.9%) were urban residents. About 107 (25.5%) study subjects had no formal education, and among all study participants, 59 (14.2%) had nooccupation. From all participants, 127 (30.5%) were living with their parents and most subjects earnt less than $57.16 per month (Table 1).
 |
Table 1 Socio-Demographic Characteristics of Visually Impaired Adults in Addis Ababa Tertiary Eye Care Centers, 2021 |
Degree of visual impairment was classified based on best corrected visual acuity in the better seeing eye. Based on that, about 56 (13.5%) had blindness in which their visual acuity was from 3/60 up to no light perception. About 161 (38.7%) participants had lived with visual impairment for more than four years. One-third (139, 33.4%) had associated systemic co-morbidities such as diabetes mellitus and hypertension and only 14 (3.4%) had disabilities other than visual impairment. Regarding support on job or to get job, about 139 (66.6%) reported that they had support from their family to get job or achieve better performance on job activities; 14 (3.4%) had some sort of training to cope with their visual impairment; 244 (58.7%) used visual aid for their eye, which includes eye glasses and magnifiers; and only 12 (2.9%) participants had an opportunity to access visual rehabilitation (Table 2).
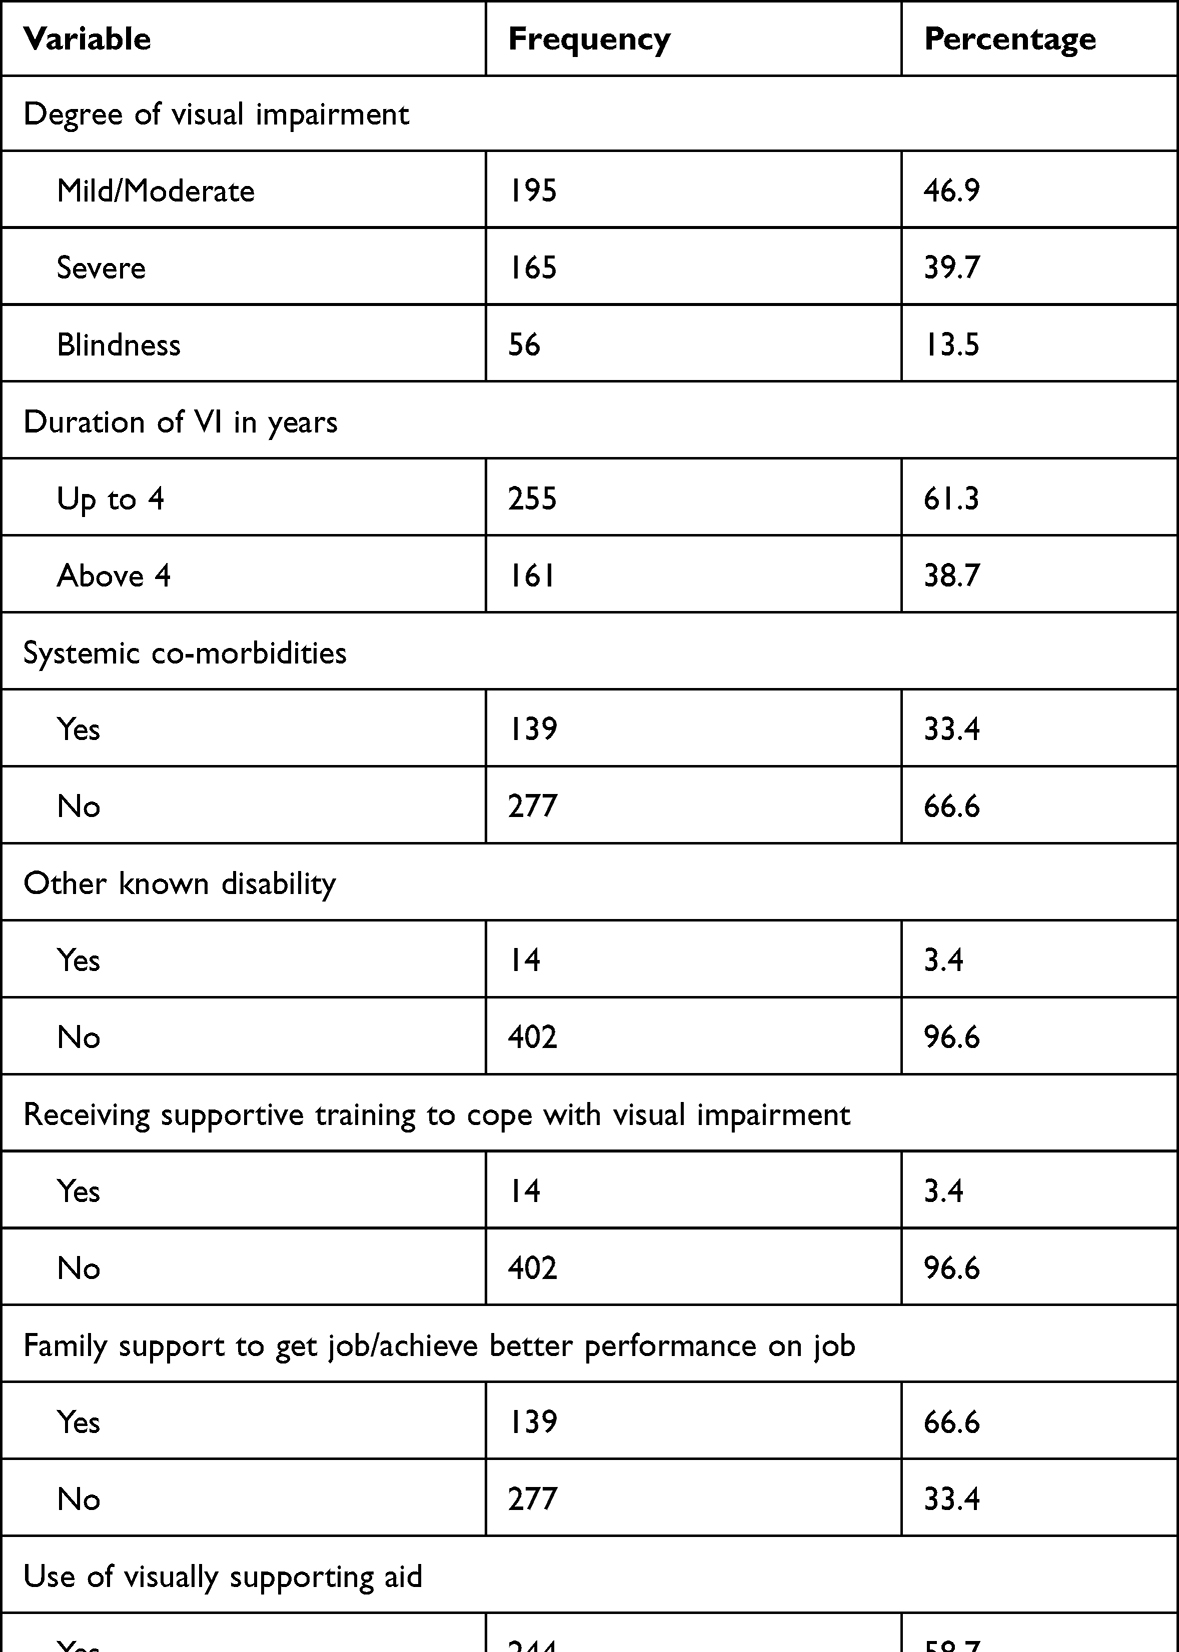 |
Table 2 Clinical Characteristics of Visually Impaired Adults in Addis Ababa Tertiary Eye Care Centers, 2021 |
With regard to productivity loss, the median monthly income of a participant was $57.16. Total annual absenteeism, which was obtained by converting monthly loss to an annual amount by multiplying it by 12 months of the year, was $5,812.08, with a median of $26.38. Reduced workforce participation was estimated as a sum of excess unemployment due to visual impairment and early retirement from a job due to visual impairment. The Ethiopian unemployment rate in 2020 was 18.7% (25); in the current study, by excluding students the unemployment rate was 49.7%, so that the excess unemployment associated with visual impairment was 31%. On the other hand, the mean age of retirement for visually impaired participants were 39 years and 25 participants discontinued their job due to visual impairment. Therefore, reduced workforce participation was calculated as (64–39) x2500x25x12, in which 64 is upper age limit for work, 39 is mean age of retirement from a job due to visual impairment, $57.16 is average monthly income, 25 is number of participants who discontinued their job due to visual impairment, and 12 is months of the year. Total reduced workforce participation was $746,337.45 and median was $1,432.10. Presenteeism was determined by an 8-item work limitation questionnaire and changed to money loss by multiplying the average percent of limited work activities on a job and an average monthly income. The loss due to presenteeism was $23,533.95, with a median of $171.47. Therefore, total productivity loss in this study was $775,325.51, with a median of $358.02 (Figure 1).
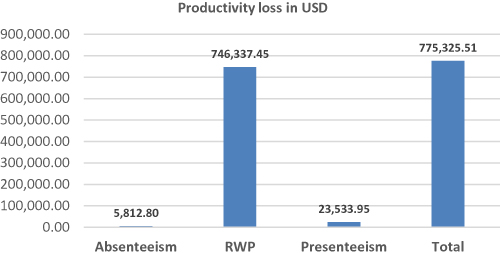 |
Figure 1 Productivity loss of study participants among visually impaired adults in Addis Ababa tertiary eye care centers, 2021. Abbreviations: USD, United States Dollar; RWP, reduced workforce participation. |
With bi-variable logistic regression, certain variables such as sex, educational status, monthly income, degree of visual impairment, duration of visual impairment, support of family to get job and use of visual aids were associated with high productivity loss due to visual impairment. However, with multivariable logistic regression analysis, only sex, monthly income, degree of visual impairment, duration of visual impairment and support of family to get job were statistically associated with high productivity loss. As a result, female study subjects were 2.36 times more likely to lose their productivity in comparison to male subjects (2.36, 95% CI [1.13, 4.92]). Those who earn less than $57.16 per months were 6.13 times more likely to experience higher productivity loss than those who earn more than $57.16 (6.13, 95% CI [2.69, 13.89]). Individuals with severe vision impairment were 20.83 times more likely to experience higher productivity loss than those with mild visual impairment (20.83, 95% CI [4.80, 90.91]). Participants who have lived for more than four years with visual impairment were 3.70 more likely to experience higher productivity loss than those who have lived for less than 4 years with such loss (3.70, [95% CI [1.82, 7.52]). In addition, participants who have no family support to get job or achieve better perform on job were 8.21 times more likely to experience higher productivity loss than those who have such support (8.21, 95% CI [2.69, 13.89]) (Table 3).
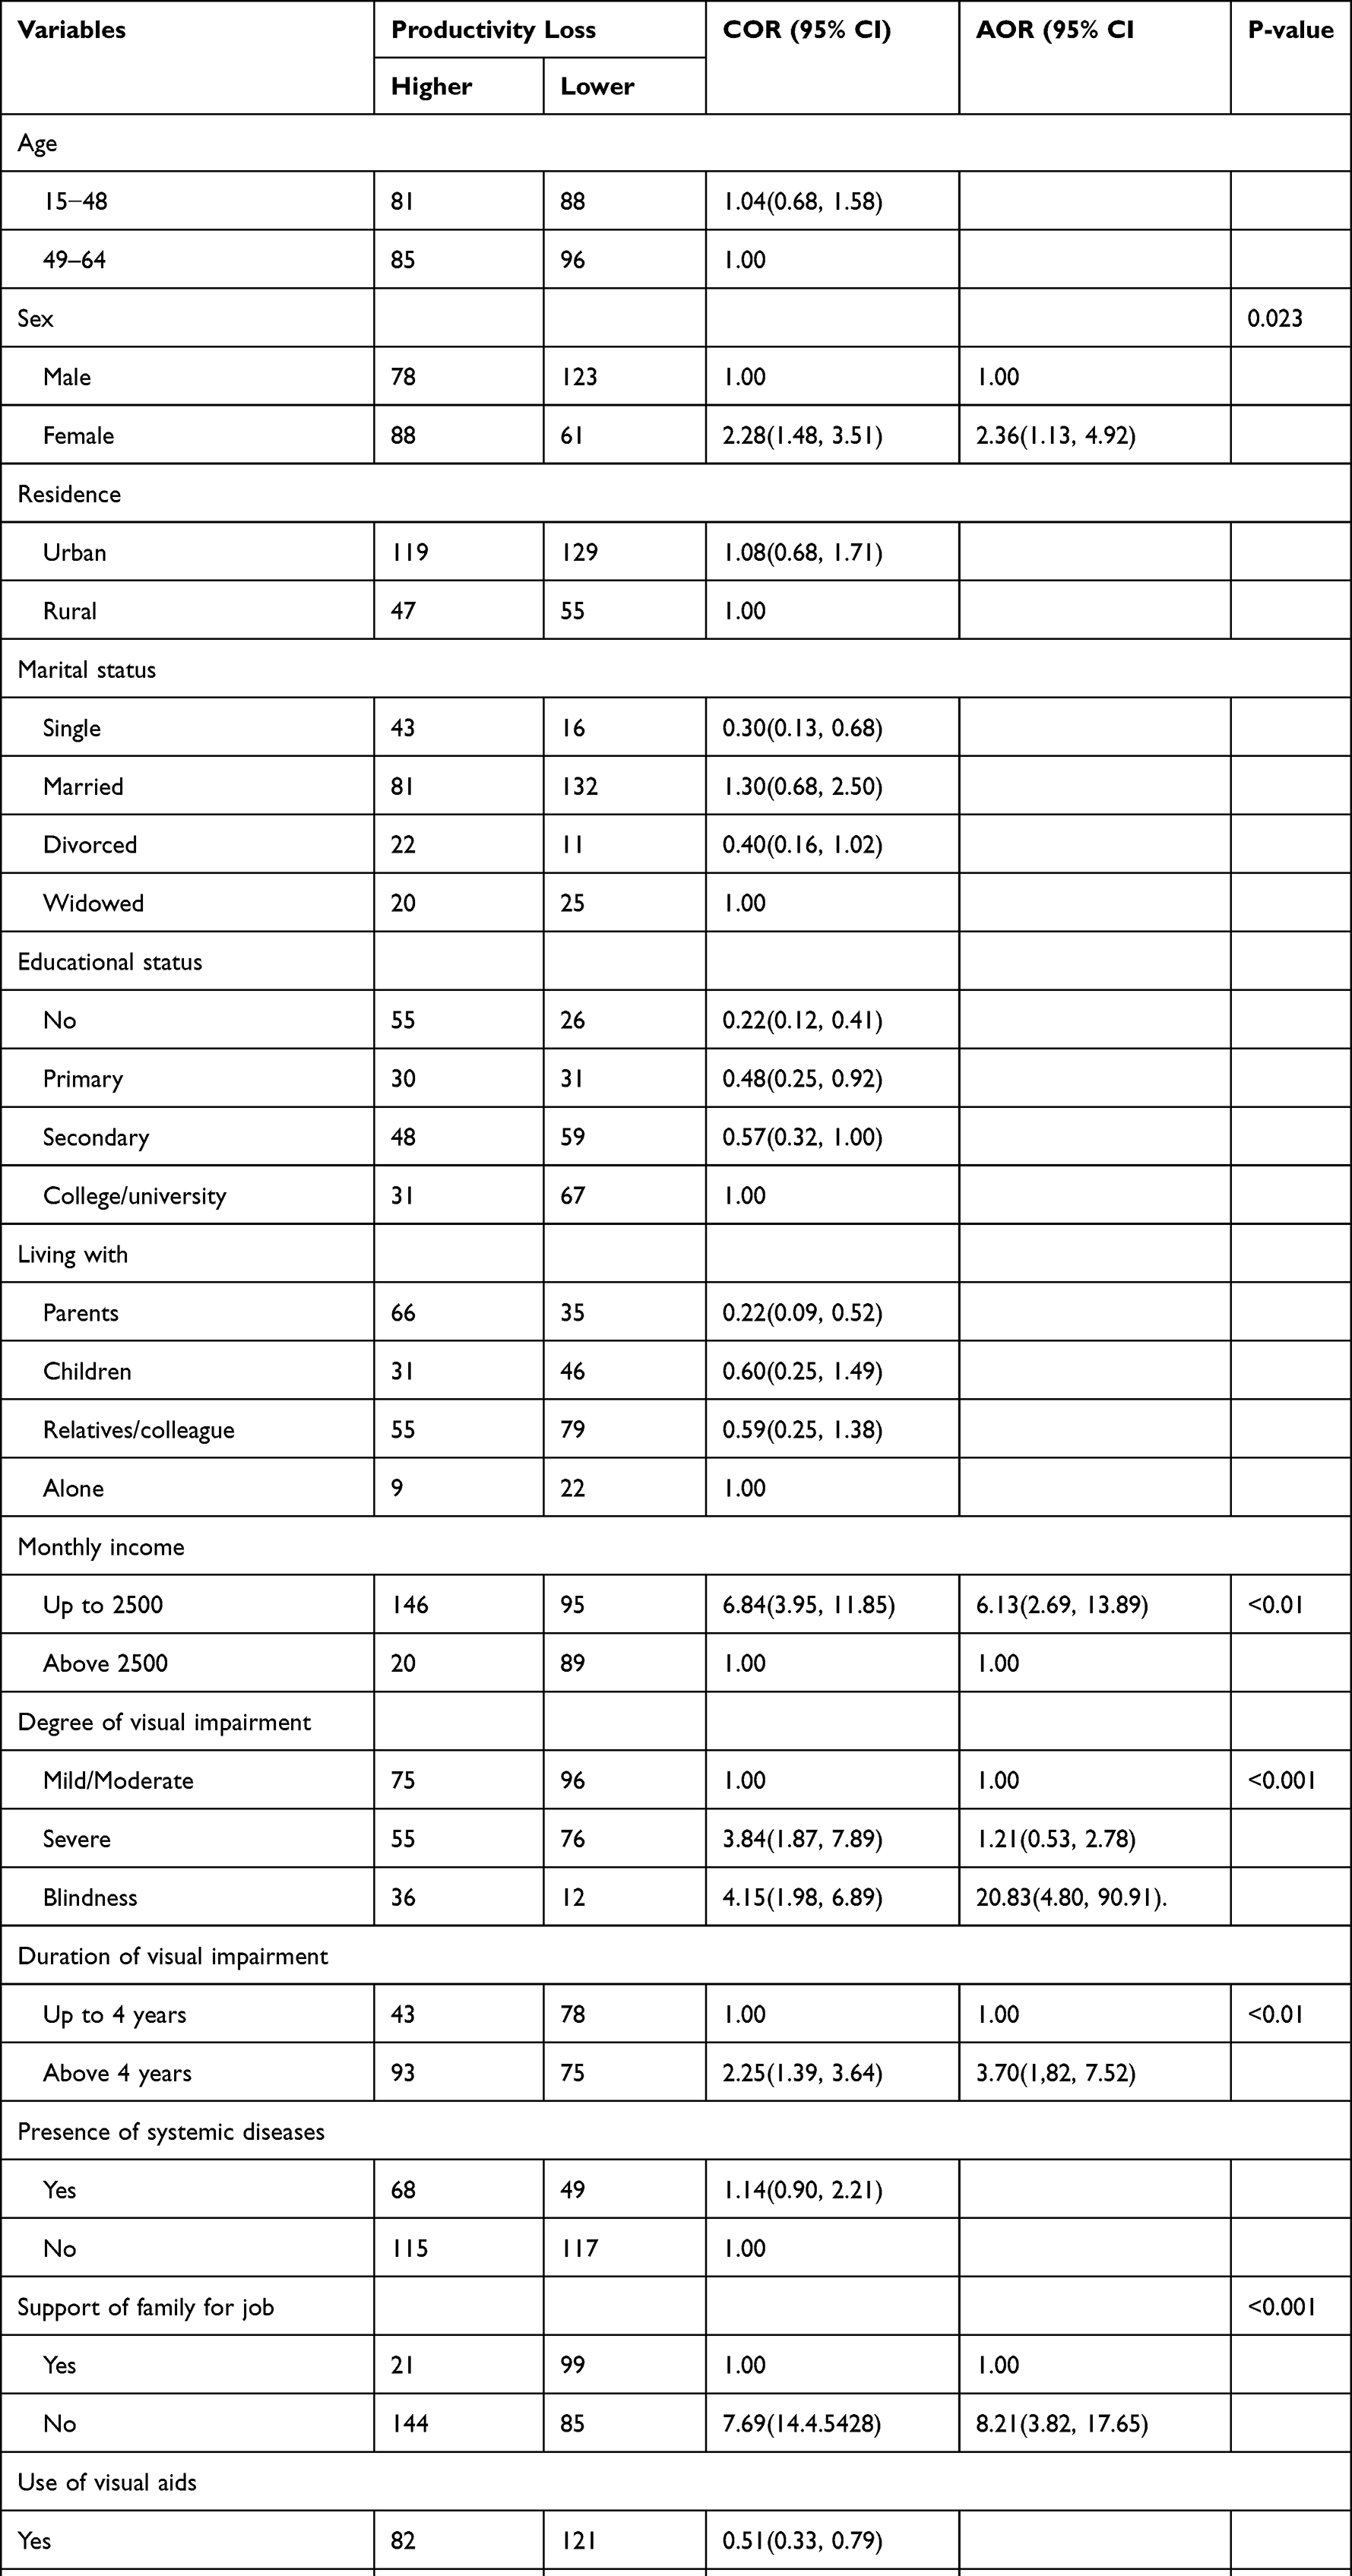 |
Table 3 Predictive Factors of Productivity Loss Among Visually Impaired Adults in Addis Ababa Tertiary Eye Care Centers, 2021 |
Discussion
The current study revealed that there is a loss of productivity for those individuals with mild to severe visual impairment among study participants in the age range of 15 to 64 years. Different studies were conducted to measure productivity loss due to visual impairment in different ways, which includes absenteeism, reduced workforce participation and presenteeism with limited activities on a job. Unfortunately, many of the studies were conducted in developed countries and most of them focused on the general population of states or countries.15–17 However, this study was done on sampled group of people which could not represent the general population.
The total annual productivity loss due to visual impairment was $775,325.51, with a median of $358.02 (95% CI [314.34, 477.37%]). This finding is lower than the study conducted in Portugal on adults with visual impairments, which was £1.51 million per year.18 This difference might be attributed to the variations in socio-economic values between the two different settings. For instance, average monthly income in our study was expected to be lower and also the unemployment rate due to visual impairment was 31% whereas the unemployment rate for that of Portugal was 25%. These factors might contribute to lower value of productivity loss, which does not mean that the impact of visual impairment in economic loss is lower in the current study.
The maximum productivity loss was accounted for by reduced workforce participation, which was about $746,337.45, with a median of $1,432.10, followed by presenteeism, which accounts for $23,533.95, with a median of $171.47. However, productivity loss occurring due to absenteeism was lower, and it accounts for about $5,812.08, with a median of $26.38. A similar study conducted in Portugal indicated that the maximum productivity loss was determined by reduced workforce participation.18
Regarding predictive factors, gender, monthly income, degree and duration of visual impairment and support of family to get job were statistically associated with high productivity loss. With respect to gender, female study subjects were 2.36 times more likely to have higher productivity loss due to visual impairment in comparison to male subjects (2.36, 95% CI [1.13, 4.92]). This finding is consistent with those of Zimbabwe and New Zealand.19,20 This finding can be explained by the fact that the chance of employment is higher in males than females. Similar results were reported from Zimbabwe and New Zealand and this is due to the higher chance of employment in males than females.19,20 In addition, the burden of blindness and moderate to severe visual impairment is higher for females than males and this is also a possible reason for their higher economic or productivity loss; this is true in all of the world.2
Those who earn less than $57.16 were 6.13% more likely to experience higher productivity loss than those who earn more than $57.16 (6.13, 95% CI [2.69, 13.89]). The mean monthly income for visually impaired adults is different in different countries and in Ethiopia it is reported that average monthly income is thought to be lower and it is about $70.83 adjusted for 12 months from a per capita of $850, according to a world bank report published in March, 2021. In our study it is about $57.16 and our finding is lower than that for average people of Ethiopia. This might be due to the low unemployment rates of and job opportunities for visually impaired individuals and so the productivity loss is higher among those with lower monthly incomes.
Besides that, individuals with severe visual impairment were 20.83 times more likely to experience higher productivity loss than those with mild visual impairment (20.83, 95% CI [4.80, 90.91]). As the severity of visual impairment increases, so the opportunity to participate in the labor market decreases, which has a significant effect on one’s income. A systematic review revealed that visual impairment and blindness cause a considerable economic loss for affected persons, their caregivers and society at large, which increases significantly with degree of visual impairment.21
Participants who had lived for more than four years with visual impairment were 3.70 times more likely to experience higher productivity loss than those who had lived for less than four years with such impairment (3.70, 95% CI [182, 7.52]). Duration of visual impairment is usually associated with worsening of disease prognosis and it is also subject to reduced health- and vision-related quality of life. Economic loss is also associated with extended visual impairment.7,12
In addition, participants who have no family support to get a job or cannot perform better on a job were 8.21 times more likely to experience higher productivity loss than those who have such support (8.21, 95% CI [2.69, 13.89]). This indicated that practical support for individuals with visual impairment to get a job and achieve better performance can increase economic gain. It was indicated in different studies that practical support from partner or family and giving of adjustment training significantly affected economic productivity in terms of getting employment and increasing work-force participation.22–24
Rehabilitation for visually impaired adults is recommended to enhance their quality of life by increasing their workplace participation to the maximum potential. It is also better if ophthalmic hospitals provide regular education and counseling for both patients and their families on how to find gainful employment, emphasising female adults and those with severe and longer duration of visual impairment.
This study had some limitations, even though it has several strengths. It would have been better if there were control groups to compare with because it could have given a better picture of productivity loss due to visual impairment. The questionnaire used to assess loss of productivity was based on the recalling ability of participants, thus it may be subject to recall bias.
Conclusion
In general, the current study revealed that there is a profound annual loss of productivity due to visual impairment. Most of the productivity loss occurred due to reduced workforce participation and certain loss was due to absenteeism from a job and limited activities on a job. The predictive factors for higher productivity loss were gender, monthly income, degree of visual impairment, duration of visual impairment and presence of support from family to get job or achieve better performance on job activities.
Data Availability
All information related to the current study is found in the manuscript and more data is available upon request.
Acknowledgment
We would like to thank Yekatit 12 hospital medical college institutional review board for providing us with the ethical clearance and also extend our gratitude to study participants for their voluntary participation in the study.
Disclosure
All authors confirmed that there are no competing or conflicting interests.
References
1. World Health Organization. World Report on Vision. Geneva: World Health Organization; 2019. Licence: CC BY-NC-SA 3.0 IGO.
2. Bourne RRA, Flaxman SR, Braithwaite T, et al. Magnitude, temporal trends, and projections of the global prevalence of blindness and distance and near vision impairment: a systematic review and meta-analysis. Lancet Glob Health. 2017;5(9):e888–e97. doi:10.1016/S2214-109X(17)30293-0
3. World Health Organization. International Classification of Diseases t. Available from: https://www.RI-Waa,who.int/classifications/icd/en/aJ.
4. Berhane Y, Worku A, Bejiga A, et al. Prevalence and causes of blindness and low vision in Ethiopia. Ethiop J Health Dev. 2008;04/15:21.
5. Mitchell RJ, Bates P. Measuring health-related productivity loss. Popul Health Manag. 2011;14(2):93–98. PMID: 21091370. doi:10.1089/pop.2010.0014
6. Mattke S, Balakrishnan A, Bergamo G, Newberry SJ. A review of methods to measure health-related productivity loss. Am J Manag Care. 2007;13(4):211–217. PMID: 1740834.
7. Frick KD. What the comprehensive economics of blindness and visual impairment can help us understand. Indian J Ophthalmol. 2012;60(5):406–410. PMID: 22944750. Pubmed Central PMCID: PMC3491266. doi:10.4103/0301-4738.100535
8. Langelaan M, De Boer MR, Van Nispen RMA, Wouters B, Moll AC, Van Rens GH. Impact of visual impairment on quality of life: a comparison with quality of life in the general population and with other chronic conditions. Ophthalmic Epidemiol. 2007;14(3):119–126. doi:10.1080/09286580601139212
9. Kempen GI, Ballemans J, Ranchor AV, Van Rens GH, Zijlstra GA. The impact of low vision on activities of daily living, symptoms of depression, feelings of anxiety and social support in community-living older adults seeking vision rehabilitation services. Qual Life Res. 2012;21(8):1405–1411. PubMed PMID: 22090173. doi:10.1007/s11136-011-0061-y
10. Flores V, Coco R, Alamo T, Ortiz E, Coco B. The impact of low vision in the activities of daily living and emotional state of elderly people. Invest Ophthalmol Vis Sci. 2012;53(14):4413.
11. Frick KD, Kymes SM, Lee PP, et al. The cost of visual impairment: purposes, perspectives, and guidance. Invest Ophthalmol Vis Sci. 2010;51(4):1801–1805. doi:10.1167/iovs.09-4469
12. Marques AP, Ramke J, Cairns J, et al. Estimating the global cost of vision impairment and its major causes: protocol for a systematic review. BMJ Open. 2020;10(9):e036689. doi:10.1136/bmjopen-2019-036689
13. Cherinet FM, Tekalign SY, Anbesse DH, Bizuneh ZY. Prevalence and associated factors of low vision and blindness among patients attending St. Paul’s Hospital Millennium Medical College, Addis Ababa, Ethiopia. BMC Ophthalmol. 2018;18(1):232. PMID: 30176841. doi:10.1186/s12886-018-0899-7
14. Walker TJ, Tullar JM, Diamond LM, Kohl AW, Amick BC. Validity and Reliability of the 8-item work limitations questionnaire. J Occup Rehabil. 2017;27:576–583. doi:10.1007/s10926-016-9687-5
15. Pezzullo L, Streatfeild J, Simkiss P, Shickle D. The economic impact of sight loss and blindness in the UK adult population. BMC Health Serv Res. 2018;18(1):63. doi:10.1186/s12913-018-2836-0
16. Naidoo KS, Fricke TR, Frick KD, et al. Potential lost productivity resulting from the global burden of myopia: systematic review, meta-analysis, and modeling. Ophthalmology. 2018;126(3):338–346. doi:10.1016/j.ophtha.2018.10.029
17. Lund EM, Cmar JL. A systematic review of factors related to employment outcomes for adults with visual impairments. J Vis Impair Blind. 2019;113(6):493–517. doi:10.1177/0145482X19885211
18. Marques AP, Macedo AF, Lima Ramos P, et al. Productivity losses and their predictive factors amongst people with impaired vision. Ophthalmic Epidemiol. 2019;26(6):378–392. PMID: 31280630. doi:10.1080/09286586.2019.1632904
19. Munemo E, Tom T. problems of Unemployment faced by visually impaired people. GJSS. 2013;3:4.
20. Grow SJ. Factors that affect the employment status of working age adults with visual impairments in New Zealand. J Vis Impair Blind. 2004;98(9):546–559. doi:10.1177/0145482X0409800906
21. Eckert KA, Carter MJ, Lansingh VC, et al. A simple method of estimating the economic cost of productivity loss due to blindness and moderate to severe visual impairment. Ophthalmic Epidemiol. 2015;22(5):349–355. doi:10.3109/09286586.2015.1066394
22. Mojon-Azzi SM, Sousa-Poza A, Mojon DS. Impact of low vision on Employment. Ophthalmologica. 2010;224(6):381–388. doi:10.1159/000316688
23. Lee IS, Park SK. Employment status and predictors among people with visual impairments in south korea: results of a national survey. J Vis Impair Blind. 2008;102(3):147–159. doi:10.1177/0145482X0810200303
24. Edward C, Bell NMM. Employment outcomes for blind and visually impaired adults. J Blind Innovation Res. 2015;5:2.
 © 2022 The Author(s). This work is published and licensed by Dove Medical Press Limited. The
full terms of this license are available at https://www.dovepress.com/terms
and incorporate the Creative Commons Attribution
- Non Commercial (unported, 3.0) License.
By accessing the work you hereby accept the Terms. Non-commercial uses of the work are permitted
without any further permission from Dove Medical Press Limited, provided the work is properly
attributed. For permission for commercial use of this work, please see paragraphs 4.2 and 5 of our Terms.
© 2022 The Author(s). This work is published and licensed by Dove Medical Press Limited. The
full terms of this license are available at https://www.dovepress.com/terms
and incorporate the Creative Commons Attribution
- Non Commercial (unported, 3.0) License.
By accessing the work you hereby accept the Terms. Non-commercial uses of the work are permitted
without any further permission from Dove Medical Press Limited, provided the work is properly
attributed. For permission for commercial use of this work, please see paragraphs 4.2 and 5 of our Terms.
Recommended articles
Visual Impairment and Its Associated Factors Among Hypertensive Patients in Amhara Region Referral Hospitals, Ethiopia
Ashenef B, Diress M, Yeshaw Y, Dagnew B, Gela YY, Akalu Y, Abdurahman A, Abebaw K
Clinical Ophthalmology 2023, 17:3149-3161
Published Date: 20 October 2023