Back to Journals » Cancer Management and Research » Volume 10
Probe-based three-dimensional confocal laser endomicroscopy of brain tumors: technical note
Authors Belykh E, Patel AA, Miller EJ, Bozkurt B ![]() , Yağmurlu K
, Yağmurlu K ![]() , Woolf EC, Scheck AC, Eschbacher JM, Nakaji P, Preul MC
, Woolf EC, Scheck AC, Eschbacher JM, Nakaji P, Preul MC
Received 20 February 2018
Accepted for publication 15 May 2018
Published 30 August 2018 Volume 2018:10 Pages 3109—3123
DOI https://doi.org/10.2147/CMAR.S165980
Checked for plagiarism Yes
Review by Single anonymous peer review
Peer reviewer comments 4
Editor who approved publication: Dr Leylah Drusbosky
Supplementary video presented by Belykh et al.
Views: 372
Evgenii Belykh,1 Arpan A Patel,1 Eric J Miller,1 Baran Bozkurt,1 Kaan Yağmurlu,1 Eric C Woolf,2 Adrienne C Scheck,2 Jennifer M Eschbacher,3 Peter Nakaji,1 Mark C Preul1
1Department of Neurosurgery, Barrow Neurological Institute, St. Joseph’s Hospital and Medical Center, Phoenix, AZ, USA; 2Neuro-Oncology Research, Barrow Neurological Institute, St. Joseph’s Hospital and Medical Center, Phoenix, AZ, USA; 3Department of Neuropathology, Barrow Neurological Institute, St. Joseph’s Hospital and Medical Center, Phoenix, AZ, USA
Background: Confocal laser endomicroscopy (CLE) is used during fluorescence-guided brain tumor surgery for intraoperative microscopy of tumor tissue with cellular resolution. CLE could augment and expedite intraoperative decision-making and potentially aid in diagnosis and removal of tumor tissue.
Objective: To describe an extension of CLE imaging modality that produces Z-stack images and three-dimensional (3D) pseudocolored volumetric images.
Materials and methods: Hand-held probe-based CLE was used to collect images from GL261-luc2 gliomas in C57BL/6 mice and from human brain tumor biopsies. The mice were injected with fluorescein sodium (FNa) before imaging. Patients received FNa intraoperatively, and biopsies were imaged immediately in the operating room. Some specimens were counterstained with acridine orange, acriflavine, or Hoechst and imaged on a benchtop confocal microscope. CLE images at various depths were acquired automatically, compiled, rendered into 3D volumes using Fiji software and reviewed by a neuropathologist and neurosurgeons.
Results: CLE imaging, Z-stack acquisition, and 3D image rendering were performed using 19 mouse gliomas and 31 human tumors, including meningiomas, gliomas, and pituitary adenomas. Volumetric images and Z-stacks provided additional information about fluorescence signal distribution, cytoarchitecture, and the course of abnormal vasculature.
Conclusion: 3D and Z-stack CLE imaging is a unique new option for live intraoperative endomicroscopy of brain tumors. The 3D images afford an increased spatial understanding of tumor cellular architecture and visualization of related structures compared with two-dimensional images. Future application of specific fluorescent probes could benefit from this rapid in vivo imaging technology for interrogation of brain tumor tissue.
Keywords: 3D microscopy, confocal laser endomicroscopy, fluorescein sodium, fluorescence-guided brain tumor resection, glioma, brain tumor, volumetric imaging
Introduction
Confocal laser endomicroscopy (CLE) is currently under investigation for its effectiveness in intraoperative diagnosis of human brain tumor tissue. Real-time assessment of tissue characteristics in vivo during brain surgery has been made possible technologically by the development of miniaturized probe-based microscopes.1,2 For intrinsic brain tumors, fluorescence imaging could augment and expedite intraoperative decision-making and potentially aid in the identification of tumor tissue. Such discrimination is particularly important in assessing the borders of infiltrative tumors when the goal of surgery is optimization of resection. Complementing the fluorescence-guided procedure with CLE may lead to improved intraoperative diagnosis of tumor margins and provide a more efficient approach for achieving maximum tumor resection. Current evidence for gliomas suggests that maximum safe resection of the tumor, in addition to other treatment modalities, can prolong survival time.3
From its initial use in 1948, fluorescein sodium (FNa) has become one of the few US Food and Drug Administration–approved fluorescent dyes that can be used in the human brain in vivo to enhance visibility, margin selection, and overall effectiveness of tumor resection.4 Since its introduction, fluorescence-guided tumor resection has been the subject of considerable scrutiny and investigation.5–10 Intravenously injected FNa accumulates in regions with a disrupted blood–brain barrier secondary to various causes, including the presence of tumor or intraoperative iatrogenic injury. These regions of fluorescence can be visualized intraoperatively using the operative microscope or CLE. Similar in size to a pen, the probe can be used to survey and image tumor tissue at the cellular level to visualize its characteristic morphology and tissue architecture. Investigation continues into the use of CLE, particularly in intraoperative diagnosis of gliomas and meningiomas. Although not yet in common clinical use, the effectiveness and reliability of CLE in the patients with brain tumors has been consistently validated, warranting further investigation and refinement of its usage.2,11
Previous reports with CLE technology were based on black-and-white images acquired sequentially while moving the probe across the surgical area and adjusting the optimal imaging depth position. In this report, we describe a new imaging modality, in vivo probe-based CLE Z-stack imaging with three-dimensional (3D) volumetric reconstruction, in an effort to afford improved and unique visualization of brain tumor tissue architecture. Benchtop confocal microscopy systems have included 3D scans used to assess biopsy specimens in the fields of gastroenterology,12,13 orthopedics,14,15 and oral cancer. Here, we describe a novel imaging application using a probe-based portable clinical-grade CLE system to render 3D scanning volumes obtained during in vivo interrogation of animal and human brain tumors and surrounding tissue. These 3D scans, or Z-stacks of images, reveal extraordinary 3D views of tissue architecture in vivo that provide additional important unique perspective during interpretation of CLE images.
Materials and methods
Ethics statement
All experiments with human tissue were performed after protocol approval by the Institutional Review Board of the Barrow Neurological Institute in strict accordance with The Code of Ethics of the World Medical Association (Declaration of Helsinki) for experiments involving humans. Voluntary informed consent was obtained from all patients enrolled in the study. All experiments with animal tissues were conducted with approval by the Institutional Animal Care and Use Committee at Barrow Neurological Institute and conducted in accordance with the National Institutes of Health Guide for the Care and Use of Laboratory Animals.16
Source of images
We used CLE images from brain tumor surgeries in experimental animals and in humans. Detailed methods on producing experimental brain tumors have been described (Digital content S1).1 Briefly, B6(Cg)-Tyrc-2J/J (albino C57BL/6) type mice (The Jackson Laboratory, Bar Harbor, ME, USA) were implanted with GL261-Luc2 mouse glioma cells intracerebrally under general anesthesia. Tumor growth was assessed with IVIS spectrum imaging (Perkin–Elmer, Waltham, MA, USA) and animals were operated on 3–4 weeks after implantation.17 During the surgery, before CLE imaging of the tumor, mice (n = 29) received FNa via a tail vein injection as previously described.1 Additionally, fresh animal specimens were stained with Hoechst or 4′,6-diamidino-2-phenylindole (DAPI) and imaged ex vivo with a benchtop laser scanning microscope (LSM 710, Carl Zeiss AG, Oberkochen, Germany) using a 488 nm laser for excitation of FNa and a 405 nm laser for DAPI or Hoechst.
We also assessed patient biopsy samples acquired during resections of brain tumors. Patients (n = 31) underwent surgery for brain tumor resection with or without 10% FNa intravenously injected intraoperatively and fluorescence guidance using the Yellow 560 mode of the OPMI Pentero 900 microscope (Carl Zeiss AG). Biopsy specimens from patients who received FNa (n = 22) intraoperatively originated from the fluorescent tumor areas and were then imaged in the operative room with a stand-alone CLE system within 1–10 minutes after specimen acquisition. Specimens from the patients who did not receive FNa (n = 9) were received in the pathology department and stained topically with 0.1% acridine (AO) or 0.1% acriflavine (AF) (Table 1). After CLE imaging, specimens were placed into cassettes and submitted to pathology for processing and H&E staining.
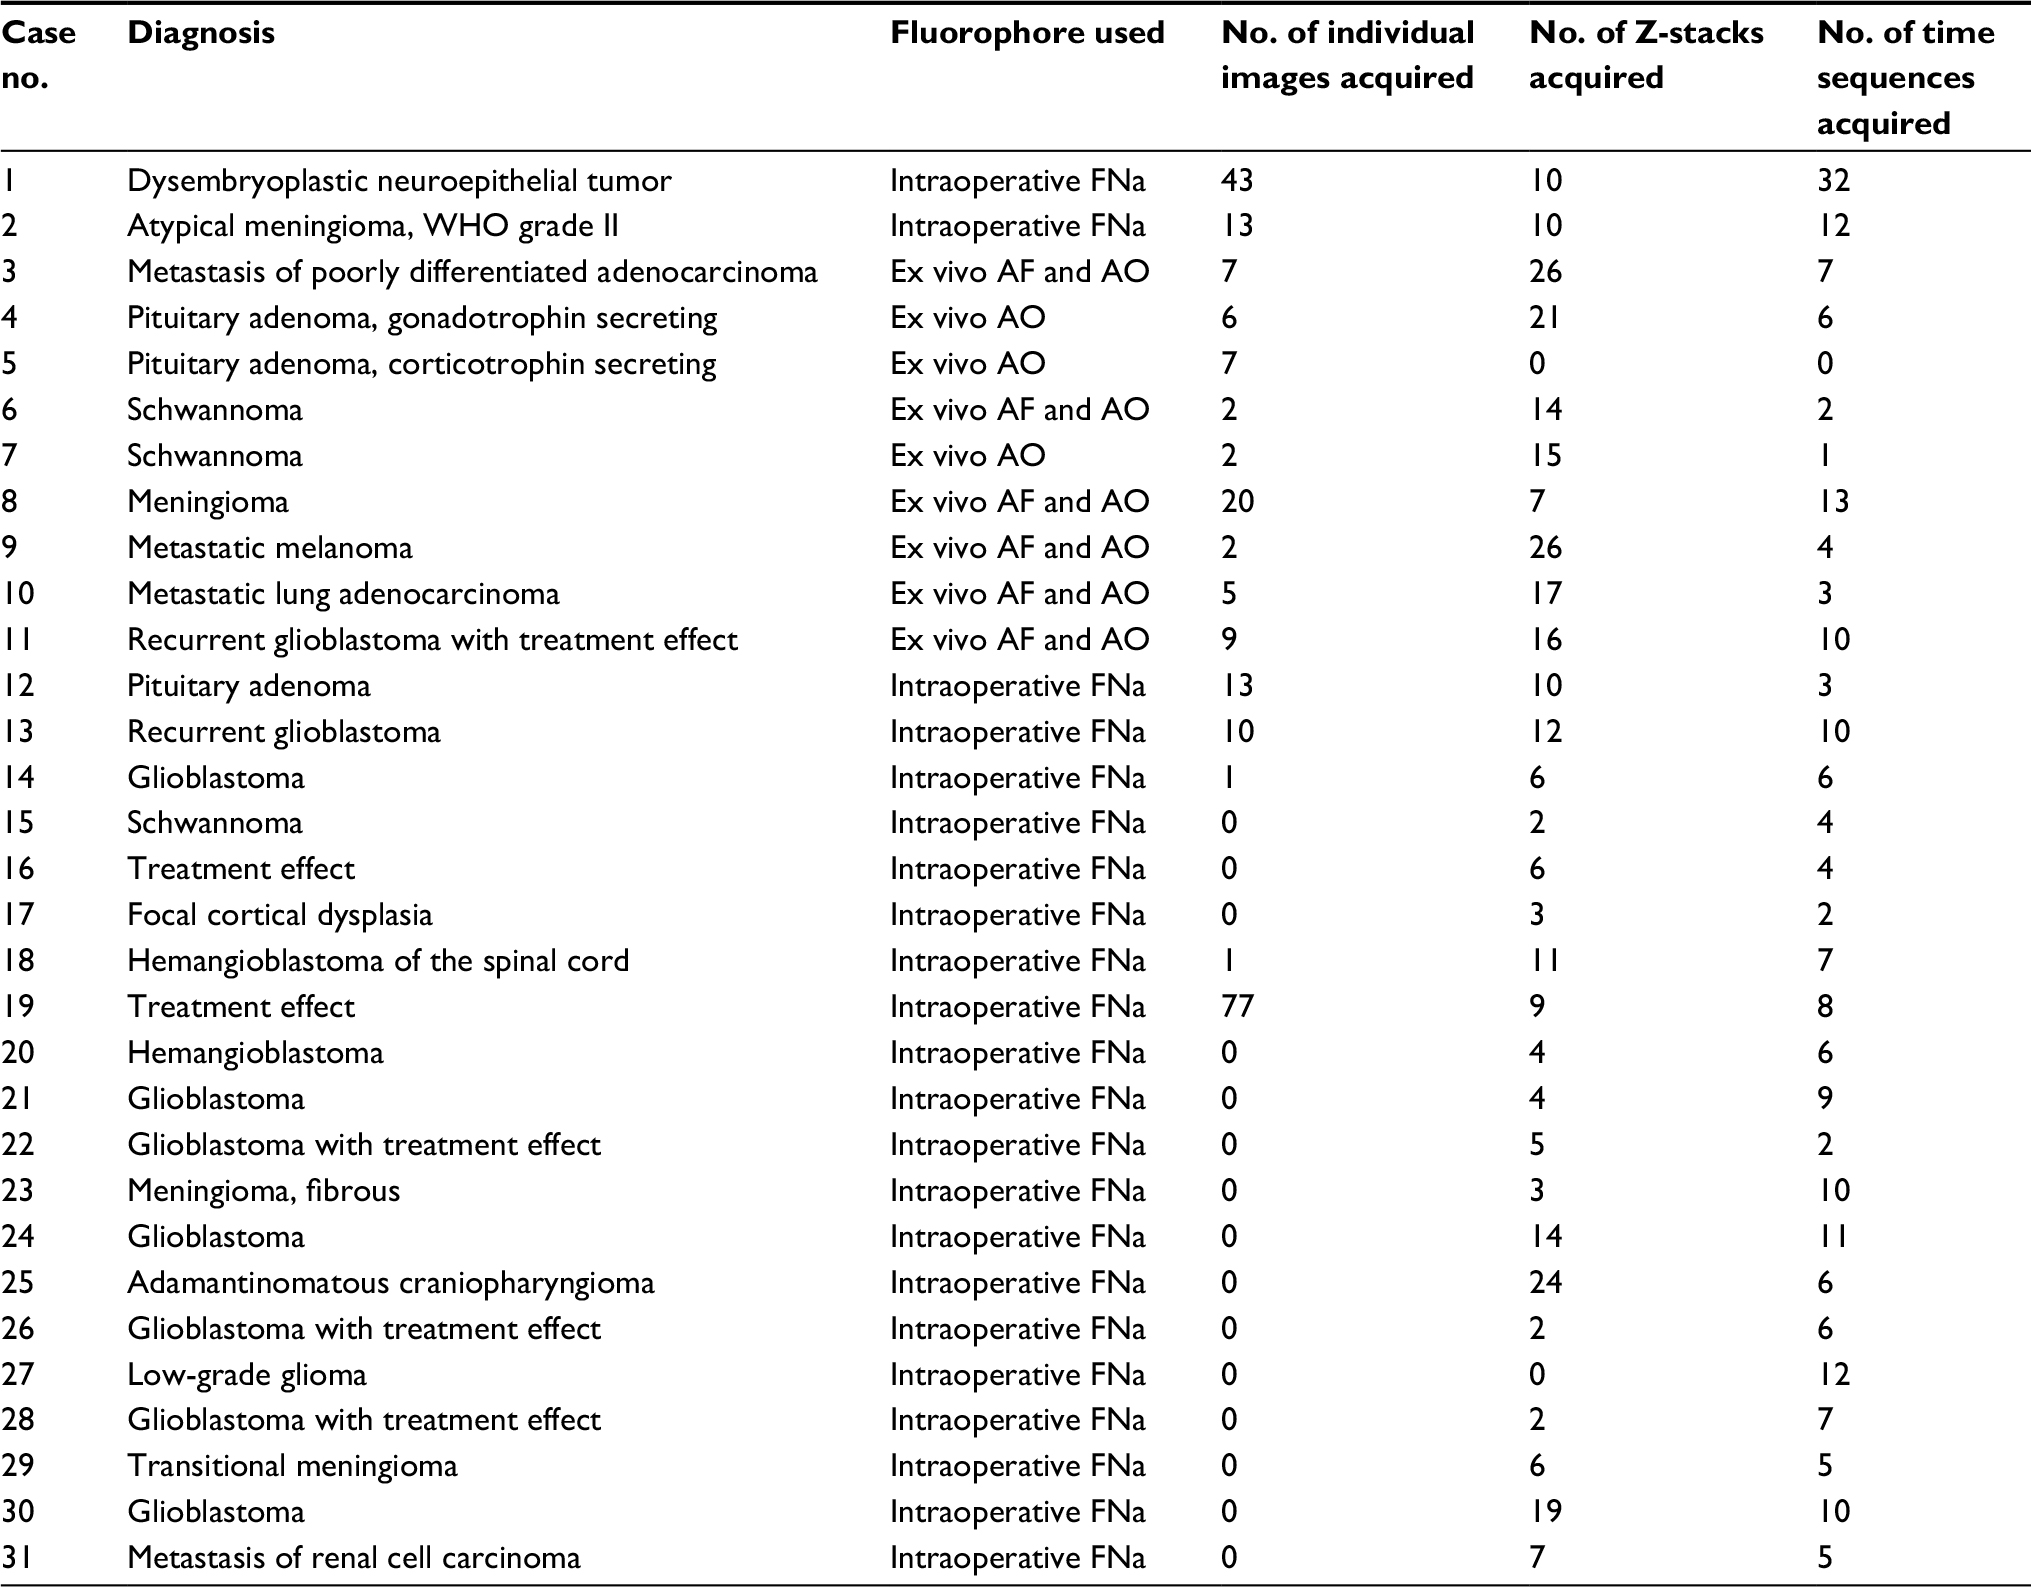 | Table 1 Human tumor specimens imaged with a CLE Abbreviations: AF, acriflavine; AO, acridine orange; CLE, confocal laser endomicroscopy; FNa, fluorescein sodium. |
The CLE (CONVIVO, Carl Zeiss AG) uses a 488 nm laser with either a green bandpass or a longpass filter to acquire confocal images similar to a previously reviewed Optiscan 5.1 CLE system (Optiscan Imaging Ltd., Mulgrave, Australia; Carl Zeiss AG).1,18 Novel features of the CLE probe were an increased lateral resolution of about 0.5 µm and Z-axis resolution of about 4.5 µm and an automatic Z-stack acquisition function.
Z-stack function and 3D rendering
The Z-stack function of the CLE probe automatically produces a predetermined series of images at various depths. The Z step, an interval of depth between individual pictures, was set at 3 µm. The scanning depth range was determined empirically during the pilot tests and was set at −15 µm superficial and +20 µm deep from the current imaging position. Images obtained in a Z-stack were compiled and rendered into 3D images using the Volume Viewer Plugin of Fiji software.19
Results
Animal and human tissues
In the animal experiments, we acquired, on average, 6.4 ± 6.9 (range = 0–24) CLE confocal Z-stacks. In human tissues, we acquired 9.5 ± 7.7 Z-stacks per patient (range = 0–26) (Table 1).
In vivo CLE imaging in Z direction
The Z-stack images acquired from the CLE represent a series of sequential images each taken 3 µm apart on the Z-axis (Figure 1). These images can be compiled into a continuous series similar to a complete set of images associated with computed tomography (CT) or magnetic resonance imaging (MRI). Z-stack images afford the same advantages as CT or MRI, and any other 3D imaging modality, with regard to understanding the 3D tissue structure and the shape of morphological features as well as their relationship to surrounding cytoarchitecture. Subjectively, the through-depth scanning mode provides a level of detail and perspective missing from a single histology slide or a single CLE image. The images in a Z-stack can also be examined as individual images and scrolled through, much like analyzing a series from a CT or MRI scan. The dimension and resolution of the images acquired depend on both the properties of the CLE probe and the tissue being examined.
 | Figure 1 Principle of CLE. (A) Simplified scheme of probe-based CLE and principle of 2D image formation due to sweeping scanning movement of the laser beam. (B) Image representing the Z-stack formation principle. Individual images of a tumor taken with CLE are combined into a Z-stack. The 3 µm between the images corresponds to a Z step; 30 µm is the total scanned depth. Note: Used with permission from Barrow Neurological Institute. Abbreviations: 2D, two-dimensional; CLE, confocal laser endomicroscopy. |
To determine optimal CLE scanning depth with FNa, we randomly selected and analyzed Z-stacks from animals (n = 14) and patients (n = 15). With the mice, informative images were observed within a depth ranging between 13 and 36 µm and at a mean depth of 27.8 ± 8.2 µm. For the patients, informative images appeared at a depth of 9–28 µm, with a mean depth of 18.2 ± 8.7 µm. The maximum range of informative Z-stack imaging with FNa was 36 µm in animal tissue and 28 µm in human tissue, resulting in 13 and 10 informative slices per Z-stack, respectively (Table 2).
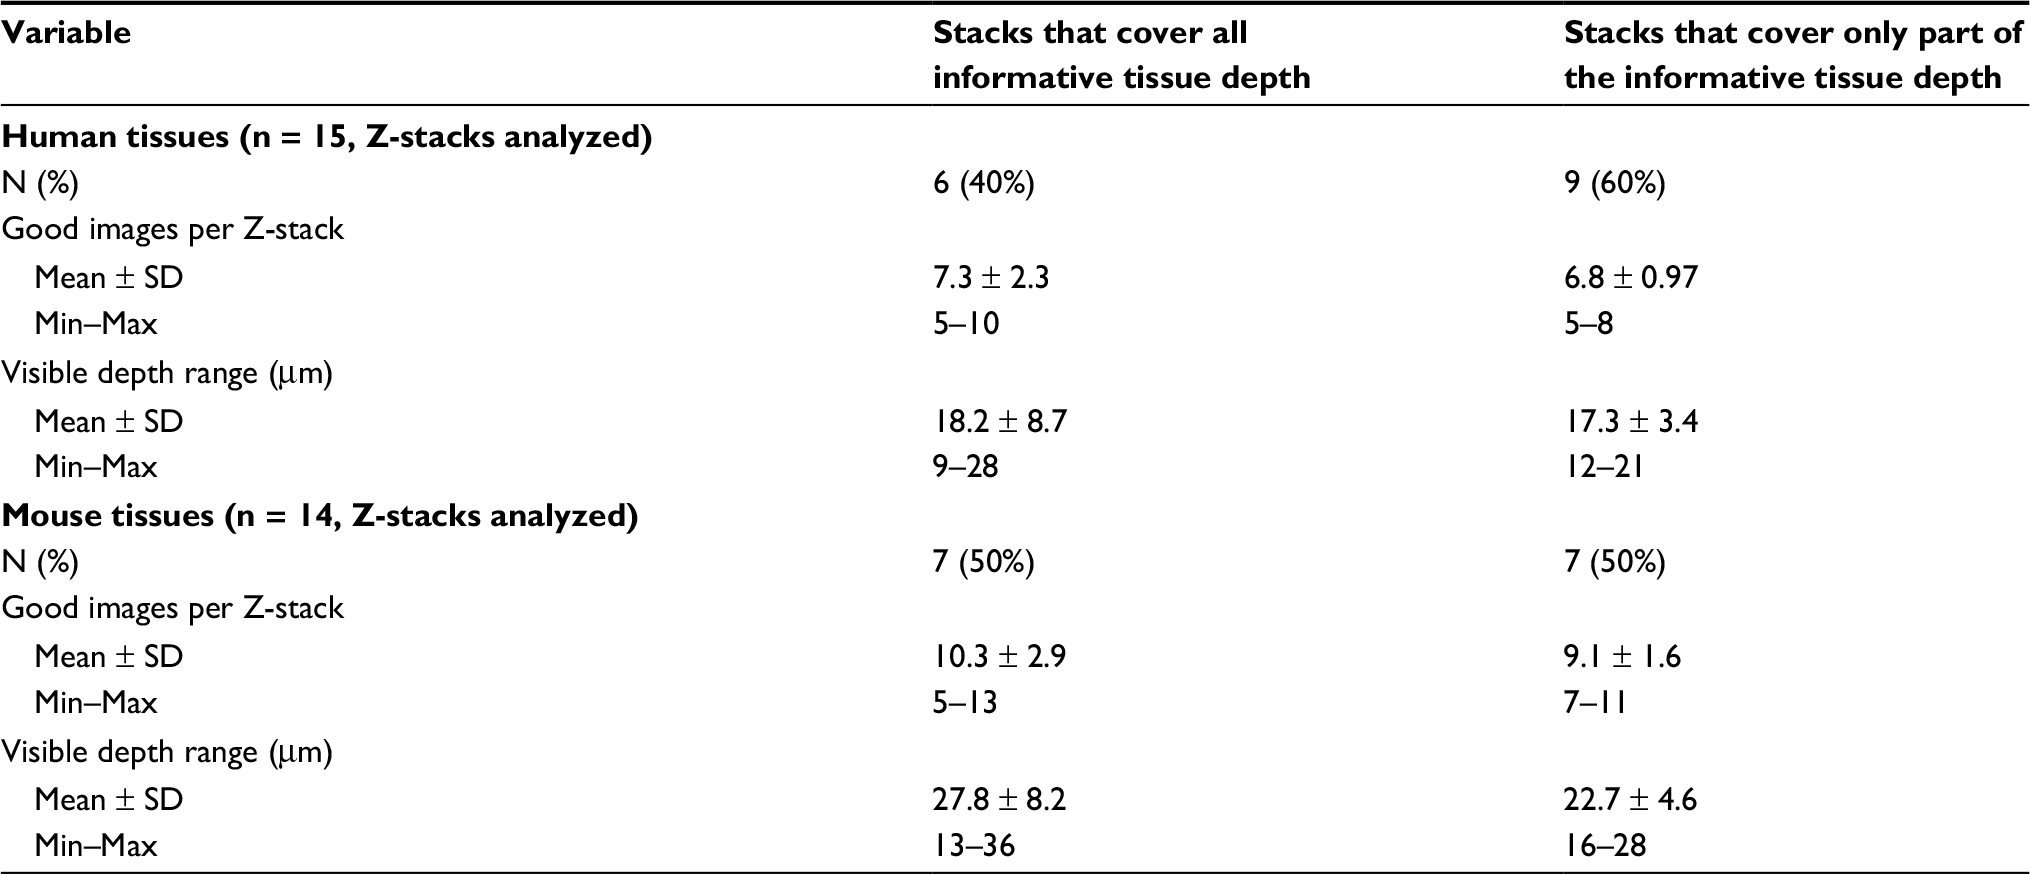 | Table 2 Statistics on the CLE Z-stacks acquired from human and mouse brain tissues Abbreviations: CLE, confocal laser endomicroscopy; SD, standard deviation. |
Animal and human brain tumor imaging in 3D
Findings in mouse tumors that were imaged with CLE after FNa injection confirmed that the cell contours seen in 3D CLE (Figure 2) correspond with the cell contours seen with similar volume imaging using LSM. Red blood cells were visible as nonnucleated cells as shown with Hoechst counterstaining (Figure 3). The 3D CLE view also allowed visualization of more complete tumor cell size, shape, and location relationships (Figure 4; Digital content S2). Finally, with both benchtop LSM (Figure 5) and in vivo CLE (Figure 6), more complete abnormal vascular patterns and structural relationships to the tumor could be identified.
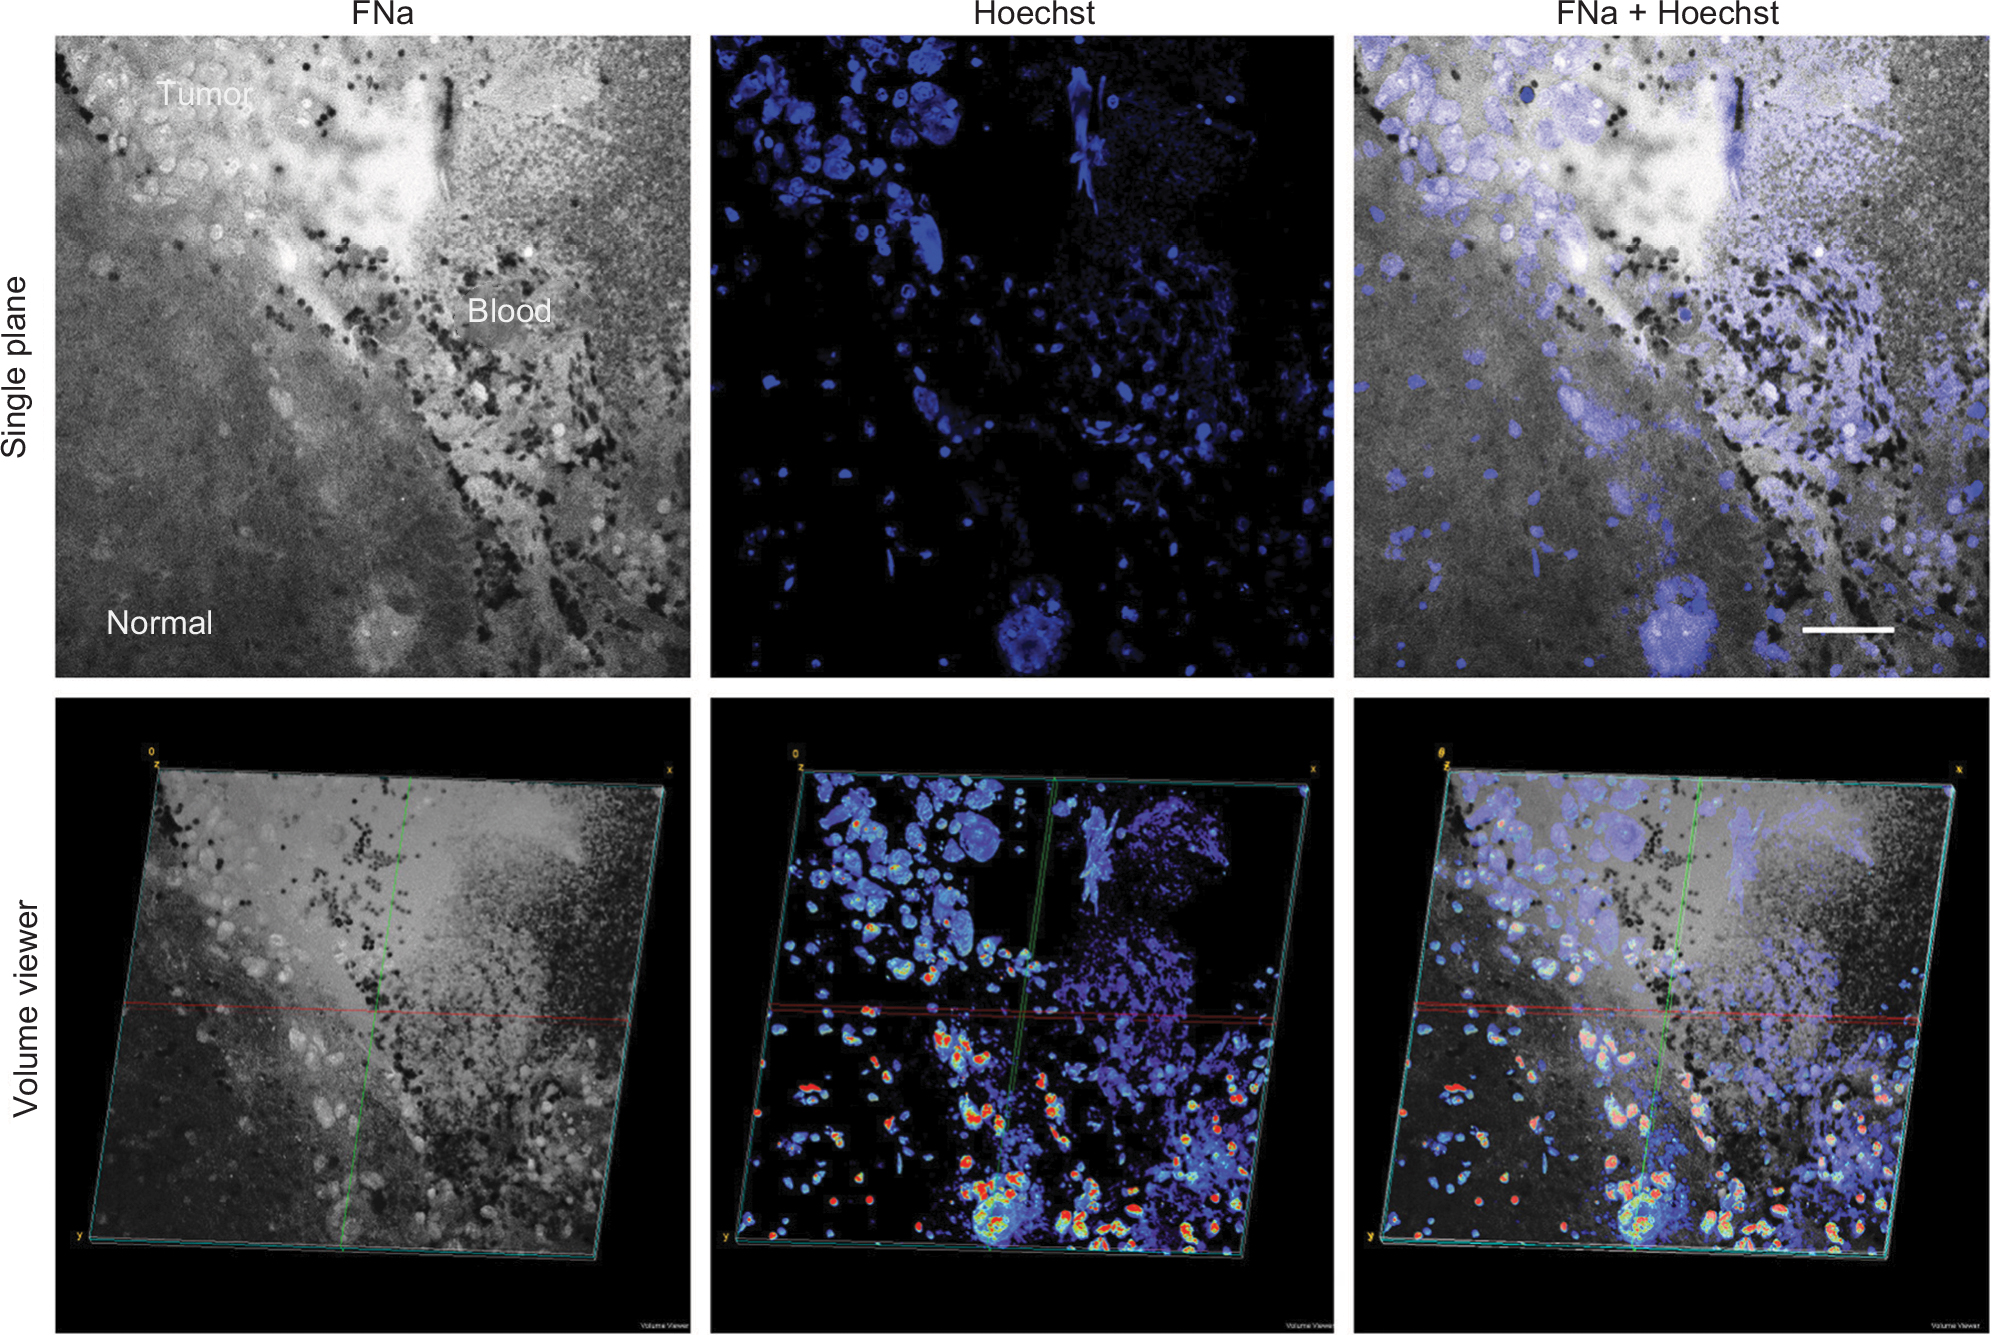 | Figure 2 2D (top) and 3D (bottom) LSM images of the same field of view showing the glioma border in mouse brain tissue. FNa was given intraoperatively, and the specimen was counterstained with Hoechst immediately ex vivo. Confocal images show higher signals of fluorescence within the tumor area with visible contours of individual tumor cells. Some of the tumor cells absorbed FNa, whereas others did not and appear darker than surrounding background. RBCs appear as hypointense areas of darkening. Hoechst stain provides visualization of nuclei and does not appear fluorescent within areas that represent the locations of RBCs. Overlapping the two images helps to confirm and reduce uncertainty between the individual characterizations of tumor versus RBCs. The lower row of images represents the 3D-reconstruction volume viewer images that were compiled using images obtained from a Z-stack. The images are angulated to help visualize the 3D nature of the image. Scale bar is 50 µm. Note: Used with permission from Barrow Neurological Institute. Abbreviations: 2D, two-dimensional; 3D, three-dimensional; FNa, fluorescein sodium; LSM, laser scanning microscope; RBC, red blood cell.
|
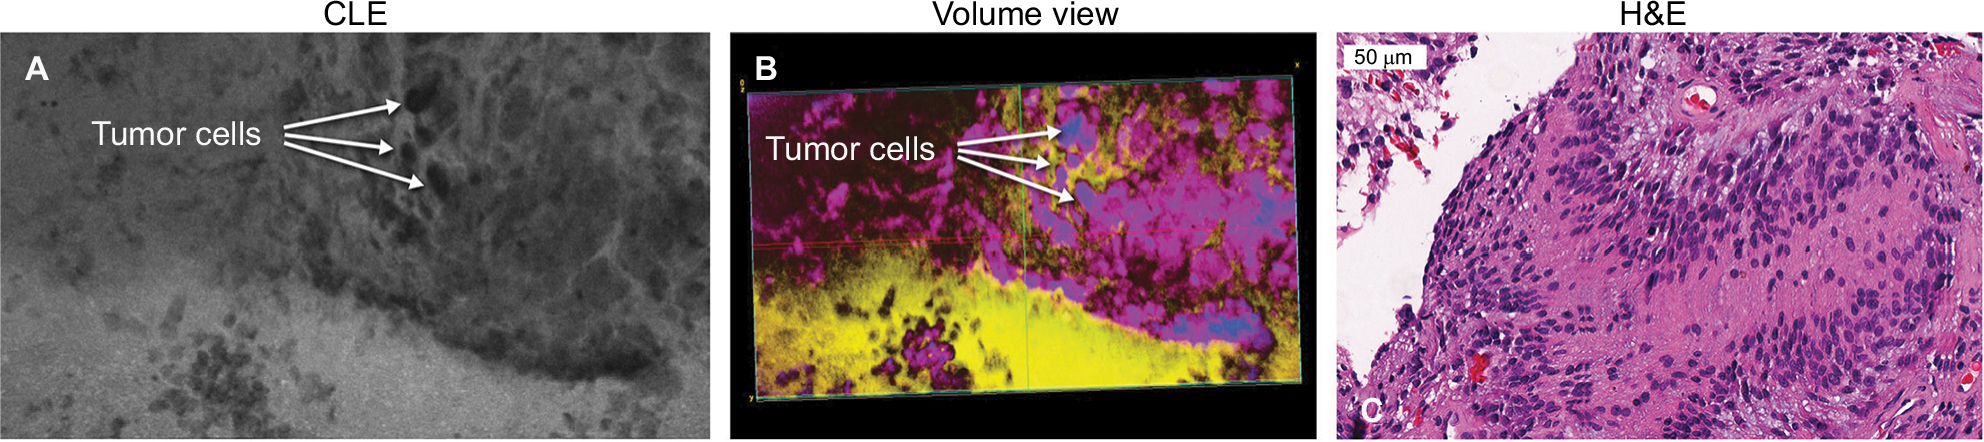
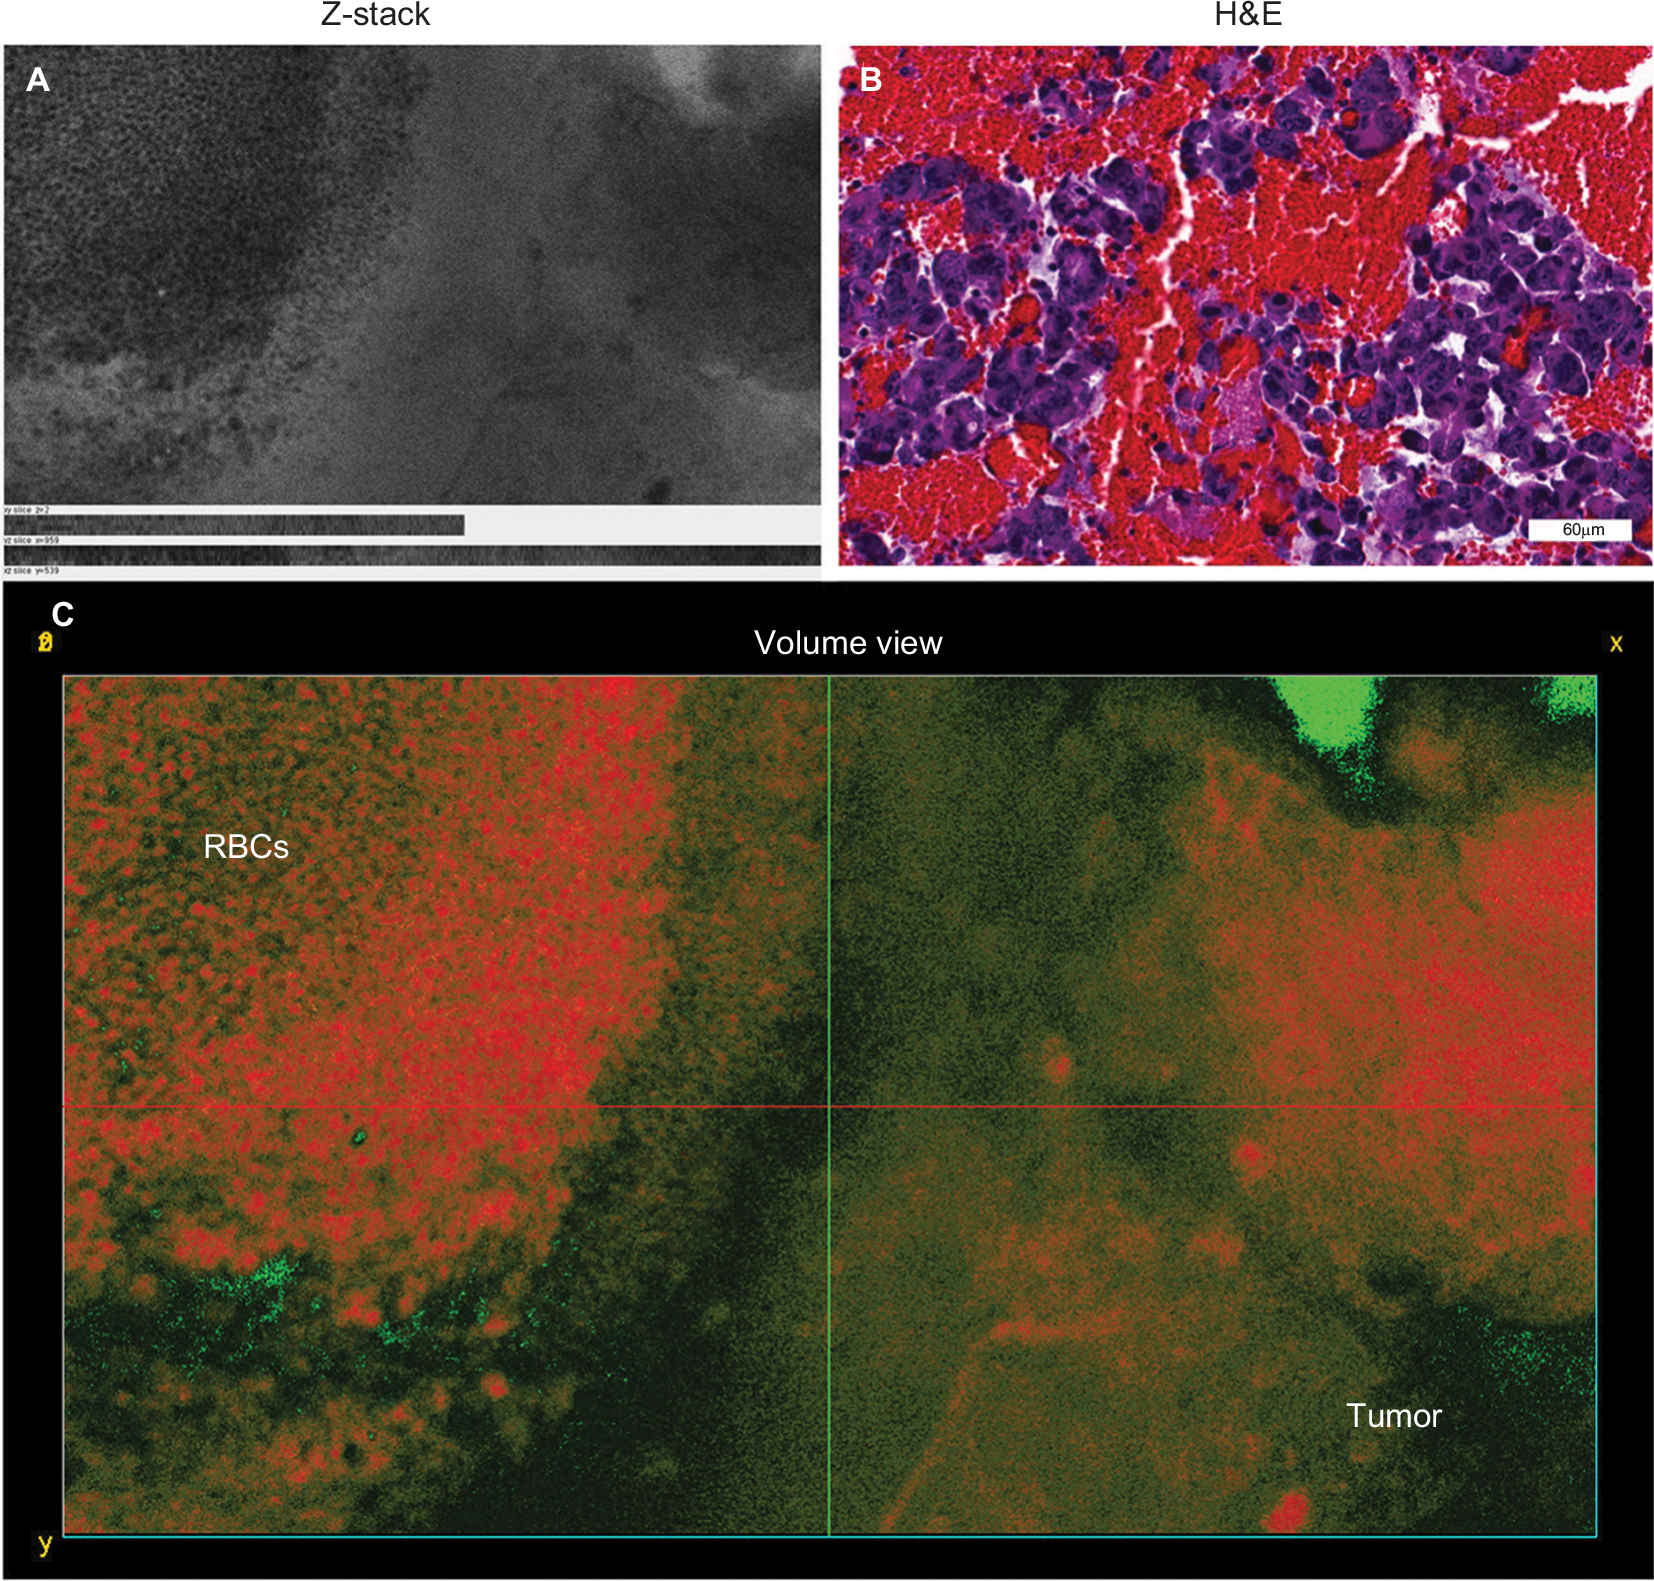 | Figure 3 Representative images showing a collection of RBCs rather than tumor cells. (A) Projections of Z-stack CLE images taken from a mouse glioma. (B) Correlative H&E section displaying abundant RBCs within the tumor core. (C) A 3D volumetric view shows extravasated RBCs found near the tumor core. RBCs are on the left, and neoplastic tumor cells are on the right. The Z-stacks and volumetric view allow for better visualization and differentiation of cells, including RBCs, compared with the single-frame CLE image. Note: Used with permission from Barrow Neurological Institute. Abbreviations: 3D, three-dimensional; CLE, confocal laser endomicroscopy; H&E, hematoxylin and eosin; RBC, red blood cell.
|
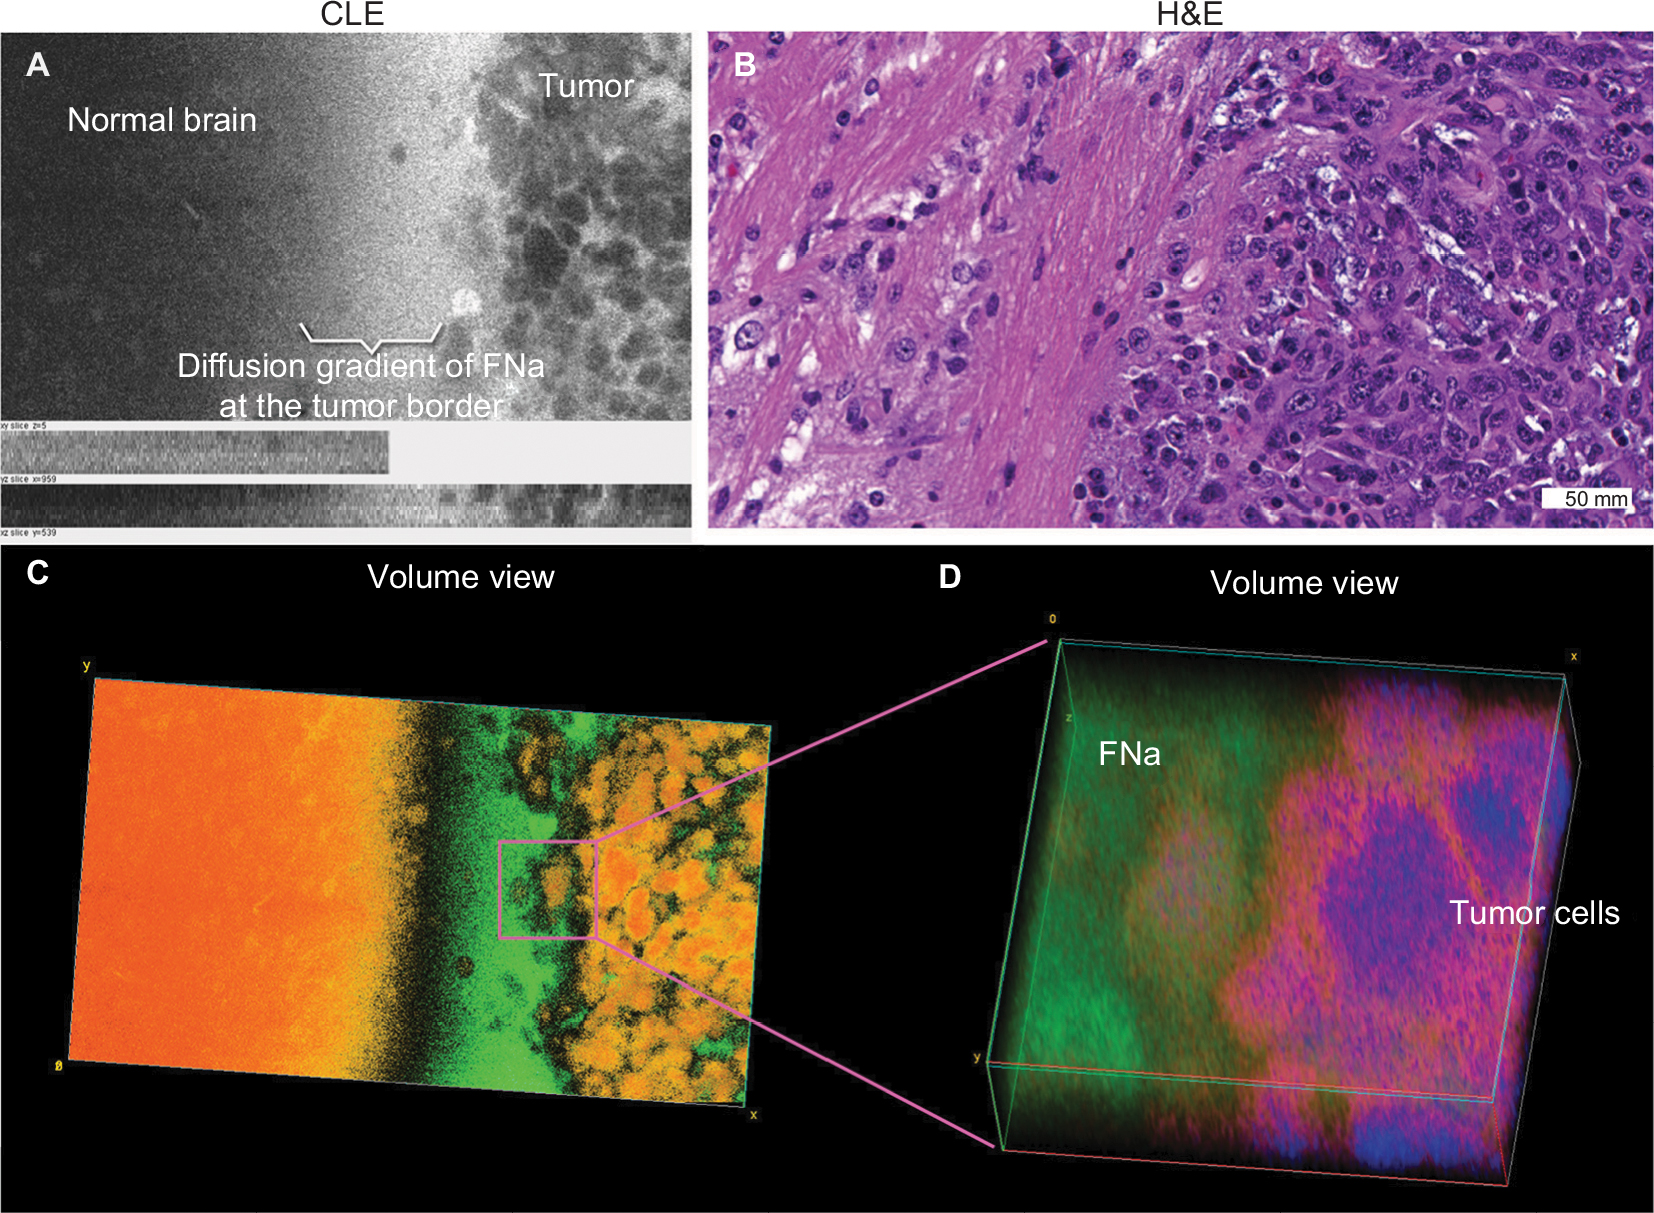 | Figure 4 Representative images of a mouse glioma specimen. (A) CLE Z-stack projection showing tumor border. (B) Correlative H&E-stained section. (C) Volumetric view of the same field of view as in (A) affords a more detailed reconstruction and visualization of the cellular pattern—a feature that is not possible in the H&E-stained slice. Image was colorized using a single-channel custom spectrum LUT (Fiji). Cells are shown in shades of orange on the left, as well as normal brain tissue on the right. Fluorescein signal gradient is pseudocolored in green. (D) Enlarged view of the tumor border taken from the volumetric view shown in (C). Nuclear staining is pseudocolored in blue, cytoplasm in magenta, and fluorescein leaking around the tumor in green. Note: Used with permission from Barrow Neurological Institute. Abbreviations: 3D, three-dimensional; CLE, confocal laser endomicroscopy; H&E, hematoxylin and eosin; LUT, look-up table; RBC, red blood cell.
|
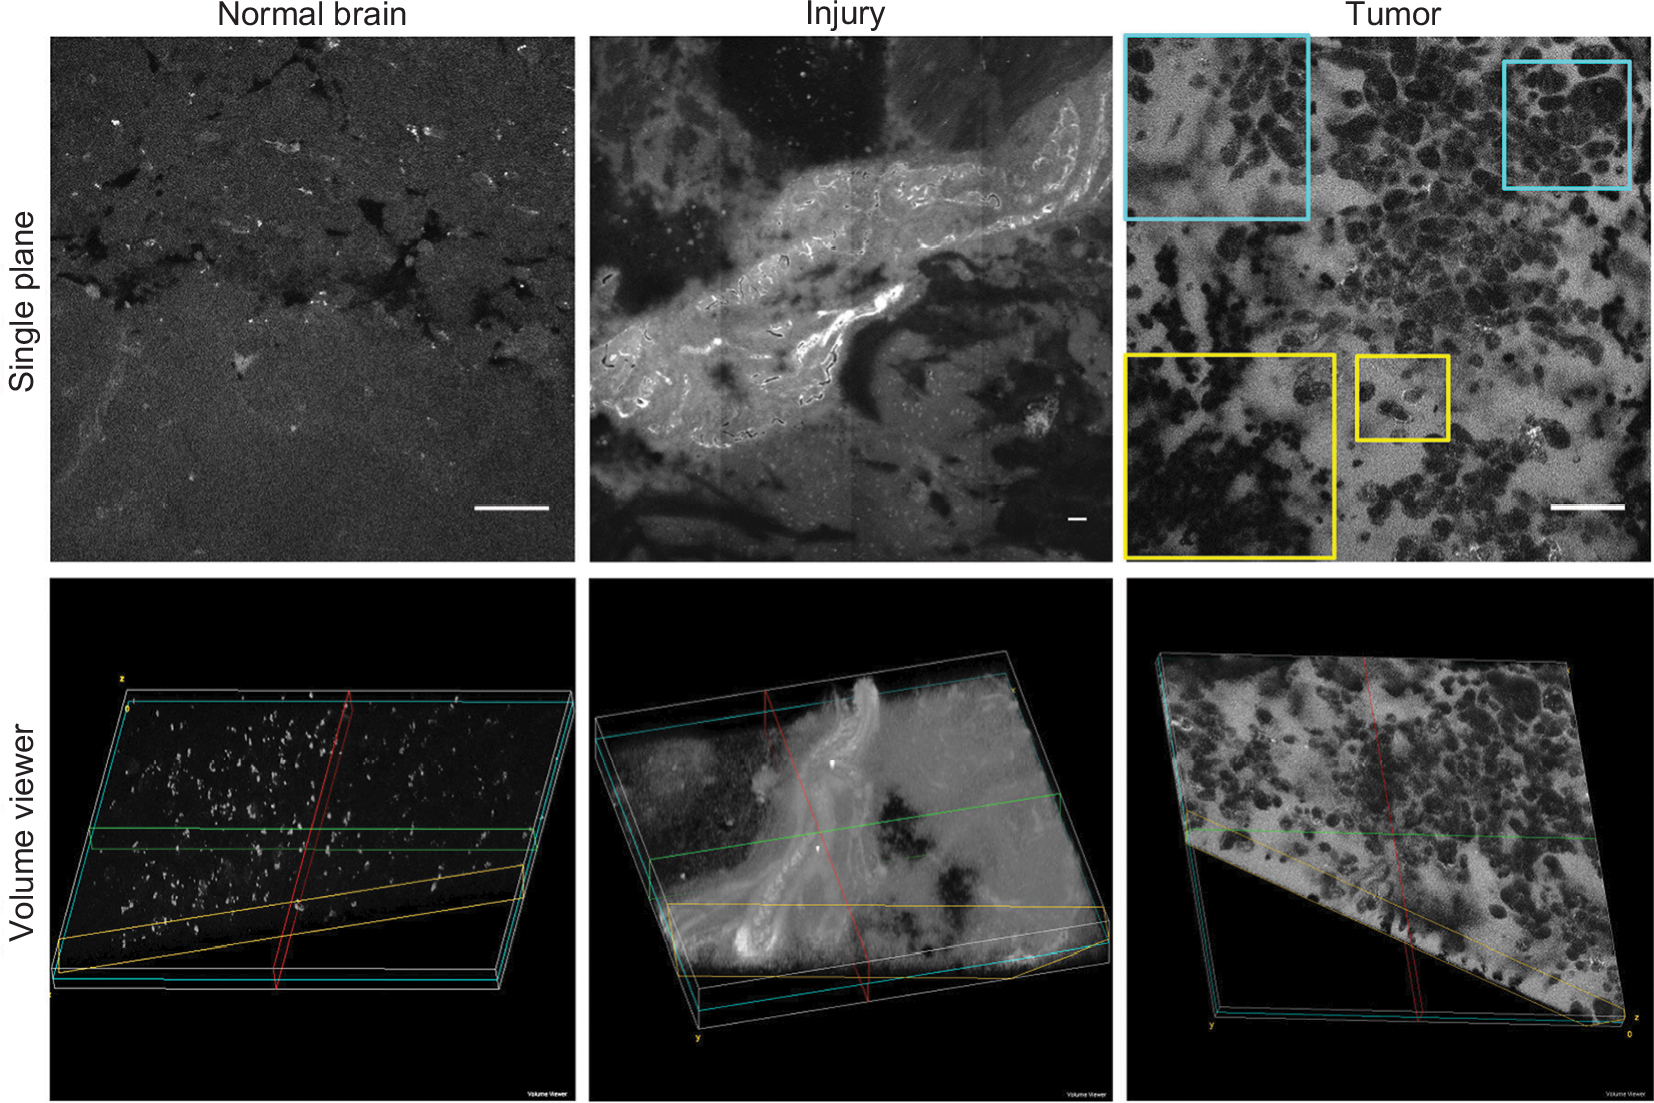 | Figure 5 Representative single-plane (top row) and volumetric (bottom row) LSM images of normal brain (left), injured brain (center), and mouse glioma tissue (right) after FNa injection. The normal brain tissue contains evenly distributed autofluorescent inclusions and no FNa leakage within the tissue. FNa leakage from vessels and staining of the adjacent brain tissue is seen in the middle column, consistent with injury to brain tissue. The single plane image of the tumor area shows a classic pattern of FNa leakage around the tumor cells. Some tumor cells have taken up fluorescent dye and appear bright (yellow inset). Abnormal cell shape and size can be appreciated through CLE (blue inset). The 3D view of these patterns enhances the viewer’s visualization of the field of view and allows appreciation of additional details regarding tissue architecture, vascular structures, and gross tumor cell shape. Scale bars are 50 µm. Note: Used with permission Barrow Neurological Institute. Abbreviations: 3D, three-dimensional; CLE, confocal laser endomicroscopy; FNa, fluorescein sodium; LSM, laser scanning microscope.
|
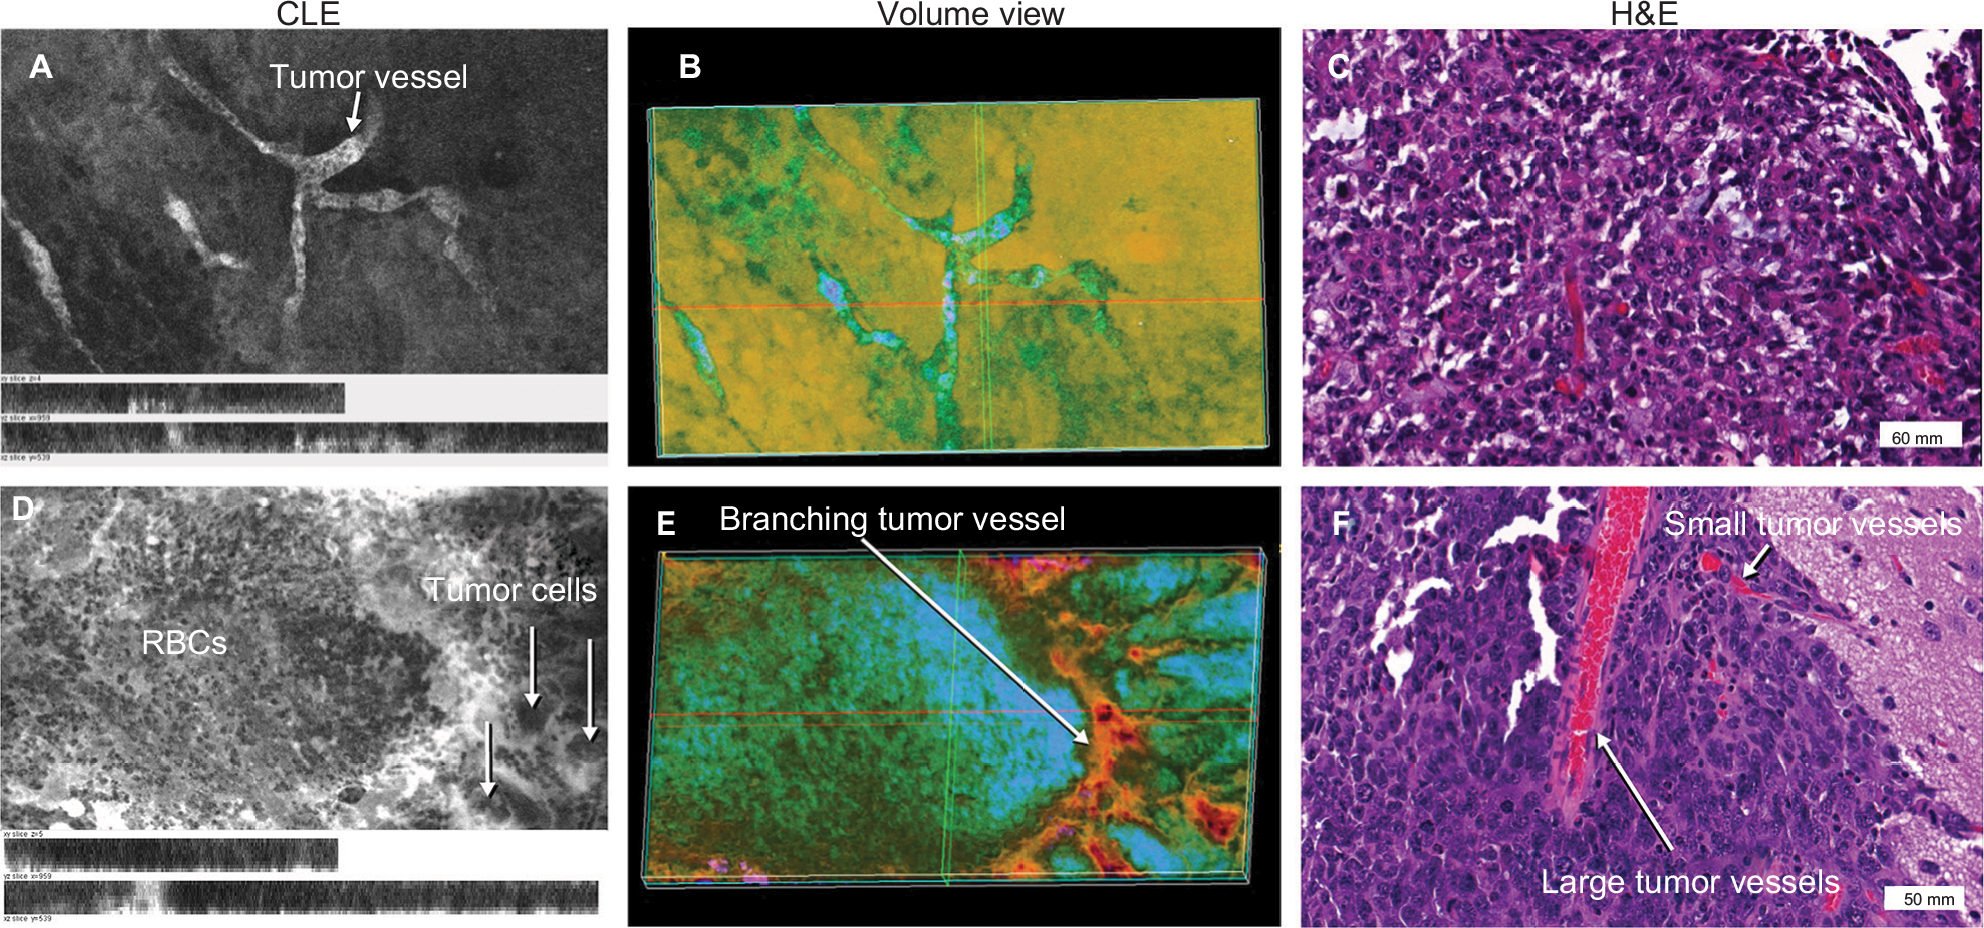 | Figure 6 Representative images of a mouse glioma showing abnormal microvasculature, specifically abnormal capillaries (upper row) and abnormal large vascular channels within the tumor (lower row). (A) and (D) represent 2D projections of CLE Z-stacks shown in volumetric views (B) and (E), respectively. Correlative histologic slides stained with H&E from the same tumor sites are shown in (C) and (F). The vascular pattern cannot be fully appreciated on 2D CLE and H&E images; however, the volumetric views allow the viewer to see the abnormal vasculature patterns. Image (B) shows areas of bright fluorescence in green, whereas areas of darkness are in orange. On the right side of the image, the dye infiltration into loosely arranged tumor cells can be appreciated. The volumetric view is presented as a single channel using customized spectrum LUT (Fiji). Note: Used with permission from Barrow Neurological Institute. Abbreviations: 2D, two-dimensional; CLE, confocal laser endomicroscopy; H&E, hematoxylin and eosin; LUT, look-up table.
|
In meningiomas, 3D CLE imaging with intraoperative FNa showed cellular tumor with whorls architecturally consistent with meningioma. Additionally, psammoma bodies could be visualized as spherical structures that did not take up FNa dye (Figure 7; Digital content S3). Beyond in vivo imaging, ex vivo CLE imaging after staining with AO and AF dyes showed a clear 3D image of the distribution and arrangement of cellular nuclei (Figure 8; Digital content S4 and S5).
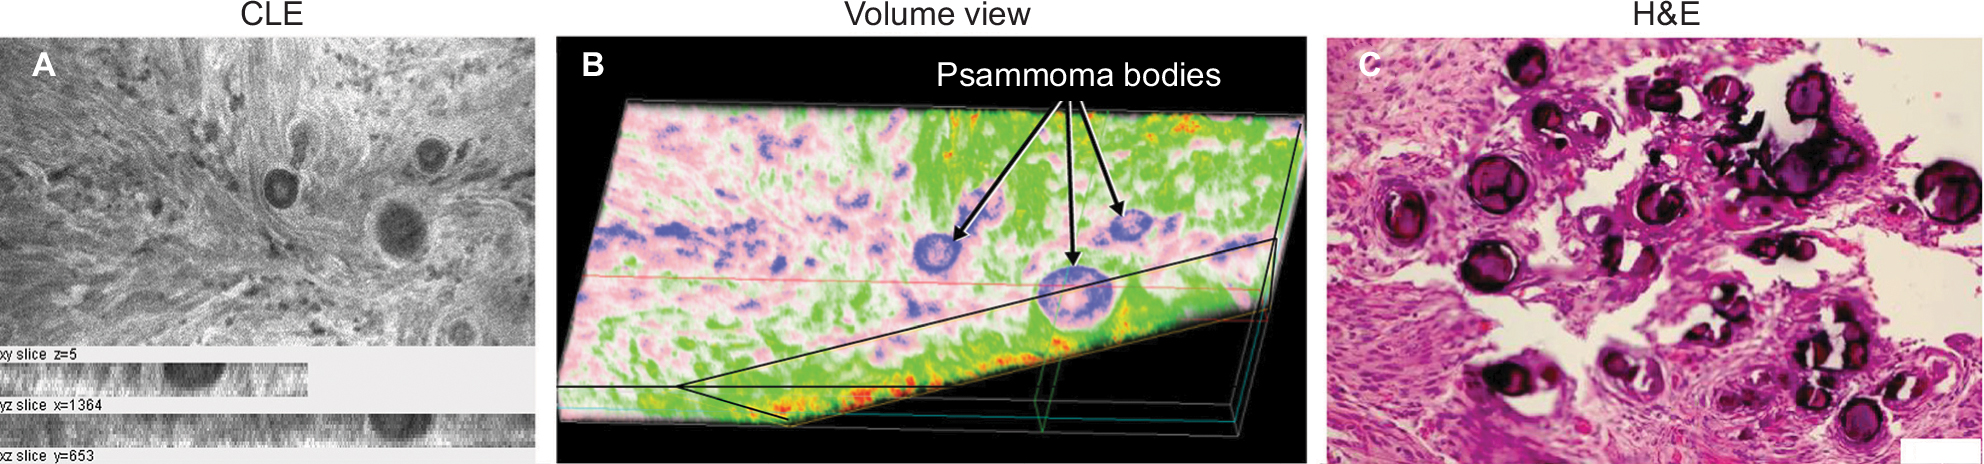 | Figure 7 Representative CLE images and H&E-stained tissue from a patient with meningioma, who was injected with FNa intraoperatively. (A) Projection of a Z-stack showing a typical picture of a meningioma. (B) Volumetric images from the same field of view as in (A) display depth tissue characteristics and a cut through a psammoma body pseudocolored in blue. Both 2D and volumetric CLE images show projections of multiple round and spherical structures that resemble the characteristic psammoma bodies found in meningiomas. (C) Correlative H&E image from the same specimen. Note: Used with permission from Barrow Neurological Institute. Abbreviations: 2D, two-dimensional; CLE, confocal laser endomicroscopy; FNa, fluorescein sodium; H&E, hematoxylin and eosin.
|
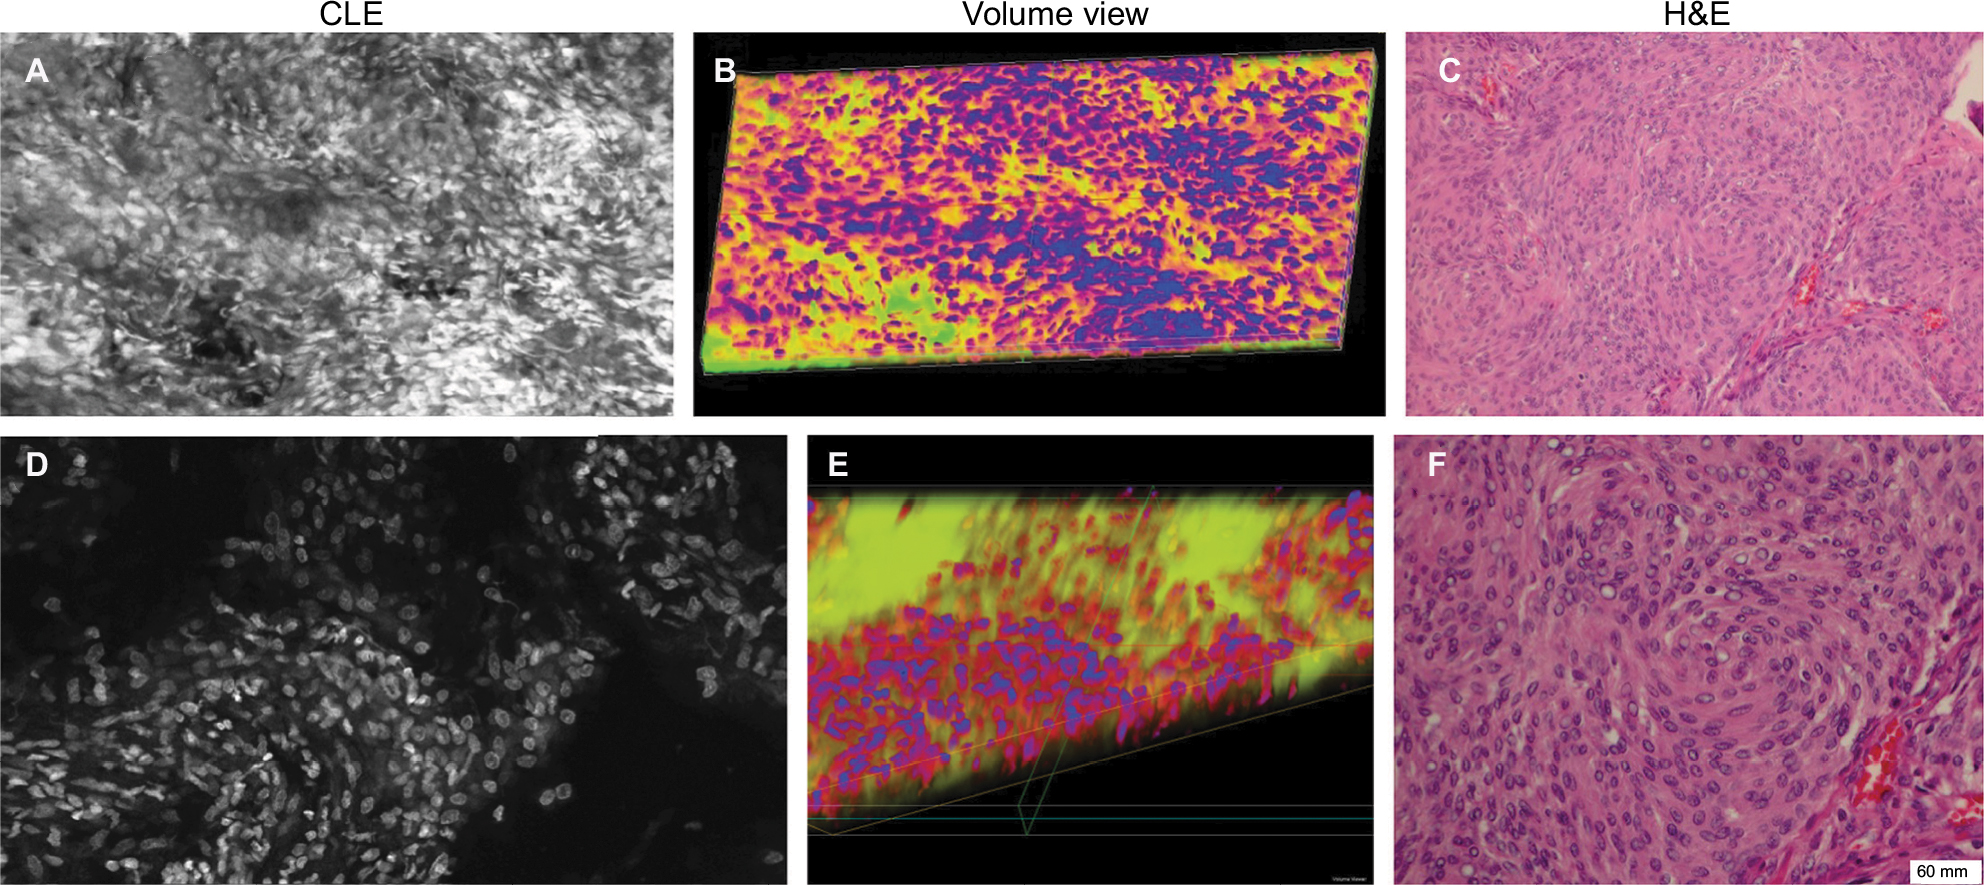 | Figure 8 Human meningioma sample stained with different fluorescent dyes ex vivo. Each row consists of a CLE Z-stack image (A and D), the corresponding 3D volumetric view (B and E), and an H&E-stained histological section for comparison (C and F). Both series of images represent a section of a human meningioma that was stained with AO (upper row) or AF (lower row). Both dyes provide good visualization of cellular structure compared with their histologic counterparts. Note: Used with permission Barrow Neurological Institute. Abbreviations: 3D, three-dimensional; AF, acriflavine; AO, acridine orange; CLE, confocal laser endomicroscopy; H&E, hematoxylin and eosin.
|
We also assessed human tissue imaged with CLE after intraoperative FNa administration. As expected, perfusion was increased with FNa in abnormal tissue compared with normal tissue. Structures of different sizes were seen as dark shadows against the bright background. Additional shapes that could be seen on 3D CLE in high-grade gliomas included apoptotic bodies, necrotic debris, and large atypical cells. High-grade gliomas produced a typical FNa staining pattern, and 3D volumetric imaging provided clues on the location of individual cells and allowed for visualization of individual atypical-appearing cells, with these findings being more evident than for cells seen on 2D CLE imaging (Figure 9; Digital content S6). Finally, high-contrast 3D volumetric images acquired with AO allowed for discernment of cellular and nuclear features. Distinct cytoarchitectural arrangement of pituitary adenoma cells included volumetric views of cells arranged around vessels in a perivascular and linear pattern as well as in sheets (Figure 10; Digital content S7).
 | Figure 9 Images of a human glioblastoma multiforme. (A) Single-frame CLE image from the Z-stack. (B) Volumetric view with nuclei pseudocolored in blue, cytoplasm in red, and fluorescein diffusion in the tissue in yellow. (C) H&E-stained section of the same specimen showing the typical palisading pattern of a glioblastoma. Abnormally big contours of the neoplastic cells are visible on the right part of CLE images and are even better represented in the 3D rendering of the Z-stack. Note: Used with permission from Barrow Neurological Institute. Abbreviations: 3D, three-dimensional; CLE, confocal laser endomicroscopy; H&E, hematoxylin and eosin.
|
 | Figure 10 Representative images of a pituitary adenoma rapidly stained ex vivo with AO. (A) Single frame from a Z-stack acquired with a CLE. (B) Volumetric view of the same field of view. The yellow and green rectangular sections of image (B) are enlarged to show greater detail and cellular structures. (C) Circular and linear cell arrangements are shown in the correlative H&E section of the same specimen. Note: Used with permission from Barrow Neurological Institute. Abbreviations: 3D, three-dimensional; AO, acridine orange; CLE, confocal laser endomicroscopy.
|
Discussion
3D volumetric assessment of human tissues
CLE imaging technology has rapidly become established as a tool for examining tissue in various fields, including gastroenterology, urology, ophthalmology, dermatology, and orthopedics. This report aims to bolster the presence of CLE imaging with a unique new 3D operation mode in the context of neurosurgery for brain tissue, particularly for real-time in vivo interrogation of brain tumor and surrounding tissues.
One of the greatest advantages unique to 3D CLE is the ability to visualize the exact shape, size, and anatomical relationships of brain tumor tissue and associated tissue regions, including blood vessels, individual cells, intracellular structures, and fluorophore distribution. Visualizing the course, shape, and size of vessels allows the operator to identify aberrant or tortuous vessels that are characteristic of neoplastic growth.20 Visualizing the exact shape and size of individual cells also provides greater confidence in identifying and delineating nonneoplastic versus neoplastic tissue. Furthermore, 3D microscopy affords the viewer the ability to appreciate the 3D relationships between tissue structures in order to develop a full understanding of its architecture. Features such as the spatial relationship between cells can contribute to more accurate tumor diagnosis. These features are particularly important in the context of using CLE as a surgical on-the-fly imaging adjunct in resecting gliomas. Essentially, CLE renders real-time optical biopsy or digital tissue inspection. With FNa-based CLE, a diagnosis of brain tumor is based on the presence of abnormal cell shape and size, cellular density, and tissue architecture, as well as the presence of fluorescent leakage around the cells.2 Compared to 2D CLE or 2D H&E-stained histologic images, 3D imaging allows visualization of the precise nature of abnormal cellular shapes and their spatial organization in multiple axes. For many brain tumors, especially infiltrative types, 3D CLE may allow discrimination and identification of individual cell types such as tumor cells, immune cells, or reactive astrocytes when using nonspecific nonbinding fluorophores such as FNa. These additional features present in 3D CLE compared with 2D imaging modalities provide a superior quality image that provides the surgeon with knowledge of the tissue structure below the surface.
In addition to the gliomas that we scanned and analyzed, imaging also provided insight on the 3D perspective of meningiomas. Specifically, 3D CLE allowed for visualization of spherical psammoma bodies, as well as a detailed look at the whorled architecture of the meningioma tissue. Such imaging may be utilized in crucial situations, such as when meningiomas extend or attach along the dura mater or for interrogation of meningioma tissue under resection when the tumor is suspected of being higher grade. The 3D CLE images appeared qualitatively as good as, or better than, their 2D mode counterparts when viewed by a neurosurgeon and a neuropathologist, confirming the potential use of 3D CLE in a clinical setting.
Consideration of the fluorescent dyes being used to perform 3D CLE imaging is paramount. Because dyes are a necessary component of histologic examination, future improvements in dyes will lead to enhanced identification of important histologic details by clinicians. This is especially relevant in terms of staining for neurologic tumors. Although the current dyes that are used (FNa for in vivo analysis; AO and AF for rapid, fresh, ex vivo analysis) have been shown to be helpful in identifying tumors,21 we have noted that use of AO allows CLE imaging at deeper penetration than FNa. However, AO is limited in use for in vivo human brain application because of toxicity issues. Future dyes or fluorescent probes that target tumors by more advanced and specific means will lead to further improvements in the use of 3D CLE technology to specifically examine tissue and guide or tailor resection. These dyes may include monoclonal antibodies against brain tumors bound to fluorescent molecules and other targeted fluorescent dyes.21–23
Software for 3D imaging
Current limitations with 3D rendering of the Z-stacks include the time required for processing and potential depth of imaging. The 3D rendering and pseudo-coloring of Z-stacks was completed separately after image collection, which could potentially be automated in the future to speed up image creation and display to the surgeon and the pathologist. The former issue depends on the software used for reconstruction and computer central processing unit speed. Currently available software varies by the interface, available feature analysis, cost, and complexity, with arguably the most popular and free software, Fiji, being used in our study. Examples of other available software include Imaris (Bitplane AG, Belfast, UK) and Amira (Thermo Fisher Scientific, Waltham, MA, USA).
Using TRI/3D-SRF software (Ratoc System Engineering, Tokyo, Japan), 3D models of glomeruli and their associated vasculature were included in 3D reconstructions of human tissues from images.24 A further example of the utility of 3D imaging is in screening for colon cancer, where 3D reconstruction of CT images is a standard procedure. This usage is highlighted in suggested guidelines for CT colonography stating that “interpretation should be based on both 2D and 3D images”.25
A variety of fields, including dermatology, ophthalmology, orthopedics, and gastroenterology, uses 3D volumetric analysis of human tissue. Researchers have created high-resolution images of lymph nodes, oral mucosa, the dermis layer of the skin, and auricular cartilage of the joint space.26–29 In addition to using Imaris and Amira, researchers have used Voxx (Indiana University, Bloomington, IN, USA) and Vaa3D (Allen Institute for Brain Science, Seattle, WA, USA) to develop 3D renderings of images acquired through benchtop confocal microscopy.28 The variety of image-rendering software available to analyze confocal microscopy adds another layer of complexity to the developing frontier of 3D CLE.
The 3D reconstructions in most previous studies14,26,28 were acquired on a benchtop system, which substantially limits in vivo application compared to the portability and on-the-fly functioning CLE system used in this study. Essentially, the power of benchtop LSM systems is rapidly evolving to allow similar functions in a portable handheld confocal laser scanning microscope system. In the future, 3D rendering could potentially be performed automatically during in vivo imaging. This automated system is already being used in other contexts. Thong et al29 described an embedded system of imaging analysis that connected the Optiscan FIVE 1 CLE to produce 3D virtual biopsies of oral lesions.
CLE limitations
Current limitations of 3D imaging with CLE are related to the intrinsic properties of the CLE probe and laser wavelength. The CLE probe used in this study was optimized to operate with FNa and with other fluorophores that have excitation in the blue light range (488 nm); however, this wavelength is not optimal for imaging with the protoporphyrin IX metabolite after administration of 5-aminolevulinic acid (5-ALA). Visualization of 5-ALA-induced protoporphyrin IX with CLE requires a laser in the 405 nm range and adjustments in probe and/or scanning optics, which are under development.30–32
For high resolution and detail, the probe was designed with a pinhole apparatus that limits light absorption to a specific depth of focus. The variations in size of CLE field of view; resolution in the X, Y, and Z axes; and the Z-step size are limited by this probe design. The current minimal Z-step interval is limited to 3 µm, restricting the maximum axial resolution of the 3D rendering. Reduced Z-step distance would result in increased axial resolution but at a price of increased processing time, which may reduce convenience for clinical use. Therefore, at this time we consider a Z-step of 3 µm practical and sufficient for a detailed reconstruction of a 3D volume for a real-time in vivo application. CLE imaging is currently constrained to a maximum depth of ~30 µm for the acquisition of meaningful images. This imaging penetration depth essentially reaches the physical limit for the 488 nm excitation light, which is due to the natural scattering properties of the biological tissues. Imaging depths of 36 µm in animal tissue and 28 µm in human tissue, described in this study, were measured for the images acquired with FNa and medium (~500 mW) laser power. The ideal depth may vary with other fluorophores, as noted with AO use, or other laser powers. Additionally, two photon excitation confocal microscopes (excitation wavelength > 800 nm) are in development that will increase imaging depth.33
Future directions
Although 3D imaging is a standard tool for benchtop confocal microscopes, this project reports the first use of in vivo probe-based 3D or volumetric CLE for animal and human brain tumor imaging. These 3D images are useful because they can identify subtle important cytoarchitectural features that are not apparent in 2D imaging and they can supply additional information to computers to automatically identify specific features on histology.34 The assessment of 3D images is novel for neuropathology or for any pathology routine, which is primarily based on the examination of 2D histologic slides. It could specifically be advantageous for computerized automated use in the clinical setting because it provides more data points and appreciation of the 3D space relationships of features, as opposed to 2D images and standard glass histology slides. The ability to quickly acquire many series of Z-stacks for real-time “on-the-fly” assessment or correlation by the neurosurgeon and the pathologist to brain tissue targeted for resection would seem to be advantageous for intraoperative applications. Such a method would facilitate a faster in vivo or intraoperative assessment of a “block” of tissue that would identify and elucidate a tissue site that would yield a more informative histological biopsy or tissue sample. Such imaging may also have a key use for study of crucial invasive tumor margin regions or the tissue after surgical resection (ie, surgical resection bed interface) or for correlation to conventionally stained histopathologic sections.
The clinical utility of 3D-reconstructed CLE images for brain tumor diagnosis should be validated in future studies. Factors, such as cost differences and operator preferences, as well as convenience, should also be taken into account before implementing 3D-rendered CLE imaging into practice. However, previous studies of 2D CLE imaging of the brain tumors were promising with high specificity and sensitivity values.2,35 Future steps in development of CLE systems include advanced application with other fluorophores (especially infrared probes,36 red fluorescent porphyrins37), label-free tissue assessment methods such as reflectance microscopy,38 Raman spectroscopy,39,40 and other technologies for in vivo microscopy.30,41
Conclusion
We report a novel 3D rendering of CLE images as an option for intraoperative endomicroscopy for brain tumors. The 3D-rendered images afford an increased spatial understanding of cellular architecture and structures compared with 2D histology. Future development of specific fluorescent probes is needed to expand the intraoperative employment of CLE imaging technology in identification and diagnosis of brain tumor tissue.
Acknowledgments
This research was supported with funds from the Barrow Neurological Foundation, the Women’s Board of the Barrow Neurological Institute, and by the Newsome Chair in Neurosurgery Research held by Dr Preul. Dr Belykh acknowledges scholarship support SP-2240.2018.4. We appreciate materials grant support by Carl Zeiss AG, Oberkochen, Germany (confocal laser endomicroscope). Carl Zeiss AG had no influence on the study design, data acquisition, analysis, or publication preparation. The authors thank the Neuroscience Publications staff at Barrow Neurological Institute for assistance with manuscript preparation.
Disclosure
The authors report no conflicts of interest in this work.
References
Martirosyan NL, Georges J, Eschbacher JM, et al. Potential application of a handheld confocal endomicroscope imaging system using a variety of fluorophores in experimental gliomas and normal brain. Neurosurg Focus. 2014;36(2):E16. | ||
Martirosyan NL, Eschbacher JM, Kalani MY, et al. Prospective evaluation of the utility of intraoperative confocal laser endomicroscopy in patients with brain neoplasms using fluorescein sodium: experience with 74 cases. Neurosurg Focus. 2016;40(3):E11. | ||
Brown TJ, Brennan MC, Li M, et al. Association of the extent of resection with survival in glioblastoma: a systematic review and meta-analysis. JAMA Oncol. 2016;2(11):1460–1469. | ||
Moore GE, Peyton WT. The clinical use of fluorescein in neurosurgery; the localization of brain tumors. J Neurosurg. 1948;5(4):392–398. | ||
Neira JA, Ung TH, Sims JS, et al. Aggressive resection at the infiltrative margins of glioblastoma facilitated by intraoperative fluorescein guidance. J Neurosurg. 2017;127(1):111–122. | ||
Bowden SG, Neira JA, Gill BJA, et al. Sodium fluorescein facilitates guided sampling of diagnostic tumor tissue in nonenhancing gliomas. Neurosurgery. 2018;82(5):719–727. | ||
Hamamcioglu MK, Akcakaya MO, Goker B, Kasimcan MO, Kiris T. The use of the YELLOW 560 nm surgical microscope filter for sodium fluorescein-guided resection of brain tumors: our preliminary results in a series of 28 patients. Clin Neurol Neurosurg. 2016;143:39–45. | ||
Bongetta D, Zoia C, Pugliese R, Adinolfi D, Silvani V, Gaetani P. Low-cost fluorescein detection system for high-grade glioma surgery. World Neurosurg. 2016;88:54–58. | ||
Stummer W. Factors confounding fluorescein-guided malignant glioma resections: edema bulk flow, dose, timing, and now: imaging hardware? Acta Neurochir (Wien). 2016;158(2):327–328. | ||
Stummer W. Fluorescein in brain metastasis and glioma surgery. Acta Neurochir (Wien). 2015;157(12):2199–2200. | ||
Charalampaki P, Javed M, Daali S, Heiroth HJ, Igressa A, Weber F. Confocal laser endomicroscopy for real-time histomorphological diagnosis: our clinical experience with 150 brain and spinal tumor cases. Neurosurgery. 2015;62(Suppl 1):171–176. | ||
Goetz M, Memadathil B, Biesterfeld S, et al. In vivo subsurface morphological and functional cellular and subcellular imaging of the gastrointestinal tract with confocal mini-microscopy. World J Gastroenterol. 2007;13(15):2160–2165. | ||
Asge Technology Committee. Confocal laser endomicroscopy. Gastrointest Endosc. 2014;80(6):928–938. | ||
Wu JP, Walton M, Wang A, Anderson P, Wang T, Kirk TB, Zheng MH. The development of confocal arthroscopy as optical histology for rotator cuff tendinopathy. J Microsc. 2015;259(3):269–275. | ||
Jones CW, Smolinski D, Keogh A, Kirk TB, Zheng MH. Confocal laser scanning microscopy in orthopaedic research. Prog Histochem Cytochem. 2005;40(1):1–71. | ||
National Research Council. Guide for the Care and Use of Laboratory Animals. 8th ed. Washington, DC: National Academies Press (US); 2011. | ||
Abdelwahab MG, Sankar T, Preul MC, Scheck AC. Intracranial implantation with subsequent 3D in vivo bioluminescent imaging of murine gliomas. J Vis Exp. 2011;(57):e3403. | ||
Zehri AH, Ramey W, Georges JF, Mooney MA, Martirosyan NL, Preul MC, Nakaji P. Neurosurgical confocal endomicroscopy: a review of contrast agents, confocal systems, and future imaging modalities. Surg Neurol Int. 2014;5:60. | ||
Schindelin J, Arganda-Carreras I, Frise E, et al. Fiji: an open-source platform for biological-image analysis. Nat Methods. 2012;9(7):676–682. | ||
Nagy JA, Chang SH, Dvorak AM, Dvorak HF. Why are tumour blood vessels abnormal and why is it important to know? Br J Cancer. 2009;100(6):865–869. | ||
Belykh E, Martirosyan NL, Yagmurlu K, et al. Intraoperative fluorescence imaging for personalized brain tumor resection: current state and future directions. Front Surg. 2016;3:55. | ||
Georges JF, Liu X, Eschbacher J, et al. Use of a conformational switching aptamer for rapid and specific ex vivo identification of central nervous system lymphoma in a xenograft model. PLoS One. 2015;10(4): e0123607. | ||
Martirosyan NL, Georges J, Kalani MY, Nakaji P, Spetzler RF, Feuerstein BG, Preul MC. Handheld confocal laser endomicroscopic imaging utilizing tumor-specific fluorescent labeling to identify experimental glioma cells in vivo. Surg Neurol Int. 2016;7(Suppl 40):S995–S1003. | ||
Uesugi N, Shimazu Y, Kikuchi K, Nagata M. Age-related renal microvascular changes: evaluation by three-dimensional digital imaging of the human renal microcirculation using virtual microscopy. Int J Mol Sci. 2016;17(11). | ||
Laghi A. Computed tomography colonography in 2014: an update on technique and indications. World J Gastroenterol. 2014;20(45):16858–16867. | ||
Antunes AP, Covington AD, Petford N, Murray T, Wertheim D. Three-dimensional visualization of dermal skin structure using confocal laser scanning microscopy. J Microsc. 2013;251(1):14–18. | ||
Wu JP, Kirk TB, Zheng MH. Study of the collagen structure in the superficial zone and physiological state of articular cartilage using a 3D confocal imaging technique. J Orthop Surg. 2008;3:29. | ||
Kelch ID, Bogle G, Sands GB, Phillips AR, LeGrice IJ, Dunbar PR. Organ-wide 3D-imaging and topological analysis of the continuous microvascular network in a murine lymph node. Sci Rep. 2015;5:16534. | ||
Thong PSP, Olivo M, Movania MM, et al. Toward 3-dimensional virtual biopsy of oral lesions through the development of a confocal endomicroscope interfaced with embedded computing. Paper presented at: Advanced Microscopy Techniques II; May 22; 2011; Munich, Germany. | ||
Belykh E, Miller EJ, Hu D, et al. Scanning fiber endoscope improves detection of 5-aminolevulinic acid-induced protoporphyrin IX fluorescence at the boundary of infiltrative glioma. World Neurosurg. 2018;113:e51–e69. | ||
Wei L, Chen Y, Yin C, Borwege S, Sanai N, Liu JTC. Optical-sectioning microscopy of protoporphyrin IX fluorescence in human gliomas: standardization and quantitative comparison with histology. J Biomed Opt. 2017;22(4):46005. | ||
Chen Y, Wang D, Khan A, Wang Y, Borwege S, Sanai N, Liu JT. Video-rate in vivo fluorescence imaging with a line-scanned dual-axis confocal microscope. J Biomed Opt. 2015;20(10):106011. | ||
Ducourthial G, Leclerc P, Mansuryan T, et al. Development of a real-time flexible multiphoton microendoscope for label-free imaging in a live animal. Sci Rep. 2015;5:18303. | ||
Izadyyazdanabadi M, Belykh E, Martirosyan N, Eschbacher J, Nakaji P, Yang Y, Preul MC. Improving utility of brain tumor confocal laser endomicroscopy: objective value assessment and diagnostic frame detection with convolutional neural networks. 2017;10134. | ||
Belykh E, Miller EJ, Patel AA, et al. Diagnostic accuracy of a confocal laser endomicroscope for in vivo differentiation between normal and tumor tissue during fluorescein-guided glioma resection: laboratory investigation. World Neurosurg. Epub 2018 Apr 17. | ||
Martirosyan NL, Cavalcanti DD, Eschbacher JM, et al. Use of in vivo near-infrared laser confocal endomicroscopy with indocyanine green to detect the boundary of infiltrative tumor. J Neurosurg. 2011;115(6):1131–1138. | ||
Pavlov V, Meyronet D, Meyer-Bisch V, et al. Intraoperative probe-based confocal laser endomicroscopy in surgery and stereotactic biopsy of low-grade and high-grade gliomas: a feasibility study in humans. Neurosurgery. 2016;79(4):604–612. | ||
Eschbacher JM, Georges JF, Belykh E, et al. Immediate label-free ex vivo evaluation of human brain tumor biopsies with confocal reflectance microscopy. J Neuropathol Exp Neurol. 2017;76(12):1008–1022. | ||
St-Arnaud K, Aubertin K, Strupler M, et al. Development and characterization of a handheld hyperspectral Raman imaging probe system for molecular characterization of tissue on mesoscopic scales. Med Phys. 2018;45(1):328–339. | ||
Romeike BF, Meyer T, Reichart R, Kalff R, Petersen I, Dietzek B, Popp J. Coherent anti-Stokes Raman scattering and two photon excited fluorescence for neurosurgery. Clin Neurol Neurosurg. 2015;131:42–46. | ||
Osman H, Georges J, Elsahy D, Hattab E, Yocom S, Cohen-Gadol AA. In vivo microscopy in neurosurgical oncology. World Neurosurg. Epub 2018 Apr 10. |
Supplementary materials
Content S1
Method of experimental tumor creation
This study was performed using 10-week-old female mice (n = 29) of the B6 (Cg)-Tyrc-23/J (albino C57BL/6) type. These mice had a mean weight of 20 g and were obtained from The Jackson Laboratory (Bar Harbor, ME, USA). Mice were injected with GL261-Luc2 mouse glioma cells (2 µL of 1.45 × 10⁷ cells/mL) in the right hemisphere following a previously established protocol.1,2 This was accomplished by first anesthetizing the mice with intraperitoneal injection of xylazine (80 mg/kg) and ketamine (10 mg/kg) and placing them into a stereotactic frame (model 900, David Kopf Instruments, Tujunga, CA, USA). After aseptic draping, the tumor injection needle was placed 2 mm posterior and 2 mm lateral to the bregma and 2.0 mm below the brain surface within the right hemisphere before the cells were injected.
Before surgery for the confocal laser endomicroscopy (CLE) investigation, the mice were confirmed to have the presence of glioma growth through bioluminescence detection (IVIS Spectrum system, PerkinElmer, Waltham, MA, USA). The mice were first anesthetized with isoflurane in a 37 °C chamber before being injected with 15 µg/kg luciferin (Perkin–Elmer). The images obtained from the bioluminescence were analyzed using the Living Image 4.3 software (PerkinElmer).2
One week after the confirmation of tumors and 24–30 days after the injection of tumor cells, the mice underwent surgery under intraperitoneally injected anesthesia (xylazine–ketamine). Mice received an intraoperative injection of varying concentrations of fluorescein sodium into the tail vein, about 1 hour prior to the surgery.
After the craniotomy, the mouse brains were sliced to expose the tumor and imaging was performed in vivo. Next, a spatula was used to remove the brain from the skull, and it was sliced into two halves using a surgical blade along the coronal plane over the approximated center of the tumor mass. These coronal slices were then rapidly imaged ex vivo using the CLE probes. The CLE probe was fixed within a flexible Greenberg retractor and was moved across the surface of the brain and tumor by hand. Operation of the handheld CLE probe is analogous to holding a pen.
Video of Z-stack volumetric view from the same sample as Figure 4. Moving video representation of slides showing hypercellularity and spatial relationship of mouse glioma cells pseudocolored in red on a green fluorescein background bordering normal brain.
Note: Used with permission from Barrow Neurological Institute
Video of Z-stack volumetric view from Figure 7B. This video shows a moving representation of a three-dimensional (3D) rendering of a Z-stack series acquired from human meningioma. The video shows, in detail, the size and spatial relationships of psammoma bodies with both a colored and noncolored view.
Note: Used with permission Barrow Neurological Institute
Alternative video of Z-stack volumetric view from Figure 8B. Moving video representation of CLE volumetric view of meningioma stained with acridine orange showing hypercellularity and whorls in the X, Y, and Z axes.
Note: Used with permission from Barrow Neurological Institute
Alternative video of Z-stack volumetric view from Figure 8E. Moving video representation of CLE volumetric view of meningioma stained with acriflavine showing hypercellularity in the X, Y, and Z axes.
Note: Used with permission from Barrow Neurological Institute
Video of Z-stack volumetric view for Figure 9B. Moving video representation of a glioblastoma showing hypercellularity and abnormal cellular size and shape in 3D.
Note: Used with permission from Barrow Neurological Institute
Video of Z-stack volumetric view for Figure 10B, yellow rectangle. Moving video representation of CLE Z-stack of a human pituitary adenoma, showing complex 3D cytoarchitecture.
Note: Used with permission from Barrow Neurological Institute
References
Martirosyan NL, Georges J, Eschbacher JM, et al. Potential application of a handheld confocal endomicroscope imaging system using a variety of fluorophores in experimental gliomas and normal brain. Neurosurg Focus. 2014;36(2):E16. | ||
Abdelwahab MG, Sankar T, Preul MC, Scheck AC. Intracranial implantation with subsequent 3D in vivo bioluminescent imaging of murine gliomas. J Vis Exp. 2011;(57):e3403. |
 © 2018 The Author(s). This work is published and licensed by Dove Medical Press Limited. The
full terms of this license are available at https://www.dovepress.com/terms
and incorporate the Creative Commons Attribution
- Non Commercial (unported, 3.0) License.
By accessing the work you hereby accept the Terms. Non-commercial uses of the work are permitted
without any further permission from Dove Medical Press Limited, provided the work is properly
attributed. For permission for commercial use of this work, please see paragraphs 4.2 and 5 of our Terms.
© 2018 The Author(s). This work is published and licensed by Dove Medical Press Limited. The
full terms of this license are available at https://www.dovepress.com/terms
and incorporate the Creative Commons Attribution
- Non Commercial (unported, 3.0) License.
By accessing the work you hereby accept the Terms. Non-commercial uses of the work are permitted
without any further permission from Dove Medical Press Limited, provided the work is properly
attributed. For permission for commercial use of this work, please see paragraphs 4.2 and 5 of our Terms.