")
Back to Journals » HIV/AIDS - Research and Palliative Care » Volume 15
Prevalence of HIV in Kazakhstan 2010–2020 and Its Forecasting for the Next 10 Years
Authors Mussina K , Kadyrov S, Kashkynbayev A, Yerdessov S, Zhakhina G, Sakko Y , Zollanvari A, Gaipov A
Received 6 April 2023
Accepted for publication 9 June 2023
Published 4 July 2023 Volume 2023:15 Pages 387—397
DOI https://doi.org/10.2147/HIV.S413876
Checked for plagiarism Yes
Review by Single anonymous peer review
Peer reviewer comments 3
Editor who approved publication: Prof. Dr. Olubunmi Akindele Ogunrin
Kamilla Mussina,1 Shirali Kadyrov,2 Ardak Kashkynbayev,3 Sauran Yerdessov,1 Gulnur Zhakhina,1 Yesbolat Sakko,1 Amin Zollanvari,4 Abduzhappar Gaipov1
1Department of Medicine, Nazarbayev University School of Medicine, Astana, Kazakhstan; 2Department of Mathematics and Natural Sciences, Suleyman Demirel University, Kaskelen, Kazakhstan; 3Department of Mathematics, Nazarbayev University, Astana, Kazakhstan; 4Department of Electrical and Computer Engineering, School of Engineering and Digital Sciences, Nazarbayev University, Astana, Kazakhstan
Correspondence: Abduzhappar Gaipov, Department of Medicine, Nazarbayev University School of Medicine, Kerey and Zhanibek Street 5/1, Astana, 010000, Kazakhstan, Tel +77172706297, Email [email protected]
Background: HIV is a growing public health burden that threatens thousands of people in Kazakhstan. Countries around the world, including Kazakhstan, are facing significant problems in predicting HIV infection prevalence. It is crucial to understand the epidemiological trends of infectious diseases and to monitor the prevalence of HIV in a long-term perspective. Thus, in this study, we aimed to forecast the prevalence of HIV in Kazakhstan for 10 years from 2020 to 2030 by using mathematical modeling and time series analysis.
Methods: We use statistical Autoregressive Integrated Moving Average (ARIMA) models and a nonlinear epidemic Susceptible-Infected (SI) model to forecast the HIV infection prevalence rate in Kazakhstan. We estimated the parameters of the models using open data on the prevalence of HIV infection among women and men (aged 15– 49 years) in Kazakhstan provided by the Kazakhstan Bureau of National Statistics. We also predict the effect of pre-exposure prophylaxis (PrEP) control measures on the prevalence rate.
Results: The ARIMA (1,2,0) model suggests that the prevalence of HIV infection in Kazakhstan will increase from 0.29 in 2021 to 0.47 by 2030. On the other hand, the SI model suggests that this parameter will increase to 0.60 by 2030 based on the same data. Both models were statistically significant by Akaike Information Criterion corrected (AICc) score and by the goodness of fit. HIV prevention under the PrEP strategy on the SI model showed a significant effect on the reduction of the HIV prevalence rate.
Conclusion: This study revealed that ARIMA (1,2,0) predicts a linear increasing trend, while SI forecasts a nonlinear increase with a higher prevalence of HIV. Therefore, it is recommended for healthcare providers and policymakers use this model to calculate the cost required for the regional allocation of healthcare resources. Moreover, this model can be used for planning effective healthcare treatments.
Keywords: HIV, prevalence, forecasting, ARIMA model, SI model
Introduction
Human Immunodeficiency Virus (HIV) is a virus that attacks the immune system and can induce Acquired Immune Deficiency Syndrome (AIDS), which is recognized as one of the most threatening communicable diseases worldwide.1 HIV is a growing public health burden that threatens millions of people around the world. Since its first discovery in 1983, HIV has become a pandemic affecting every country in the world. According to UNAIDS reports, 38 million people live with HIV and 680 thousand of lethal cases were registered with AIDS-related illnesses.1
Although the global situation of HIV is considered more stabilized, in Central Asia and Eastern Europe it remains to be a public health burden. Kazakhstan is a developing country that is largely situated in Central Asia. The spread of HIV in Kazakhstan probably coincided with the time the country gained its independence. Open international borders and labor migration might lead to the spread of infection into Kazakhstan. It is considered that the primary route of transmission of HIV infection in Kazakhstan is intravenous drug use, then followed by high-risk behavior such as sex workers and low condom use.2,3
Based on UNAIDS, 35,000 people (aged 15 and over) are living with HIV infection in Kazakhstan, which implies a prevalence rate of 0.3% (adults aged 15 to 49). Since there were 3600 newly acquired HIV cases in 2020, which is a 72% increase with respect to past decade, it is crucial to understand the epidemiological trends of infectious diseases and to monitor the prevalence and incidence of HIV in a long-term perspective.4,5 Mathematical modeling and time series analysis will allow us to predict future disease development. Such evidence-based information provides the knowledge for healthcare providers that would be beneficial for the implementation of public health procedures for effective prevention and control of the future spread of HIV infection.6,7 Since there is a lack of studies that forecast new HIV infections in Kazakhstan, it is essential to investigate HIV from a time series forecasting perspective. There exist various approaches to studying time series forecasting. Autoregressive Integrated Moving Average (ARIMA) models provide a family of statistical methods applicable to time series data in various situations.8
Since the time series we consider it coming from the HIV epidemic, the nonlinear mathematical compartment models provide another commonly preferred approach.9,10,16,17 While the latter can be used to make predictions, these nonlinear models proved usefulness also in addressing the effect of various control strategies.11 In this study, we aimed to forecast the prevalence of HIV in Kazakhstan using statistical ARIMA models and nonlinear epidemic SI models. We also predict the effect of PrEP control measures on the prevalence rate.
Methods
Dataset
In analysis, we use the official HIV prevalence dataset provided by the Agency for Strategic planning and reforms of the Republic of Kazakhstan Bureau of National Statistics12 (Table 1).
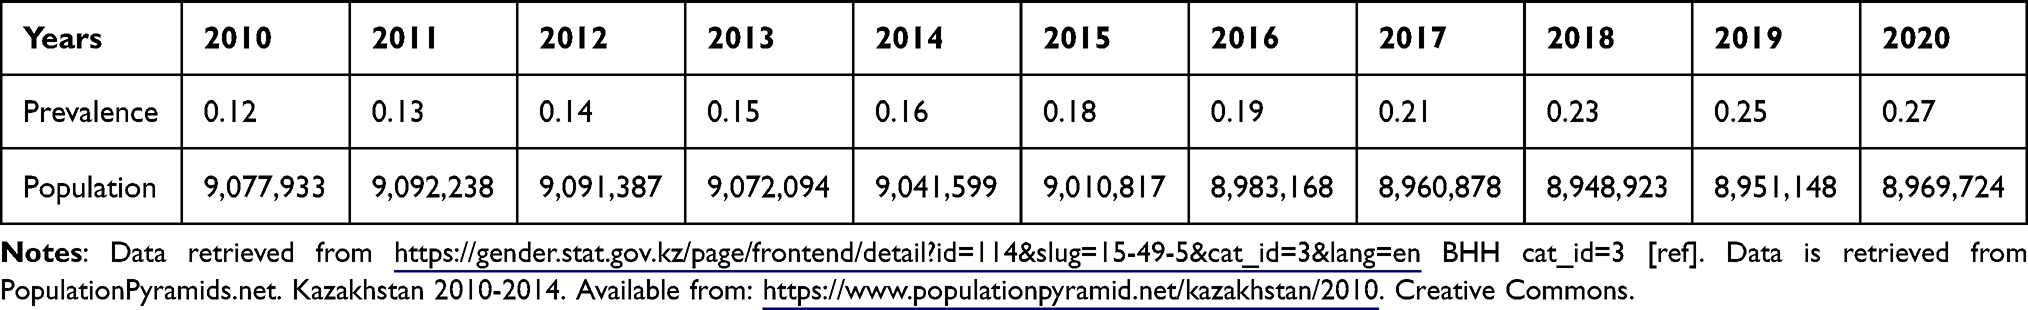 |
Table 1 Prevalence (%) of HIV Infection Among Women and Men (Aged 15–49 Years) and the Population of the Age Group Between 15 and 49 Years in Kazakhstan |
Statistical ARIMA Models
An Autoregressive Integrated Moving Average (ARIMA) is a family of statistical time series models with nonnegative integer parameters p, d and q used to predict the future based on past values. For given parameters, we write ARIMA(p, d, q), where p is the order of autoregressive part, d is the minimum number of differencing operations to convert the series into stationary time series, and q is the order of moving average terms. For a given time series Y1,Y2, …, Yn a simpler model ARMA(p, q) can be considered if the time series is stationary. In this case, the ARMA(p, q) equation can be written as
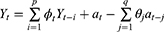
where  ’s and
  ’s are parameters and
  ’s are unknown residuals assumed to be independent random variables with an identical standard normal distribution. When the time series is not stationary, one needs to integrate differencing into ARIMA(p, d, q). Let B denote Box-Jenkins backshift operator given by
  . Then from ARMA(p, q) one can derive ARIMA(p, d, q) model given by
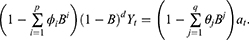
We note that ARIMA(p, d, q) model with nontrivial differencing has p+q+1 parameters.
In order to find the order (p, d, q) of ARIMA that best fits to the given data, we first need to determine minimal differencing d that leads to stationary time series. This can be done using the Augmented Dickey–Fuller (ADF) test. Then, p and q can be selected by minimizing the Akaike Information Criterion corrected (AICc) score given by13
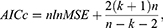
where k is the number of model parameters, n is the sample size, and MSE is the mean square error term. AICc score is preferred to the original AIC when the sample size is small as in our case.13 For ARIMA(p, d, q), we have k=p+q+1, when d is positive.
Nonlinear Epidemic SI Model
The mathematical model that we study is adapted from Zhao et al, where a two-compartment model is considered. More specifically, the population of sexually active individuals (ages 15–49) N is divided as Susceptible (S) and HIV Infectious (I). The flow diagram is given in Figure 1, where  is the annual rate of the population becoming sexually active, β is the transmission rate, µ is the sum of the annual natural death rate and rate of departure from the sexually active state, and
  is the annual death rate due to the disease.
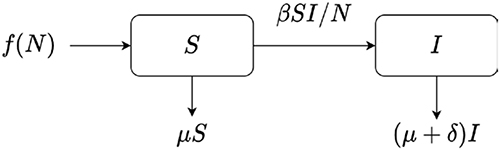 |
Figure 1 Flow diagram for the epidemic model SI. |
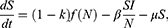
It gives the following SI epidemic model
There are essentially three different kinds of models for  that we may consider in this study, namely, constant, exponential, and logistic growth models. The constant model
  assumes that annually
  individuals become sexually active. The exponential model
  assumes that the rate of change of population is proportional to the current population N with the rate of growth r. Finally, the logistic growth
  assumes that there is a carrying capacity K that the population can never exceed.
Adding the equations in our model and recalling  yield
yield

It follows from the data presented in Table 1 that the population of individuals aged between 15 and 49 can be assumed to be constant; that is,  where we took the average between the years 2010 and 2020. It means
  , which leads to

With this choice of  we have the disease-free equilibrium when
  and
and  . Now it is evident that the basic reproduction number R satisfies

To estimate parameters, we use the constraint least square optimization. Since we let  , we are left with three variables
  to estimate. We may estimate
  from HIV mortality data for the period 2014–2019, see Table 2.
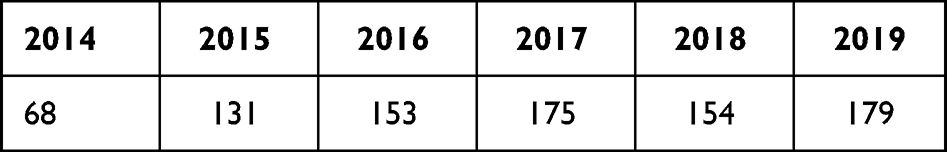 |
Table 2 Mortality Due to HIV in Kazakhstan |
The HIV mortality rate for a given year can be obtained by dividing the number of deaths in Table 2 by the population size in Table 1. Since we have δ constant, the point estimator can then be obtained by taking the average of these mortality rates leading to

It remains to estimate β and µ. This is done with the built-in function curve_fit in the Python SciPy library that utilizes the Trust Region Reflective algorithm. Since all parameters are positive, we considered a lower bound constraint of 0.01 for both. To measure the goodness of fit we reported the coefficient of determination, r2 given by

where  is the estimated number of infectious individuals and
  is the average number of infectious individuals. To compare the SI model with ARIMA we report AICc scores for both.
HIV Control Strategies
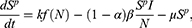
Aside from comparing the models and forecasting the prevalence we also consider possible outcomes of HIV control strategies, more specifically, the effect of possible pre-exposure prophylaxis (PrEP) introduction. In the presence of PrEP we split the Susceptible compartment as Susceptible PrEP users  and Susceptible individuals not using PrEP
  resulting in three-compartment model
  with flow diagram given in Figure 2.
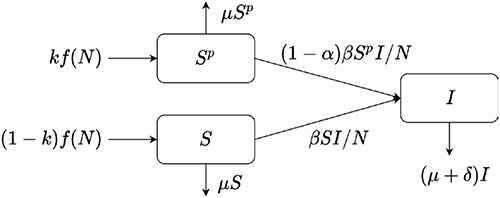 |
Figure 2 Flow diagram for the nonlinear epidemic model with PrEP. |
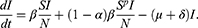
Here, k is the proportion of PrEP users becoming sexually active, and α is the efficacy of PrEP in reducing susceptibility per act. The corresponding epidemic model is given by
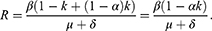
Here, disease-free equilibrium is  and it follows that the basic reproduction number is given by
For calibration we barrow  , and δ from the parameters estimates of the SI model above. We assume that α=0.5 and simulate how the prevalence changes with varying k in [0,1].
Results
Order Estimates for ARIMA
In the analysis, we utilized the Augmented Dickey–Fuller (ADF) test to determine the appropriate value for the parameter d in the ARIMA model.14,18 Initially, we examined stationarity in the time series, and the ADF test with d = 0 and d = 1 yielded non-significant p-values, indicating the persistence of non-stationarity. However, upon increasing d to 2, we conducted the ADF test again and obtained a significant p-value, suggesting that the differenced series achieved stationarity. This finding is further supported by the 2nd order differencing and autocorrelation plots depicted in Figure 3, where a clearer pattern of stationarity is observed. Thus, based on the ADF test results and visual analysis, we concluded that a value of d = 2 should be utilized for differencing in the ARIMA model.
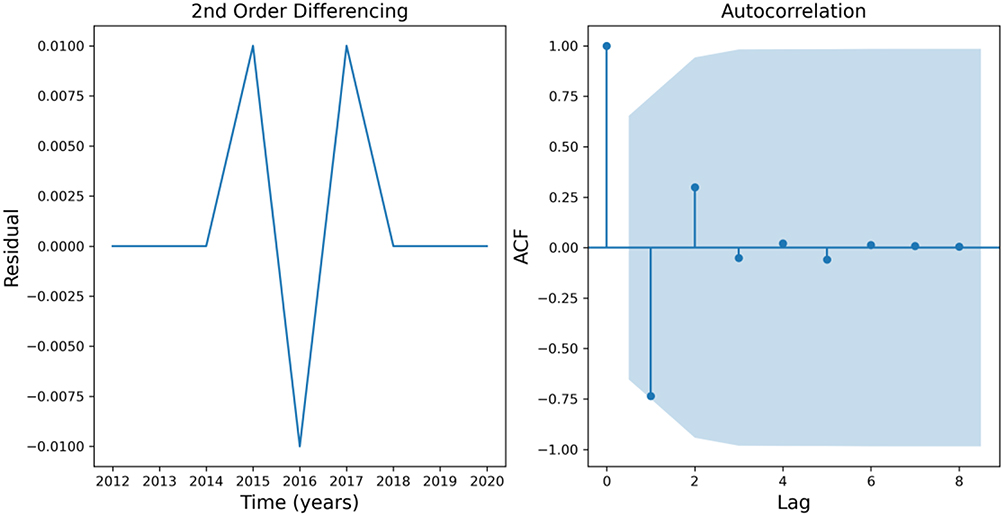 |
Figure 3 Differencing and autocorrelation when the parameter d=2, 2nd order differencing plot and autocorrelation plot. |
After selecting d = 2 based on the Augmented Dickey–Fuller (ADF) test, we proceeded to determine the optimal values for the parameters p and q in the ARIMA model. By minimizing the Akaike Information Criterion with correction (AICc) score, we found that the best fit was achieved with p = 1 and q = 0, resulting in an AICc score of −65.94. The results of the ARIMA(1,2,0) model are presented in Figure 4, where the density plot of residuals indicates a normal distribution with a mean of 0.0078. These findings suggest that the ARIMA(1,2,0) model adequately captures the underlying patterns in the data.
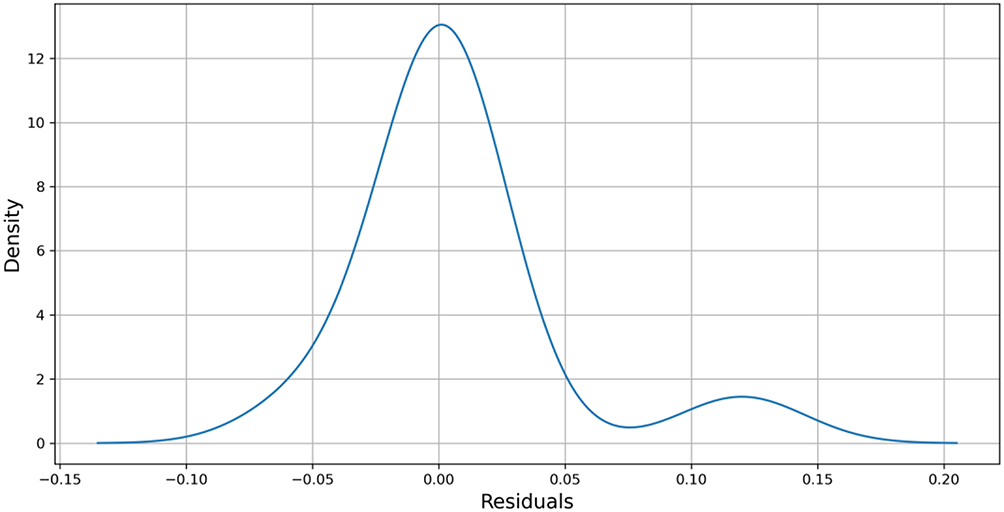 |
Figure 4 Normality of residuals for ARIMA(1,2,0) where mean equals 0.0078. |
Figure 5 presents the graphical representation of the actual HIV prevalence data in Kazakhstan alongside the fitted values obtained from the ARIMA model. Overall, the model demonstrates a satisfactory fit, closely aligning with the actual data, except for the initial two-year period. Table 3 provides a summary of the fitting details, including relevant statistics and parameters, shedding further light on the model’s performance.
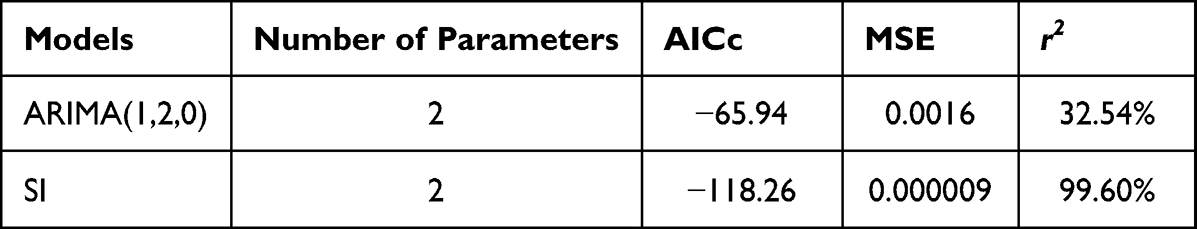 |
Table 3 The Goodness of Fit Metrics for ARIMA and SI |
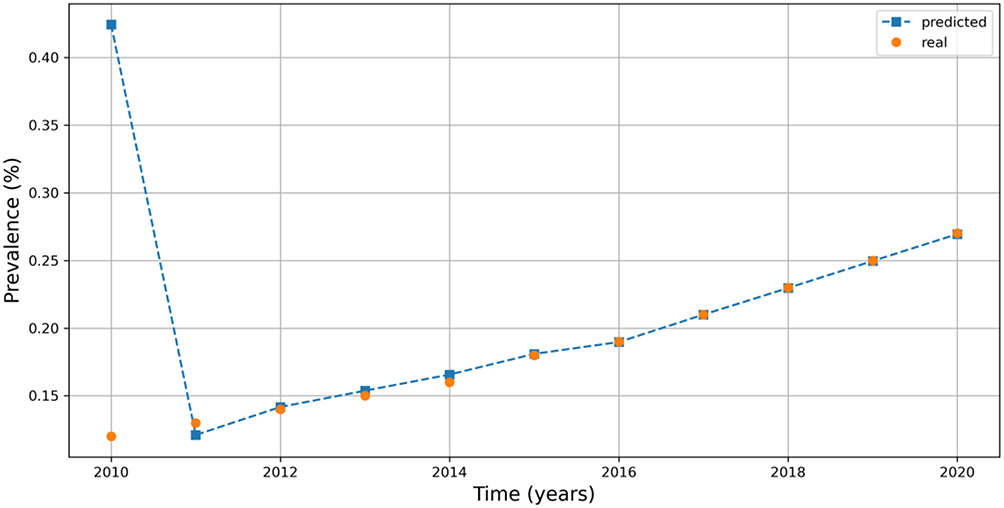 |
Figure 5 ARIMA prediction of prevalence. |
Parameter Estimates for SI
By fitting the nonlinear dynamical SI model to the HIV prevalence data, we were able to estimate the model parameters as follows: β=0.09072 and, µ=0.01. The coefficient of determination r2 for the fitted model is calculated to be 0.9971, which corresponds to an impressive 99.71% accuracy in explaining the variance in the data. Figure 6 illustrates the comparison between the fitted values and the actual values for the number of infectious individuals, providing a visual representation of the model’s performance in capturing the underlying dynamics of the HIV prevalence.
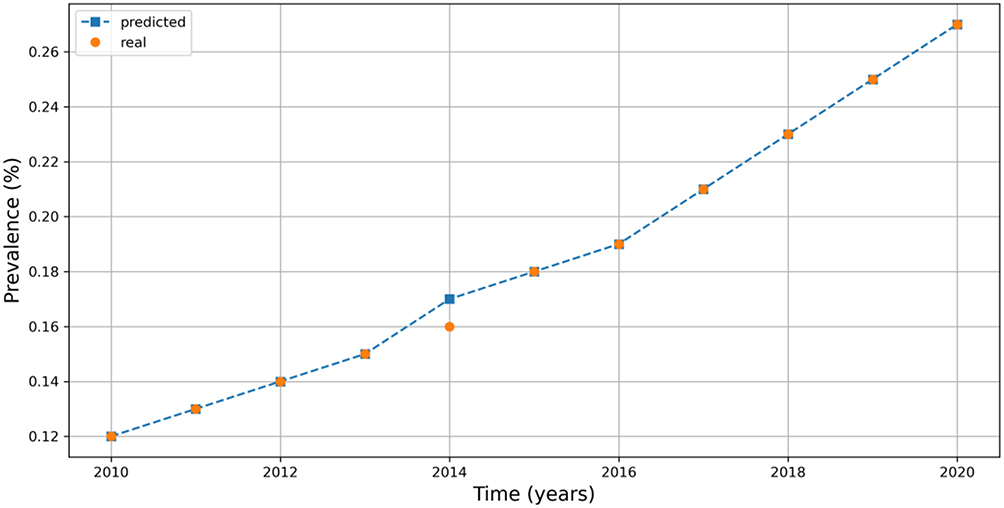 |
Figure 6 SI prediction of prevalence. |
Based on the estimated model parameters (β=0.09072 and, µ=0.01), the basic reproduction number (R0) for the HIV prevalence can be calculated as 9.06. This value represents the average number of new infections caused by a single infectious individual in a completely susceptible population.
Using these parameters, we conducted a forecast for the number of HIV active cases up to 2030, as shown in Table 4. The forecast indicates that by 2030, the number of HIV active cases is expected to double compared to the current level. This projection highlights the potential growth and impact of the HIV epidemic if no significant interventions or prevention measures are implemented. It emphasizes the importance of continued efforts in HIV prevention, treatment, and awareness to address the challenges posed by the disease.
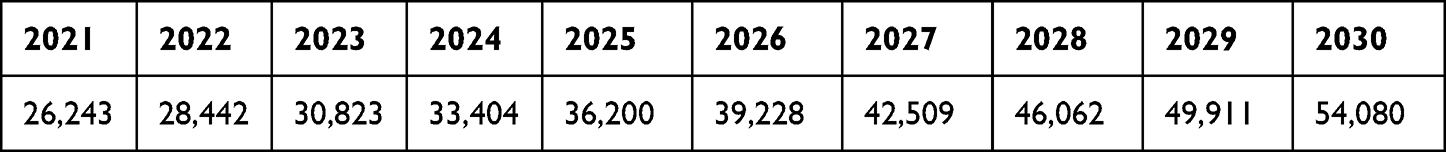 |
Table 4 SI Predicted Active Cases |
Model Comparisons and Prevalence Forecasting
Table 3 provides the goodness of fit metrics for both ARIMA and SI models. According to all three metrics we see that while both models have two parameters, the nonlinear SI model outperforms statistical ARIMA.
Table 5 and Figure 7 provide HIV prevalence forecasting results for both models. While ARIMA predicts a linear trend, SI forecasts a nonlinear increase with higher prevalence.
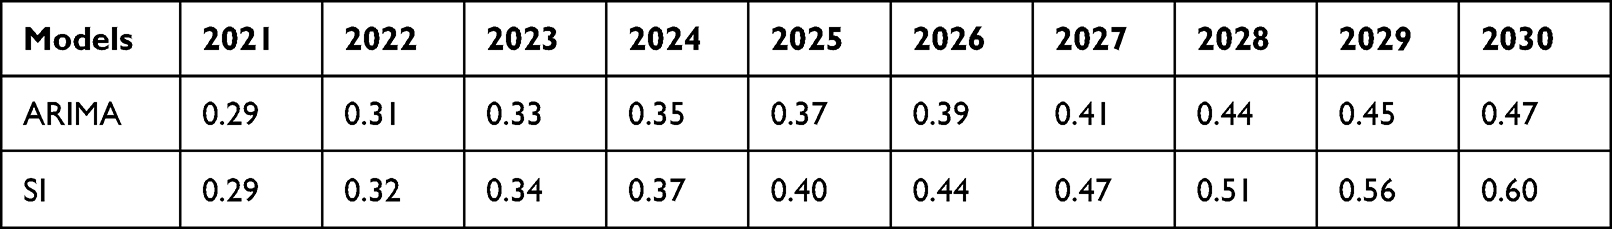 |
Table 5 Forecasted Prevalence (%) |
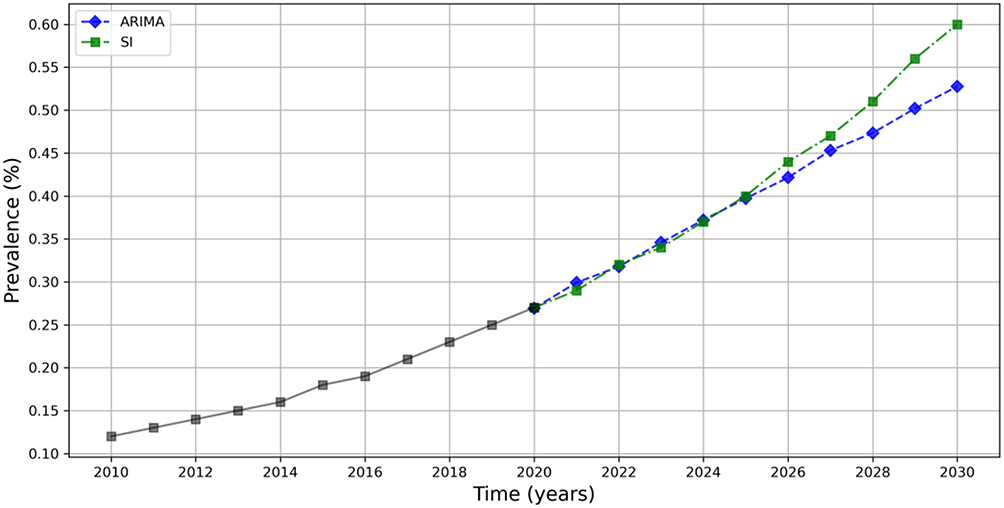 |
Figure 7 HIV prevalence forecasting by ARIMA and SI models. |
Controlling HIV with PrEP
In our analysis, we explored the effects of PrEP (Pre-Exposure Prophylaxis) on controlling HIV transmission. Our approach is supported by previous research conducted by Zhao et al, who investigated the impact of population recruitment on HIV epidemics and the effectiveness of HIV prevention interventions using the SI model.11 Specifically, we examined the impact of varying the parameter k, which represents the proportion of PrEP users becoming sexually active. It is important to note that we did not determine specific values for the parameters used in this study. Instead, we conducted a sensitivity analysis by varying the value of k from 0 to 1 to assess its influence on the predicted prevalence of HIV.
Figure 8 presents the results of the SI model, showcasing the predicted effects of PrEP. In the absence of PrEP, the model yielded a basic reproduction number of 9.06, indicating the potential for rapid transmission. However, by incorporating PrEP and adjusting the value of k, we observed a reduction in the basic reproduction number to as low as 4.53. This finding suggests that PrEP usage can significantly decrease the transmission rate of HIV.15,19 Furthermore, our analysis indicated a notable reduction in the predicted prevalence of HIV, further highlighting the potential effectiveness of PrEP in controlling the spread of the disease.
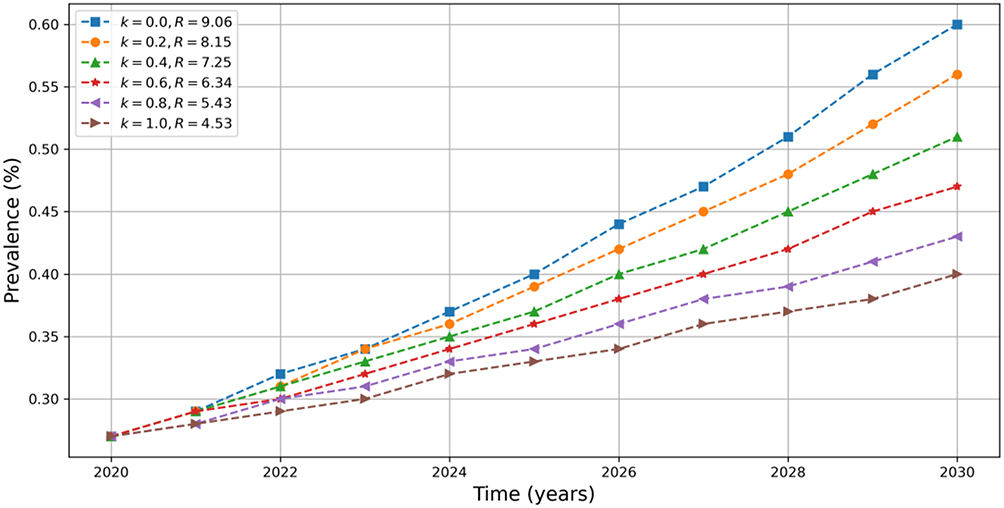 |
Figure 8 HIV prevalence forecasting with PrEP for various scenarios. |
Discussion
In this paper, we study the dynamics of HIV in Kazakhstan using statistical and mathematical models. In particular, we use the so-called Autoregressive Integrated Moving Average (ARIMA) statistical tool and a Susceptible-Infected (SI) compartmental model of nonlinear differential equations to forecast the HIV prevalence rate in Kazakhstan.8,11,12 We estimated the parameters of the models using open data on the prevalence of HIV infection among women and men (aged 15–49 years) in Kazakhstan provided by the Kazakhstan Bureau of National Statistics. Based on this data, the ARIMA model suggests that the prevalence of HIV infection in Kazakhstan will increase from 0.29 in 2021 to 0.47 by 2030. On the other hand, the SI model suggests that this parameter will increase to 0.60 by 2030 based on the same data. As a result, we have the Akaike Information Criterion corrected (AICc) score for the ARIMA(1,2,0) and SI models are equal to −65.94 and −118.26, respectively. Moreover, the mean square error (MSE) for the estimated parameters were 0.0016 and 0.000009 for the ARIMA(1,2,0) and the SI models, respectively. Finally, to see the goodness of fit of the models we calculate the R-squared which turned out to be 32.54% and 99.60% for the ARIMA(1,2,0) and SI models, respectively. From these analyses, we conclude that the nonlinear mathematical model fits the given data better than the ARIMA model. Furthermore, with the SI model it is easy to compute the basic reproduction number R, which plays a vital role in taking public health decisions. In particular, the basic reproduction number of HIV in Kazakhstan is estimated to be 9.06. We further studied the SI model for HIV prevention under the pre-exposure prophylaxis (PrEP) strategy. Depending on the coverage of PrEP among susceptible individuals, we provided different scenarios for HIV prevalence forecasting. For instance, if k=0.1, which means the proportion of PrEP users is 10%, then R is equal to 8.15, whereas the prevalence of HIV infection in Kazakhstan will be around 0.25. If k =0.6, then R and the prevalence drop to 6.34 and 0.21, respectively. Therefore, we conclude that prevention strategies such as PrEP can significantly help to mitigate HIV prevalence.
From the perspective of healthcare providers, since HIV prevalence is expected to increase, it will require more healthcare needs, which, consequently, leads to more costs for the country. Therefore, it is recommended for healthcare providers and policymakers to use this model to calculate the cost required for the regional allocation of healthcare resources. Moreover, this model can be used for planning effective healthcare treatments. Further, this model can be used for the study of designing disease-modifying vaccines and also for the prevention of HIV infection in the future.
While ARIMA is a statistical model that can be used in most of the time series analysis, it does not necessarily take into account various compartments involved in the population. In that sense, the SI model is more likely to provide better insight into the epidemic dynamics of HIV. However, with only two compartments, the SI model can be considered a simple dynamical system that does not necessarily reflect other aspects of the disease. To this end, it is possible to design a more complex system that includes age compartments, gender compartments, ethnicity compartments, regional compartments, and so on. However, having a more complex model does not necessarily lead to better forecasting. Another limitation of the SI model considered is being an autonomous system that assumes all epidemiological parameters are time-independent. Since our data has only 11 points, this assumption does not affect the predictions significantly.
Conclusion
This study revealed that ARIMA (1,2,0) predicts a linear increasing trend, while SI forecasts a nonlinear increase with a higher prevalence of HIV. It is predicted that the prevalence rate will rise almost two times from the results of both models (from 0.29 to 0.47 in ARIMA (1,2,0) and from 0.29 to 0.6 in the SI model). Moreover, HIV control strategies such as PrEP can significantly reduce the predicted prevalence. Since these models can provide us with different scenarios for HIV prevalence forecasting, the results of this study will be beneficial for the prevention and control of HIV infection spread.
Data Sharing Statement
The data that support the findings of this study are available from Republican Center for Electronic Health of the Ministry of Health of the Republic of Kazakhstan, but restrictions apply to the availability of these data, which were used under the contract-agreement for the current study, and so are not publicly available. Data are however available from the A.G., is a PI of the project, upon reasonable request and with permission of Ministry of Health of the Republic of Kazakhstan.
Informed Consent Statement
Patient consent was waived due to the retrospective nature of the study in which only anonymous data were analyzed.
Institutional Review Board Statement
The study was approved by the institutional review and ethic committee of the Nazarbayev University (NU-IREC 315/21092020 on 23/09/2020) with exemption from informed consent.
Acknowledgments
We thank all staff from Republican Center of Electronic Healthcare for provided data and consultancy. We would like to express our appreciation for all healthcare professionals for their continuous effort to fight against HIV infection.
Author Contributions
All authors made a significant contribution to the work reported, whether that is in the conception, study design, execution, acquisition of data, analysis and interpretation, or in all these areas; took part in drafting, revising or critically reviewing the article; gave final approval of the version to be published; have agreed on the journal to which the article has been submitted; and agree to be accountable for all aspects of the work.
Funding
This study was supported by grant from Ministry of Education and Science of the Republic of Kazakhstan 2021–2023 (Funder Project Reference: AP09259016). The funder had no role in study design, data collection and analysis, decision to publish, or preparation of the manuscript. A.G. is a PI of the project.
Disclosure
The authors declare no competing interests in this work.
References
1. Global HIV & AIDS statistics — fact sheet UNAIDS. Available from: https://www.unaids.org/en/resources/fact-sheet.
2. Thorne C, Ferencic N, Malyuta R, Mimica J, Niemiec T. Central Asia: hotspot in the worldwide HIV epidemic. Lancet Infect Dis. 2010;10(7):479–488. doi:10.1016/S1473-3099(10)70118-3
3. Morris K. Transfusion-related HIV outbreak in Kazakhstan children. Lancet Infect Dis. 2006;6(11):689. doi:10.1016/S1473-3099(06)70612-0
4. Country factsheets Kazakhstan 2020 UNAIDS. Available from: https://www.unaids.org/en/regionscountries/countries/kazakhstan.
5. HIV in figures and facts for 5 years (2016–2020) Kazakh Scientific Center of Dermatology and Infectious diseases 2021. Available from: http://kncdiz.kz/en/aids/aids/statistika.
6. Zhandybayeva A, Truzyan N, Shahumyan E, et al. The survival rate of tuberculosis patients in HIV-treated cohort of 2008–2018 in Almaty, Kazakhstan. J Infect Dev Ctries. 2020;14(11.1):116s–21s. doi:10.3855/jidc.11955
7. El-Bassel N, Gilbert L, Terlikbayeva A, et al. HIV among injection drug users and their intimate partners in Almaty, Kazakhstan. AIDS Behav. 2013;17(7):2490–2500. doi:10.1007/s10461-013-0484-2
8. Yu HK, Kim NY, Kim SS, Chu C, Kee MK. Forecasting the number of human immunodeficiency virus infections in the Korean population using the autoregressive integrated moving average model. Osong Public Health Res Perspect. 2013;4(6):358–362. doi:10.1016/j.phrp.2013.10.009
9. Zakary O, Rachik M, Elmouki I. On the impact of awareness programs in HIV/AIDS prevention: an SIR model with optimal control. Int J Comput Appl. 2016;133(9):1–6.
10. Jia J, Qin G. Stability analysis of HIV/AIDS epidemic model with nonlinear incidence and treatment. Adv Differ Equ. 2017;2017:1–3. doi:10.1186/s13662-017-1175-5
11. Zhao Y, Wood DT, Kojouharov HV, Kuang Y, Dimitrov DT. Impact of population recruitment on the HIV epidemics and the effectiveness of HIV prevention interventions. Bull Math Biol. 2016;78(10):2057–2090. doi:10.1007/s11538-016-0211-z
12. Gusmanov A, Zhakhina G, Yerdessov S, et al. Review of the research databases on population-based registries of Unified electronic Healthcare system of Kazakhstan (UNEHS): possibilities and limitations for epidemiological research and real-world evidence. Int J Med Inform. 2023;170:104950. PMID: 36508752. doi:10.1016/j.ijmedinf.2022.104950
13. Burnham KP, Anderson DR. Model Selection and Multimodel Inference: A Practical Information-Theoretic Approach.
14. Dickey DA, Fuller WA. Likelihood ratio statistics for autoregressive time series with a unit root. Econometrica. 1981;1:1057–1072. doi:10.2307/1912517
15. Nichols BE, Boucher CA, van der Valk M, Rijnders BJ, van de Vijver DA. Cost-effectiveness analysis of pre-exposure prophylaxis for HIV-1 prevention in the Netherlands: a mathematical modelling study. Lancet Infect Dis. 2016;16(12):1423–1429. doi:10.1016/S1473-3099(16)30311-5
16. Ertunc B, Kaya S, Koksal I. Clinico-epidemiological analysis of HIV/AIDS patients. Eurasian J Med. 2016;48(3):157–161. doi:10.5152/eurasianjmed.2016.15203
17. Umunna NC, Olanrewaju SO. Forecasting the monthly reported cases of Human Immunodeficiency Virus (HIV) at Minna Niger State, Nigeria. Open J Stat. 2020;10:494–515. doi:10.4236/ojs.2020.103030
18. Ceballos RF. Human immunodeficiency virus (HIV) cases in the Philippines: analysis and forecasting. JP J Biostat. 2019;16(2):67–77.
19. Kurniasari MD, Huruta AD, Tsai HT, Lee C-W. Forecasting future HIV infection cases: evidence from Indonesia. Soc Work Public Health. 2021;36(1):12–25. doi:10.1080/19371918.2020.1851332
 © 2023 The Author(s). This work is published and licensed by Dove Medical Press Limited. The full terms of this license are available at https://www.dovepress.com/terms.php and incorporate the Creative Commons Attribution - Non Commercial (unported, v3.0) License.
By accessing the work you hereby accept the Terms. Non-commercial uses of the work are permitted without any further permission from Dove Medical Press Limited, provided the work is properly attributed. For permission for commercial use of this work, please see paragraphs 4.2 and 5 of our Terms.
© 2023 The Author(s). This work is published and licensed by Dove Medical Press Limited. The full terms of this license are available at https://www.dovepress.com/terms.php and incorporate the Creative Commons Attribution - Non Commercial (unported, v3.0) License.
By accessing the work you hereby accept the Terms. Non-commercial uses of the work are permitted without any further permission from Dove Medical Press Limited, provided the work is properly attributed. For permission for commercial use of this work, please see paragraphs 4.2 and 5 of our Terms.