")
Back to Journals » Clinical Interventions in Aging » Volume 13
Prevalence of geriatric syndromes among people aged 65 years and older at four community clinics in Moscow
Authors Tkacheva ON , Runikhina NK, Ostapenko VS, Sharashkina NV, Mkhitaryan EA, Onuchina JS, Lysenkov SN, Yakhno NN, Press Y
Received 6 October 2017
Accepted for publication 28 December 2017
Published 9 February 2018 Volume 2018:13 Pages 251—259
DOI https://doi.org/10.2147/CIA.S153389
Checked for plagiarism Yes
Review by Single anonymous peer review
Peer reviewer comments 3
Editor who approved publication: Dr Richard Walker
Olga N Tkacheva,1 Nadezda K Runikhina,1 Valentina S Ostapenko,1 Natalia V Sharashkina,1 Elen A Mkhitaryan,1,2 Julia S Onuchina,1 Sergei N Lysenkov,1,3 Nikolai N Yakhno,2 Yan Press4–6
1Pirogov Russian National Medical University, The Russian Clinical Research Center for Gerontology, Moscow, Russia; 2Neurology Department, Sechenov First Moscow State Medical University, Moscow, Russia; 3Department of Evolution, Faculty of Biology, Lomonosov Moscow State University, Moscow, Russia; 4Department of Family Medicine, Siaal Research Center for Family Medicine and Primary Care, Faculty of Health Sciences, Ben-Gurion University of the Negev, Beer-Sheva, Israel; 5Yasski Clinic, Comprehensive Geriatric Assessment Unit, Clalit Health Services, Beer-Sheva, Israel; 6Unit for Community Geriatrics, Division of Health in the Community, Ben-Gurion University of the Negev, Beer-Sheva, Israel
Background: Geriatric syndromes (GSs) are common in older adults and have a significant effect on their quality of life, disability, and use of health care resources. Few studies have assessed the prevalence of GSs in Russia. The aim of this study is to assess the prevalence of GSs among older adults living in the community in Moscow.
Methods: A cross-sectional study was conducted in four community clinics in Moscow. A total of 1,220 patients completed a screening questionnaire, and 356 of them also underwent a comprehensive geriatric assessment (CGA).
Results: The mean age of the 1,220 participants was 74.9±6.1 years; 75.5% were women. Based on the questionnaire, 58.3% reported visual or hearing impairment, 58.2% cognitive impairment, 46% mood disorder, 42% difficulty walking, 28.3% urinary incontinence, 21.3% traumatic falls (over the previous year), and 12.2% weight loss. The mean number of GSs per patient was 2.9±1.5. Based on CGA, a decline in Instrumental Activity of Daily Living score was identified in 34.8% of the patients, a risk of malnutrition (Mini-Nutritional Assessment score, 17–23.5) in 25.8%, probable cognitive impairment (Mini-Mental State Examination score <25) in 8.6%, and symptoms of depression (15-item Geriatric Depression Scale score >5) in 36.2%. On the whole, patients demonstrated good mobility (average walking speed, 1±0.2 m/s) and hand grip strength (23.9±6.4 kg in women and 39.1±8.3 kg in men), but poor balance (only 39.4% were able to maintain their balance on one leg for 10 s or more).
Conclusion: The results of this study demonstrate a high prevalence of GSs among community-dwelling people aged 65 years and older in Moscow. The results provide a better understanding of the needs of older adults in Russia and can facilitate planning for medical and social assistance for this population.
Keywords: geriatric syndromes, comprehensive geriatric assessment, questionnaire, community-dwelling, Russia
Introduction
As in most parts of the world, the population of Russia is aging. Life expectancy in Russia has increased by 6 years over the past 10 years and was 71.9 years in 2016. In this period of time, population aged 60 years and older increased from 17.1% to 20.3%.1
In Moscow, the capital city of Russia and its biggest city with a population of 12 million (8% of the total Russian population), this situation is even more prominent. Life expectancy in the capital exceeds the all-Russian mean by more than 5 years (77.1 years in Moscow vs 71.9 years in the Russian Federation), and individuals aged 60 years or older comprised 21.5% of the population in 2015.2
Geriatric syndromes (GSs)3,4 are clinical conditions in older adults which do not fit into discrete disease categories.5 Their prevalence increases with age. Conditions such as delirium, pressure ulcers, falls, and incontinence are GSs that have been described in the literature for many years,5,6 but other conditions including functional and cognitive impairment, affective disorders, visual and hearing problems, self-neglect and elder abuse, malnutrition, eating and feeding problems, sleep problems, and even dizziness and syncope also have been included under the heading of GSs.7 GSs can have a significant effect on patients’ quality of life, and, in some cases, there are interventions that can improve the patient’s prognosis. For example, falls occur in one-third of the older population (65 years and older) each year and have a significant effect on increased hospitalization rates, overall costs, disability, and even increased mortality.8 Both single interventions (such as Tai Chi or physiotherapy) and combined interventions have been shown to effectively reduce fall rates.9
Despite their significant prevalence, GSs often remain undiagnosed,10,11 and the number of studies on the prevalence of GSs in Russia is very low.12–16 These isolated studies do not always provide full information as to the condition of older adults aged 65 years and older in Russia. For example, the study by Zakharov,12 which evaluated the rate of cognitive impairment, included a large study population from 33 Russian cities, but this study population was recruited from the patients who came to a neurology clinic. This may be the reason that 83.4% of the study participants complained of cognitive problems and 68.2% were diagnosed with cognitive impairment. Demin14 investigated mobility disorders, but only in the city of Arkhangelsk in northern Russia. In this study, patients who had a previous cerebrovascular accident (CVA), diabetes mellitus, Alzheimer’s disease, Parkinson’s disease, peripheral neuropathy, or vestibular disorders were excluded. It is also not clear how the participants were recruited and from where. Thus, it is difficult to draw conclusions, based on these studies, on the rate of GSs in the general population of older adults in Russia.
The study by Gurina et al,16 the largest of its kind, was conducted in St Petersburg. It is the only study that provides a broad picture of the rates of GSs in one of the city’s 18 districts. In discussing the limitations of the study, the authors state that caution must be used in generalizing the results of the study to the overall population of St Petersburg because the study district’s population might be different from the populations of the city’s other districts. Furthermore, one should take into consideration that this study was conducted in 2009 and since then the sociodemographic characteristics of the Russian population have changed, including an increase in life expectancy.
Over the course of recent years, the geriatric services in Russia have undergone a profound reorganization. In the process, geriatric teams have been trained, geriatric guidelines have been updated, and long-term planning is now underway for both the health care system and the social services. This planning process necessitates a renewed assessment of the condition of older adults, including the rates of GSs.
The aim of this study is to analyze the prevalence of GSs among community-dwelling older adults in Moscow, based on the questionnaire and the comprehensive geriatric assessment (CGA).
Methods
Study questionnaire
The study questionnaire was composed of seven dichotomous items for evaluation of the following characteristics: weight loss (“Did you lose 5 kg or more in the past 6 months?”), impaired vision or hearing (“Do you have any restrictions in daily living due to decreased vision or hearing?”), fall-related injuries (“Have you had any injury-related falls during the last year?”), mood disorder (“Have you felt depressed, sad or anxious over the past weeks?”), cognitive impairment (“Do you have problems with memory, comprehension, orientation or ability to plan?”), urinary incontinence (“Do you have urinary incontinence?”), and difficulty walking (“Do you have any difficulty walking at home or on the street up to a distance of 100 meters, or climbing a flight of stairs?”).
The name of the questionnaire in Russian is “Vozrast ne pomekha” (VNP), which translates into English as “Age is not a hindrance.” The name was compiled from the acronyms of the Russian names of the syndromes included in the questionnaire. One point was recorded for each positive answer, so the total score ranged from 0 to 7.
This questionnaire underwent a validation process, and the results of that process were published previously and are presented in abridged form here.17 The responses to each questionnaire item were compared with a gold standard for the subject matter of the item.
The question “Have you lost 5 kg or more in the past 6 months?” was analyzed in relation to a score below 23 in the Mini-Nutritional Assessment (MNA)18 questionnaire. The resulting sensitivity for the question was 27.0%, the specificity was 89.0%, the positive predictive value (PPV) was 39.2%, and the negative predictive value (NPV) was 82.3%.
The question “Have you felt depressed, sad or anxious over the past weeks?” was analyzed in relation to a score >5 in the 15-item Geriatric Depression Scale (GDS-15).19 The resulting sensitivity was 71.9%, the specificity was 76.1%, the PPV was 63%, and the NPV was 82.7%.
The question “Do you have problems with memory, comprehension, orientation or ability to plan?” was compared with the doctor’s diagnosis of dementia or mild cognitive impairment. The resulting sensitivity was 83.8%, the specificity was 28.6%, the PPV was 84.7%, and the NPV was 27.3%.
The question “Do you have any difficulty in walking at home or on the street?” was analyzed in relation to a score ≥14 s in the Timed Up and Go (TU&G) test.20 The resulting sensitivity was 84.7%, the specificity was 65.5%, the PPV was 45.0%, and the NPV was 92.8%. The same question was also analyzed in relation to a score on walking speed below 0.8 m/s with a sensitivity of 83.6%, a specificity of 63.3%, a PPV of 34.6%, and an NPV of 93.9%.
Setting and participants
The “ZABOTA” study (which translates into English as “Care”) was conducted in four community clinics (“polyclinics”) in the southern, western, central, and eastern districts of Moscow from 2014 to 2015. About 40,000 individuals are served by these four clinics. Of whom, about 15% (~6,000) are of 65 years of age and older.
Patients aged 65 years and older, regardless of the reason for their visit at the clinic, were included in the study group unless they fulfilled the exclusion criteria that included acute disease, exacerbation of a chronic disease (because of our concern that participation in the study might keep them from receiving timely treatment), or significant impairment of vision or hearing, which could impede informed consent, data collection, or conduct of the CGA. At the time of recruitment, we did not register the patient’s clinic, so we were not able to determine how many participants came from each clinic. In the first phase of the study, trained physicians administered the study questionnaire to each patient on the day they came to the clinic.
The CGA phase
In the second phase, all participants who completed the study questionnaire were asked to undergo a CGA. All those who agreed, regardless of their questionnaire score, underwent CGA in their clinics. The CGA included anthropometry, measurement of basic activities of daily living (BADL) using the Barthel Index21 (BI) with a total score ranging from 0 (total dependence) to 100 (total independence in BADL), and Instrumental Activity of Daily Living (IADL) using the Lawton Scale,22 with a total score ranging from 0 (total dependency) to 27 (total independency) in IADL. BI has intrarater (r=0.65), interrater (r=0.75–0.99), and test–retest (r=0.87) reliability.23 It was highly correlated with the Katz Index (r=0.77).23 The Lawton Scale has high intrarater reliability (r=0.85), reproducibility (0.93–0.96), and validity (0.4–0.61).24
Mobility was assessed using the TU&G test20 (a score >14 s is associated with a high fall risk in community-dwelling older adults25) and a walking speed test (a threshold of 0.7 m/s is significantly associated with fall risk).26 The ability to maintain balance while standing on one leg was determined for each leg, and the best result was used for analyses. The result was considered good if the time was ≥10 s, satisfactory at 6–9 s, and bad at ≤5 s.27 Grip strength was determined with a medical hand dynamometer “DMER-120” (“TVES,” Tulinovka, Russia), and the results were compared to normative age and sex data. Dynamometry was measured twice for each hand. The maximum value obtained for either hand was used for subsequent analyses.
Nutritional status was assessed by the MNA questionnaire,18 a 0- to 30-point scale, in which a lower score indicates a worse nutritional status. An MNA score between 17.0 and 23.5 was interpreted as at risk for malnutrition, and a score of less than 17.0 was an indicator of malnutrition.28 The MNA tool has excellent reliability with an intraclass correlation of 0.89 and validity between 0.13 and 0.98 (due to the lack of a gold standard for nutritional assessment).28
Cognitive function was assessed by the Mini-Mental State Examination (MMSE),29 a 0- to 30-point scale in which a lower score indicates worse cognitive status. MMSE has an internal consistency of 0.54–0.96, test–retest reliability of 0.74–0.99,30 sensitivity of 81%, and specificity of 89%.31 For this study, patients were classified into one of three categories: 25–30 points indicated normal cognitive status, 21–24 points indicated mild cognitive impairment, and ≤20 points indicated moderate cognitive impairment. Another tool for cognitive assessment used in this study was the Clock Drawing Test (CDT).32 The CDT was scored using Sunderland’s 10-point scale,33 in which a lower score indicates a worse cognitive status. The CDT has excellent intrarater (r=0.86–0.97) and interrater (r=0.86) reliability,33 sensitivity of 76%, and specificity of 85%.31
The patient’s affective state was assessed using the GDS-15.19 If the score was >5 points, the patient was considered to be at risk for depression, based on the systematic review.34 GDS-15 has good internal consistency (Cronbach α=0.75), sensitivity (81.5%–89.5%), and specificity (65.3%–73.4%).35
The number of medications taken regularly and the number of chronic diseases were recorded, based on the screening questionnaire.
The Helsinki Committee of the National Research Center for Preventive Medicine, Moscow, Russia, approved the study and allowed the investigators to obtain oral consent from the participants (approval N09-06/14).
Statistical analyses
Participants were divided into two age groups (65–74 years and ≥75 years), and these groups were compared on quantitative variables with the Student’s t-test (a variant was used for unequal variances in groups) or the Mann–Whitney U test. Intergroup differences in qualitative variables were analyzed using Fisher’s exact test. Data processing and analyses were carried out using Microsoft Excel 2007 and Statistica 8.0 (StatSoft, Tulsa, OK, USA).
Results
Questionnaire
The VNP questionnaire was completed by 1,220 participants (mean age, 74.8±6.1 years; range, 65–93 years) including 921 females (75.5%). Impaired vision or hearing was reported by 711 participants (58.3%); problems with memory, understanding, orientation, or ability to plan by 710 participants (58.2%); and feeling depressed, sad, or anxious by 562 (46.1%). Only 7% of the participants answered “no” to all these questions. The mean number of problems was 2.9±1.5, and 649 participants (53.2%) reported three or more problems. In the group of participants aged 75 years or older, the mean score was significantly higher than among the younger participants (3.2±1.4 vs 2.6±1.5, respectively, P<0.005). Other than weight loss and mood disorders, the number of positive responses increased with age for all the GSs (Table 1).
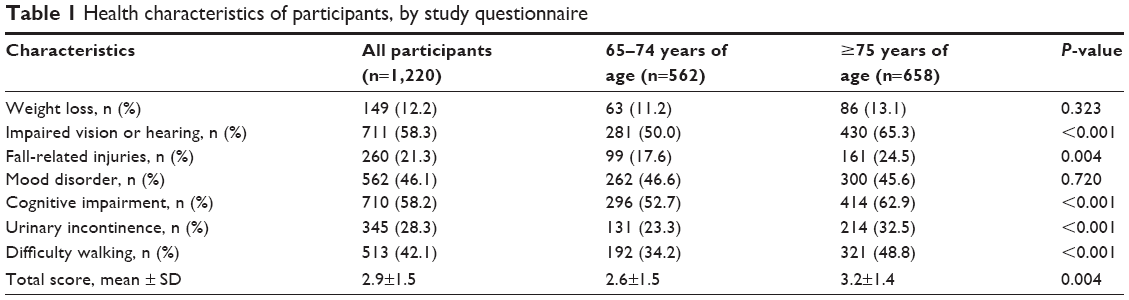 | Table 1 Health characteristics of participants, by study questionnaire |
Comprehensive geriatric assessment
Three hundred fifty-six participants who completed the questionnaire (29.2%) underwent the CGA (mean age, 74.9±6.1 years), including 286 females (80.4%). Compared to the group that did not underwent CGA, the group that underwent CGA had fewer participants who reported mood disorders (40.7% vs 48.3%, respectively, P=0.019), more participants who reported cognitive impairment (72.5% vs 52.3%, respectively, P<0.0001), and more participants who reported urinary incontinence (40.4% vs 23.7%, respectively, P<0.001). The mean number of GSs was significantly higher in the CGA group compared to the group that did not underwent CGA (3.07±1.54 vs 2.54±1.52, respectively, P<0.0001). The results of the CGA are presented in Table 2.
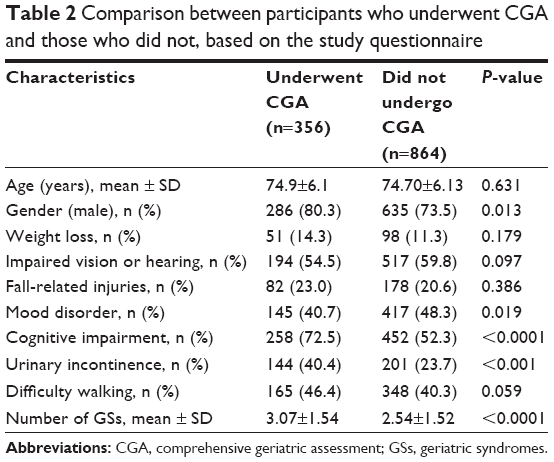 | Table 2 Comparison between participants who underwent CGA and those who did not, based on the study questionnaire |
A high percentage of the study participants suffered from chronic diseases: 315 (88.5%) had arterial hypertension, 260 (73.0%) arthropathy, 86 (24.2%) diabetes mellitus, and 60 (16.9%) reported malignant neoplasms.
BI was below 100 in 16 participants (4.5%) with 4 (2.5%) in the younger group and 12 (6.1%) in the older group. One hundred twenty-four (34.8%) participants had IADL with a Lawton score below 27. This functional limitation was more prevalent among older than younger participants (26.0% vs 41.9%, respectively, P=0.002).
Malnutrition (MNA <17) was found in only one participant (0.3%) who was in the older age group. Ninety-two (25.8%) of the participants were classified as having an increased risk for malnutrition (MNA =17–23.5), with a prevalence of 21.5% in the younger age group and 29.3% in the older group. Body mass index (BMI) of the older participants was significantly lower than in the younger ones (28.0±4.6 vs 29.9±5.0, respectively, P<0.001).
The mean walking speed for the total study population was 1.0±0.2 m/s. It was lower among the older participants (0.9±0.24 m/s vs 1.1±0.22 m/s, respectively, P<0.001). The results of the TU&G test also demonstrated lower mobility for participants in the older age group (13.4±4.8 s vs 10.8±3.7 s, respectively, P<0.001). Only 136 participants (39.4%) were able to maintain their balance on one leg for ≥10 s, with a significantly higher percentage in the younger participants (48.1% vs 32.5%, respectively, P<0.001). The maximum hand grip strength was significantly lower among older participants in both sexes: women: 22.4±6.3 kg vs 25.7±6.04 kg, respectively (P<0.001); men: 40±7.9 kg vs 43.6±7.36 kg, respectively (P<0.001).
Symptoms of depression (GDS-15>5) were found in 128 participants (36.2%). A GDS-15 score >5 was seen in 48 younger participants (30.6%) compared to 80 (40.6%) in the older age group.
The mean MMSE score was significantly lower among older than younger participants (27.9±1.7 vs 26.8±2.3, respectively, P<0.001). Based on the MMSE, 7.7% of the older participants had mild cognitive impairment (MMSE score, 21–24) and 0.9% had moderate impairment (MMSE score, ≤20). The score 21–24 was more prevalent in the older age group (10.4% vs 4.4%, respectively, P<0.005). The mean CDT score in all participants was 8.1±1.6 points. It was significantly lower in the older age group (7.9±1.6 vs 8.4±1.6, respectively, P<0.001).
The percentage of participants who took medications regularly was 96.1%. Of whom, most participants took 1–4 medications (44.9%), 38.5% took 5–7 medications, and 12.6% took ≥8 medications.
Discussion
The aim of this study is to analyze the prevalence of GSs among outpatients in Moscow using the VNP questionnaire and a CGA.
Based on the medical literature, the prevalence of malnutrition (MNA <17) among community-dwelling older adults is 1%, and 29% are at risk for malnutrition (MNA 17–23.5).36 In the “Crystal” study,16 the investigators found that 1.8% of the participants were malnourished (MNA <17) and 17.3% had an increased risk for malnutrition (MNA 17–23.5). In that study, there was no increase in the prevalence of malnutrition with increasing age. In this study, the assessment of malnutrition was based on two measures: the patient’s answer to the question on weight loss over the previous 6 months and the MNA. Twelve percent of the participants reported weight loss in the previous 6 months, and, based on the MNA, 0.3% were malnourished and 25.8% were at risk for malnutrition. Neither measure showed an increase in the prevalence of malnutrition with increasing age.
Unfortunately, we were unable to determine whether there were any differences in food intake between the participants in this study and the “Crystal” study.16 We are also unable to offer a full explanation for the difference in MNA between the two studies without being able to compare all the items in the MNA. However, even if there is no “direct” evidence that the participants in this study were not at a greater risk for malnutrition than those in the “Crystal” study, we believe that the results for two of the variables do provide “indirect” evidence that they were not a greater risk: 1) the BMI was higher in this study than in the “Crystal” study (28.0–29.9 vs 26.6–28.6, respectively) and 2) the hand grip strength was higher for both men and women in this study (22.4–25.7 for women and 40.0–43.6 for men in this study vs 11.2–14.3 for women and 19.7–25.9 for men in the “Crystal” study).
According to international data, the prevalence of low visual acuity among people aged 50 years and older is 36%37 and increases with age. In the United States, about 30% of people aged 70 years and older and about 50% aged 80 years and older report hearing loss.38 Among noninstitutionalized older adults, the prevalence of combined vision and hearing loss is 13.4%–24.6%.39 In this study, our data on the prevalence of sensory deficits were based on the VNP questionnaire only. We found that complaints of decreased vision and/or hearing were very prevalent, even though blindness and deafness were exclusion criteria, and that these complaints increased significantly with age. Similarly, the most common GSs in the “Crystal” study16 were impaired hearing (60.7%) and impaired vision (89.5%). Data on vision and hearing impairment in the “Crystal” study were also obtained by questionnaire only. Thus, the real prevalence of visual and hearing problems cannot be determined in either this study or the “Crystal” study.16
In the study by Verma et al40 among adults in the United States, 2% of the respondents older than 65 years reported a fall-related injury in the previous 3 months. The prevalence of falls in our study was based on the VNP questionnaire, which focused on fall-related injuries. More than 21% reported such injuries over the previous year with the prevalence rate increasing with age. Assuming that the incidence of traumatic falls in the study by Verma et al40 was constant at ~8% per year, the results of our study suggest a significantly higher prevalence of injury-related falls. This high rate among the older adults in Russia was confirmed by the results of a prospective cohort study in St Petersburg that included 537 participants aged 65 years and older.15 The results of that study showed that almost 19% of the participants had a fall-related fracture over the previous 12 months. It should be noted that the participants in that study were recruited from either a geriatric center or a hospital for rheumatic diseases, so the participants in that study were more likely to be more frail than those in this study. Another study on the risk of falls in Russia14 included 2,000 participants, aged 65–89 years, from the north Russian city of Arkhangelsk. The prevalence of injury-related falls was 11% over the previous 12 months. Patients with a history of stroke, diabetes mellitus, Parkinson’s disease, Alzheimer’s disease, peripheral neuropathy, and vestibular disorders were not included in Demin’s study,14 so the actual prevalence of injury-related falls could be higher.
In the study on the quality of life of older adults in Moscow,13 about 47% of the participants noted the presence of some difficulty in walking and another 20% reported serious difficulty. We studied the prevalence of mobility impairment using the VNP questionnaire and objective tests. With both methods, the prevalence of impaired mobility increased with age. Although the mean value of walking speed was rated as good, 42.1% of the respondents reported difficulties in ambulation. Compared with the findings of the “Crystal” study,16 in which 10% of the men and 13.2% of the women aged 65–74 years and 31.5% of the men and 43.3% of the women aged 75 years and older failed to maintain their balance during the tandem step, we found a higher percentage of participants with difficulty in maintaining balance on one leg for more than 5 s as 39.5% of the patients aged 65–74 years and 54.4% of the patients aged 75 years and older were unable to stand for this amount of time.
According to the study by Vereeck et al41 on 318 asymptomatic adults, the standard for standing with eyes closed was shorter for single-leg standing than for tandem stance in all age groups. Thus, for example, in the 7th decade of life, the standard for single-leg standing was less than 9 s compared to 18 s for tandem stance. In light of these findings, it is possible that the differences in the percentage of participants with balance disturbances between this study and the “Crystal” study could be explained by the method used to test balance. In any event, it important to note that walking speed in this study was better than in the “Crystal” study16 (1.0 m/s in this study compared to ≤0.6 m/s in the “Crystal” study).
Depending on the criteria used, the prevalence of clinically significant symptoms of depression in older adults ranged from 6.5% to 25.3%.42 Based on the questionnaire, the frequency of complaints related to impaired mood in this study did not change with age, but we did find that the percentage of participants with a GDS-15 score >5 increased from 30.6% in the younger patients to 40.6% in the patients aged 75 years and older (P=0.059). In the “Crystal” study,16 the prevalence of symptoms of depression (GDS-15>5) was 25.9% in the 65–74 years age group and 42.5% in patients aged 75 years and older. Thus, the frequency of GDS-15 score >5 among participants in our study was comparable to the “Crystal” study.
The prevalence of cognitive impairment increases as the general population ages. In one study, dementia was found in 5% of patients aged 71–79 years, 24% aged 80–89 years, and 37% aged 90 years and older.43 In this study, the prevalence of cognitive impairment was assessed by the study questionnaire, MMSE, and CDT. Based on the questionnaire, the prevalence of cognitive impairment was 58.2%. However, only 30 of 356 patients (8.6%) had an MMSE score of ≤24 (possible cognitive impairment). The prevalence of cognitive impairment by MMSE in the “Crystal” study16 was higher than in this study, with 20.5% of their participants having an MMSE score in the range of 21–24 points compared to 7.7% of our participants. Almost 55% of the participants in this study had a high education level, and less than 17% had fewer than 10 years of education (Table 3). In the “Crystal” study, 28.5% had fewer than 10 years of education (personal communication from the authors). This difference may explain the difference in the MMSE scores, with a relatively lower score in this study compared to the “Crystal” study.
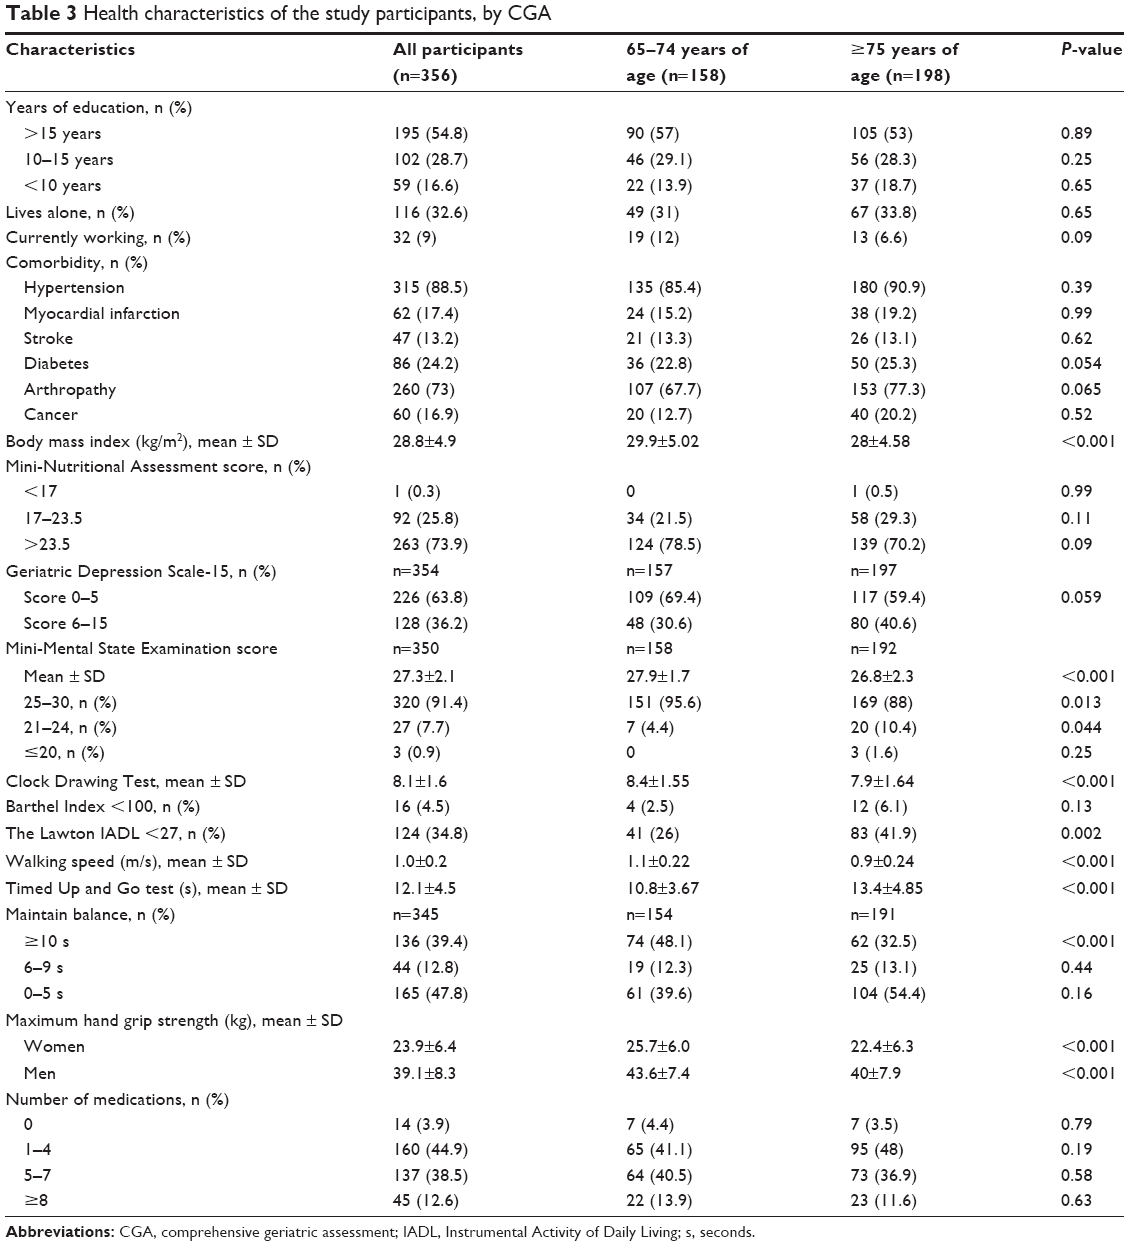 | Table 3 Health characteristics of the study participants, by CGA |
Urinary incontinence occurs in 15%–30% of noninstitutionalized older adults.5,44 In the “Crystal” study,16 the incidence of urinary incontinence was 40.9% and increased with age. In this study, 28.3% of the participants reported urinary incontinence and prevalence also increased with age.
Functional status was assessed by CGA only. About 4.5% had a reduced BI score, but IADL was reduced in one-third of the participants. An increase in the prevalence of functional impairment with age was found for IADL only. In the “Crystal” study,16 the prevalence of a BI score <100 was higher, with 14.4% among patients aged 65–74 years and 33% among patients aged 75 years and older.
The high rates of urinary incontinence and functional impairment seen in the “Crystal” study can be explained by the higher rate of frail older people in that study compared to our study population. Although the frailty index was calculated in the “Crystal” study but not in this study, based on the results for walking speed, hand grip strength, and even the MMSE score, it would appear that our population was “stronger,” which can definitely explain the lower rate of urinary incontinence and functional impairment.
Strengths and limitations
This study has a number of strengths. First, to our knowledge, this is the first large-scale study of GSs in Moscow. Second, the study population was recruited from different community clinics and districts of Moscow making the study results generalizable. Third, almost 30% of the participants who completed the study questionnaire also underwent the CGA, so the results by questionnaire could be compared with the results of the CGA.
This study has several potentially serious limitations as well. First, the results are not representative of the entire population of community-dwelling older adults because the study included only people who went to the clinic and agreed to participate in the study. Although these participants had a good degree of functional independence and mobility, the fact that they sought medical help could point to a selection bias with a higher prevalence of chronic diseases and GSs than in the general population of older adults. There is evidence that this is the case in the prevalence of arterial hypertension and diabetes mellitus, which was higher in this study population than in the overall population of older adults in Russia, based on the epidemiologic SAGE study.45
Because of the long commuting distances in Moscow and because our aim is to have a maximum number of study participants to complete the study questionnaire and undergo the CGA, the CGA was conducted at the patient’s community clinics. Despite this, only 30% of those participants who completed the questionnaire also underwent the CGA.
In the study by Reuben et al46 that was conducted with the framework of the Project Safety Net, 814 participants underwent initial screening with a questionnaire before CGA. Of these participants, 296 (36%) did not have any problem that justified CGA and 518 (64%) failed the screening process. Thus, only 220 (42.5%) underwent CGA. The authors estimated that the number of participants who underwent CGA was low because most of the participants who underwent screening did not have syndromes that bothered them or justified CGA. We believe that ageism, in which older people commonly believe that the presence of GSs is an integral part of the aging process, reduced the percentage of older people who eventually underwent CGA in both the study by Reuben et al46 and in this study. Another explanation, which is unique to Russia, is that the field of geriatrics has only developed over recent years, so there is still no sufficient awareness in this population on the potential benefits of geriatric assessment for patients.
As noted previously, the participants who underwent CGA were different from those who did not, and there were more women in the CGA group, and this group complained more about cognitive problems and on urinary incontinence, but fewer had mood complaints (Table 2). These differences are based on complaints and not on objective geriatric assessment, but in light of these findings, the results of this study may be less generalizable to the overall older adult population in Moscow than we anticipated.
Conclusion
The results of this study provide evidence for a high prevalence of GSs, such as difficulties in maintaining balance and symptoms of depression and sensory deficit among community-dwelling individuals aged 65 years and older in Moscow. These results can foster a better understanding of the needs of this segment of the population in Russia, can facilitate the planning of comprehensive medical and social aid, and can motivate primary care physicians to identify GSs and implement appropriate preventive measures.
Author contributions
Prof Olga N Tkacheva designed the study and wrote the article. Prof Nadezda K Runikhina designed the study and assisted with writing the article. Dr Valentina S Ostapenko designed the study, collected the data, and assisted with writing the article. Dr Natalia V Sharashkina collected the data and assisted with writing the article. Dr Elen A Mkhitaryan collected the data and assisted with writing the article. Dr Julia S Onuchina collected the data and assisted with writing the article. Sergei N Lysenkov was responsible for the statistical design of the study and for carrying out the statistical analysis. Prof Nikolai N Yakhno designed the study and assisted with writing the article. Dr Yan Press designed the study and wrote the article. All authors contributed toward data analysis, drafting and critically revising the paper and agree to be accountable for all aspects of the work.
Disclosure
The authors report no conflicts of interest in this work.
References
Russian Federation Federal State Statistic Service [webpage on the Internet]. Available from: http://www.gks.ru/wps/wcm/connect/rosstat_main/rosstat/en/figures/population. Accessed September 25, 2017. | ||
Federal Service of State Statistics [database on the Internet]. Available from: http://cbsd.gks.ru/#. Accessed September 25, 2017. | ||
Weber P, Meluzinova H, Matejovska-Kubesova H, et al. Geriatric giants – contemporary occurrence in 12,210 in-patients. Bratisl Lek Listy. 2015;116(7):408–416. | ||
Noguchi N, Blyth FM, Waite LM, et al. Prevalence of the geriatric syndromes and frailty in older men living in the community: the Concord Health and Ageing in Men Project. Australas J Ageing. 2016;35(4):255–261. | ||
Inouye SK, Studenski S, Tinetti ME, Kuchel GA. Geriatric syndromes: clinical, research, and policy implications of a core geriatric concept. J Am Geriatr Soc. 2007;55(5):780–791. | ||
Tinetti ME, Inouye SK, Gill TM, Doucette JT. Shared risk factors for falls, incontinence, and functional dependence. Unifying the approach to geriatric syndromes. JAMA. 1995;273(17):1348–1353. | ||
Senn N, Monod S. Development of a comprehensive approach for the early diagnosis of geriatric syndromes in general practice. Front Med (Lausanne). 2015;2:78. | ||
Rubenstein LZ. Falls in older people: epidemiology, risk factors and strategies for prevention. Age Ageing. 2006;35(suppl 2):ii37–ii41. | ||
Gillespie LD, Robertson MC, Gillespie WJ, et al. Interventions for preventing falls in older people living in the community. Cochrane Database Syst Rev. 2012;(9):Cd007146. | ||
Piccoliori G, Gerolimon E, Abholz HH. Geriatric assessment in general practice using a screening instrument: is it worth the effort? Results of a South Tyrol Study. Age Ageing. 2008;37(6):647–652. | ||
Lucchetti G, Granero AL. Use of comprehensive geriatric assessment in general practice: results from the “Senta Pua” project in Brazil. Eur J Gen Pract. 2011;17(1):20–27. | ||
Zakharov VV. All-Russian Research Program of Epidemiology and treatment of cognitive disorders in old age (“Prometheus”). Neurol J. 2006;11(3):27–32. | ||
Kornilova MV. Quality of life and social risks of the elderly. Mod Res Soc Prob. 2011;3:13–17. | ||
Demin AV. Peculiarities of postural instability in elderly and senile people. J Med Biol Res. 2013;2:13–19. | ||
Safonova YA, Zotkin EG. The syndrome of falls in the elderly. Adv Gerontol. 2016;29(2):342–346. | ||
Gurina NA, Frolova EV, Degryse JM. A roadmap of aging in Russia: the prevalence of frailty in community-dwelling older adults in the St Petersburg district – the “Crystal” study. J Am Geriatr Soc. 2011;59(6):980–988. | ||
Tkacheva ON, Runikhina NK, Ostapenko VS, et al. Validation of the questionnaire for screening frailty. Adv Gerontol. 2017;30(2):236–242. | ||
Guigoz Y, Vellas B, Garry PJ. Assessing the nutritional status of the elderly: the Mini Nutritional Assessment as part of the geriatric evaluation. Nutr Rev. 1996;54(1 pt 2):S59–S65. | ||
Sheikh JI, Yesavage JA. Geriatric Depression Scale (GDS) recent evidence and development of a shorter version. In: Brink TL, editor. Clinical Gerontology: A Guide to Assessment and Intervention. New York: The Haworth Press; 1986:165–173. | ||
Mathias S, Nayak US, Isaacs B. Balance in elderly patients: the “get-up and go” test. Arch Phys Med Rehabil. 1986;67(6):387–389. | ||
Mahoney FI, Barthel DW. Functional evaluation: the Barthel Index. Md State Med J. 1965;14:61–65. | ||
Lawton MP. Scales to measure competence in everyday activities. Psychopharmacol Bull. 1988;24(4):609–614. | ||
Cohen ME, Marino RJ. The tools of disability outcomes research functional status measures. Arch Phys Med Rehabil. 2000;81(12 suppl 2):S21–S29. | ||
Graf C. The Lawton instrumental activities of daily living (IADL) scale. Medsurg Nurs. 2008;17(5):343–344. | ||
Shumway-Cook A, Brauer S, Woollacott M. Predicting the probability for falls in community-dwelling older adults using the Timed Up & Go Test. Phys Ther. 2000;80(9):896–903. | ||
Pamoukdjian F, Paillaud E, Zelek L, et al. Measurement of gait speed in older adults to identify complications associated with frailty: a systematic review. J Geriatr Oncol. 2015;6(6):484–496. | ||
Maki BE, Holliday PJ, Topper AK. A prospective study of postural balance and risk of falling in an ambulatory and independent elderly population. J Gerontol. 1994;49(2):M72–M84. | ||
Guigoz Y. The Mini Nutritional Assessment (MNA) review of the literature – what does it tell us? J Nutr Health Aging. 2006;10(6):466–485. Discussion 485–467. | ||
Folstein MF, Folstein SE, McHugh PR. “Mini-mental state”. A practical method for grading the cognitive state of patients for the clinician. J Psychiatr Res. 1975;12(3):189–198. | ||
Tombaugh TN, McIntyre NJ. The mini-mental state examination: a comprehensive review. J Am Geriatr Soc. 1992;40(9):922–935. | ||
Tsoi KK, Chan JY, Hirai HW, Wong SY, Kwok TC. Cognitive tests to detect dementia: a systematic review and meta-analysis. JAMA Intern Med. 2015;175(9):1450–1458. | ||
Huntzinger JA, Rosse RB, Schwartz BL, Ross LA, Deutsch SI. Clock drawing in the screening assessment of cognitive impairment in an ambulatory care setting: a preliminary report. Gen Hosp Psychiatry. 1992;14(2):142–144. | ||
Sunderland T, Hill JL, Mellow AM, et al. Clock drawing in Alzheimer’s disease. A novel measure of dementia severity. J Am Geriatr Soc. 1989;37(8):725–729. | ||
Wancata J, Alexandrowicz R, Marquart B, Weiss M, Friedrich F. The criterion validity of the Geriatric Depression Scale: a systematic review. Acta Psychiatr Scand. 2006;114(6):398–410. | ||
Greenberg SA. How to try this: the Geriatric Depression Scale: short form. Am J Nurs. 2007;107(10):60–69. quiz 69–70. | ||
Guigoz Y, Lauque S, Vellas BJ. Identifying the elderly at risk for malnutrition. The Mini Nutritional Assessment. Clin Geriatr Med. 2002;18(4):737–757. | ||
Freeman EE, Roy-Gagnon MH, Samson E, et al. The global burden of visual difficulty in low, middle, and high income countries. PLoS One. 2013;8(5):e63315. | ||
Desai M, Pratt LA, Lentzner H, Robinson KN. Trends in vision and hearing among older Americans. Aging Trends. 2001;(2):1–8. | ||
Guthrie DM, Declercq A, Finne-Soveri H, Fries BE, Hirdes JP. The health and well-being of older adults with dual sensory impairment (DSI) in four countries. PLoS One. 2016;11(5):e0155073. | ||
Verma SK, Willetts JL, Corns HL, Marucci-Wellman HR, Lombardi DA, Courtney TK. Falls and fall-related injuries among community-dwelling adults in the United States. PLoS One. 2016;11(3):e0150939. | ||
Vereeck L, Wuyts F, Truijen S, Van de Heyning P. Clinical assessment of balance: normative data, and gender and age effects. Int J Audiol. 2008;47(2):67–75. | ||
Vaughan L, Corbin AL, Goveas JS. Depression and frailty in later life: a systematic review. Clin Interv Aging. 2015;10:1947–1958. | ||
Moyer VA. Screening for cognitive impairment in older adults: U.S. Preventive Services Task Force recommendation statement. Ann Intern Med. 2014;160(11):791–797. | ||
Carlson C, Merel SE, Yukawa M. Geriatric syndromes and geriatric assessment for the generalist. Med Clin North Am. 2015;99(2):263–279. | ||
He W, Muenchrath MN, Kowal P; U.S. Census Bureau. Shades of Gray: A Cross-Country Study of Health and Well-Being of the Older Populations in SAGE Countries, 2007–2010. Washington, DC: U.S. Government Printing Office; 2012. | ||
Reuben DB, Hirsch SH, Chernoff JC, et al. Project Safety Net: a health screening outreach and assessment program. Gerontologist. 1993;33(4):557–560. |
 © 2018 The Author(s). This work is published and licensed by Dove Medical Press Limited. The full terms of this license are available at https://www.dovepress.com/terms.php and incorporate the Creative Commons Attribution - Non Commercial (unported, v3.0) License.
By accessing the work you hereby accept the Terms. Non-commercial uses of the work are permitted without any further permission from Dove Medical Press Limited, provided the work is properly attributed. For permission for commercial use of this work, please see paragraphs 4.2 and 5 of our Terms.
© 2018 The Author(s). This work is published and licensed by Dove Medical Press Limited. The full terms of this license are available at https://www.dovepress.com/terms.php and incorporate the Creative Commons Attribution - Non Commercial (unported, v3.0) License.
By accessing the work you hereby accept the Terms. Non-commercial uses of the work are permitted without any further permission from Dove Medical Press Limited, provided the work is properly attributed. For permission for commercial use of this work, please see paragraphs 4.2 and 5 of our Terms.