Back to Journals » Clinical Epidemiology » Volume 12
Prevalence of Congenital Hemolytic Disorders in Denmark, 2000–2016
Authors Hansen DL ![]() , Glenthøj A
, Glenthøj A ![]() , Möller S
, Möller S ![]() , Biemond BJ, Andersen K
, Biemond BJ, Andersen K ![]() , Gaist D
, Gaist D ![]() , Petersen J
, Petersen J ![]() , Frederiksen H
, Frederiksen H ![]()
Received 18 February 2020
Accepted for publication 7 April 2020
Published 21 May 2020 Volume 2020:12 Pages 485—495
DOI https://doi.org/10.2147/CLEP.S250251
Checked for plagiarism Yes
Review by Single anonymous peer review
Peer reviewer comments 2
Editor who approved publication: Dr Eyal Cohen
Dennis Lund Hansen,1,2 Andreas Glenthøj,3 Sören Möller,1,4 Bart J Biemond,5 Kjeld Andersen,1,6 David Gaist,1,7 Jesper Petersen,3 Henrik Frederiksen1,2
1Department of Clinical Research, University of Southern Denmark, Odense, Denmark; 2Department of Hematology, Odense University Hospital, Odense, Denmark; 3Department of Hematology, Center for Hemoglobinopathies, Herlev and Gentofte Hospital, Herlev, Denmark; 4OPEN, Odense University Hospital, Odense, Denmark; 5Department of Hematology, Amsterdam University Medical Centre’s, Amsterdam, Netherlands; 6Department of Mental Health - Odense, Region of Southern Denmark, Odense, Denmark; 7Neurology Research Unit, Department of Neurology, Odense University Hospital, Odense, Denmark
Correspondence: Dennis Lund Hansen Email [email protected]
Background: Congenital red blood cell (RBC) disorders, such as hemoglobinopathies, are frequent worldwide but with large geographical variation. Growing migration has increased the number of patients with RBC disorders in formerly low prevalence countries, eg, Denmark. However, accurate prevalences are unknown.
Methods: Patients with a registered diagnosis of congenital hemolysis in the Danish National Patient Register between 1977 and 2016 were linked to a national laboratory database of RBC disorders and the Danish civil registration system. We calculate annual age- and sex-specific prevalences of the congenital hemolytic disorders from 2000 to 2016.
Results: Prevalences of all subtypes of congenital hemolytic disorders increased during the study period. The prevalence of hereditary spherocytosis increased 1.73 times between 2000 and 2015, from 10.2/105 persons to 17.7/105 persons. Alpha thalassemia trait had a prevalence of 0.5/105 persons in 2000, but increased 41 times to 19.2/105 persons in 2015. Beta thalassemia minor increased eightfold from 4.5/105 persons in 2000 to 34.9/105 persons in 2015. Likewise, sickle cell trait increased 11 times from 0.7/105 persons in 2000 to 8.1/105 persons in 2015, whereas sickle cell disease increased from 0.5/105 persons to 2.7/105 persons in 2015, a fivefold increase.
Conclusion: The prevalence of congenital RBC disorders in Denmark is increasing. The hemoglobinopathy traits now have prevalences as high as hereditary spherocytosis. These estimates of congenital hemolytic disorders in Denmark emphasize that inborn hemoglobin disorders are a public health concern, even in some formerly low prevalence countries.
Keywords: hemolytic anemia, thalassemia, sickle cell disease, hereditary spherocytosis, hemoglobinopathies, sickle cell anemia
Introduction
The congenital red blood cell (RBC) disorders impose a great burden on health-care systems around the world.1–6 Many hemoglobinopathies, like sickle cell disease and thalassemias, have traditionally been considered endemic in malaria-belt-countries.3–8 Some endemic countries have established prenatal screening programs and can now observe decreasing prevalence.1,3,5,9,10 However, with growing migration, prevalences are changing in several countries, and hemoglobinopathies are now an increasing health consideration in the formerly low prevalence countries.1–9,11,12
Published prevalence measures are mainly from high prevalence countries.1,2,5,8,9 Another limitation in existing knowledge is that mainly birth-prevalences are investigated, which is insufficient in low prevalence countries due to the unmeasured contribution from migration.2,3,5,8
Further, knowledge about prevalences of most of the hereditary RBC disorders in Europe is scarce.2,6,9 Even hereditary spherocytosis, which is considered nearly endemic in northern Europe, shows highly variable estimates of prevalence ranging from 0.02% to 1% of the population.9,12–15
To advance knowledge for health-care planning and research, we described the changes in prevalence of congenital hemolytic disorders in Denmark. We also assessed the feasibility of using a combination of routine administrative data and laboratory data sources to define congenital hemolytic diseases accurately.
Methods
The study was based on Danish health registries with universal coverage of all Danish hospitals and with complete follow-up of individual patients.16 Routinely collected administrative health data was linked at the personal level with information concerning migration, sex, country of origin, age and vital status.17–19 We included information from the Danish National Patient Register (the Patient Register) and from the Danish Civil Registration. The diagnosis codes for identification of congenital hemolytic disorders were previously validated in a Danish register setting.20
We retrieved patients with congenital hemolytic disorders from the Patient Register, based on predefined diagnosis codes (Supplementary Table 1). Furthermore, patients were also identified from a National laboratory database of RBC disorders from the Department of Hematology, Herlev and Gentofte Hospital.20 We used stratified census data provided by Statistics Denmark for calculations of prevalences.17 Prevalences were calculated for the period 2000 to 2016.
All analyses were preplanned in the protocol, and the principles suggested by the reporting of studies conducted using observational routinely-collected health Data (RECORD) Statement was used to guide the reporting of results.21
Data
The Patient Register was our source register.19 The register contains data on diagnoses from all Danish hospitals made by the attending physicians, coded according to International Classification of Diseases, 8th revision, (ICD-8) 1977–1993 and 10th revision ICD-10 thereafter. The registry includes data of all hospitalizations since 1977, and from 1994, out-patient visits to hospital specialist clinics were also registered. Hospital treatment is free of charge in Denmark, and the limited numbers of private hospitals do not engage in management of patients with blood diseases.16
The hemolysis laboratory database, Department of Hematology, Herlev and Gentofte Hospital, contains laboratory confirmed diagnoses of red blood cell hemoglobinopathy, enzymopathy, and membranopathy.20 The database was established in 1993 and conducted all diagnostic tests for these disorders in Denmark until 2012 and approximately 85–90% of all positive tests in Denmark after 2012; the number of tests performed annually has more than quadrupled from 2000 to 2016 (unpublished data). The laboratory database thereby provides information on trait conditions, which are often not captured through the Patient Register.20
Danish Hemolysis Cohort was created from the combined information from the DNPR and the hemolysis laboratory database. Patients were included from the Patient Register if they were registered with at least one diagnosis of hemolysis or immune-mediated thrombocytopenia, January 1977 through 2016 (Supplementary Table 1), or with a laboratory diagnosis of hemolysis in the hemolysis database, 1993 or later.
The Danish Civil Registration System uniquely identifies every person living in Denmark through the Civil Personal Register number (CPR). The number is used as a unique and permanent identifier through all administrative and governmental registers.18 The CPR number is assigned each inhabitant in Denmark at immigration or birth. Using this allowed us to link individual-level information about sex, birth date, migration, ethnicity, health, and death.18 Ethnicity is registered as Danish origin, immigrant, and descendant, the latter being those born in Denmark where both parents are registered as immigrants.17 Statistics Denmark provides annually updated stratified census information.17
Inclusion and Exclusion Criteria
Patients in the Danish Hemolysis Cohort were included in this study if they had a defined diagnosis of a congenital RBC disorder. As a laboratory test is the gold standard, patients were first included from the Hemolysis Laboratory Database. The highly specific laboratory diagnoses of hemoglobinopathies and enzymopathies were grouped in ICD compatible groups (see Supplementary Table 1). Patients who were not registered in the laboratory database were subsequently assessed for a hospital-based diagnosis of a congenital hemolytic disorder in the Patient Register. The specific register diagnoses have previously been found to be valid15 with positive predictive values (PPV) of more than 90% for hemoglobinopathies in general as well as for specific thalassemic diseases. PPVs for sickle cell disease and hereditary spherocytosis on the other hand, range from 71% to 81%.20 PPVs for the abovementioned diagnoses were even higher after exclusion of patients that had only been coded with RBC at surgical departments.20 To improve the PPV in our study, we therefore only included patients with diagnoses assigned by departments of hematology, pediatrics, and internal medicine. Patients in our study who did not have a laboratory diagnosis and were registered with more than one hemolytic diagnosis in the Patients Register were assigned the diagnosis with the highest PPV. Inclusion was only based on laboratory diagnosis or diagnosis registered in the Patient Register, since detailed information from individual medical records was not available for this study. Follow-up started from date of diagnosis of the most reliable hemolysis diagnosis. Patients with an acquired hemolysis diagnosis without a concomitant congenital hemolytic disorder were excluded. This procedure defined our main model and is illustrated in Supplementary Figure 1.
Statistics
All data management and analysis were performed using Stata 15.1.22 We tabulated general characteristics of the included patients and diagnostic groups: proportion of women, splenectomized, ethnic origin, and median age at diagnosis.
Prevalence of the disorders per 100,000 persons was calculated as the proportion of patients with the disease, alive on January 1 in the years 2000, 2007 and 2015. The proportion was calculated with 95% confidence intervals using the Clopper–Pearson method.23,24 Strata were sex and age groups <20, 20–50 and >50 years of age. We used strata-specific census data as denominator in all the stratified calculations.17 Overall prevalence was further calculated annually, 2000‒2016. These data were depicted in graphs and formally tested for changes in prevalence over time for each included disorder by estimating prevalence proportion ratios (PPR) from negative binomial regression.24,25 However, if the dispersion parameter in all regressions was indistinguishable from zero, the regressions were simplified to a Poisson regression.24
Assigning the most reliable diagnosis can introduce a survivorship bias in our study, particularly if patients with only an unspecific hemolysis subtype are followed for a long period. To account for this, we employed a sensitivity model. This model used the same inclusion criteria as the main model, but assigned the first registered congenital hemolytic diagnosis in the Patient Register and did not utilize the additional information from the hemolysis laboratory database. The sensitivity model was used to calculate and depict the overall prevalence applying the same approach as the main model. The two models were compared using negative binomial regression or Poisson regressions if dispersions parameters were indistinguishable from zero. The comparison between the two models included possible time interactions.
Approval and Ethics
According to current Danish law, register studies without patient contact, do not require ethical approval. The study was approved by the Danish Data Protection Agency (reference: 17/10885). Sharing of public Danish health data is not allowed according to current legislation.
Results
The population in Denmark increased from 5,330,020 (50.6% women) in 2000 to 5,707,251 (50.3% women) in 2016. In the same period, the proportion of people with Danish origin decreased from 92.9% to 87.7% (Supplementary Figure 2).
We identified 30,520 patients registered with at least one of the defined diagnoses in the Patient Register or the hemolysis laboratory database (Supplementary Table 1).
Following the main model, 10,013 patients could be assigned a diagnosis of a congenital hemolytic disorder (Table 1 and Supplementary Tables 2 −3). The sensitivity model only employing the Patient Register identified 6002 patients (Supplementary Table 2). Basic demographic information is provided in Table 1 and in Supplementary Table 3.
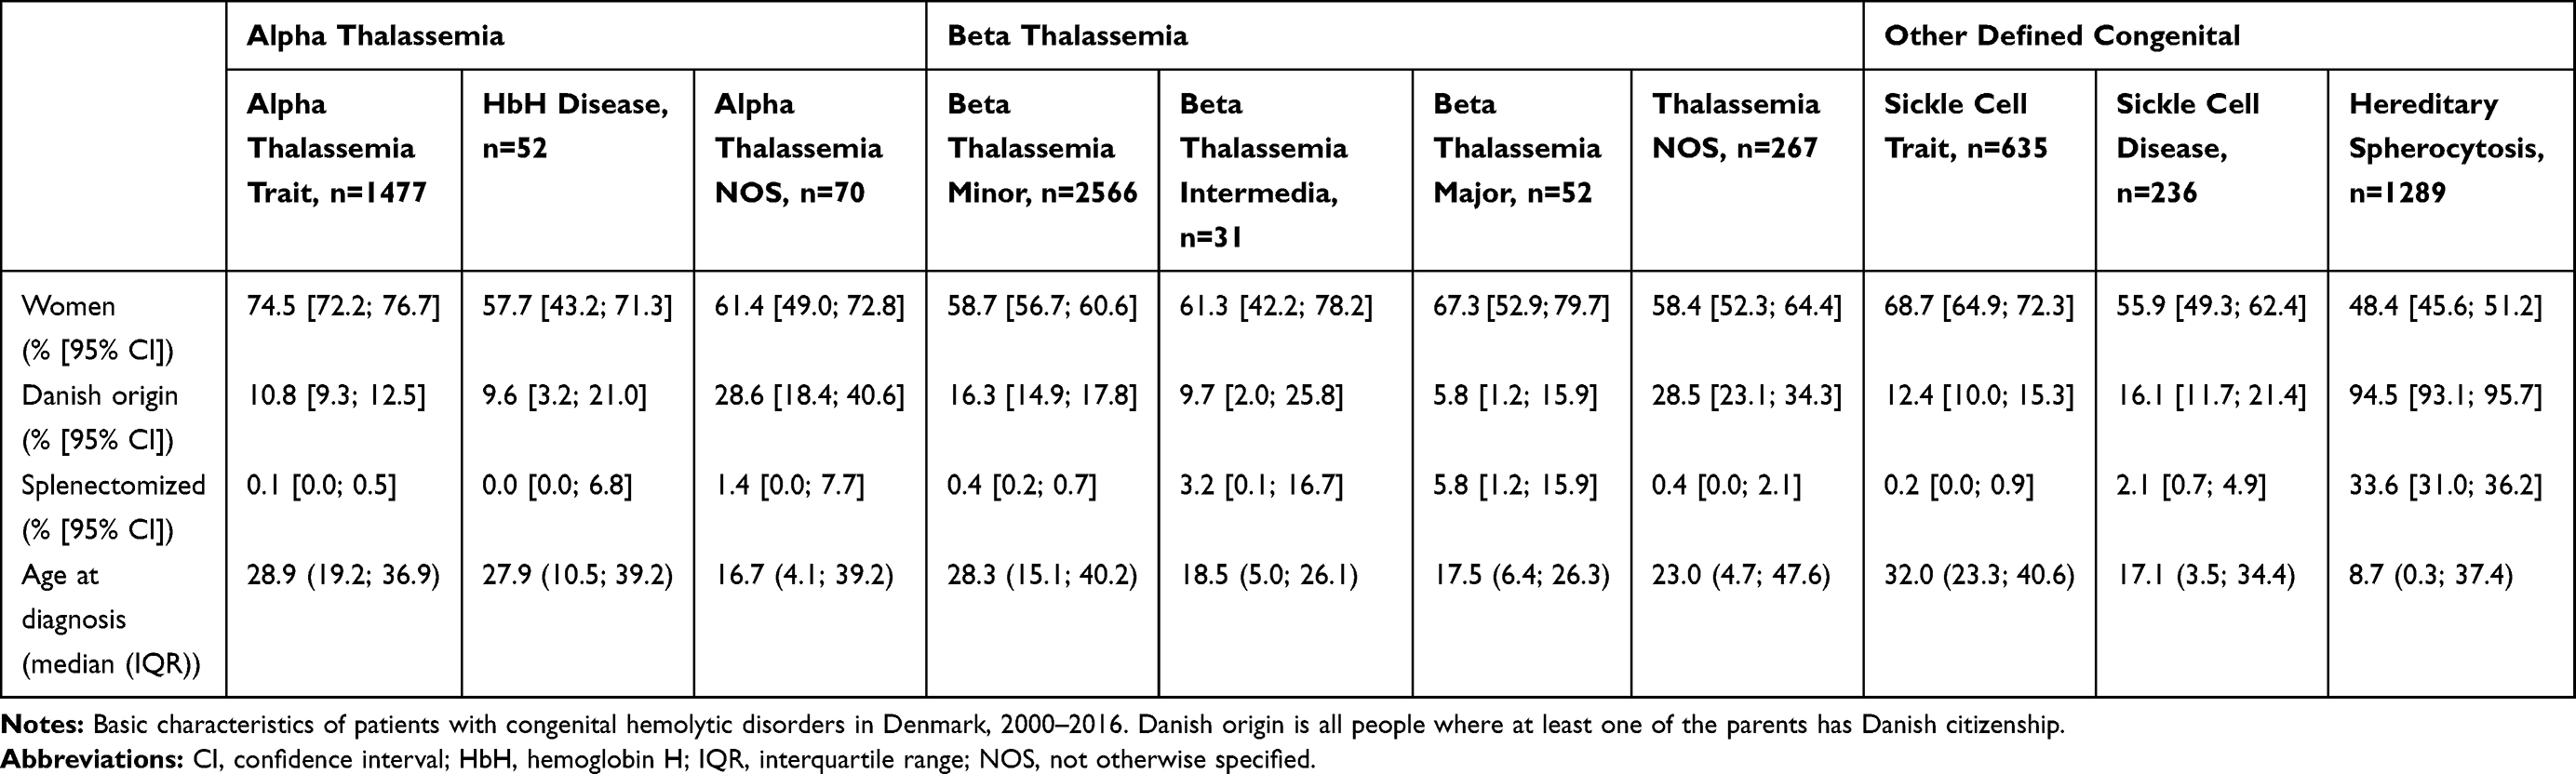 |
Table 1 Characteristics of Patients with Congenital Hemolytic Disorders in Denmark, 2000–2016 |
Prevalence
Prevalence proportions calculated on the 1 January in the years 2000, 2007 and 2015 are presented in Table 2 and Supplementary Table 4. Prevalence proportions increased for all diseases in all groups, except for the diagnosis “congenital hemolysis not otherwise specified (NOS)” (Supplementary Table 4).
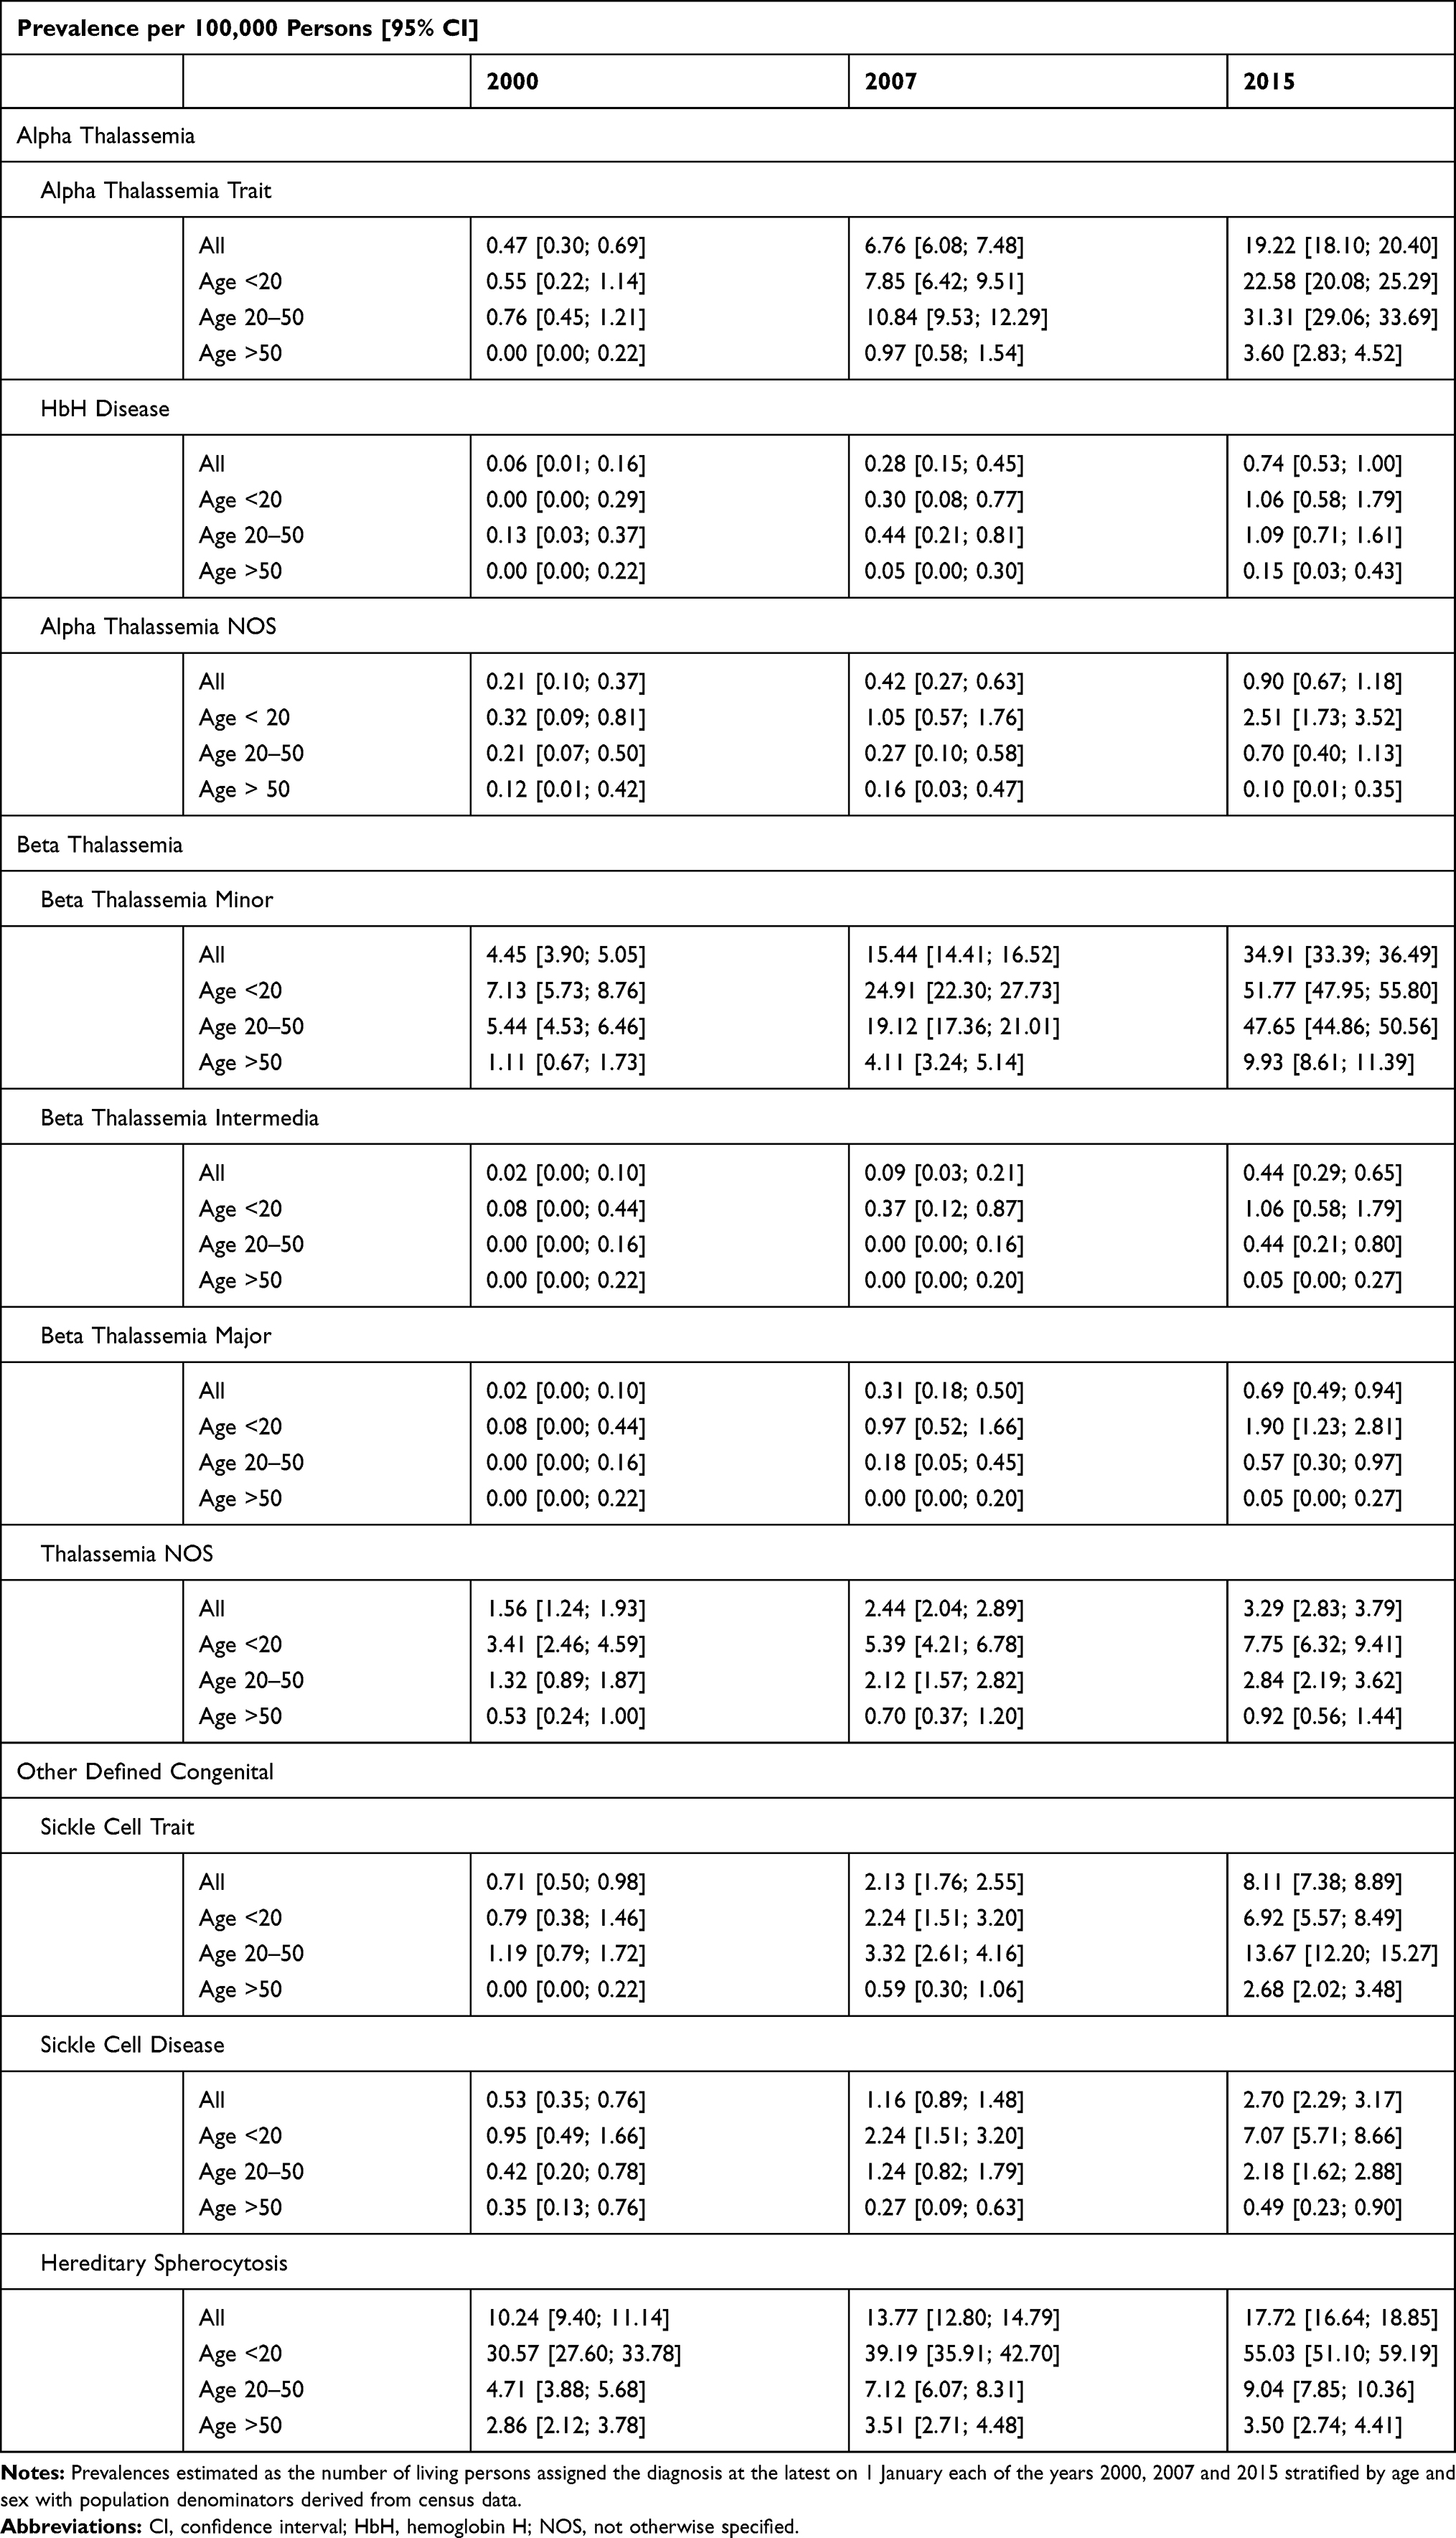 |
Table 2 Prevalence of Congenital Hemolytic Disorders in Denmark in 2000, 2007 and 2015 |
The overall prevalence proportion of congenital hemolysis NOS decreased from 5.8 [95% CI: 5.2; 6.5] per 100,000 persons in 2000, to 5.1 [95% CI: 4.6; 5.8] per 100,000 persons in 2015. The PPR for congenital hemolysis NOS comparing 2000 with 2016 was 0.90 [95% CI: 0.77; 1.05]. (Supplementary Tables 4, 5 and 9, Supplementary Figure 3). Only sickle cell trait and Glucose-6-phosphate deficiency (G6PD) differed significantly in prevalence proportion between sexes (Supplementary Table 5). This difference was most pronounced in G6PD owing to the X-chromosome-linked nature of the disorder.26,27 The prevalence proportion of G6PD was 3.0 [95% CI: 2.4; 3.8] per 100,000 men and 0.6 [95% CI: 0.3; 1.0] per 100,000 women in 2000. The prevalences proportion increased to 6.4 [95% CI: 5.5; 7.5] per 100,000 men and 2.6 [95% CI: 2.1; 3.3] per 100,000 women, in 2015.
Compared with year 2000, the prevalences of alpha-thalassemia trait in 2016 were 41 times higher and beta-thalassemia minor prevalence proportion increased nine-fold in the same period (Supplementary Tables 6 and 7). Similarly, the prevalence of sickle cell trait was 13 times higher in 2016, compared with 2000 (Supplementary Table 8).
In 2000, the prevalence proportion of persons with alpha-thalassemia trait was 0.5 [95% CI: 0.3; 0.7] per 100,000 and 4.5 [95% CI: 3.9; 5.1] per 100,000 with beta-thalassemia minor. In 2015 this had increased to 19.2 [95% CI: 18.1; 20.4] per 100,000 persons for alpha-thalassemia trait and 34.9 [95% CI: 33.4; 36.5] per 100,000 persons for beta-thalassemia minor (Table 2).
Hereditary spherocytosis prevalence increased 1.7 times from 10.2 [95% CI: 9.4; 11.1] per 100,000 in 2000 to 17.7 [95% CI: 16.6; 18.9] per 100,000 in 2015 (Table 2, Figure 3, Supplementary Table 8).
The changes in prevalences were tested by Poisson regression and not binomial regression, as there were no signs of over dispersion in any regression models (Supplementary Tables 6–9).
Sensitivity Analysis
The annual prevalences for the years 2000 to 2016 by the main model and the sensitivity model are depicted in Figure 1–3 and Supplementary Figures 3–8. The comparison of annual prevalences from the two models is restricted to conditions included in both models. The trait conditions and hemoglobin H disease were not included in the sensitivity analyses, as they were only identified through laboratory registrations, ie, only included in one of the models.
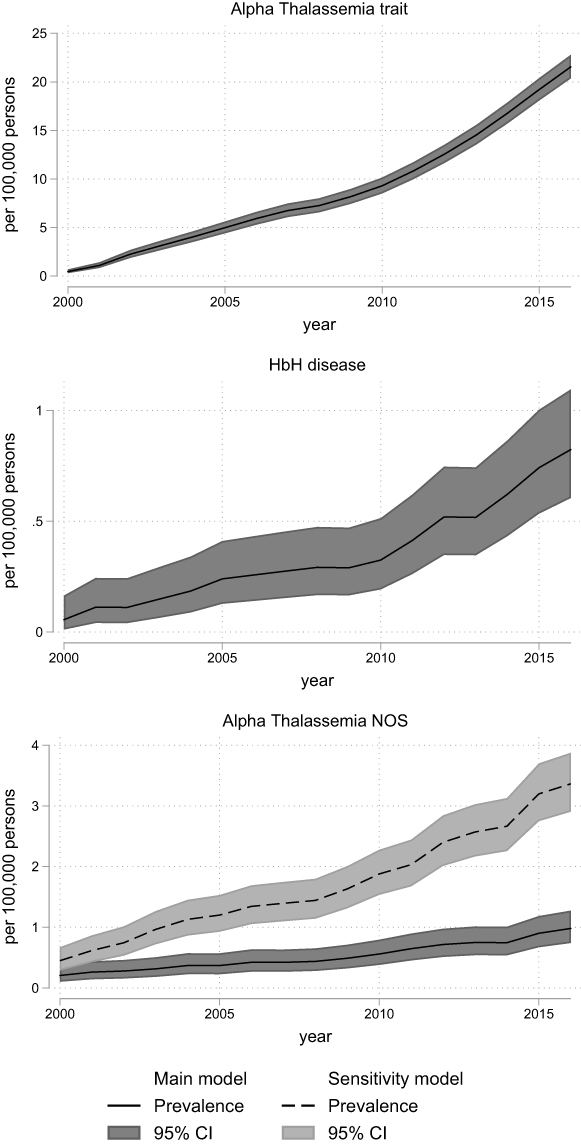 |
Figure 1 Prevalence of alpha thalassemic disorders in Denmark, 2000–2016, according to models for classification of diagnoses (main model vs sensitivity model). The overall prevalence with 95% confidence intervals for alpha thalassemic diseases calculated on 1 January each year with census data as denominator. The 95% confidence intervals are calculated using the Clopper–Pearson method. Alpha-Thalassemia trait and HbH disease w not defined in the sensitivity model they do not have a separate ICD 8 or 10 code. Abbreviations: CI, confidence interval; HbH, hemoglobin H; NOS, not otherwise specified. |
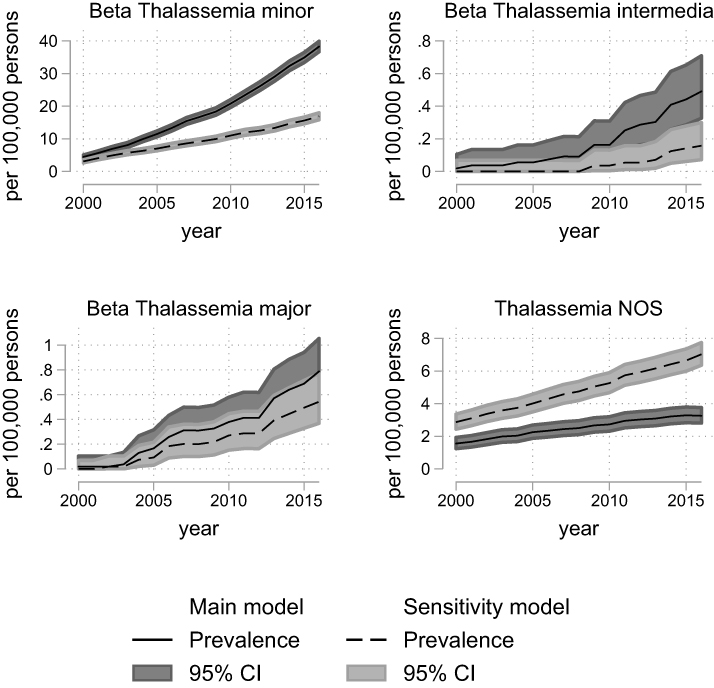 |
Figure 2 Prevalence of beta thalassemic disorders in Denmark, 2000–2016, according to models for classification of diagnoses (main model vs sensitivity model). The overall prevalence with 95% confidence intervals for beta-thalassemic diseases calculated on 1 January each year with census data as denominator. The 95% confidence intervals are calculated using the Clopper–Pearson method. Abbreviations: CI, confidence interval; NOS, not otherwise specified. |
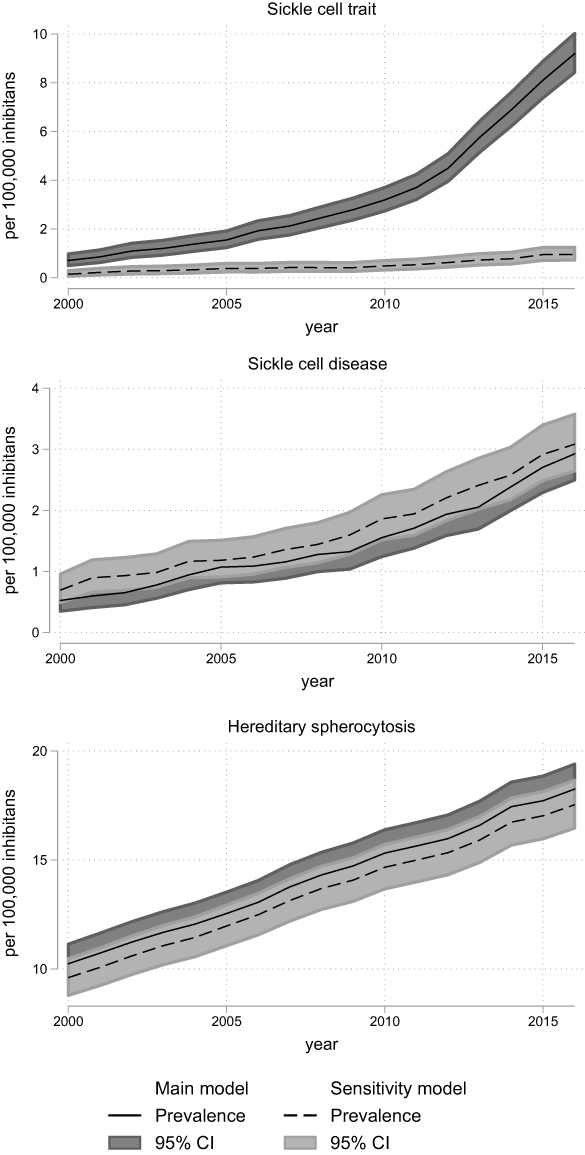 |
Figure 3 Prevalence of sickle cell disorders and hereditary spherocytosis in Denmark, 2000–2016, according to models for classification of diagnoses (main model vs sensitivity model). The overall prevalence with 95% confidence intervals for sickle cell disorders and hereditary spherocytosis calculated on 1 January each year with census data as denominator. The 95% confidence intervals are calculated using the Clopper–Pearson method. Abbreviation: CI, confidence interval. |
There were no signs of over dispersion, and the Poisson regression comparing the sensitivity and main model confirmed that the sensitivity model captured a higher number of alpha-thalassemia NOS, thalassemia NOS, sickle cell disease, and congenital hemolysis NOS (Supplementary Figures 3–7). For the remaining diseases, the sensitivity model was either not defined, or the main model had a higher capture (Supplementary Figures 3–7).
Discussion
Using both hospital diagnoses and laboratory data, we report on prevalences of congenital hemolytic diseases in Denmark, 2000–2016. When including laboratory data, the prevalences were overall higher, and more specifically defined subtypes were available.
Prevalence
All specific hereditary hemolytic disorders increased in prevalence between 2000 and 2015. This is true for all the defined strata, but was most pronounced among those aged <20 years and 20–50 years. A less marked increase of prevalence was noticed in the group above 50 years which can be attributed to both the predominant immigration of younger people and lack of thorough diagnostics after reproductive age. Cohort attrition due to impaired survival (ie, affected patients die early and therefore do not contribute to the prevalence in the older age groups) is a less universal explanation, as some of the disorders has a good prognosis.
The prevalence of many of the diseases or trait conditions increased considerably during the study period. Hereditary spherocytosis now has an overall prevalence of 17.7/100,000 persons, which is more than twice the prevalence of cystic fibrosis, a hereditary disorder considered common in northern Europe.28 Overall, the prevalence proportion of hereditary spherocytosis increased from 10.2/100,000 in 2000 to 17.7/100,000 in 2015. Especially the age group below 20 years had a high absolute increase in prevalence, reaching 55.0/100,000 in 2015. As the hereditary spherocytosis, in general, is considered rare and nearly endemic to northern Europe, the increase is probably driven by improved and intensified diagnostics, rather than a true increase in population prevalence.9,12,29 The prevalence of hereditary spherocytosis continues to rise, probably reflecting that in this group of congenital RBC disorders, a group of patients remain undiagnosed in the population.
Interestingly, our hereditary spherocytosis prevalence in the youngest age group now approaches the predicted value of 1/5000 to 1/2000, even though these estimates of overall prevalence derive from cross-sectional studies of healthy blood donors.12–15,30 However, hereditary spherocytosis in the blood donors is estimated through the prevalence with increased osmotic RBC fragility, which may not be accurate.14,15,29,31 Despite these limitations in estimates, our prevalence for the youngest stratum (<20 years) could indicate that the HS prevalence in the population is approximately 1/2000.
Hereditary spherocytosis is still the most prevailing congenital hemolytic disorder in Denmark although it is noteworthy that trait conditions of hemoglobinopathies have become even more prevalent. In 2016, beta-thalassemia minor had an overall prevalence of 34.9/100,000 persons and alpha-thalassemia trait had an overall prevalence of 19.2/100,000 persons. This reflects a close to nine-fold increase for beta-thalassemia minor and a 46 times increase for alpha-thalassemia trait since 2000 (Supplementary Tables 6 and 7). This increase is probably driven by combinations of immigration, increased rate of children born with the condition, and increased diagnostic intensity. While hereditary spherocytosis increased steadily during the study (Figure 3), the prevalence of all other disorders increased steeply starting in 2010. This probably reflects an increasing awareness in clinicians about the use of conclusive laboratory tests. We suspect that the same explains the increase in hemoglobinopathies prevalence which is much higher than the increase in immigration-rate. While the proportion of inhabitants with non-Danish origin only doubled from 2000 to 2016, sickle cell trait prevalence increased fourfold during 2000–2009 but 13 times from 2000 to 2016. This marked increase cannot be explained by migration only, but must derive from a change in clinical practice (Figure 3 and Supplementary Table 8). This change in clinical practice would most likely be an increased use of conclusive laboratory testing (eg HPLC and gene test), this notion can find some support in the increased number of tests requested at the Hemolysis laboratory. This increased highly specific diagnostics would also explain the decrease in the prevalence of unspecified congenital hemolytic diagnosis, as many patients would now get a specific diagnosis.
Sensitivity Analysis
In our previous validation study, it was noted that a hemolytic diagnosis made by non-medical departments conferred a low PPV.20 We therefore excluded non-medical departments, although we thereby excluded some patients. This will have the largest impact on the sensitivity model, as this model only takes the ICD-8 and ICD-10 codes from hospitals into account, and does not include supporting data from the laboratory analyses.
We observed prevalence differences that reflected the lower numbers of possible diagnoses included in the sensitivity model; consequently, more patients were categorized as congenital hemolysis NOS. This supports the assumption that at the time of referral patients are often assigned an unspecified diagnosis code of congenital hemolysis which is later changed to the causal diagnosis, when the diagnostic workup is complete.
We compared the gap in annual prevalence between the two models, for all diagnoses represented in both the main model and sensitivity model (Supplementary Table 2) Large differences between the models were therefore only seen in diseases where laboratory data added a significant number of diagnosed patients, ie hemoglobinopathies (Figure 1–3).
Limitations and Strengths
As our analyses start in 2000, the number of patients with incomplete follow-up due to lack of capture in the Patient Register, which opened in 1977, is probably negligible. The hemolytic laboratory database has been operational since 1993, and has offered complete coverage from 2000. Consequently, patients with trait conditions are not captured systematically from 1993 to 1999. This may also result in more unspecified congenital hemolysis diagnoses, especially in the earliest study period, or among the older population diagnosed before the systematic registration in the hemolytic laboratory database.
Our conservative approach of only including diagnoses from departments of hematology, pediatrics and internal medicine, to get the highest PPV20 carries a risk of underestimating the prevalence. However, since all hospital treatment is free of charge in Denmark it seems unlikely that this restriction substantially affected our results.16
Conclusion and Perspective
We present contemporary results of the prevalences of congenital hemolytic disorders in Denmark during 2000–2016, showing a very large increase in the majority of the disorders. Further, we show that combined data sources of both hospital registrations and laboratory results are necessary to capture patients.
Our results of the increasing prevalence of congenital hemolytic disorders in Denmark support the theory that hemoglobinopathies can no longer be considered endemic diseases only in the developing world.1,2,7–9 The prevalence of hemoglobinopathies traits implies that with the subsequent genetic mixing and shifts in the Hardy-Weinberg equilibrium, the prevalences of the more severe phenotypes of hemoglobinopathies are likely to increase.
This knowledge emphasizes the relevance of predefined programs for pre-natal screening and genetic counselling.10,11 General population screening for sickle cell disease is not implemented in Denmark, since the prevalence is still low here. However, the current Danish strategy of a pre-natal screening in high-risk women is justified and is in accordance with WHO recommendations.3,11,32,33
Acknowledgments
The authors would like to thank Cathrine Fox Maule at Statistics Denmark for help with defining and hosting data. The authors also thank the University of Southern Denmark, The Region of Southern Denmark, Alexion Pharma Nordic AB, The A. P. Møller and Chastine Mc-Kinney Møller Foundation, and Novartis Healthcare for study grants.
Author Contributions
DLH, HF, DG, and KA conceived the study. AG and JP provided laboratory data and insight into laboratory diagnostics. All authors took part in planning the analyses. DLH performed the analyses, aided by SM. DLH wrote first draft, and all authors participated in writing subsequent drafts. All authors made substantial contributions to conception and design, acquisition of data, or analysis and interpretation of data; took part in drafting the article or revising it critically for important intellectual content; gave final approval of the version to be published; and agreed to be accountable for all aspects of the work.
Funding
This work is part of a PhD fellowship (DLH) supported by the University of Southern Denmark (SDUSF-2015-202-(459)), The Region of Southern Denmark (16/13496), and study grants from Alexion Pharma Nordic AB, The A. P. Møller and Chastine Mc-Kinney Møller Foundation (17-L-0334), and Novartis Healthcare.
Disclosure
DLH declares that, as part of the funding for the PhD fellowship, this study received funding from the University of Southern Denmark, The Region of Southern Denmark, and study grants from Alexion Pharma Nordic AB, Novartis Healthcare, and The A. P. Møller and Chastine Mc-Kinney Møller Foundation. AG reports personal fees from Agios, Bluebird, Celgene, Novartis, and Novo Nordisk; grants from Alexion, outside the submitted work. The authors report no other conflicts of interest in this work.
References
1. Weatherall DJ, Clegg JB. Inherited haemoglobin disorders: an increasing global health problem. Bull World Health Organ. 2001;79(8):704–712.
2. Aguilar Martinez P, Angastiniotis M, Eleftheriou A, et al. Haemoglobinopathies in Europe: health & migration policy perspectives. Orphanet J Rare Dis. 2014;9(1):97. doi:10.1186/1750-1172-9-97
3. Modell B, Darlison M. Global epidemiology of haemoglobin disorders and derived service indicators. Bull World Health Organ. 2008;2008(6):480–487. doi:10.2471/BLT.06.036673
4. Taher AT, Weatherall DJ, Cappellini MD. Thalassaemia. Lancet (London, England). 2018;391(10116):155–167. doi:10.1016/S0140-6736(17)31822-6
5. Piel FB, Steinberg MH, Rees DC, Longo DL. Sickle cell disease. N Engl J Med. 2017;376(16):1561–1573. doi:10.1056/NEJMra1510865
6. Kato GJ, Piel FB, Reid CD, et al. Sickle cell disease. Nat Rev Dis Primers. 2018;4:18010.
7. Vichinsky EP. Changing patterns of thalassemia worldwide. Ann N Y Acad Sci. 2005;1054(1):18–24. doi:10.1196/annals.1345.003
8. Modell B, Darlison M, Birgens H, et al. Epidemiology of haemoglobin disorders in Europe: an overview. Scand J Clin Lab Invest. 2007;67(1):39–69. doi:10.1080/00365510601046557
9. Gulbis B, Eleftheriou A, Angastiniotis M, et al. Epidemiology of rare anaemias in Europe. Adv Exp Med Biol. 2010;686:375–396.
10. Weil LG, Charlton MR, Coppinger C, Daniel Y, Streetly A. Sickle cell disease and thalassaemia antenatal screening programme in England over 10 years: a review from 2007/2008 to 2016/2017. J Clin Pathol. 2019;73(4):183–90.
11. Ballardini E, Tarocco A, Marsella M, et al. Universal neonatal screening for sickle cell disease and other haemoglobinopathies in Ferrara, Italy. Blood Transfus. 2013;11(2):245–249. doi:10.2450/2012.0030-12
12. Perrotta S, Gallagher PG, Mohandas N. Hereditary spherocytosis. Lancet (London, England). 2008;372(9647):1411–1426. doi:10.1016/S0140-6736(08)61588-3
13. Eber SW, Pekrun A, Neufeldt A, Schroter W. Prevalence of increased osmotic fragility of erythrocytes in German blood donors: screening using a modified glycerol lysis test. Ann Hematol. 1992;64(2):88–92. doi:10.1007/BF01715351
14. Godal HC, Heisto H. High prevalence of increased osmotic fragility of red blood cells among Norwegian blood donors. Scand J Haematol. 1981;27(1):30–34. doi:10.1111/j.1600-0609.1981.tb00448.x
15. Iolascon A, Andolfo I, Russo R. Advances in understanding the pathogenesis of red cell membrane disorders. Br J Haematol. 2019;187(1):13–24. doi:10.1111/bjh.16126
16. Schmidt M, Schmidt SAJ, Adelborg K, et al. The Danish health care system and epidemiological research: from health care contacts to database records. Clin Epidemiol. 2019;11:563–591. doi:10.2147/CLEP.S179083
17. Denmark S Statbank. https://www.statbank.dk/. Published 2018.
18. Schmidt M, Pedersen L, Sorensen HT. The Danish Civil Registration System as a tool in epidemiology. Eur J Epidemiol. 2014;29(8):541–549. doi:10.1007/s10654-014-9930-3
19. Schmidt M, Schmidt SA, Sandegaard JL, Ehrenstein V, Pedersen L, Sorensen HT. The Danish National Patient Registry: a review of content, data quality, and research potential. Clin Epidemiol. 2015;7:449–490. doi:10.2147/CLEP.S91125
20. Hansen DL, Overgaard UM, Pedersen L, Frederiksen H. Positive predictive value of diagnosis coding for hemolytic anemias in the Danish National Patient Register. Clin Epidemiol. 2016;8:241–252. doi:10.2147/CLEP.S93643
21. Benchimol EI, Smeeth L, Guttmann A, et al. The REporting of studies Conducted using Observational Routinely-collected health Data (RECORD) statement. PLoS Med. 2015;12(10):e1001885. doi:10.1371/journal.pmed.1001885
22. StataCorp LP. Stata Statistical Software: Release 15 [Computer Program]. College Station, TX: StataCorp LLC; 2017.
23. Clopper CJ, Pearson ES. The use of confidence or fiducial limits illustrated in the case of the binomial. Biometrika. 1934;26(4):404–413. doi:10.1093/biomet/26.4.404
24. StataCorp. Stata base referecen manual release. 15. Stata Press; 2017.
25. Skov T, Deddens J, Petersen MR, Endahl L. Prevalence proportion ratios: estimation and hypothesis testing. Int J Epidemiol. 1998;27(1):91–95. doi:10.1093/ije/27.1.91
26. Luzzatto L, Arese P, Longo DL. Favism and glucose-6-phosphate dehydrogenase deficiency. N Engl J Med. 2018;378(1):60–71. doi:10.1056/NEJMra1708111
27. Luzzatto L, Nannelli C, Notaro R. Glucose-6-phosphate dehydrogenase deficiency. Hematol Oncol Clin North Am. 2016;30(2):373–393. doi:10.1016/j.hoc.2015.11.006
28. Farrell PM. The prevalence of cystic fibrosis in the European Union. J Cyst Fibros. 2008;7(5):450–453. doi:10.1016/j.jcf.2008.03.007
29. Ciepiela O. Old and new insights into the diagnosis of hereditary spherocytosis. Ann Transl Med. 2018;6(17):339. doi:10.21037/atm.2018.07.35
30. Delhommeau F, Cynober T, Schischmanoff PO, et al. Natural history of hereditary spherocytosis during the first year of life. Blood. 2000;95(2):393–397. doi:10.1182/blood.V95.2.393
31. Eber S, Lux SE. Hereditary spherocytosis–defects in proteins that connect the membrane skeleton to the lipid bilayer. Semin Hematol. 2004;41(2):118–141. doi:10.1053/j.seminhematol.2004.01.002
32. 1Sickle cell anaemia. Agenda item 11.4.
33. Thalassaemia and other haemoglobinopathies. Agenda item 5.2.
 © 2020 The Author(s). This work is published and licensed by Dove Medical Press Limited. The
full terms of this license are available at https://www.dovepress.com/terms
and incorporate the Creative Commons Attribution
- Non Commercial (unported, 3.0) License.
By accessing the work you hereby accept the Terms. Non-commercial uses of the work are permitted
without any further permission from Dove Medical Press Limited, provided the work is properly
attributed. For permission for commercial use of this work, please see paragraphs 4.2 and 5 of our Terms.
© 2020 The Author(s). This work is published and licensed by Dove Medical Press Limited. The
full terms of this license are available at https://www.dovepress.com/terms
and incorporate the Creative Commons Attribution
- Non Commercial (unported, 3.0) License.
By accessing the work you hereby accept the Terms. Non-commercial uses of the work are permitted
without any further permission from Dove Medical Press Limited, provided the work is properly
attributed. For permission for commercial use of this work, please see paragraphs 4.2 and 5 of our Terms.