Back to Journals » Clinical Ophthalmology » Volume 16
Prevalence of Asthenopia and Its Relationship with Electronic Screen Usage During the COVID-19 Pandemic in Jazan, Saudi Arabia: A Cross-Sectional Study
Authors Abuallut I, Qumayi EA, Mohana AJ, Almalki NM, Ghilan ME, Dallak FH ![]() , Mahzari SM
, Mahzari SM ![]() , Makrami A
, Makrami A ![]() , Tawhari A, Ajeebi RE, Bakri SM
, Tawhari A, Ajeebi RE, Bakri SM ![]()
Received 28 July 2022
Accepted for publication 15 September 2022
Published 27 September 2022 Volume 2022:16 Pages 3165—3174
DOI https://doi.org/10.2147/OPTH.S377541
Checked for plagiarism Yes
Review by Single anonymous peer review
Peer reviewer comments 4
Editor who approved publication: Dr Scott Fraser
Ismail Abuallut,1 Elham A Qumayi,2 Azah Jabir Mohana,3 Norah M Almalki,2 Majdah E Ghilan,2 Fatimah H Dallak,2 Sarah Mohammed Mahzari,2 Almoayad Makrami,4 Amal Tawhari,2 Reham Eissa Ajeebi,2 Sultan Mousa Bakri4
1Department of Surgery, Ophthalmology Division, College of Medicine, Jazan University, Jazan, Saudi Arabia; 2College of Medicine, Jazan University, Jazan, Saudi Arabia; 3Jazan University Hospital, Jazan University, Jazan, Saudi Arabia; 4Ophthalmology Department, Prince Mohammed bin Naser Hospital, Jazan, Saudi Arabia
Correspondence: Ismail Abuallut, Department of Surgery, Ophthalmology Division, College of Medicine, Jazan University, Jazan, Saudi Arabia, Email [email protected]
Purpose: To assess the connection between the prevalence of asthenopia and the use of electronic devices in Jazan, Saudi Arabia, during the COVID-19 pandemic.
Patients and Methods: Asthenopia prevalence and its connection to electronic screens during the COVID-19 pandemic were evaluated in an analytical, cross-sectional investigation among the Jazan population. The sample population included 784 participants. Due to the COVID-19 pandemic, a pre-tested, organized, and self-administered questionnaire was used as the study method. Social media invitations were used to contact the sample group.
Results: Of the 784 participants, 587 (74.96%) had asthenopia symptoms after using digital devices at the end of the day. A total of 56.30% used digital gadgets for > 6 hours each day, whereas 55.36% spent < 2 hours per day reading papers or books or writing. Daily usage of digital gadgets did not significantly differ from asthenopia (p=0.46), as well as reading papers, books, or writing and asthenopia (p=0.098). A total of 45.92% of the study population maintained digital devices/books at a distance < 25 cm, which was significantly associated with symptoms of asthenopia (p=0.048). Furthermore, 90.10% of the sample population used laptops, cellphones, and iPads before going to bed or after turning off lights. A total of 63.52% preferred using devices while lying in bed. There was no positive link between asthenopia symptoms and cellphone usage at bedtime or after turning off lights (p=0.028).
Conclusion: Digital technology is used by people of all ages for a wide range of daily activities, including education, employment, business, and recreation. We concluded that this group had a high prevalence of asthenopia, especially during the COVID-19 pandemic. The high frequency of asthenopia emphasizes the significance of conducting public awareness campaigns concerning asthenopia symptoms and prevention methods.
Keywords: asthenopia, video display terminals, mobile phones, coronavirus disease, computer vision syndrome
Introduction
Reduced reading comprehension, light sensitivity, foggy vision, diplopia, and perceptual anomalies are some signs of asthenopia, which has become a significant threat to public health due to changing lifestyles and the widespread usage of personal computers. These signs and symptoms can be severe enough to interfere with daily activities and hasten the advancement of age-related eye diseases.1 Video display terminals (VDTs), which include mobile phones (MPs), have become a part of people’s daily lives. Portable VDTs, like computers, perform similar functions and are more convenient to carry and use. MP users have risen tremendously since 1990; almost 500 million users are now worldwide.2 In the Middle East, about 57.4% (141,489,765) of internet users for each continent, according to predictions made in June 2016. This population is at significant risk of the side effects of VDT use.2 The pandemic of the coronavirus disease 2019 (COVID-19) is among the century’s most important global events.
Following a report released in Wuhan, China, at the end of 2019, the World Health Organization declared COVID-19 a global pandemic in March 2020. Coronaviridae, the source of COVID-19, has led to the establishment of stringent regulations in many nations to stop the spread of the virus. The rules and regulations implemented by most countries include suspension of flights, lockdowns, remote apprenticeships, and the induction of work-from-home culture. Like many governments, the Saudi Arabian government also introduced precautionary steps to slow the virus’ spread, which resulted in the increased dependency of people on their electronic digital devices for completing work and school tasks, as well as for entertainment purposes.3 Following the introduction of COVID-19, a change in professional and social life practices to web-based platforms has caused an unexpected increase in interactive media use and the overall number of screen time hours logged daily.25 This will cause a slow decline in ocular health across all age groups. The combination of symptoms known as computer vision syndrome (CVS) is frequently brought on by prolonged usage of computers and other digital electronics. The American Optometric Association defines CVS as a group of eye and visual diseases brought on by excessive and prolonged computer use. Despite being entirely preventable, CVS affects over 60 million people worldwide, with one million new cases being identified each year. Compared to 31.9% in Italy, 68.5% in Mexico, and 63.4% in Australia, 46.3% of computer users in India suffer asthenopia.5 The rising prevalence of asthenopia may be linked to digital devices. Its effects can significantly reduce work capacity, academic performance, and attention, making it a critical public health concern.6 Few investigations have evaluated the prevalence of asthenopia compared to those regarding other ocular ailments and diseases. However, prevalence rates range from 12.4–32.2% in individuals under 18 to 57% among students under 30 years.7 Asthenopia has been associated with various psychosocial and environmental factors in earlier investigations. Long periods of screen time or other work at close proximities, increased cognitive strain, and computer or screen use can contribute to eye fatigue. Moreover, research conducted in China shows that 57% of Chinese students are affected by eye fatigue. According to a different study, asthenopia affects 53.3% of college students. The study also discovered that eye weariness or asthenopia was substantially correlated with the workload, daily computer use, sexuality, and period spent with handheld digital devices.8 In a study evaluating the impact of lockdown due to COVID-19 on the use of digital devices, and thus, on the ocular surface health effects and circadian rhythm abnormalities related to digital eye strain, the average daily increase in digital device use was 4.8±2.8 hours. In general, 95.8% of respondents reported at least one symptom linked to digital devices, with 56.5% indicating an increase in the frequency and intensity of these symptoms after lockdowns were announced.4 Due to academic responsibilities, long study sessions, and social networking, which have increased close work and prolonged eye exposure to cellphones, and computer screens, people are more susceptible to asthenopic symptoms.4 The current study was carried out to ascertain the prevalence of asthenopia and its associated risk factors. No previous study has assessed the prevalence of asthenopia in Jazan, Saudi Arabia.7
Aims and Objectives
This study aimed to assess the link between the usage of electronic screen devices and the prevalence of asthenopia among the population of Jazan, Saudi Arabia, during the COVID-19 epidemic. We also aimed to assess the level of asthenopia in the Jazan community, measure the prevalence of electronic screen overuse and identify factors related to asthenopia among the Jazan population.
Materials and Methods
Study Design
The cross-sectional study examined the incidence of asthenopia and its connection to the use of electronic screens among the Jazan population in Saudi Arabia during the COVID-19 pandemic.
Settings
The study was conducted in the Jazan region, southwestern Saudi Arabia. Jazan extends along the red sea. It covers an area of 11,671 km2 and is one of the 13 administrative regions in Saudi Arabia, with a population of approximately 1.5 million people. It comprises 13 governments.
Population
This community-based cross-sectional study targeted the Saudi population in the Jazan region, including those aged 18 years and above, females or males.
Inclusion and Exclusion Criteria
Saudi adults aged 18 years or above and residing in the Jazan region, who responded to the study survey, were included in the sample population for the study. The exclusion criteria for the study were as follows: aged <18 years, non-Saudi residents, not originally residents of the Jazan region, and those who did not respond to the survey.
Sampling Method and Sample Size
This study included 784 patients. As there had been no prior research on asthenopia in the Jazan region, the estimation was based on the sample size formula for cross-sectional study design, usingthe following parameters: prevalence of asthenopia = 50%, 95% confidence interval, and error <4%. The study also employed a 25% non-response assumption (as the web-based method is characterized by a high non-response rate). Sample size formula used was 
Data Collection Tools and Process
The research team converted an Arabic version of an English questionnaire.9,10 The questionnaire was divided into three parts. Sociodemographic questions were asked in the first section. The second part assessed asthenopia using questions about visual symptoms such as headache, blurred vision, and eye fatigue. Each question had five points for answer choices ranging from one to five (1 = never, 2 = mild, 3 = moderate, 4 = severe, 5 = very severe). The third part concerned the electronic devices used by the sample population, the average hour usage per day, the distance from the eyes, and the stance while reading. Other factors influencing visual symptoms, such as spectacles, frequent changes in glasses prescription, and smartphones at night with lights switched off, were collected.9 Data were collected using a self-administered Arabic questionnaire distributed online due to the COVID-19 pandemic. The study sample population was approached through invitations on social media platforms, including WhatsApp, Snapchat, and Twitter. The invitation included a link to a secure website where the survey could be completed. As an electronic survey was used, identifying the participant’s Internet Protocol address allowed only one post with no correction or “go back” option after submission. All questions were to be attempted before submission. The data collection continued until the target sample size was achieved.
Study Variables
Age, sex, and other sociodemographic factors were noted as explanatory parameters. The outcome factors were eyestrain and frequent changes in the prescription for glasses. The exposure variables were the types of electronic gadgets used, the period spent using them, and smartphone use before going to bed with the lights off.
Data Entry and Statistical Analysis
The statistical analysis was performed using the SPSS software. All the explanatory and outcome variables underwent a descriptive study. Every category variable that was observed was provided using frequencies and percentages. The mean of the responses was graded as follows: 1–1.8 defined as never,1.81–2.6 defined as mild, 2.61–3.4 defined as moderate, 3.41–4.2 defined as severe, and 4.21–5 defined as very intense. To verify the data distribution and the conditions for applying the inferential tests, the coefficient values of the Kolmogorov–Smirnov test were used to find out statistical differences between the sample members for symptoms of eye fatigue according to different sociodemographic characteristics. The Kruskal–Wallis and Mann–Whitney tests were used to detect the difference between symptoms of eye fatigue.
Pilot Study/Pre-Testing
The research team conducted a pilot study to assess the reliability and validity of the study Instruments and other variables influencing study implementation. Thirty members of the sample population participated in the pilot project, but their data were excluded from the final analysis. To evaluate the internal consistency of the asthenopia scale, Cronbach’s Alpha was determined; the the questionnaire had appropriate reliability, as the alpha coefficient value was 0.957.
Results
Table 1 shows the data of the 784 study participants. Of the total, 489 (62.37%) were females, and 295 (37.63%) were males. Almost two-thirds of the participants (71.17%) had a university education (n=558), and only 0.1% were illiterate. Most of the participants belonged to the 18–24 years age group (n=356, 45.41%), were living in villages (n=441, 56.25%), spent <2 hours reading books or writing (n=434, 55.36%), spent increased time on digital devices (n=441, 56.3%), used digital devices every day (n=705, 89.92%), used digital device at less than 25 cm distance (n=360,45.92%), and used digital devices while lying on their bed (n=498, 63.52%). Half of the participants used smartphones (n=397, 50.64%); the majority used smartphones at bedtime or after turning off the lights (n=706, 90.05%).
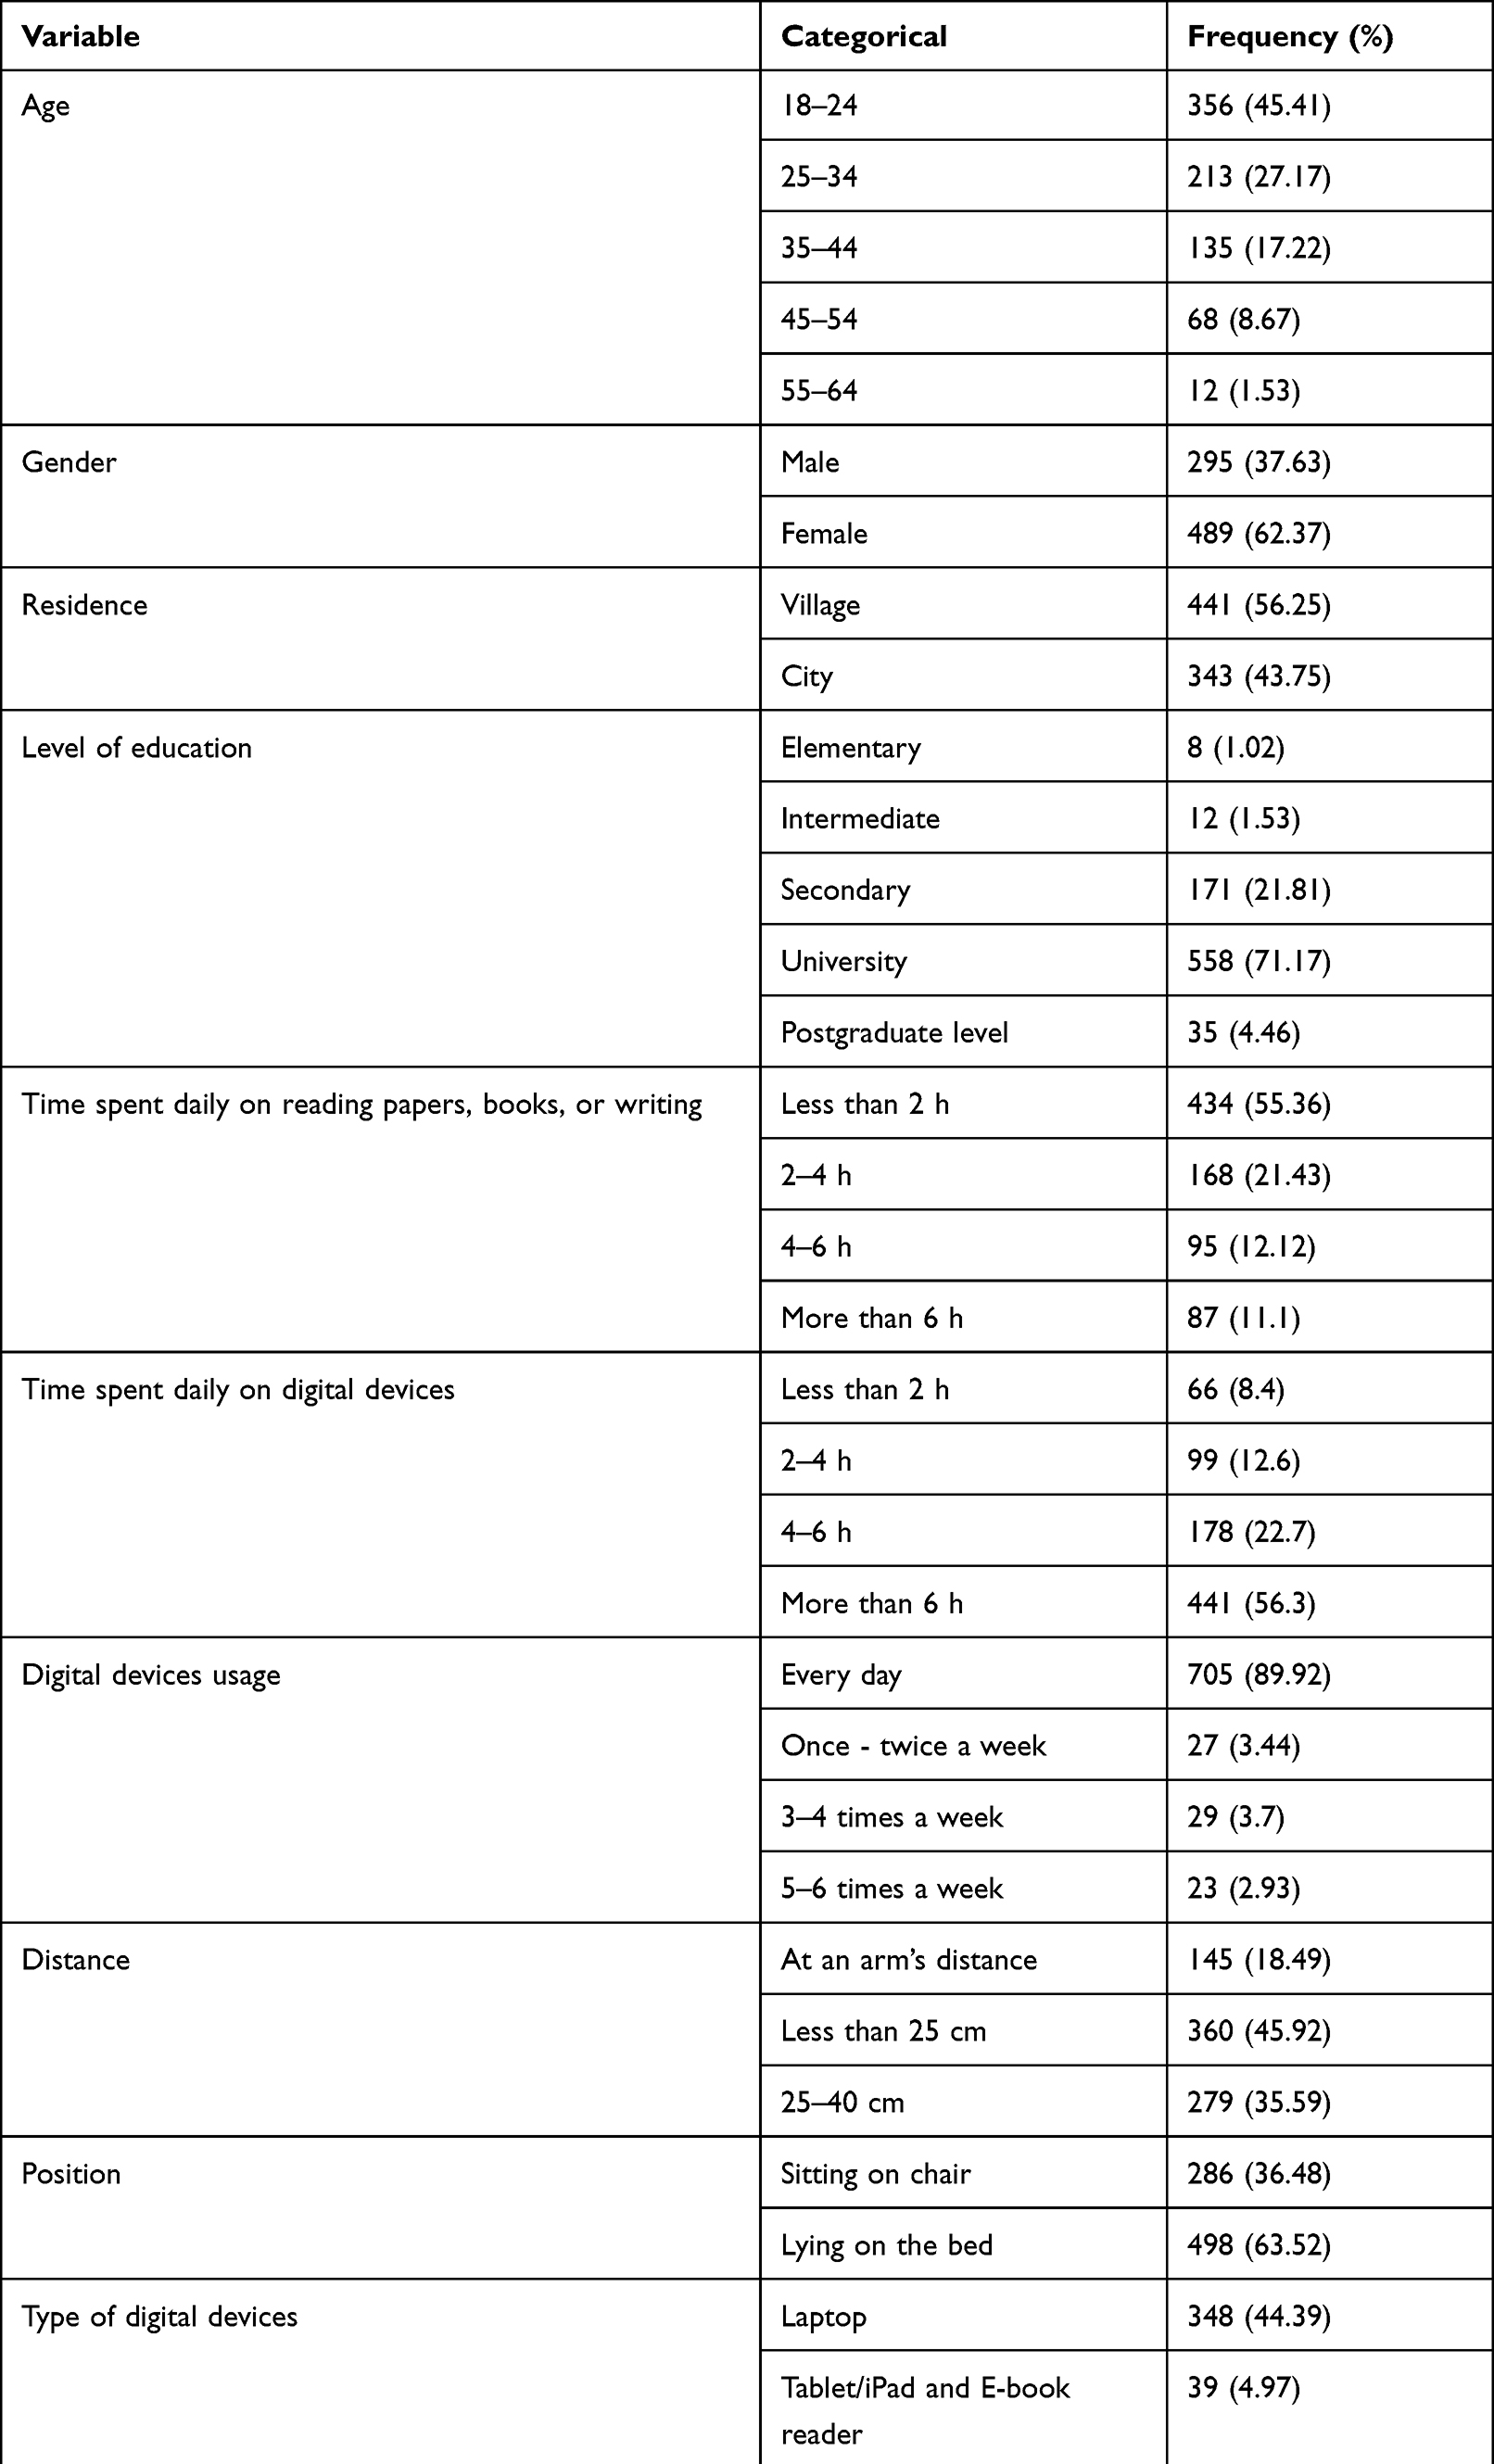 |
Table 1 Sociodemographic Characteristics of the Study Participants |
Table 2 shows that the arithmetic means of symptoms associated with asthenopia ranged from 1.64–2.46. Based on the viewpoint of the sample members, the signs were arranged in descending order according to the weighted arithmetic mean and standard deviation if the arithmetic mean values were equal. The overall median indicated mild discomfort when reading, writing, using a computer, or using MPs up close or at a distance (near work). The data clearly shows that eye fatigue brought on by work was one of the most prevalent asthenopia symptoms (590/784, 75.3%), followed by eyestrain associated while working (553/784, 70.5%) and headache associated with work (507/784, 64.7%). In contrast, the least common symptoms of asthenopia were double vision related to far vision (299/784, 38.1%) and double vision (298/784, 38%). Smartphones and laptops were the most commonly utilized devices, with usage rates of 50.6% and 44.4%, respectively. The most common reasons for the use of digital devices by most of the sample population were watching movies/videos (entertainment purposes; 68.4%) and studying (60%) Majority of those who used electronic devices >6 hours per day (56.3%) were between the ages of 18 and 24 years (65.7%); as people aged, their usage of electronics dropped. Nearly 55.4% of the respondents read papers, books, or wrote for <2 hours, most of whom were 35–44 years of age range (63%) As shown in Table 3, our findings showed that using a smartphone was not substantially connected with asthenopia in digital devices. Similarly, asthenopia was not substantially related to any of the other uses of devices. We found no statistically significant association between daily use of digital devices and asthenopia (p=0.46), and there was no association between asthenopia with the daily reading of academic papers, books, or writing (p=0.098). Asthenopia and distance were significantly different (p=0.048), whereas asthenopia and location were not quite different (p=0.273). Most of the sample population (90.1%) used smartphones at bedtime or after turning off the lights, while a small group (9.9%) did not. We found a statistically significant difference (0.05) between asthenopia and using smartphones at bedtime or after turning off the light (p=0.028). We also found that 68% of the population did not wear eyeglasses, while 32% did. 67.7% of those who wore eyeglasses noticed a difference in measurements after using electronic gadgets. A statistically significant difference at the level (0.001) between asthenopia and wearing eyeglasses was established. Table 4 shows the factors that affect the symptoms of eye fatigue in the regression module. Two factors affect the signs of eye fatigue and can be predicted in the future: daily time spent reading papers, books, or writing, and using digital devices.
 |
Table 2 Frequency and Weighted Arithmetic Means and Standard Deviations of Symptoms Associated with Asthenopia |
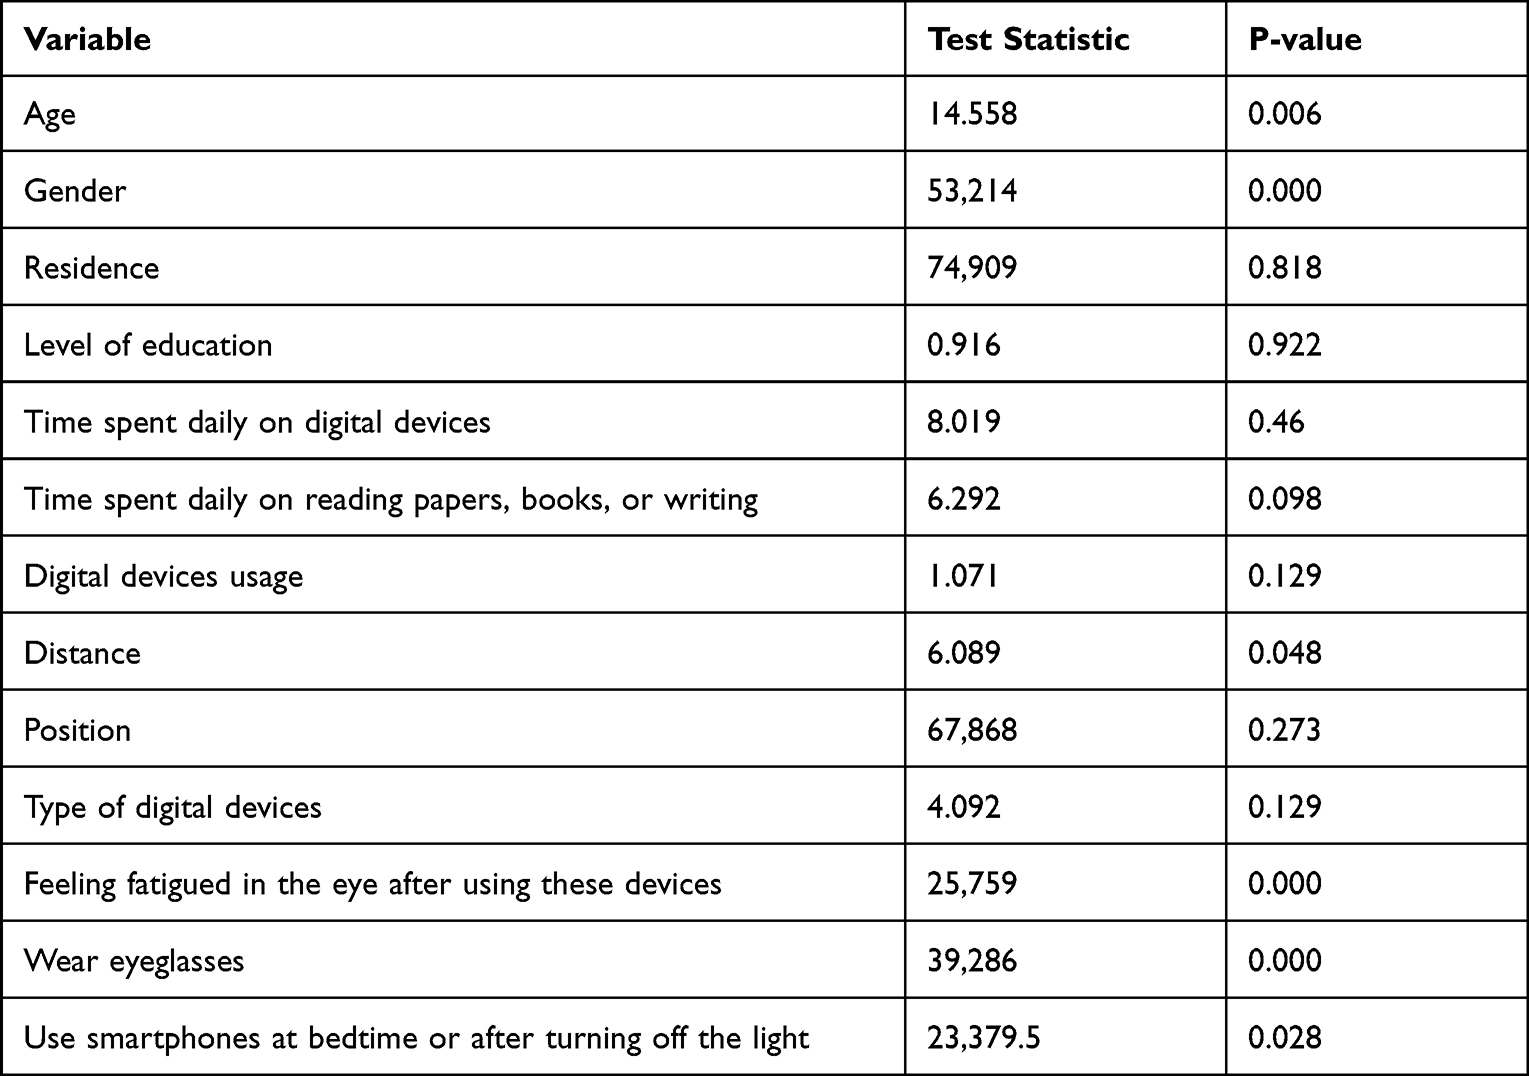 |
Table 3 Frequency Distribution of Electronic Screen Usage and Possible Risk Factors |
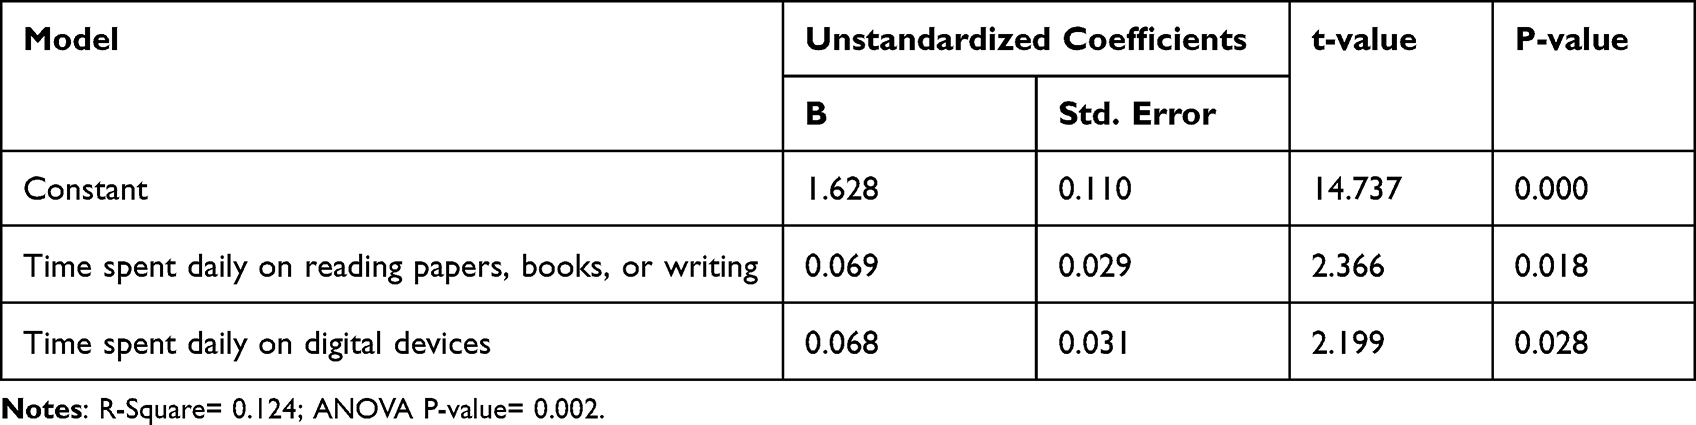 |
Table 4 Risk Factors Affecting the Symptoms of Eye Fatigue |
Discussion
This study was meant to assess the connection between the prevalence of asthenopia and the use of electronic devices in Jazan, Saudi Arabia, during the COVID-19 pandemic. Overall, we found a moderate prevalence of asthenopia, and females had a significantly higher prevalence of asthenopia. After the novel coronavirus emerged, the movement of professional and social activities to web-based platforms led to a sharp rise in digital gadgets and the total amount of daily screen time. It is challenging to compare our findings with those of comparable studies because of the small population included in the study, especially those 18 years and older, and the numerous definitions of asthenopia that must be considered. The survey in Kazerun, south of Iran, revealed the majority of asthenopia was 71% in students above the age of 18 years, based on the presence of at one symptom.7 According to a comparable study, the prevalence of asthenopia among Indian computer operators with a mean age of 25 years was 46%.11 Asthenopia was shown to be prevalent in 57% of Chinese students in another study with a mean participant age of 21 years.1 Majority of our participants (62.4%) were females, and there were statistically significant differences (0.05) between asthenopia symptoms and sex in favor of females. Likewise, females were more likely to develop asthenopia in Jeddah, Saudi Arabia, and Ajman, United Arab Emirates.12,13 Additionally, 90.42% of the respondents had at least a symptom related to using digital devices (Impact of the COVID-19 Lockdown on Digital Device-Related Ocular Health), with women being more affected than men (p=0.009) due to a higher incidence of eye dryness in women.4 The overall mean suggested mild symptoms were eye tiredness related to work (75.3%), eyestrain while working (70.5%), and headaches linked with work (64.7%). These symptoms were present when using glasses or eyes to see objects in the distance or up close (near work). Similarly, a poll revealed that most people had mild to moderate asthenopia, with eye strain and dry eyes among the symptoms.14 Furthermore, according to previous studies, the most prevalent symptoms were eye strain, headaches, and blurred vision.15 The most commonly reported symptom among university students was headache.6,13 The current investigation found that double vision, distance vision, and double vision when working were the least severe asthenopia symptoms (38%). Likewise, in a study of young people carried out during the COVID-19 pandemic, double vision was the least common symptom when it first manifested.16 Our findings align with previous studies and show that symptoms manifest more frequently while close to work. School-age children are more likely to have asthenopia, and its drivers include dry eyes, overstimulation of accommodation, and imbalances in the convergence and accommodation relationship.17 Due to screen time, people using digital devices are thought to develop asthenopia. According to the current investigation results, there was no statistically significant link between asthenopia and time spent using digital devices.18 According to a study conducted in North India, those who use electronics for >2 hours a day are more likely to have CVS than others who use them for <9 hours a day. Studies conducted among school children during COVID-19 found a higher incidence of asthenopia with longer screen and online course time.16,19 Additionally, in our research, there was no significant correlation between the amount of time spent each day reading newspapers or books and asthenopia (p=0.098). None of the digital devices used or the reason for which they were used were shown to be significantly associated with asthenopia. Similarly, despite suggestions by online publications regarding oculomotor responses and task reliance, the aim of using devices was not significantly associated with asthenopia.6 Reading distance affects how severe symptoms are in those who use digital devices. The ideal focus distance is between 30 and 40 cm from the eyes for reading and writing, although it is farther for computer viewing. Reduced eyestrain is achieved with a distance of 50–70 cm between the computer monitor and the user’s eyes.20 Smaller digital devices, like cellphones, are typically held 20–30 cm from the eyes, which provides the perfect environment for digital eyestrain. After 60 minutes of smartphone exposure, a new study found that viewing distances are closer and symptoms of eyestrain are more severe.21 Approximately 45.92% of participants utilized their digital devices or books at a distance of <25 cm (0.048). Poor posture leads to back hunching and significant eye strain, which in turn causes neck and back muscle pain. There was no correlation between participants’ reading preference and asthenopia symptoms or posture among the 63.52% of participants who liked to read when lying in bed in the current study. Another study discovered no correlation between location and asthenopia. The blue light emitted by smartphone screens disrupts sleep cycles, and the effects are increased when the device is used in the dark. The results of this study demonstrate that excessive smartphone use causes a range of visual issues, with headaches and myopia as the most common refractive errors and ocular symptoms, respectively.22 In our study, we identified a weak positive association between asthenopia and smartphone use at bedtime or after turning off lights at the level (0.05), with 90.1% of the sample population using cell phones at rest or after turning off the lights. A study found that reading from a smartphone for prolonged periods can worsen asthenopic symptoms than reading from hardcopy under similar conditions. Symptoms may worsen when using a smartphone in low light.23 We found that 67.98% of the sample population did not use eyeglasses, whereas 32.02% did, and that 67.7% of those who wore eyeglasses noticed a difference in measures after beginning the use of devices. There is a statistically significant difference between asthenopia symptoms and wearing glasses at the level of (0.001). Studies have discovered a strong correlation between the severity of asthenopia symptoms and wearing glasses.18,24
Limitations
Our study had some limitations. The self-administrated online poll may have caused reporting bias, and its power to show a direct connection is limited. However, it can be a framework for upcoming prospective studies, including greater sample sizes and more extensive administrative regions. Current visual problems may have augmented the prevalence of eyestrain in the community despite our best strategies to eliminate all causes of poor vision and convergence insufficiency. Therefore, documenting the refractive defect type, the best-corrected visual acuity, and future studies may help lessen this confounder’s impact. It would be ideal for measuring asthenopia; however, objectively; it cannot be measured objectively in any specific way. Despite these limitations, our results contribute to the body of literature by indicating that the current wave of digital advancement may have a significant negative influence on vision. The results of this study also augmented the growing body of literature that examines the detrimental impact of the widespread use of electronic media on people’s health.
Recommendations
The risk factors for asthenopia were examined in this study, although many still require further investigation. Future studies should emphasize identifying other risk factors linked to asthenopia and the prevalence of the condition globally across various socioeconomic and age groups. It would be essential to include a method that can be used objectively to assess whether asthenopia screening is necessary. The general public should be aware of the negative effects of the long-term use of video display devices on the eyes. It should take preventive steps if a daily extended computer or MP use is necessary. It is not advised to use electronics at high pitch blackness or low brightness in strong light, such as sunlight. Anti-blue tempered glass should be used to shield the phone’s screen. Anti-blue coating glass is a unique glass barrier that blocks blue light. It is recommended that screen users take a 20-second break every 20 minutes. After closing their eyes for 20 seconds, users should focus on something in front of them for 20 seconds (using the 20-20-20 Rule).
Conclusion
In the modern age of digitalization, individuals of all ages rely on digital gadgets for various reasons in their daily lives, such as education, vocation, business, and enjoyment. We concluded that asthenopia was prevalent in this population during the COVID-19 lockdowns. The time spent using digital devices daily and reading papers, books, or writing was strongly associated with asthenopia symptoms. The high frequency of asthenopia emphasizes the significance of conducting public awareness campaigns concerning asthenopia symptoms and prevention methods.
Abbreviations
VDT, video display terminals; MP, mobile phones; COVID-19, coronavirus disease 2019; CVS, Computer vision syndrome.
Ethical Considerations
The study’s goals were explained to all possible volunteers, who were assured that participating in the study would not have any negative effects. They received guarantees regarding their data’s anonymity and secrecy. Informed consent was obtained for participation, and the study received ethical approval from the Jazan University IRB ethical committee. The study was conducted in accordance with the Declaration of Helsinki of 1975 and revised in 2000.
Acknowledgments
We would like to thank Editage [http://www.editage.com] for editing and reviewing this manuscript for English language.
Disclosure
The authors declare that they have no conflicts of interest.
References
1. Han CC, Liu R, Liu RR, Zhu ZH, Yu R-B, Ma L. Prevalence of asthenopia and its risk factors in Chinese college students. Int J Ophthalmol. 2013;6(5):718–722. doi:10.3980/j.issn.2222-3959.2013.05.31
2. Al Subaie M, Al-Dossari S, Bougmiza M. Computer vision syndrome among mobile phone users in Al-Ahsa, Kingdom of Saudi Arabia. Al-Basar Int J Ophthalmol. 2017;4(4):99. doi:10.4103/bijo.bijo_13_18
3. Alabdulkader B. Impact of precautionary lockdown measures during the COVID-19Pandemic on the development of digital eye strain among contact lens users. Int JOphthalmol Vis Sci. 2021;6(2):94. doi:10.11648/j.ijovs.20210602.16
4. Bahkir FA, Grandee SS. Impact of the COVID-19 lockdown on digital device-related ocular health. Indian J Ophthalmol. 2020;68(11):2378.
5. Al Tawil L, Aldokhayel S, Zeitouni L, Qadoumi T, Hussein S, Ahamed SS. Prevalence of self-reported computer vision syndrome symptoms and its associated factors among university students. Eur J Ophthalmol. 2020;30(1):189–195. doi:10.1177/1120672118815110
6. Issam R, Sawaya T, El MN, et al. Asthenopia among university students: the eye of the digital generation. J Family Med Prim Care. 2020:3921–3932. doi:10.4103/jfmpc.jfmpc
7. Hashemi H, Saatchi M, Yekta A, et al. High prevalence of asthenopia among a population of university students. J Ophthalmic Vis Res. 2019;14(4):474–482. doi:10.18502/jovr.v14i4.5455
8. Kaya H. Investigation of the effect of online education on eye health in Covid-19 pandemic. Int J Assess Tools Educ. 2020;7(3):488–496. doi:10.21449/ijate.788078
9. Ichhpujani P, Singh RB, Foulsham W, Thakur S, Lamba AS. Visual implications of digital device usage in school children: a cross-sectional study. BMC Ophthalmol. 2019;19(1):1–8. doi:10.1186/s12886-019-1082-5
10. Darko-takyi C, Khan NE, Nirghin U. Symptomatic vergence disorders in junior high schoolchildren in Ghana. African Vis Eye Health. 2016;75(1):1–8.
11. Bhanderi DJ, Choudhary S, Doshi VG. A community-based study of asthenopia in computer operators. Indian J Ophthalmol. 2008;56(1):51–55. doi:10.4103/0301-4738.37596
12. Shantakumari N, Eldeeb R, Sreedharan J, Gopal K. Computer use and vision-related problems among university students in Ajman, United Arab Emirate. Ann Med Health SciRes. 2014;4(2):258. doi:10.4103/2141-9248.129058
13. Altalhi AA, Khayyat W, Khojah O, Alsalmi M, Almarzouki H. Computer vision syndrome among health sciences students in Saudi Arabia: prevalence and risk factors. Cureus. 2020;12(2):2–7.
14. Kim DJ, Lim C-Y, Gu N, Park CY. Visual fatigue induced by viewing a tablet computer with a high-resolution display. Korean J Ophthalmol. 2017;31(5):388. doi:10.3341/kjo.2016.0095
15. Gupta R, Chauhan L, Varshney A. Impact of E-schooling on digital eye strain in coronavirus disease era: a survey of 654 students. J Curr Opthalmol. 2021;33(2):158–164. doi:10.4103/joco.joco_89_20
16. Mohan A, Sen P, Shah C, Jain E, Jain S. Prevalence and risk factor assessment of digital eye strain among children using online e-learning during the COVID-19 pandemic: digital eye strain among kids (DESK study-1). Indian J Ophthalmol. 2021;69(1):140. doi:10.4103/ijo.IJO_2535_20
17. Hashemi H, Khabazkhoob M, Forouzesh S, Nabovati P, Yekta AA, Ostadimoghaddam H. The prevalence of asthenopia and its Determinants among schoolchildren. J Compr Pediatr. 2017;8(1):1–6.
18. Almarzouki N, Faisal K, Nassief A, et al. Digital Eye Strain During COVID-19 Lockdown inJeddah, Saudi Arabia. J Contemp Med Sci. 2021;7(1):40–45. doi:10.22317/jcms.v7i1.937
19. Li L, Zhang J, Chen M, et al. Contribution of total screen/online-course time to asthenopia in children during COVID-19 pandemic via influencing psychological stress. Front PublicHealth. 2021;9:1–11.
20. Rempel D, Willms K, Anshel J, Jaschinski W, Sheedy J. The effects of visual display distance on eye accommodation, head posture, and vision and neck symptoms. HumFactors. 2007;49(5):830–838.
21. Long J, Cheung R, Duong S, Paynter R, Asper L. Viewing distance and eyestrain symptoms with prolonged viewing of smartphones. Clin Exp Optom. 2017;100(2):133–137. doi:10.1111/cxo.12453
22. Safdar M, Qasim A, Mustansar M, et al. Effects of electronic devices on vision in students age group 18–25. Ann Med Heal Sci Res. 2021;11:1572–1577.
23. Antona B, Barrio AR, Gascó A, Pinar A, González-Pérez M, Puell MC. Symptoms associated with reading from a smartphone in conditions of light and dark. Appl Ergon. 2018;68:12–17. doi:10.1016/j.apergo.2017.10.014
24. Reddy SC, Low CK, Lim YP, Low LL, Mardina F, Nursaleha MP. Computer vision syndrome: a study of knowledge and practices in university students. Nepal J Ophthalmol. 2013;5(2):161–168. doi:10.3126/nepjoph.v5i2.8707
25. Usgaonkar U, Parkar SR, Shetty A. Impact of the use of digital devices on eyes during the lockdown period of COVID-19 pandemic. Indian J Ophthalmol. 2021;69(7):1901. doi:10.4103/ijo.IJO_3500_20
 © 2022 The Author(s). This work is published and licensed by Dove Medical Press Limited. The
full terms of this license are available at https://www.dovepress.com/terms
and incorporate the Creative Commons Attribution
- Non Commercial (unported, 3.0) License.
By accessing the work you hereby accept the Terms. Non-commercial uses of the work are permitted
without any further permission from Dove Medical Press Limited, provided the work is properly
attributed. For permission for commercial use of this work, please see paragraphs 4.2 and 5 of our Terms.
© 2022 The Author(s). This work is published and licensed by Dove Medical Press Limited. The
full terms of this license are available at https://www.dovepress.com/terms
and incorporate the Creative Commons Attribution
- Non Commercial (unported, 3.0) License.
By accessing the work you hereby accept the Terms. Non-commercial uses of the work are permitted
without any further permission from Dove Medical Press Limited, provided the work is properly
attributed. For permission for commercial use of this work, please see paragraphs 4.2 and 5 of our Terms.