")
Back to Journals » Risk Management and Healthcare Policy » Volume 16
Prevalence and Risk Factors of Hyperuricemia in the Urban Health Checkup Population in Xinjiang, China: A Cross-Sectional Study
Authors Wu X, Zhou M, Bu J , Chang Y, Mahan Y, Lu H, Zhang Y, Zhang X, Wang Z, Zhou L
Received 1 June 2023
Accepted for publication 28 July 2023
Published 14 August 2023 Volume 2023:16 Pages 1531—1544
DOI https://doi.org/10.2147/RMHP.S423794
Checked for plagiarism Yes
Review by Single anonymous peer review
Peer reviewer comments 5
Editor who approved publication: Dr Jongwha Chang
Xuanxia Wu,1,* Mingming Zhou,2,* Juan Bu,1 Yuwen Chang,2 Yeledan Mahan,1 Huanhuan Lu,2 Yanmin Zhang,3 Xiaoling Zhang,1 Zhaoxia Wang,1 Ling Zhou1
1Medical Research and Transformation Center, People’s Hospital of Xinjiang Uygur Autonomous Region, Urumqi, Xinjiang, People’s Republic of China; 2Health Management Center, People’s Hospital of Xinjiang Uygur Autonomous Region, Urumqi, Xinjiang, People’s Republic of China; 3Scientific Research and Education Center, People’s Hospital of Xinjiang Uygur Autonomous Region, Urumqi, Xinjiang, People’s Republic of China
*These authors contributed equally to this work
Correspondence: Ling Zhou, Medical Research and Transformation Center, People’s Hospital of Xinjiang Uygur Autonomous Region, No. 91 Tianchi Road, Urumqi, Xinjiang, 830001, People’s Republic of China, Tel +86-13609959575, Email [email protected]
Purpose: In this study, the aim was to investigate the prevalence and risk factors of hyperuricemia (HUA) in the urban health checkup population in Urumqi, Xinjiang, and thus provide clues for the prevention of HUA.
Methods: People who attended medical examinations from May 2021 to June 2022 at a hospital in Urumqi, Xinjiang, were selected for evaluation based on their general information, physical examination results, and laboratory test results. The chi-square test was used to determine whether there was a difference in the prevalence of HUA among participants with different characteristics. Using logistic regression analyses, risk factors for HUA were identified.
Results: There were 8722 participants diagnosed with HUA, with an overall prevalence of 26.96%. The prevalence in men was 37.72%, significantly higher than in women (13.29%). Participants were characterized by a multiethnic composition, with Han (28.61%), Hui (27.88%) and Manchu (38.46%) being the three ethnicities with the highest prevalence. According to logistic regression analyses, HUA was associated with age, ethnicity, residence, marital status, body mass index (BMI), diastolic blood pressure (DBP), fasting blood glucose (FPG), triglyceride glucose (TyG) index, abdominal obesity, and dyslipidemia differently in males and females.
Conclusion: The prevalence of HUA was high in the urban health checkup population in Urumqi, Xinjiang, particularly among men and youth. The early intervention for HUA should be enhanced to reduce the risk of cardiovascular disease and other related conditions.
Keywords: hyperuricemia, ethnicity, prevalence, risk factors, epidemiology
Introduction
Uric acid (UA) is the body’s end product of purine metabolism.1 Due to the lack of uricase, the body is unable to degrade UA into allantoin, which is more water-soluble and more easily excreted.2 As the production of UA exceeds its excretion, it accumulates in the body, leading to hyperuricemia (HUA). HUA is not only the pathological underlying cause of gout but is also an independent risk factor for obesity, hypertension, diabetes, dyslipidemia, liver dysfunction, chronic kidney disease (CKD), metabolic syndrome (MetS) and cardiovascular disease (CVD).2–6
In recent years, rapid socio-economic development has led to changes in living habits, dietary structure, and the effects of an aging population, making hyperuricemia prevalent in many countries. In the United States, the prevalence of HUA was 20.2% and 20.0% for adult males and females, respectively, in 2015–2016.7 Japanese health insurance claims data showed that 13.4% of patients with HUA in 2016–2017.8 As reported by China Nutrition and Health Surveillance (CNHS) 2015–2017, 13.4% of Chinese adults had HUA.9 A vast area of China has resulted in different lifestyles and dietary habits, causing HUA prevalence to vary widely from region to region. Some provinces in the south-central, eastern, and northeastern regions had a more than 20% prevalence.10 HUA is prevalent in the less economically developed Xinjiang, with an overall prevalence of 9.1%, and the three major ethnic groups, Han, Uygur, and Kazak, with a prevalence of 15.4%, 4.6%, and 5.5%, respectively.11
Urumqi, located in northwestern China, is the capital of Xinjiang Uygur Autonomous Region, with a resident population of 4.0824 million, including 56 ethnic groups, and is the largest city in Xinjiang. Notably, Urumqi is the furthest city from the ocean on the earth and has less intake of purine-rich seafood than the rest cities of China, resulting in a much lower risk of developing HUA.12 However, the region’s dietary eating habits of excess fructose,13 high fat and low vegetables also increase the risk of developing HUA.14 Urumqi’s multiethnic demographic characteristics lead to diverse eating habits and lifestyles. Some ethnic groups, such as the Uygur, Hui, and Kazak, consume a significant amount of red meat and offal, increasing their risk of HUA.15 In addition to dietary habits, the occurrence of HUA is also closely related to genetic background. Some studies have shown gene differences related to UA metabolism among multiple ethnic groups in Xinjiang.16
Previous studies on the prevalence of HUA in Xinjiang have been conducted.11,16–19 However, five years have passed since the most recent epidemiological survey of HUA in Xinjiang, so the current epidemiological status of HUA in Xinjiang is unclear. Hyperuricemia is more prevalent in cities compared to rural areas,20 and the urban population in Urumqi is predominant, so the urban population deserves special attention. Studies in urban health screening populations that include various nationalities are limited. This study conducted a cross-sectional study to clarify the epidemiological status of HUA in the urban health checkup population in Xinjiang by analyzing recent one-year physical examination data from a hospital in Urumqi.
Materials and Methods
Study Participants
This was a cross-sectional study conducted at a tertiary hospital in Urumqi, Xinjiang. From May 2021 to June 2022, citizens who came to the hospital for their annual health checkups were included in this study. The hospital was equipped with professional medical staff and equipment, and people who underwent health checkups at the hospital covered every district of Urumqi. Inclusion criteria included age≥18 years, resident of Urumqi household registration and residing for >6 months, serum uric acid (SUA) testing, and informed consent. Exclusion criteria included cachexia, severe end-stage disease, women during pregnancy, and those who had two medical examinations within a year (To avoid duplicate inclusion, only the results of their first physical examination were included in this study.) and outliers.
As shown in Figure 1, among the 45,383 participants undergoing medical examinations at the hospital, 35,217 were tested for SUA. Of those tested for SUA, 2863 were excluded from the study, and 32,354 were included.
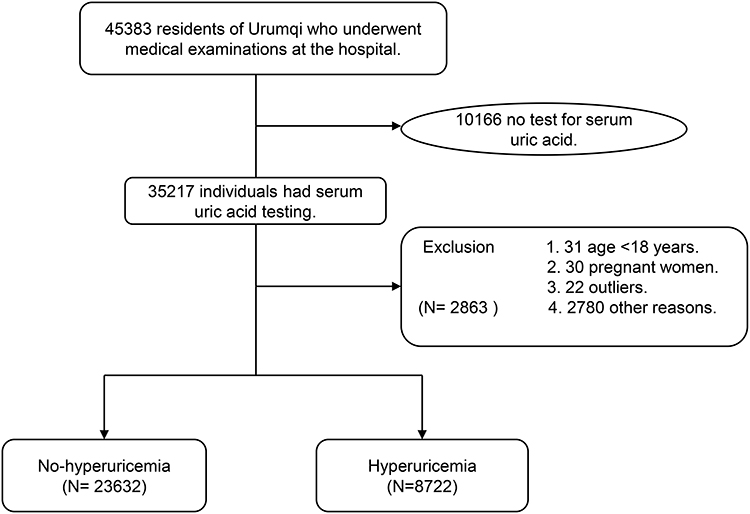 |
Figure 1 Flow chart for inclusion and exclusion of participants. |
Data Collection
With the participant’s consent, standardized information collection was performed by professionally trained medical personnel. It included general information: gender, age, ethnicity, address, marital status, and past history (hypertension, diabetes, and coronary heart disease). Blood pressure (BP), height, weight, and waist circumference were measured during the physical examination. The body mass index (BMI) = weight (kg)/height (m)².
Laboratory Tests
All participants fasted after 22:00 on the day before blood collection, and the median elbow vein was collected early the next morning. Measurement of total cholesterol (TC), high-density lipoprotein cholesterol (HDL-C), low-density lipoprotein cholesterol (LDL-C) triglycerides (TG), fasting blood glucose (FPG) and SUA were performed using a serum automated biochemistry analyzer. Triglyceride Glucose(TyG) Index= ln (TG [mg/dL]×FPG [mg/dL]/2).21
Definition of Hyperuricemia
HUA was diagnosed in males with SUA >420 μmol/L and females with SUA >360 μmol/L.22
Definition of Other Influencing Factors
It was defined as hypertension if the systolic blood pressure (SBP) exceeded 140 mmHg and/or the diastolic blood pressure (DBP) exceeded 90 mmHg and/or if a self-reported history of hypertension.23 An FPG level≥7.0 mmol/L and/or a history of diabetes were used to diagnose diabetes.24 In serum, TC≥5.20 mmol/L and/or LDL-C≥3.40 mmol/L and/or HDL-C <1.00 mmol/L and/or TG≥1.70 mmol/L were diagnosed with dyslipidemia.25 CHD was diagnosed by the patient’s past history. Underweight was defined as BMI <18.5 kg/m², normal weight as 18.5 kg/m²≤BMI<24 kg/m², overweight as 24 kg/m²≤ BMI<28 kg/m², and obesity as BMI≥28kg/m².26 Adult men with waist circumference≥90 cm and adult women with waist circumference ≥80cm are diagnosed with abdominal obesity.27
Statistical Analysis
SPSS 26 was used for data analysis and processing. Standard deviations (means) are used to express normally distributed continuous variables, and count data were represented as the number of cases and percentage. The chi-square test (or Fisher’s exact test) was used when comparing categorical data. To compare mean SUA levels in subgroups, one-way ANOVAs were used. Risk factors for HUA were determined by logistic regression analysis. A statistically significant difference was defined as a value of p<0.05.
Results
Baseline Characteristics of Participants
Urumqi has a population of 4.0824 million, notably characterized by a multiethnic demographic composition. Table 1 provided the baseline characteristics of participants. This study eventually included 32,354 participants. The age spacing was 18–70 years, of which 18,100 (55.94%) were males and 14,254 (44.06%) were females. The participants have a multiethnic composition, with the Han making up the highest proportion (74.09%), followed by Uygur (14.77%). Due to the small number of participants from the remaining ethnicities, they were combined as “others”. In terms of residence, the participants were distributed in each district of Urumqi. Based on BMI and waist circumference, 21.73% of participants were diagnosed as obesity and 54.16% as abdominal obesity, respectively. As for common chronic diseases, up to 61.22% of the population suffered from dyslipidemia, 25.55% from hypertension, 7.52% from diabetes, and 3.19% from CHD.
 |
Table 1 Descriptive Characteristics of Participants |
Prevalence of Hyperuricemia
As shown in Table 2, of the 32,354 participants, 8722 suffered from HUA, with an overall prevalence of 26.96%. It was found that the prevalence of HUA was 37.72% in males, which is significantly higher than the prevalence of HUA in females (13.29%). There was no linear trend between age and HUA prevalence, but there was a statistically significant difference in prevalence between age groups. There is a tendency for HUA to occur in younger individuals, with the two youngest age groups having the highest prevalence (35.65%,30.15%). A notable finding was that among ethnicities, Manchu had the highest prevalence (38.46%), followed by the Han with 28.61%. The Han also had a higher prevalence than Uygur, Hui, Kazak, Mongolian, Xibe, and Others. As shown in Figures 2–4, HUA prevalence increased linearly with increasing BMI, BP,and TyG index. In individuals with abdominal obesity, hypertension, and dyslipidemia, the prevalence of HUA was 35.48%, 36.24%, and 34.70%, respectively. However, there was no significant relationship between the prevalence of HUA in normal individuals and those with diabetes and CHD (P>0.05).
 |
Table 2 Prevalence of Hyperuricemia in Different Characteristics Subgroups |
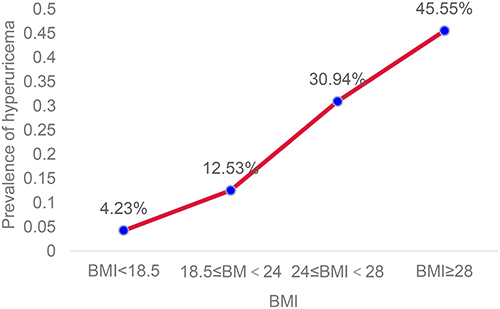 |
Figure 2 A linear trend between BMI and prevalence of hyperuricemia. |
 |
Figure 3 Relationship between blood pressure quartiles and prevalence of hyperuricemia. |
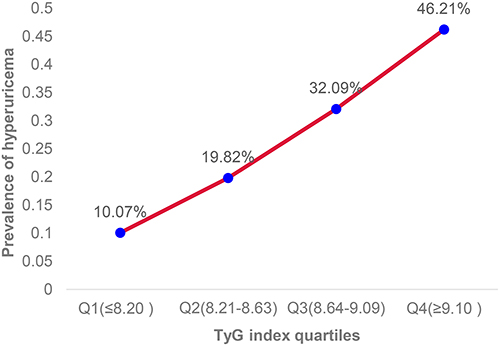 |
Figure 4 A linear trend between TyG index quartiles and prevalence of hyperuricemia. |
Distribution of Serum Uric Acid Levels
Table 3 presented the SUA levels in people with different characteristics. In this study, SUA levels were significantly higher in men than in women (399.62 (86.18) μmol/L VS 287.01 (67.71) μmol/L). A higher SUA level was observed in the two youngest age groups (18–24 and 25–34). Like the prevalence, the Manchu had the highest SUA level, while the Han had a higher SUA level than the remaining ethnic groups. Additionally, SUA levels increased linearly with increasing BMI, BP, FPG, and TyG index. Participants with abdominal obesity, hypertension, diabetes, CHD, and dyslipidemia had a higher SUA level than normal individuals.
 |
Table 3 Distribution of Serum Uric Acid Levels by Subgroup Analysis |
Influencing Factors for Hyperuricemia
Multivariate logistic regression analyses were shown in Table 4. The risks of HUA were higher in males (OR,2.030; 95% CI,1.898–2.171) than in females. Compared to the 35–44 years (age group), the younger age group had a higher risk of HUA in both genders, and the older age group showed a lower risk of HUA in males but a higher risk in females. Among the ethnic groups we studied, Han and Hui were at greater risk than Kazak by more than two times. For Manchu, this risk was more than 2.5 times higher among male participants (OR,2.632; 95% CI,1.617–4.284) and even more than 6.5 times higher among female participants (OR,6.880;95% CI,3.517–13.460). In terms of marital status, being unmarried was associated with an increased risk of HUA. Based on BMI, we found that underweight decreased the risk of HUA, while overweight and obesity increased it. In terms of BP, higher DBP levels were associated with an increased risk of HUA in men, while it was not significant in women. Compared with Q2 levels of FPG, lower FPG levels were risk factors for HUA in both males and females, while higher FPG levels were protective factors for men and not statistically significant for women. Furthermore, we observed that a higher TyG index led to an increase in HUA risk. The presence of abdominal obesity and dyslipidemia is associated with an increased risk of HUA compared to normal individuals.
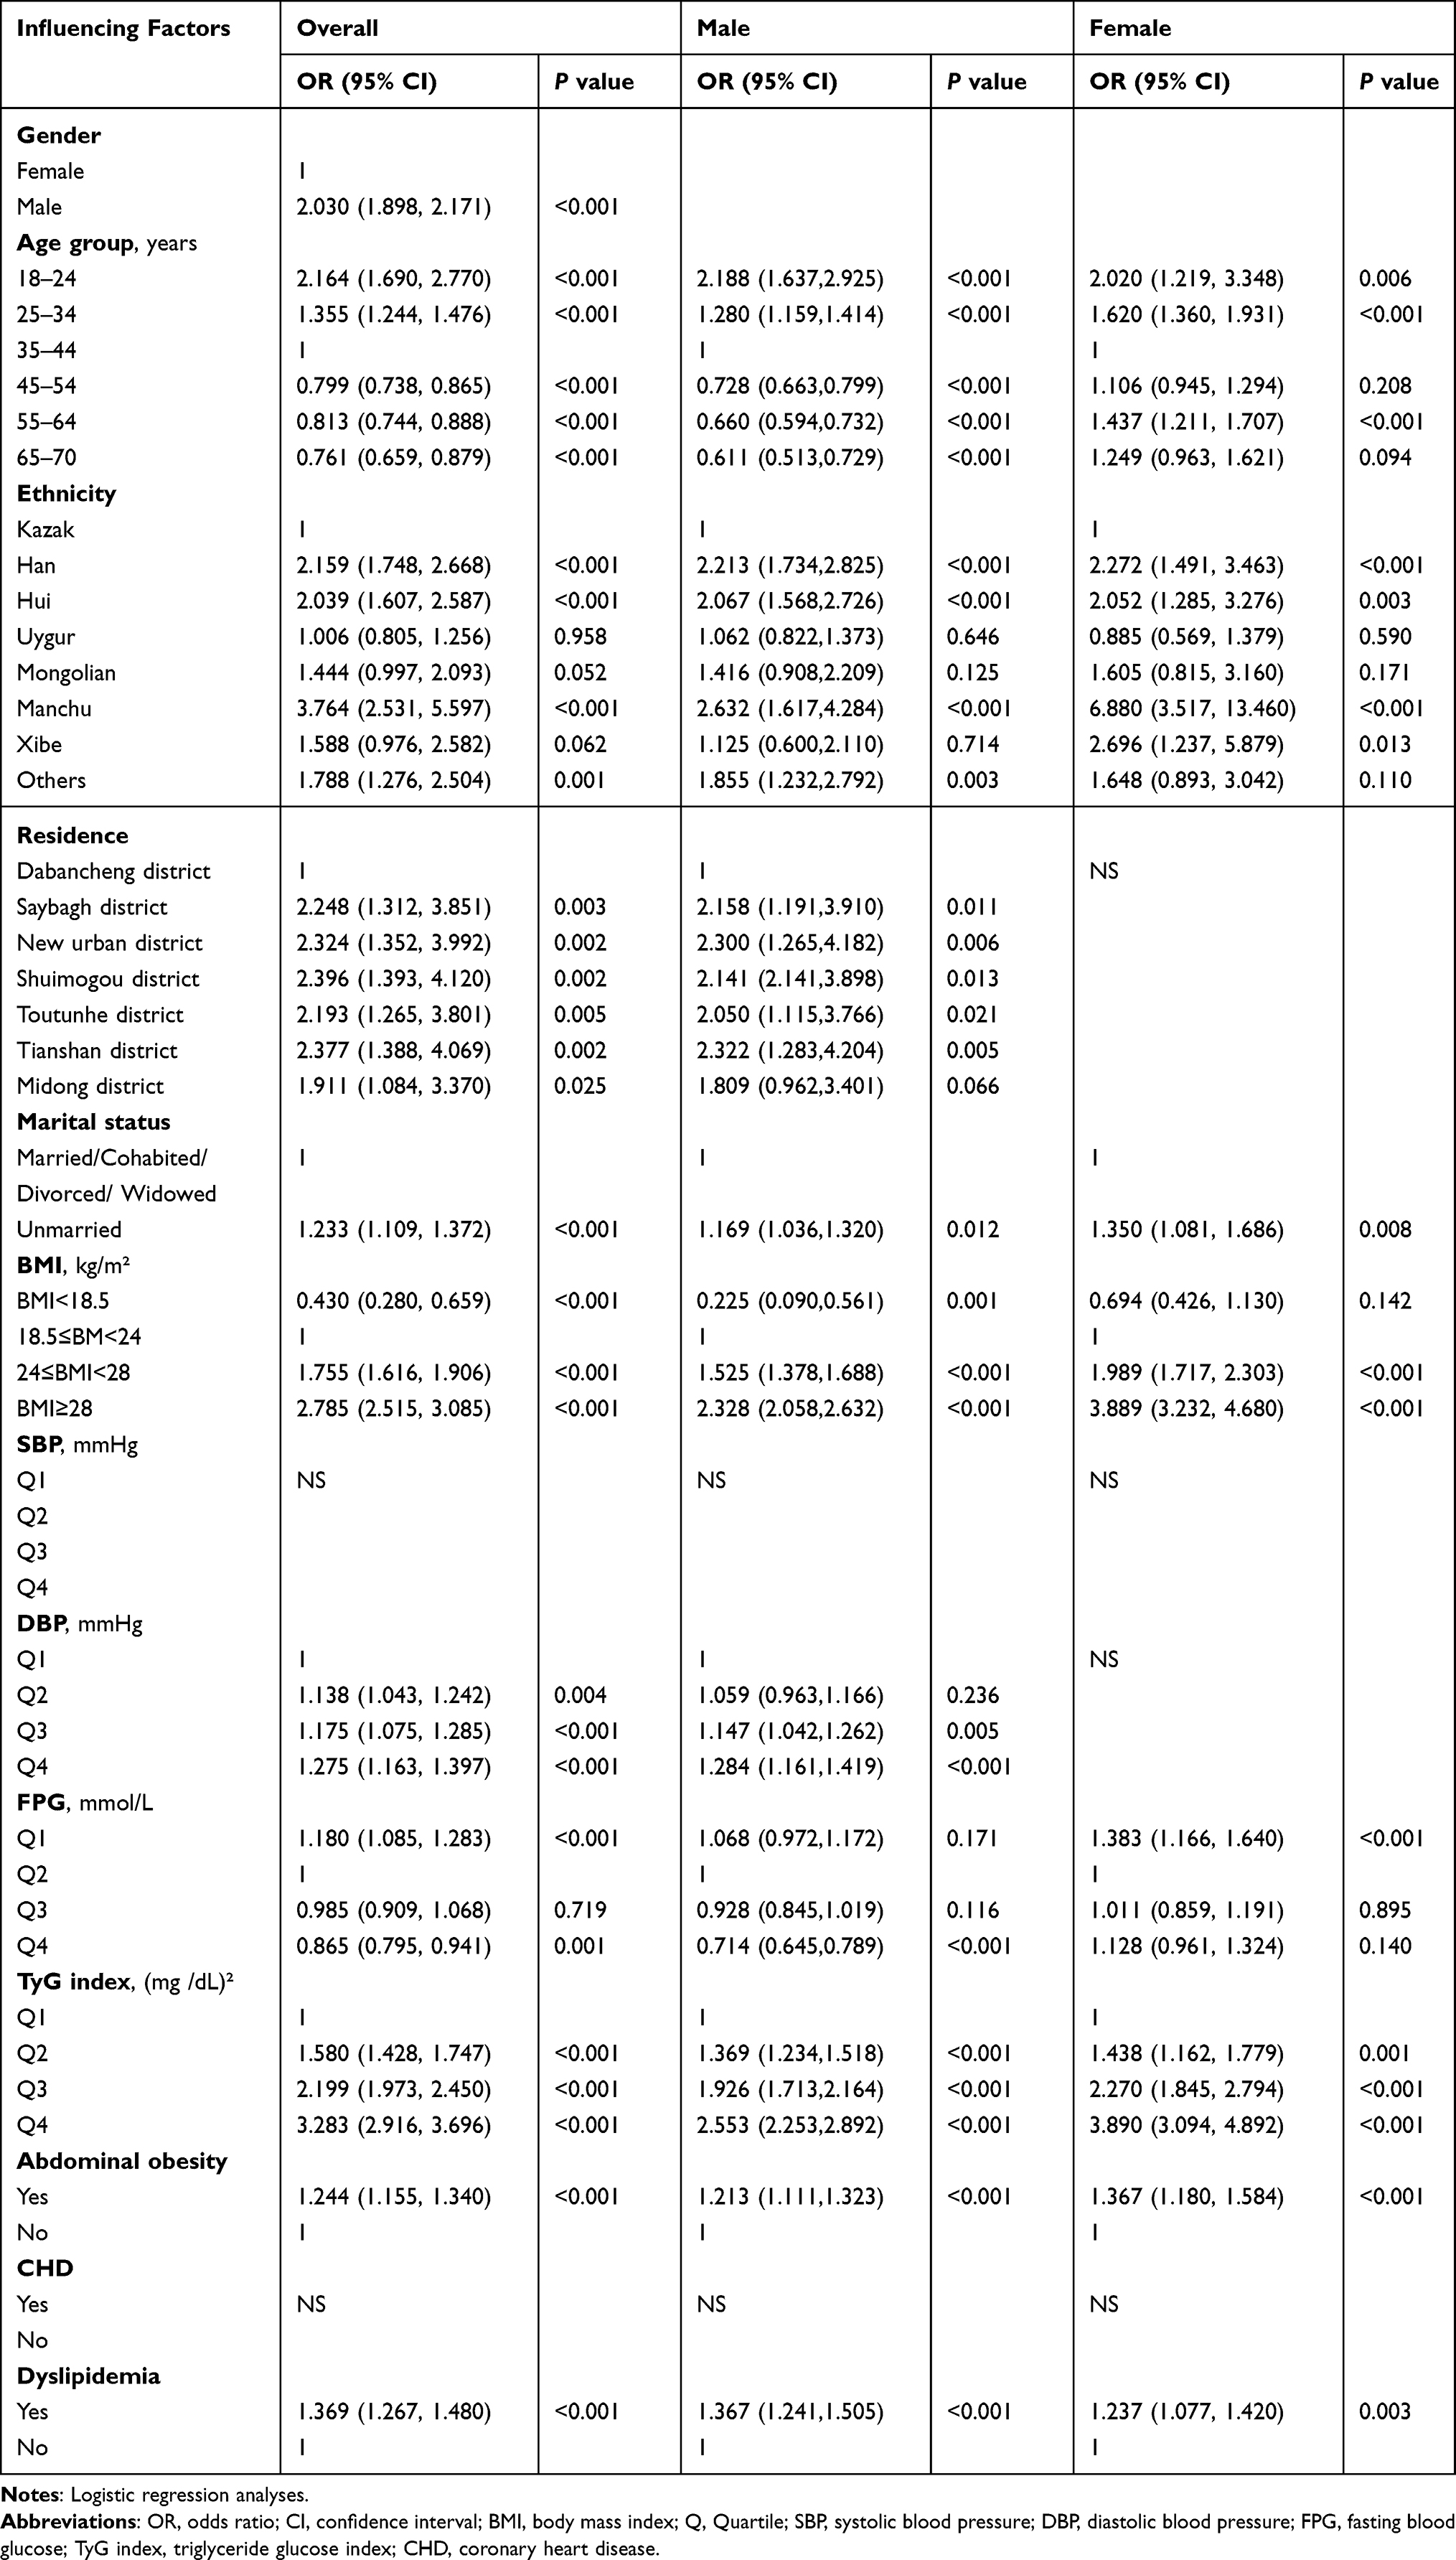 |
Table 4 Multivariate Logistic Regression Analysis of Risk Factors for Hyperuricemia |
Discussion
In this study, the prevalence of HUA in the urban health checkup population of Urumqi was 26.96%, which was higher than the prevalence of HUA in American adults (20%) as shown by the National Health and Nutrition Examination Survey 2015–2016.7 It is also higher than several other countries in Asia, such as the Japanese health insurance claims data showing a prevalence of 13.4% of Japanese adults with hyperuricemia,8 while an analysis of a population-based nationally representative sample in South Korea yielded a prevalence of 11.4% of non-institutionalized adults with hyperuricemia,28 and in the Mongolian region, an ethnic minority area region of China, the prevalence of HUA was 17.7%.29 These differences may be attributed to the effects of ethnic differences, an aging population and the Westernization of Chinese eating habits.30 According to the China Health and Nutrition Survey (CHNS) 2015 −2017, 15.1% of adults were found to have HUA.9 There was a 34.05% prevalence of HUA in the urban population aged 20–99 years in the Pearl River Delta region.31 It can be found that the prevalence in Urumqi is higher than the national level but lower than that in the Pearl River Delta region. Firstly, in recent years, China’s economic level and quality of life have improved significantly compared to the past. Secondly, the daily diet of people in Urumqi is mainly based on beef, mutton, and high soup, and the intake of green vegetables is insufficient. Finally, the cold and long winters in Xinjiang, where people exercise less, increase the proportion of high-fat and high-sugar food intake. It is possible to explain why Urumqi has a higher prevalence of HUA than the national average by considering these three factors.32,33 Due to the distance from the sea, the proportion of purine-rich seafood consumed in Xinjiang is much lower than in China’s coastal cities. This may explain why the prevalence is lower in Urumqi than in the Pearl River Delta region.12 To conclude, dietary habits may play an essential role in HUA.
A higher prevalence of HUA was observed in this study in the 18–24 years age group (35.65%) and the 25–34 years age group (30.15%), which was higher than the previous prevalence in the 35–44 years age group (7.3%) in Xinjiang and even higher than the youth physical examination of males in Shanghai (29.9%).11,34 Based on these findings, it appears that HUA is more prevalent among young people in Urumqi. This is perhaps a result of their dietary habits, which tend to be high in purines and proteins, and their preference for alcohol consumption.35–37
The main ethnic composition of Xinjiang was Han, Uygur, and Kazak. It was found by Liu et al that HUA prevalence was higher in Han than in Uygur and Kazak,11 and our findings were similar. Genetic background is likely responsible for the condition, in addition to dietary habits. Several studies have found differences in gene expression related to UA metabolism among various ethnic groups in Xinjiang.16,38,39 Our results showed the highest prevalence of HUA in Manchu (38.46%), which was higher than the prevalence reported in 2015–2016 (10.3%) and 2018–2019 (13.0%).40 A possible explanation for this difference may be due to the study’s small sample size of Manchu.
Different risk profiles were found in our study. Compared to (35–44 years) age group, men had a reduced risk of HUA in the older group. However, women had a higher risk. This was in line with the majority of previous studies.41,42 The reasons for the increased risk in women in the older age groups may be related to menopause, when hormone levels in women change, which will directly affect urine excretion.43
This study revealed an increased risk of HUA in overweight, obese, and abdominally obese participants compared to normal individuals, as reported by Wang et al.44 The mechanism may be related to the fact that higher BMI and higher waist circumference mediate insulin resistance and leptin production, both of which reduce UA excretion.45 Meanwhile, the accumulation of visceral fat in abdominal obese individuals allows free fatty acids to flow into the liver, where the excess fatty acids stimulate TG synthesis, which ultimately leads directly to an increase in UA synthesis by activating the de novo synthesis pathway of purines.46,47 Moreover, the prevalence of overweight/obesity in Urumqi was 60.8%, which is consistent with the findings of Xiao et al in 2019 (62.7%),48 so one of the reasons for the higher prevalence of HUA in Urumqi than at the national level can be explained by the high prevalence of overweight/obesity. Previous studies have found that the TyG index was a better predictor of HUA.21 In our results, a higher TyG index was associated with higher prevalence, SUA levels, and risk of HUA in both men and women.
The association between HUA and BP was also investigated. Previous studies have shown that hypertension is a risk factor for HUA in both men and women,49 but our study found that higher DBP only increased the risk among men. The mechanism may be that chronic hypertension causes renal microvascular ischemia and hypoxia, increasing lactate production, which competitively inhibits UA excretion and increases SUA.50 In addition, some hypertensive patients’ long-term use of diuretics reduces blood volume, which increases renal reabsorption of UA and induces HUA.51
In male participants, higher FPG levels were protective factors for HUA by the mechanism that UA and glucose reabsorption in the renal proximal tubule go through the same carrier transport, and elevated blood glucose competitively inhibits UA reabsorption.49 However, it was not statistically significant for female participants. This is consistent with the results of Shen et al.49 Previous studies have observed differences in the relationship between diabetes and HUA in both genders.20 A Swedish study found that SUA levels increased with increasing blood glucose levels, with a subsequent decrease when blood glucose levels were up to 7.0 mmol/L in men and 9.0 mmol/L in women.52 This suggests an inflection point difference in the relationship between UA and diabetes according to gender.Further research is needed to clarify the mechanisms underlying gender differences in the relationship between diabetes and HUA. HUA is strongly associated with CVD,53 and elevated SUA levels in patients with CVD could result from reduced glomerular filtration rate, renal vasoconstriction, tissue ischemia, oxidative stress and/or diuretic therapy treatments.54 However, no association between HUA and CHD was found in our results. This inconsistency may be due to the patient’s self-reported past history being less accurate.
Our study is limited in some respects. First, due to the nature of the cross-sectional study, the causal relationship between risk factors and HUA could not be determined. Second, this study was only a partial evaluation of the factors influencing HUA. It is necessary to consider the influence of other factors, such as dietary patterns and physical activity. Third, past history and medication history from participants’ self-report may have some influence on the results, and to reduce this influence, we analyzed the subgroup that had no past history and the study results remained consistent. However, the advantages of this study are also worth mentioning. In addition to the Han, Uygur, and Kazak in previous studies, we also recruited the Hui, Mongolian, Manchu, and Xibe. We grouped participants according to different characteristics and analyzed HUA’s prevalence and risk factors, providing an overall picture and updated information on HUA in Xinjiang.
Conclusions
These findings indicated that Urumqi, Xinjiang has a high prevalence of HUA, with a trend toward younger onset. HUA is associated with obesity/overweight, DBP, FPG, TyG index, abdominal obesity, and dyslipidemia, so it is urgent to intervene in these factors to prevent HUA, and the underlying mechanisms of these relationships need to be clarified further.
Data Sharing Statement
All data generated or analyzed during this study are included in this article. Further inquiries can be directed to the corresponding author.
Ethics Approval and Informed Consent
This study was conducted according to the guidelines laid down in the Declaration of Helsinki and all procedures involving research study participants were approved by the Clinical Research Ethics Subcommittee of the Ethics Committee of the People’s Hospital of Xinjiang Uygur Autonomous Region (Approval number: KY2023011801). Informed consent was obtained from all subjects.
Consent for Publication
Details in this study can be published, and the persons providing consent were informed of the article’s contents.
Acknowledgments
We thank all participants for their support of our work. We also thank the Health Management Center, People’s Hospital of Xinjiang Uygur Autonomous Region for its significant contribution to data collection. We acknowledge the Scientific Research and Education Center, People’s Hospital of Xinjiang Uygur Autonomous Region for their support.
Funding
This study was supported by the “Tianshan Talent Program” of Xinjiang Uygur Autonomous Region (grant number 201720277).
Disclosure
None of the authors have any potential conflicts of interest associated with this research.
References
1. Vitart V, Rudan I, Hayward C, et al. SLC2A9 is a newly identified urate transporter influencing serum urate concentration, urate excretion and gout. Nat Genet. 2008;40(4):437–442. doi:10.1038/ng.106
2. Yanai H, Adachi H, Hakoshima M, Katsuyama H. Molecular Biological and Clinical Understanding of the Pathophysiology and Treatments of Hyperuricemia and Its Association with Metabolic Syndrome, Cardiovascular Diseases and Chronic Kidney Disease. Int J Mol Sci. 2021;22(17):9221. doi:10.3390/ijms22179221
3. You A, Li Y, Shen C, et al. Associations of non-traditional cardiovascular risk factors and body mass index with metabolic syndrome in the Chinese elderly population. Diabetol Metab Syndr. 2023;15(1):129. doi:10.1186/s13098-023-01047-4
4. Ali N, Mahmood S, Islam F, et al. Relationship between serum uric acid and hypertension: a cross-sectional study in Bangladeshi adults. Sci Rep. 2019;9(1):9061. doi:10.1038/s41598-019-45680-4
5. Haque T, Rahman S, Islam S, Molla NH, Ali N. Assessment of the relationship between serum uric acid and glucose levels in healthy, prediabetic and diabetic individuals. Diabetol Metab Syndr. 2019;11:49. doi:10.1186/s13098-019-0446-6
6. Molla NH, Kathak RR, Sumon AH, et al. Assessment of the relationship between serum uric acid levels and liver enzymes activity in Bangladeshi adults. Sci Rep. 2021;11(1):20114. doi:10.1038/s41598-021-99623-z
7. Chen-Xu M, Yokose C, Rai SK, Pillinger MH, Choi HK. Contemporary Prevalence of Gout and Hyperuricemia in the United States and Decadal Trends: the National Health and Nutrition Examination Survey 2007–2016. Arthritis Rheumatol. 2019;71(6):991–999. doi:10.1002/art.40807
8. Koto R, Nakajima A, Horiuchi H, Yamanaka H. Real-world treatment of gout and asymptomatic hyperuricemia: a cross-sectional study of Japanese health insurance claims data. Mod Rheumatol. 2021;31(1):261–269. doi:10.1080/14397595.2020.1784556
9. Piao W, Zhao L, Yang Y, et al. The Prevalence of Hyperuricemia and Its Correlates among Adults in China: results from CNHS 2015–2017. Nutrients. 2022;14(19):4095. doi:10.3390/nu14194095
10. Huang J, Ma ZF, Zhang Y, et al. Geographical distribution of hyperuricemia in mainland China: a comprehensive systematic review and meta-analysis. Global Health Research and Policy. 2020;5(1):52. doi:10.1186/s41256-020-00178-9
11. Liu F, Du G-L, Song N, et al. Hyperuricemia and its association with adiposity and dyslipidemia in Northwest China: results from cardiovascular risk survey in Xinjiang (CRS 2008–2012). Lipids Health Dis. 2020;19(1):58. doi:10.1186/s12944-020-01211-z
12. Aihemaitijiang S, Zhang Y, Zhang L, et al. The Association between Purine-Rich Food Intake and Hyperuricemia: a Cross-Sectional Study in Chinese Adult Residents. Nutrients. 2020;12(12):3835. doi:10.3390/nu12123835
13. Jamnik J, Rehman S, Blanco Mejia S, et al. Fructose intake and risk of gout and hyperuricemia: a systematic review and meta-analysis of prospective cohort studies. BMJ Open. 2016;6(10):e013191. doi:10.1136/bmjopen-2016-013191
14. Han Q-X, Zhang D, Zhao Y-L, et al. Risk Factors For Hyperuricemia In Chinese Centenarians And Near-Centenarians. Clin Interv Aging. 2019;14:2239–2247. doi:10.2147/CIA.S223048
15. Choi HK. A prescription for lifestyle change in patients with hyperuricemia and gout. Curr Opin Rheumatol. 2010;22(2):165–172. doi:10.1097/BOR.0b013e328335ef38
16. Wang X, Wang J, Zhao C, Song J, Tian G, Li Y. Polymorphism of ABCG2 Gene in Hyperuricemia Patients of Han And Uygur Ethnicity with Phlegm/Non-Phlegm Block in Xinjiang, China. Med Sci Monit. 2018;24:6305–6312. doi:10.12659/MSM.908552
17. Yuan Q, Karmacharya U, Liu F, Chen BD, Ma X, Ma YT. Uric acid and its correlation with hypertension in postmenopausal women: a multiethnic study (Observational study). Clin Exp Hypertens. 2020;42(6):559–564. doi:10.1080/10641963.2020.1739697
18. Wu L, Kuerbanjiang SX, et al. The prevalence of hyperuricemia in Xinjiang Kazaks in Fuhai. Chine J Internal Med. 2015;54(11):931–935.
19. Wu LJ, Song XY. Epidemiological study on hyperuricemia and gout in Uygur population in Turpan area of Xinjiang. J Peking Univ. 2012;44(2):250–253.
20. Song P, Wang H, Xia W, Chang X, Wang M, An L. Prevalence and correlates of hyperuricemia in the middle-aged and older adults in China. Sci Rep. 2018;8(1):4314. doi:10.1038/s41598-018-22570-9
21. Kahaer M, Zhang B, Chen W, et al. Triglyceride Glucose Index Is More Closely Related to Hyperuricemia Than Obesity Indices in the Medical Checkup Population in Xinjiang, China. Front Endocrinol (Lausanne). 2022;13:861760. doi:10.3389/fendo.2022.861760
22. Fang J, Alderman MH. Serum Uric Acid and Cardiovascular Mortality The NHANES I Epidemiologic Follow-up Study, 1971–1992. National Health and Nutrition Examination Survey. JAMA. 2000;283(18):2404–2410. doi:10.1001/jama.283.18.2404
23. Joint Committee for Guideline Revision. 2018 Chinese Guidelines for Prevention and Treatment of Hypertension-A report of the Revision Committee of Chinese Guidelines for Prevention and Treatment of Hypertension. J Geriatr Cardiol. 2019;16(3):182–241. doi:10.11909/j.issn.1671-5411.2019.03.014
24. Alberti KG, Zimmet PZ. Definition, diagnosis and classification of diabetes mellitus and its complications. Part 1: diagnosis and classification of diabetes mellitus. Provisional report of a WHO Consultation. Diabet Med. 1998;15(7):539–553. doi:10.1002/(SICI)1096-9136(199807)15:7<539::aid-dia668>3.0.CO;2-S
25. China Joint Committee for the Revision of the Guidelines for the Prevention and Treatment of Dyslipidemia in Adults. Joint committee issued Chinese guideline for the management of dyslipidemia in adults. Chin J Cardiol. 2016;44(10):833–853.
26. China Expert Consensus Writing Committee on the Medical Nutrition Treatment of Overweight/Obesity. Expert consensus on the medical nutrition treatment of overweight/obesity in China (2016 edition). Chin J Diabetes Mellitus. 2016;8(9):525–540.
27. Choi D, Choi S, Son JS, Oh SW, Park SM. Impact of Discrepancies in General and Abdominal Obesity on Major Adverse Cardiac Events. J Am Heart Assoc. 2019;8(18):e013471. doi:10.1161/JAHA.119.013471
28. Kim Y, Kang J, Kim GT. Prevalence of hyperuricemia and its associated factors in the general Korean population: an analysis of a population-based nationally representative sample. Clin Rheumatol. 2018;37(9):2529–2538. doi:10.1007/s10067-018-4130-2
29. You L, Liu A, Wuyun G, Wu H, Wang P. Prevalence of hyperuricemia and the relationship between serum uric acid and metabolic syndrome in the Asian Mongolian area. J Atheroscler Thromb. 2014;21(4):355–365. doi:10.5551/jat.20529
30. Yang Y, Hu XM, Chen TJ, Bai MJ. Rural-Urban Differences of Dietary Patterns, Overweight, and Bone Mineral Status in Chinese Students. Nutrients. 2016;8(9):537. doi:10.3390/nu8090537
31. Liu W, Liu W, Wang S, et al. Prevalence and Risk Factors Associated with Hyperuricemia in the Pearl River Delta, Guangdong Province, China. Risk Manag Healthc Policy. 2021;14:655–663. doi:10.2147/RMHP.S293913
32. Lyu X, Du Y, Liu G, et al. Prevalence and influencing factors of hyperuricemia in middle-aged and older adults in the Yao minority area of China: a cross-sectional study. Sci Rep. 2023;13(1):10185. doi:10.1038/s41598-023-37274-y
33. Zhang M, Ye C, Wang R, et al. Association between Dietary Acid Load and Hyperuricemia in Chinese Adults: analysis of the China Health and Nutrition Survey (2009). Nutrients. 2023;15(8):1806. doi:10.3390/nu15081806
34. She D, Wang Y, Liu J, et al. Changes in the prevalence of hyperuricemia in clients of health examination in Eastern China, 2009 to 2019. BMC Endocr Disord. 2022;22(1):202. doi:10.1186/s12902-022-01118-z
35. Miao Z, Li C, Chen Y, et al. Dietary and lifestyle changes associated with high prevalence of hyperuricemia and gout in the Shandong coastal cities of Eastern China. J Rheumatol. 2008;35(9):65.
36. Choi HK, Atkinson K, Karlson EW, Willett W, Curhan G. Purine-rich foods, dairy and protein intake, and the risk of gout in men. N Engl J Med. 2004;350(11):1093–1103. doi:10.1056/NEJMoa035700
37. Choi HK, Liu S, Curhan G. Intake of purine-rich foods, protein, and dairy products and relationship to serum levels of uric acid: the Third National Health and Nutrition Examination Survey. Arthritis Rheum. 2005;52(1):283–289. doi:10.1002/art.20761
38. Yu JH, He X, Zhang B. Correlation of the polymorphism of rs2231142 loci in ABCG2 gene with hyperuricemia in Han and Uygur population. Chin J Clin Lab Sci. 2015;33(2):142–146.
39. Zhang B, Lu Y, Kahaer M, et al. Association study on IL-8 gene rs4073 locus and hyperuricemia in males in Xinjiang Uygur. Int J Lab Med. 2019;40(10):1161–1164.
40. Zhang M, Zhu X, Wu J, et al. Prevalence of Hyperuricemia Among Chinese Adults: findings From Two Nationally Representative Cross-Sectional Surveys in 2015–16 and 2018–19. Front Immunol. 2022;12:791983. doi:10.3389/fimmu.2021.791983
41. Yu S, Yang H, Guo X, et al. Prevalence of hyperuricemia and its correlates in rural Northeast Chinese population: from lifestyle risk factors to metabolic comorbidities. Clin Rheumatol. 2016;35(5):1207–1215. doi:10.1007/s10067-015-3051-6
42. Liu L, Lou S, Xu K, Meng Z, Zhang Q, Song K. Relationship between lifestyle choices and hyperuricemia in Chinese men and women. Clin Rheumatol. 2013;32(2):233–239. doi:10.1007/s10067-012-2108-z
43. Puig JG, Mateos FA, Ramos TH, Capitán CF, Michán AA, Mantilla JM. Sex differences in uric acid metabolism in adults: evidence for a lack of influence of estradiol-17 beta (E2). Adv Exp Med Biol. 1986;195:317–323. doi:10.1007/978-1-4684-5104-7_54
44. Wang YY, Li L, Cui J, et al. Associations between anthropometric parameters (body mass index, waist circumference and waist to Hip ratio) and newly diagnosed hyperuricemia in adults in Qingdao, China: a cross-sectional study. Asia Pac J Clin Nutr. 2020;29(4):763. doi:10.6133/apjcn.202010/PP.0006
45. de Oliveira EP, Burini RC. High plasma uric acid concentration: causes and consequences. Diabetol Metab Syndr. 2012;4:12. doi:10.1186/1758-5996-4-12
46. Li C, Hsieh MC, Chang SJ. Metabolic syndrome, diabetes, and hyperuricemia. Curr Opin Rheumatol. 2013;25(2):210–216. doi:10.1097/BOR.0b013e32835d951e.
47. Han T, Meng X, Shan R, et al. Temporal relationship between hyperuricemia and obesity, and its association with future risk of type 2 diabetes. INT J OBESITY. 2018;42(7):1336–1344. doi:10.1038/s41366-018-0074-5
48. Xiao W, Wumaer A, Maimaitiwusiman Z, Liu J, Xuekelati S, Wang H. Heat maps of cardiovascular disease risk factor clustering among community-dwelling older people in Xinjiang: a cross-sectional study. BMJ Open. 2022;12(8):e058400. doi:10.1136/bmjopen-2021-058400
49. Shen Y, Wang Y, Chang C, Li S, Li W, Ni B. Prevalence and risk factors associated with hyperuricemia among working population at high altitudes: a cross-sectional study in Western China. Clin Rheumatol. 2019;38(5):1375–1384. doi:10.1007/s10067-018-4391-9
50. Kuwabara M, Kodama T, Ae R, et al. Update in uric acid, hypertension, and cardiovascular diseases. Hypertens Res. 2023;46(7):1714–1726. doi:10.1038/s41440-023-01273-3
51. Khan M, Khan RA, Islam F, Laghari J, Jamali SN. To study the efficacy of Losartan on urinary uric acid excretion in Thiazide induced hyperuricemic and hypertensive patients. Pak J Pharm Sci. 2011;24(4):583–587.
52. Whitehead TP, Jungner I, Robinson D, Kolar W, Pearl A, Hale A. Serum urate, serum glucose and diabetes. Ann Clin Biochem. 1992;29(Pt 2):159–161. doi:10.1177/000456329202900206
53. Cheng Z, Zheng T, Zhang D, et al. High-level uric acid in asymptomatic hyperuricemia could be an isolated risk factor of cardio-cerebrovascular diseases: a prospective cohort study. Nutr Metab Cardiovasc Dis. 2021;31(12):3415–3425. doi:10.1016/j.numecd.2021.08.043
54. Skoczyńska M, Chowaniec M, Szymczak A, Langner-Hetmańczuk A, Maciążek-Chyra B, Wiland P. Pathophysiology of hyperuricemia and its clinical significance - A narrative review. Reumatologia. 2020;58(5):312–323. doi:10.5114/reum.2020.100140
 © 2023 The Author(s). This work is published and licensed by Dove Medical Press Limited. The full terms of this license are available at https://www.dovepress.com/terms.php and incorporate the Creative Commons Attribution - Non Commercial (unported, v3.0) License.
By accessing the work you hereby accept the Terms. Non-commercial uses of the work are permitted without any further permission from Dove Medical Press Limited, provided the work is properly attributed. For permission for commercial use of this work, please see paragraphs 4.2 and 5 of our Terms.
© 2023 The Author(s). This work is published and licensed by Dove Medical Press Limited. The full terms of this license are available at https://www.dovepress.com/terms.php and incorporate the Creative Commons Attribution - Non Commercial (unported, v3.0) License.
By accessing the work you hereby accept the Terms. Non-commercial uses of the work are permitted without any further permission from Dove Medical Press Limited, provided the work is properly attributed. For permission for commercial use of this work, please see paragraphs 4.2 and 5 of our Terms.