Back to Journals » International Journal of Chronic Obstructive Pulmonary Disease » Volume 14
Prevalence and prognostic ability of the GOLD 2017 classification compared to the GOLD 2011 classification in a Norwegian COPD cohort
Authors Le LAK ![]() , Johannessen A
, Johannessen A ![]() , Hardie JA, Johansen OE
, Hardie JA, Johansen OE ![]() , Gulsvik A, Vikse BE, Bakke P
, Gulsvik A, Vikse BE, Bakke P
Received 9 November 2018
Accepted for publication 17 May 2019
Published 23 July 2019 Volume 2019:14 Pages 1639—1655
DOI https://doi.org/10.2147/COPD.S194019
Checked for plagiarism Yes
Review by Single anonymous peer review
Peer reviewer comments 3
Editor who approved publication: Prof. Dr. Richard Russell
Lan Ai Kieu Le,1 Ane Johannessen,2,3 Jon Andrew Hardie,2 Odd Erik Johansen,4,5 Amund Gulsvik,2 Bjørn Egil Vikse,1,2 Per Bakke2
1Department of Medicine, Haugesund Hospital, Haugesund, Norway; 2Department of Clinical Medicine, University of Bergen, Bergen, Norway; 3Centre for International Health, Department of Global Public Health and Primary Care, University of Bergen, Bergen, Norway; 4Department of Medicine, Bærum Hospital, Gjettum, Norway; 5Boehringer Ingelheim Norway KS, Asker, Norway
Rationale: The Global Initiative for Chronic Obstructive Lung Disease (GOLD) 2017 is based on an ABCD assessment tool of symptoms and exacerbation history and grade 1–4 of airflow limitation severity, facilitating classification either into 4 groups (ABCD) or 16 groups (1A-4D). We aimed to compare the GOLD 2011, GOLD 2017 ABCD, and GOLD 2017 1A-4D classifications in terms of their distribution and prediction of mortality and hospitalizations.
Methods: In the GenKOLS study, 912 COPD patients with FEV1 less than 80% of the predicted answered questionnaires and performed lung function testing in 2003–2005. The patients were recruited from a hospital patient registry (n=662) and from the general population (n=250), followed up until 2011 with respect to all-cause and respiratory mortality, and all-cause and respiratory hospitalizations. We performed logistic regression and receiver operating curve (ROC) analyses for the different classifications with estimations of area under the curve (AUC) for comparisons.
Results: Mean age at baseline was 60 years (SD 11), 55% were male. Mean duration of follow-up was 91 months. By GOLD 2011, 21% were classified as group A, 29% group B, 6% group C, and 43% as group D, corresponding percentages for GOLD 2017 were: 25%, 52%, 3%, and 20%. The GOLD 2011 classification had higher AUC values than the GOLD 2017 group ABCD classification for respiratory mortality and hospitalization, but after inclusion of airflow limitation severity in GOLD 2017 groups 2A–4D, AUC values were significantly higher with GOLD 2017.
Conclusion: In a clinically relevant sample of COPD patients, the GOLD 2017 classification doubles the prevalence of group B and halves the prevalence of groups C and D as compared to the GOLD 2011 classification. The prediction of respiratory mortality and respiratory hospitalization was better for GOLD 2017 2A–4D taking airflow limitation severity into account, as compared to GOLD 2017 ABCD and GOLD 2011.
Keywords: respiratory, hospitalization, mortality, Cox regression, ABCD classification, airflow limitation
Introduction
Chronic obstructive pulmonary disease (COPD) is a common, preventable, and treatable disease that is characterized by persistent respiratory symptoms and airflow limitation.1 COPD is predominantly defined according to guidelines from the Global Initiative for Chronic Obstructive Lung Disease (GOLD). The first guidelines were published in 1997 and have since been regularly updated with the latest version launched in 2017.2
The 2011 update of GOLD introduced the ABCD groups and was a major step forward from the simple grading of airflow limitation severity of COPD as it also included level of respiratory symptoms and exacerbation history in the COPD classification. However, both Johannessen et al3 and Soriano et al4 had compared GOLD 2007 and GOLD 2011 classifications and showed that the 2011 classification was more complicated but did not predict mortality and hospitalization any better than the grading of airflow limitation severity. To meet these concerns, the 2017 update of GOLD has separated grading of airflow limitation severity (grade 1–4) from the ABCD groups. Spirometry is now used to diagnose COPD and grade airflow limitation severity, while the ABCD groups are based on symptoms and exacerbation history and are used to guide pharmacotherapy.
The PLATINO study5 and a Danish study by Gedebjerg et al6 have compared the prognostic ability of the new GOLD 2017 with the GOLD 2011 classification in clinically recruited patients. The GenKOLS study included clinically recruited patients with FEV1<80% of the predicted and had eight-year follow-up with respect to all-cause and respiratory mortality and hospitalizations. The aim of the present study was to compare the prognostic ability of the GOLD 2011 classification with the GOLD 2017 ABCD groups and the GOLD 2017 2A–4D groups (taking both airflow limitation severity and ABCD classification into account).
Methods
Study population
The subjects included in the present study were part of the GenKOLS study, which was performed in the period 2003–2005. This study has previously been described in detail.7 Briefly, the patients were recruited from a hospital patient registry (n=662) and from the general population (n=250) with participants with reduced FEV1. Main inclusion criteria were age >40 years, >2.5 pack-years of smoking history, and a post-bronchodilator FEV1/FVC <0.70 and FEV1<80% of the predicted (full inclusion and exclusion criteria are given in the online supplement). The participant consent was written informed consent before inclusion in the study, and the study was approved by the Regional Ethics Committee in Western Norway. The study was conducted in accordance with the Declaration of Helsinki.
All patients underwent clinical examination and spirometry8 was measured.9 In addition, all patients answered questionnaires regarding comorbidities (diabetes type 2, heart attack and/or angina pectoris, high blood pressure), smoking habits, respiratory symptoms (chronic cough, phlegm, wheeze), and previous COPD exacerbations.10 The modified Medical Research Council (mMRC) questionnaire on dyspnea was also completed, but not the COPD assessment test (CAT).
The patients were classified according to the GOLD 2011 and GOLD 2017 assessment tools;11 the GOLD 2011 classification of patients into four ABCD groups is based on FEV1% of predicted, self-reported severity of dyspnea (mMRC questionnaire), and COPD exacerbations defined as self-reported number of exacerbations requiring prednisolone or antibiotics 12 months before study inclusion. The GOLD 2017 classification of patients into four ABCD groups is based only on self-reported severity of dyspnea (mMRC questionnaire) and COPD exacerbations. GOLD 2017 group 2A–4D is a combination of airflow limitation (grade 2–4) severity and GOLD 2017 ABCD groups.
Outcomes
We retrieved information on all-cause mortality and respiratory mortality for the study participants for the period January 2003 through June 2011 from the National Cause of Death Registry in Norway. Respiratory mortality was defined as main or underlying cause of death ICD-10 codes J40 through J47. All the death certificates were validated manually through comparing mortality registrations with hospital registries. Information on hospitalizations was collected from patient registries for the same time period (ie, from January 2003 through June 2011). We extracted information on total number of hospital admissions based on all causes and based on respiratory causes (ICD-10 codes J40 through J47) and on total number of admission days based on all causes and on respiratory causes.
Statistics
All statistical analyses were performed using Stata/SE 14.0 (StataCorp, College Station, TX) software for Windows. All p-values were two-sided, and values <0.05 were considered statistically significant. We performed descriptive analyses to assess differences in baseline characteristics between the GOLD 2011 and GOLD 2017 ABCD groups. In these analyses, we used Chi-square test and Fisher’s exact test for categorical variables and Kruskal–Wallis test for continuous variables (mean (standard deviation) is given). Descriptive analyses regarding GOLD 2011 and GOLD 2017 distributions stratified by gender are provided in Figures S1 and S2. We further examined the GOLD 2011 and GOLD 2017 distributions stratified by sampling source (ie, the general population vs the patient population) to examine how the distribution differed. In addition, we estimated Kaplan–Meier curves for mortality outcomes regarding GOLD 2011 and GOLD 2017 classifications. The predictive abilities of GOLD 2011, GOLD 2017 ABCD, and GOLD 2017 2A–4D classifications for all-cause and respiratory mortality and hospitalization were compared using logistic regression analyses to enable multivariate post hoc receiver operating curve (ROC) estimations and intramodel area under the curve (AUC) comparisons. Both unadjusted analyses and adjusted analyses with adjustments for gender, age, smoking (yes/no and pack-years), body mass index, and comorbidities (diabetes, angina/heart attack, high blood pressure) were performed. Tests for interactions between GOLD classifications and gender and age were performed. The Stata procedures implemented to obtain ROC curves and AUC comparisons were lroc and roccomp. This procedure also provides a chi-squared test for difference in AUCs between two estimated models using the same set of observations. AUC varies between 0 and 1. An AUC of 1 indicates a perfect diagnostic tool with 100% sensitivity and 100% specificity. An AUC of 0.5 implies no discriminative value. To supplement the logistic regression analyses, we performed Cox proportional hazards regression with Harrell’s C concordance statistic estimates for all mortality and hospitalization outcomes, using the estat concordance postestimation tool in Stata. Harrell’s C corresponds with the area under the Receiver Operating Characteristic (ROC) curve and ranges from 0.5 to 1, where 0.5 indicates that the model’s prediction is purely random and 1 indicates that we have perfect discrimination; the model will predict mortality with 100% accuracy. These analyses are presented in the online supplement.
Results
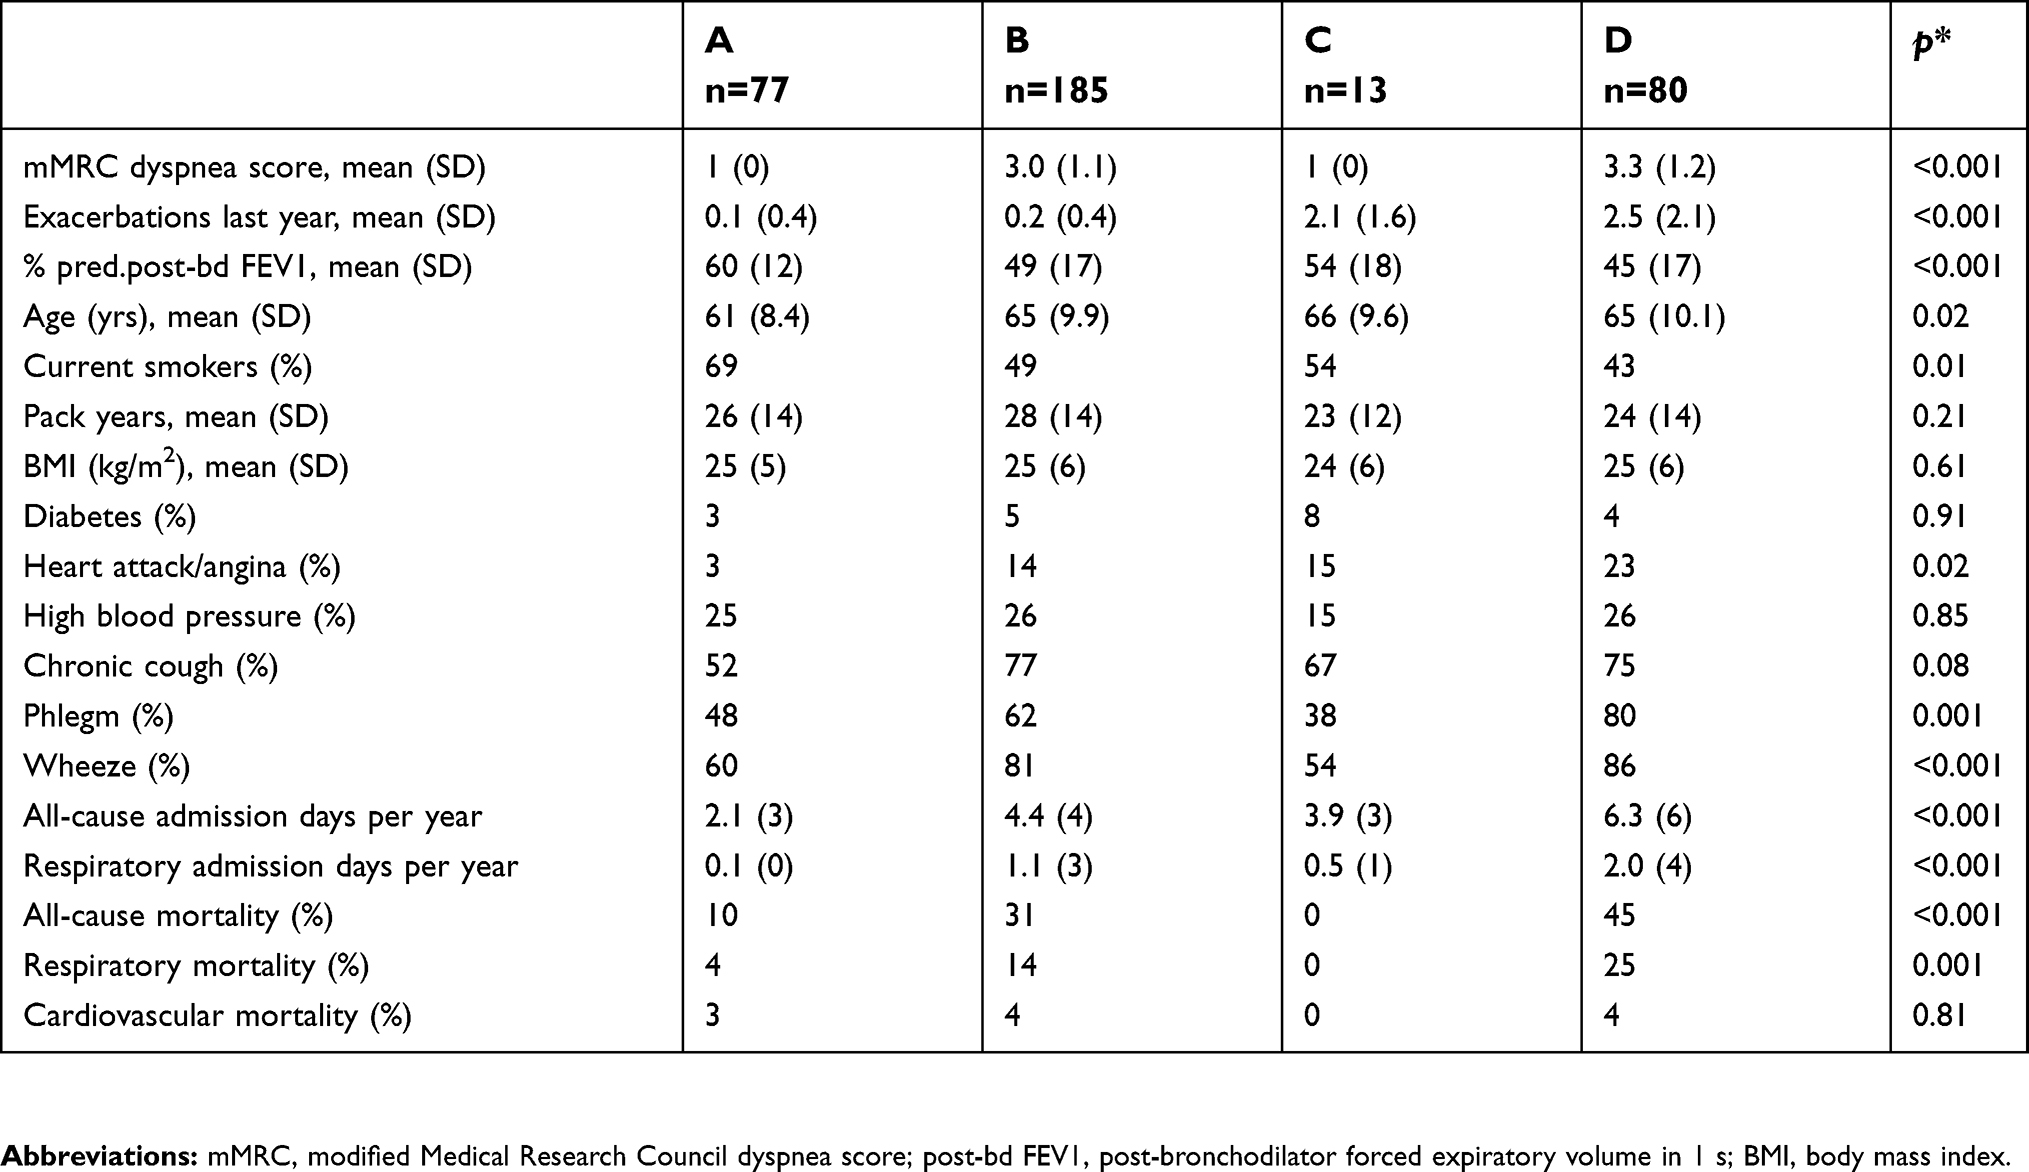
Median follow-up time was 91 months, and mean (standard deviation) follow-up time due to deaths before the end of follow-up period was 77 (25) months. Characteristics of the study population by GOLD 2011 and GOLD 2017 ABCD classifications are presented in Table 1. Based on GOLD 2017 ABCD groups, the patients with more dyspnea (groups B and D) were older, reported less current smoking, and coronary heart disease. They also had more chronic cough, phlegm, and wheeze, than those with less dyspnea (groups A and C). These analyses were repeated with gender stratification (Table S1 and S2), and these analyses showed similar findings as for the total cohort.
 |
Table 1 Characteristics of participants in the GenKOLS study 2003–2005 by GOLD 2011 and GOLD 2017 ABCD classifications |
Figure 1 shows the distribution of patients according to the GOLD 2011 and GOLD 2017 ABCD classifications. Based on the 2017 categories, fewer patients were classified in groups C and D, whereas more patients were classified in group B, as compared to the 2011 classification. Only 2.7% were in GOLD 2017 group C, encompassing patients with little dyspnea but numerous exacerbations. As expected, participants classified as GOLD 2017 group A had more often lower degree of airflow limitation, whereas group D had more often a higher degree of airflow limitations (Table 2). There were no significant gender differences (Figure 1). Table 3 shows that for GOLD 2011 groups A and B, most participants received the same ABCD classification in GOLD 2017. For GOLD 2011 group C, most participants were classified as group A in GOLD 2017, and for GOLD 2011 group D, most participants were classified as group B in GOLD 2017.
 |
Table 2 GOLD 2011 and GOLD 2017 ABCD classifications by GOLD airflow limitation severity stages 2–4 |
 |
Table 3 GOLD 2017 ABCD classification by GOLD 2011 |
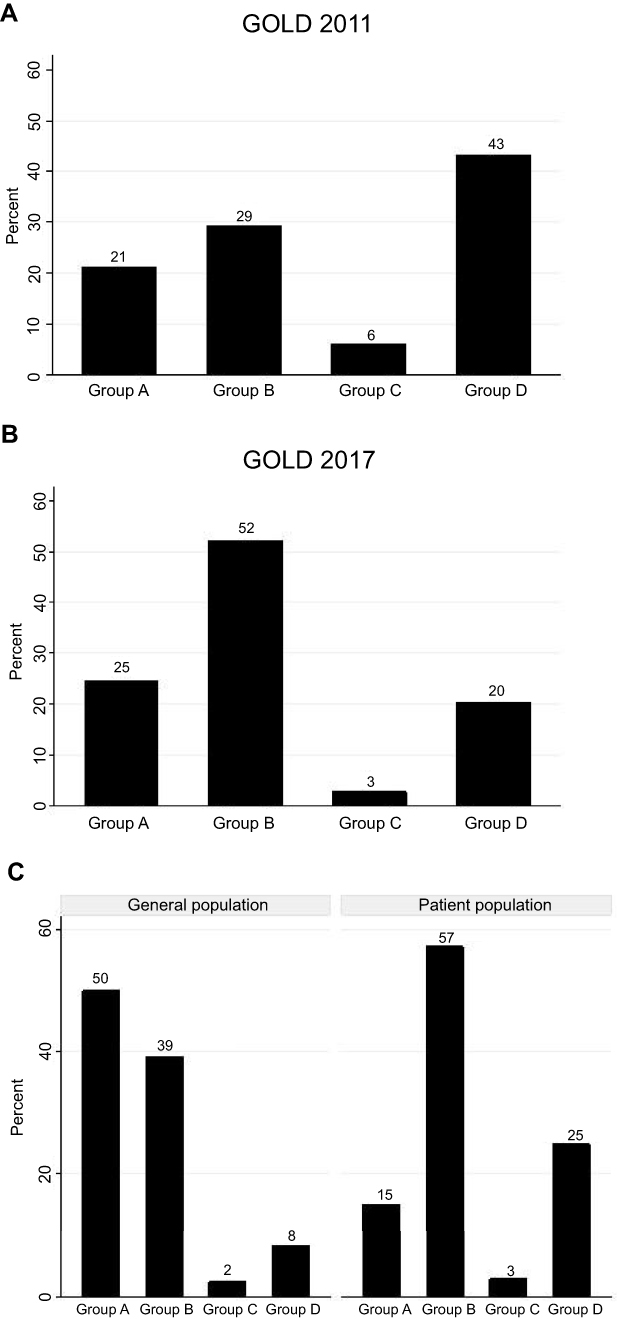 |
Figure 1 Distribution of subjects in GOLD groups. (A) GOLD 2011 classification. (B) GOLD 2017 classification. (C) GOLD 2017 classification, separated by sampling source (250 subjects from general population and 662 from a patient population). |
The present cohort included patients both from the general population and from a hospital registry. As can be seen from Figure 1C, the majority of subjects recruited from the general population sample were assigned to groups A and B, whereas those recruited from the hospital registry were less often group A, but more often groups B and D.
Mortality
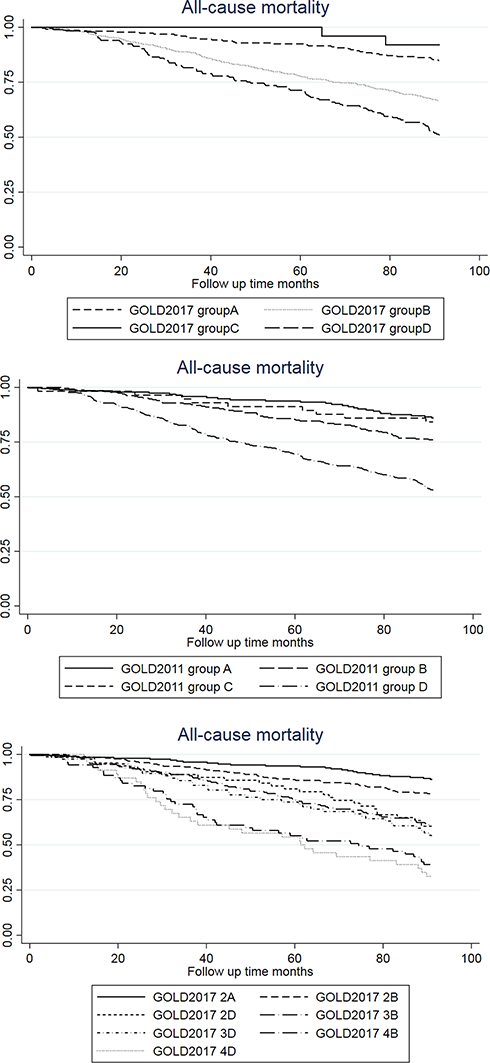
The Kaplan–Meier plots showed that for the GOLD 2017 classification, the overall and respiratory mortality was increased in GOLD groups B and D as compared to group A (Figure 2 for respiratory mortality and Figure 2 for all-cause mortality). For the GOLD 2011 classification, we only observed increased risk for group D. For GOLD 2017 groups 2A–4D, the highest respiratory mortality was seen in groups 4B and 4D (Figure 3).
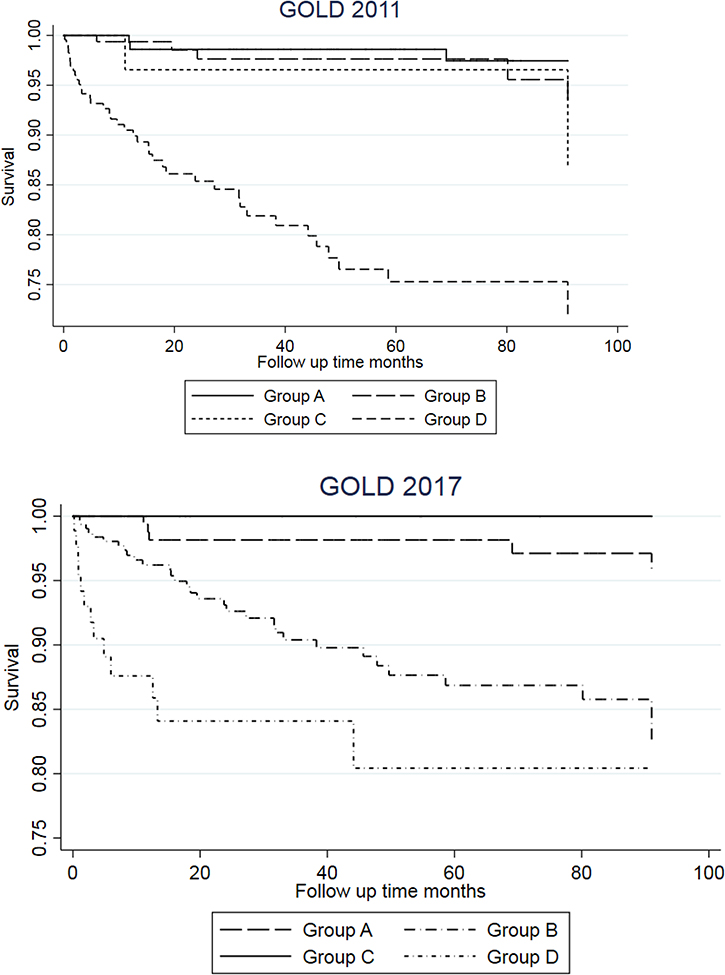 |
Figure 2 Kaplan–Meier graphs for respiratory mortality for GOLD 2011 and GOLD 2017 ABCD. |
 |
Figure 3 Kaplan–Meier graph for respiratory mortality for GOLD 2017 2A–4D. Note: Group 2C, 3C, and 4C are excluded because of the very low number of outcome. |
Logistic regression analyses of risk of all-cause mortality and respiratory mortality were performed separately for the GOLD 2011, GOLD 2017 ABCD, and GOLD 2017 2A–4D groups (Table 4). For all-cause mortality, group D in GOLD 2011 and GOLD 2017 ABCD had the highest risk and groups 4B and 4D had the highest risks in GOLD 2017 2A–4D. GOLD 2017 group C seemed to have lower all-cause mortality than groups A and B, but results for this group should be interpreted with caution due to the low number of subjects. For respiratory mortality, increased risk was seen for GOLD 2011 group D, GOLD 2017 groups B and D, and GOLD 2017 2A–4D groups 2D, 3B, 3D, 4B, and 4D. No interactions between gender and GOLD 2017 classification were shown, but there was borderline significant protective interaction between age and the GOLD 2017 classification (p-value 0.056 for all-cause mortality and 0.041 for respiratory mortality). Receiver operating curve (ROC) statistics for all-cause mortality of the GOLD 2011, GOLD 2017 ABCD, and GOLD 2017 2A–4D groups revealed largest AUC for GOLD 2017 2A–4D groups for all-cause mortality (Table 4 and Figure 4). For respiratory mortality, AUC was higher for GOLD 2011 as compared to GOLD 2017 ABCD, but highest AUC was seen for GOLD 2017 2A–4D groups.
 |
Table 4 Mortality outcomes by GOLD 2011, GOLD 2017 ABCD and GOLD 2017 2A–4D classifications. Univariate and multivariate logistic regression analyses with post hoc receiver operating curve estimations (8-year follow-up of the GenKOLS study) |
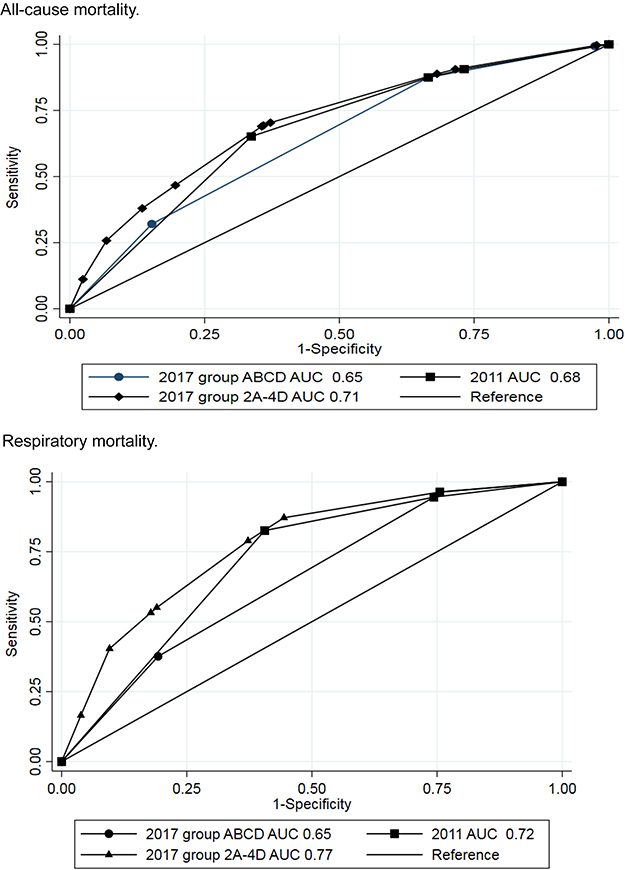 |
Figure 4 Comparison of univariate area-under-the curve analyses for GOLD 2011, GOLD 2017 ABCD, and GOLD 2017 2A–4D. Separate analyses for all-cause mortality and respiratory mortality. |
The results were further confirmed by the Cox regression analyses presented in Table S3. Estimations of Harrell’s C statistics in univariate and multivariate analyses showed that GOLD 2017 2A–4D classification overall had the best predictive ability and GOLD 2017 ABCD had lower predictive ability than GOLD 2011. Predictive ability was best for respiratory mortality with unadjusted Harrell’s C of 0.73 for GOLD 2011, 0.67 for GOLD 2017 ABCD, and 0.77 for GOLD 2017 2A–4D.
Hospitalization
Logistic regression analyses of risk of all-cause hospitalization and respiratory hospitalization were performed separately for the GOLD 2011, GOLD 2017 ABCD, and GOLD 2017 2A–4D groups (Table 5). In these analyses, GOLD 2011 groups B, C, and D had increased risk of both all-cause and respiratory hospitalization, GOLD 2017 groups B and D had increased risk of both all-cause and respiratory hospitalization and GOLD 2017 groups 2B, 2C, 2D, 3B, 3D, 4B, and 4D had increased risk of both all-cause and respiratory hospitalization. The highest risk estimates for respiratory hospitalization were seen for GOLD 2017 groups 3D, 4B, and 4D. No interactions between gender and GOLD 2017 classification was shown, but there was borderline significant interaction between age and the GOLD 2017 classification for all-cause hospitalizations (p-value 0.046 for all-cause hospitalization and 0.5 for respiratory hospitalizations).
 |
Table 5 All-cause and Respiratory hospitalizations (0 OR≥1) by GOLD 2011 and GOLD 2017 classifications and Univariate and Multivariate logistic regression analyses with post hoc receiver operating curve estimations |
ROC statistics for all-cause hospitalization showed that GOLD 2017 2A–4D classification had significantly higher AUC than GOLD 2011. For respiratory hospitalization, GOLD 2011 had significantly higher AUC than GOLD 2017 ABCD, but the highest AUC was seen using GOLD 2017 2A–4D groups.
The Cox regression statistics confirmed the results from the logistic regression statistics (Table S4). Harrell’s C-statistic with regard to all-cause hospitalization was, however, the same for all three classifications with unadjusted values 0.60–0.62. For respiratory hospitalization, the unadjusted values for GOLD 2011, GOLD 2017 ABCD, and GOLD 2017 2A–4D were 0.72, 0.69, and 0.77, respectively.
Discussion
In the present study of a community-based sample of COPD patients, we made two main findings. First, the GOLD 2017 ABCD classification doubles the prevalence of group B and halves the prevalence of groups C and D as compared to the GOLD 2011 classification. The ECLIPSE study showed similar findings.12 Second, the predictive ability for respiratory mortality and respiratory hospitalization was significantly better when using the GOLD 2011 classification as compared to the GOLD 2017 ABCD classification. Cabrerea-Lopez et al showed in the BODE cohort that GOLD 2017 was a less accurate predictor of mortality than GOLD 2011.13 In the Danish study by Gedebjerg et al, GOLD 2017 does not predict all-cause or respiratory mortality more accurately than GOLD 2011.6 The novelty of the present study is, after inclusion of GOLD airflow limitation severity in GOLD 2017 2A–4D, GOLD 2017 2A–4D classification has the best predictive ability for respiratory mortality and respiratory hospitalizations.
The present study is based on a community-based sample of COPD patients which consisted of patients from both the general population and a hospital-based population. Participants from the general population were more often classified as groups A or B using both the GOLD 2011 and 2017 classifications. In the patient population of our study, a large number of the patients were shifted from groups C and D in GOLD 2011 to groups A and B in GOLD 2017. The shift was explained by the fact that airway limitation was included in the GOLD 2011, but not in the GOLD 2017 ABCD classification. This was in accordance with findings by Soriano et al who showed that the majority of patients in groups C and D using the GOLD 2011 classification were comprised by subjects that met the FEV1 criterion alone.4
As expected, we observed higher respiratory mortality and risk of respiratory hospitalization in groups B and D as compared to group A in all GOLD classifications. This was similar in the PLATINO study which showed lower mortality rates in groups A and B than in groups C and D for all-cause mortality.5 Johannessen et al found that the predictive ability of GOLD 2011 in terms of respiratory mortality and respiratory hospitalization did not differ significantly from the predictive ability of the airflow limitation severity stages used in the GOLD 2007 classification.3 In the present study, the predictive ability for respiratory mortality of GOLD 2011 is however better than that of the GOLD 2017 ABCD classification. The GOLD 2A–4D classification with inclusion both of grade 1–4 of airflow limitation severity and symptom and exacerbation history (groups ABCD) did however show the best predictive ability. It has been argued that airflow limitation severity loses precision at the individual patient level and thus cannot be used alone to determine therapeutic options.2 In the GOLD 2017 classification, airflow limitation was therefore separated from symptoms and exacerbations, and the pharmacological treatment was targeted according to the assessment of symptoms or risk of exacerbations. Celli et al, however, reported airflow limitation (FEV1) to be the best single correlate of mortality.14 In the ECLIPSE study, the best single predictor of all-cause mortality was FEV1.12 Severity of airflow limitation is a key risk factor for exacerbation requiring hospitalization.15 In our study, airflow limitation rate has important prognostic importance for respiratory mortality and respiratory hospitalization (exacerbations), and with registry data suggesting that dynamic improvement in GOLD severity is associated with improved outcomes, and vice versa16 this aspect cannot be ignored in patient management. Hence, although the ABCD classification in GOLD 2017 is simpler in clinical practice, our and others findings indicate that airflow limitation is an important parameter that should be included in prognostic assessments. Our observation therefore adds to other observations in the evolving field of precision-based medicine on establishing the most relevant predictive factors for risk of death and other outcomes in people with COPD. Since others have identified that combining age with dyspnea and airway obstruction is superior to other models in predicting death,17 one area for future research could be to assess whether incorporating age to the GOLD 2017 2A–4D further enhanced the predictability.
In our study, 2% of the participants from the general population and 3% from the patient population were classified as group C in GOLD 2017. A similar result was shown in the population-based PLATINO study of the 2011 GOLD classification in which 10 of 524 COPD patients (1,9%) were classified in group C.5 Soriano et al argued that class C in 2011 classification might be superfluous.4 Our data indicate that this might be the same in the 2017 classification and that while group C conferred no increased risk for all-cause or respiratory mortality, risks for all-cause or respiratory hospitalization were at the level of group B.
The most prominent strength of the present study is the large and robust population with complete follow-up data. The study is based on an extensive amount of information gathered from each of the 912 participants in the study population. The length of the follow-up period, which is essential when it comes to mortality in a middle-aged population, was a solid eight years. Furthermore, all death certificates were thoroughly validated.7 Even though the limited sample size in GOLD group C might have limited the study in respect to identifying possible statistically significant associations, the material at hand should be extensive enough to provide a statistically sound basis for the analysis and the conclusions. Characteristics of our included patients are also similar to other studies, eg, the PLATINO study and the study by Flynn et al and our results should thus be valid also for other populations.5,16 For the scope of our study, numerous statistical methodologies could have been implemented. One option at hand is the Cohen’s Kappa in descriptive analyses to add to the understanding of accordance between the GOLD 2011 and GOLD 2017 classifications. A valuable alternative to the inter-model discrimination investigation we have performed could also have been to assess if each model was well calibrated or not (ie, how similar the expected and observed event rates are in subgroups of the population) using the Hosmer–Lemeshow test. Also other statistics could be used to compare the prognostic ability of the classifications, for example, calculations of NRI and/or IDI.18 The methodologies used in the present study – logistic regression to enable multivariate posthoc ROC curve estimations and intramodel AUC comparisons, and Cox regression with posthoc Harrell’s C concordance statistic estimations – are tailored to match the study by Johannessen et al comparing the GOLD 2007 and GOLD 2011 classifications.3 The present study is a continuation of the study by Johannessen et al, based on the same study population and moving the focus from GOLD 2007 vs GOLD 2011 to GOLD 2011 vs GOLD 2017.
A weakness is that the cohort does not include GOLD stage 1 participants. However, since 96–99% of GOLD stage I participants probably would be assigned to the low-risk groups A or B,19,20 the included GOLD stages 2–4 are clinically most significant. The primary aim of the GOLD classifications is not to provide long-term prognosis, but rather to provide a consistent framework for the more immediate treatment and follow-up. Thus, it could be argued that the present study’s long-term focus is of less importance. We counter that by pointing out that a more complete picture of the predictive ability of the GOLD 2017 classification potentially might improve long-term planning. Through better planning of long-term treatment, better management of early interventions and systematic follow-up of high-risk patients, all based on baseline characteristics, prognosis might be improved. GenKOLS was not designed to test the predictive ability of the GOLD classifications, and only the severe COPD exacerbations leading to hospitalization are recorded as outcome. Unfortunately, that leaves out valuable information about mild or moderate exacerbations from the available material. The result of this study may not be extended to all COPD patients because three out of four participants are general population, were identified from a hospital registry. Lastly, the CAT score is not recorded, while the alternative21 mMRC score was recorded and used, application of both the CAT and mMRC scores would have increased the proportion of patients classified as groups B and D. Further, we do not adjust for dynamic changes in GOLD stages, which might have lead to under- or overestimation of association with outcomes. The result of this study may not be extended to all COPD patients because three out of four participants are general population, were identified from a hospital registry.
In conclusion, GOLD 2011 had better predictive ability than GOLD 2017 ABCD, but after inclusion of airflow limitation severity in GOLD 2017 2A–4D, GOLD 2017 2A–4D had best predictive abilities. GOLD 2017 ABCD might be easier for clinicians in terms of therapeutic options because it is less complex, but the cost seems to be lower predictive ability. One might question whether GOLD 2017 group C is justified as few patients seem to be classified into this group. Our findings need confirmation in further studies, but our study shows that airflow limitation (grade 1–4) should be included in the classification of COPD patients.
Disclosure
Professor Jon Hardie reports personal fees from AstraZeneca, outside the submitted work. Dr Odd Erik Johansen is an employee of Boehringer Ingelheim. The authors report no other conflicts of interest in this work.
References
1. Vogelmeier CF, Criner GJ, Martinez FJ, et al. Global strategy for the diagnosis, management and prevention of chronic obstructive lung disease 2017 report. Eur Respir J. 2017;49(3). pii: 1700214. doi:10.1183/13993003.00214-2017
2. Global strategy for the diagnosis, management and prevention of chronic, obstructive pulmonary disease; 2017. Available from: http://goldcopd.org. Accessed June 1, 2019.
3. Johannessen A, Nilsen RM, Storebø M, et al. Comparison of 2011 and 2007 global initiative for chronic obstructive lung disease guidelines for predicting mortality and hospitalization. Am J Respir Crit Care Med. 2013;188(1):51–59. doi:10.1164/rccm.201212-2276OC
4. Soriano JB, Lamprecht B, Ramirez AS, et al. Mortality prediction in chronic obstructive pulmonary disease comparing the GOLD 2007 and 2011 staging systems: a pooled analysis of individual patient data. Lancet Repir Med. 2015;3:443–450. doi:10.1016/S2213-2600(15)00157-5
5. Menezes AM, Wehrmeister FC, Perez-Padilla R, et al. The PLATINO study: description of the distribution, stability, and mortality according to the global initiative for chronic obstructivve lung disease classification from 2007 to 2017. Int J Chron Obstcut Pulm Dis. 2017;12:1491–1501. doi:10.2147/COPD.S136023
6. Gedebjerg A, Szepligeti SK, Wackerhausen L-MH, et al. A cohort study: prediction of mortality in patients with chronic obstructive pulmonary disease with the new global initiative for chronic obstructive lung disease 2017 classification. Lancet Respir Med. 2018;6:
7. Sorheim IC, Johannessen A, Grydeland TB, et al. Case-control studies on risk factors for chronic obstructive pulmonary disease: how does the sampling of the cases and controls affects the reults? Clin Respir J. 2010;4:89–96. doi:10.1111/j.1752-699X.2009.00154.x
8. Johannessen A, Skorge TD, Bottai M, et al. Mortality by level of emphysema and airway wall thickness. Am J Respir Crit Care Med. 2013;187:602–608. doi:10.1164/rccm.201209-1722OC
9. Grydeland TB, Thorsen E, Dirksen A, et al. Quantitative CT measures of emphysema and airway wall thickness are relatied to D(L)C0. Respir Med. 2011;105:343–351. doi:10.1016/j.rmed.2010.10.018
10. Grydeland TB, Dirksen A, Coxson HO, et al. Quantitative computed tomography measure of emphysema and airway wall thickness are related to respiratory symptoms. Am J Respir Crit Care Med. 2010;181:353–359. doi:10.1164/rccm.200907-1008OC
11. Rabe KF, Hurd S, Anzueto A, Global Initiative for Chronic Obstructive Lung Disease, et al. Global strategy for the diagnosis management, and prevention of chronic obstructive pulmonary disease: GOLD executive summary. Am J Respir Crit Care Med. 176;2007:532–555. doi:10.1164/rccm.200703-456SO
12. Rosa F, Guillaune N, Joan RB, et al. Distribution, temporal stability and association with all-cause mortality of the 2017 GOLD groups in the ECLIPSE cohort. Respir Med. 2018;141:14–19. doi:10.1016/j.rmed.2018.06.015
13. Lopez DCC, Macario DCC, Trigo DMMM, et al. Comparison of 2017 and 2015 global initiative for obstructive lung disease:impact on grouping and outcomes. Am J Res Crit Care Med. 2018;197(4):463–469. doi:10.1164/rccm.201707-1363OC
14. Celli BR, Snider GL, Heffner J, et al. Standard for the diagnosis and care of patients with chronic obstructive pulmonary disease. Am J Respir Crit Care Med. 1995;152:S77–S120.
15. Halpin DMG, Miravtiles M, Norbert M et al. Impact and prevention of severe exacerbations of COPD: a review of the evidence. Int J Chron Obstruc Pulmon Dis. 2017;12:2891–2908. doi:10.2147/COPD.S139470
16. Flynn RWV, MacDonald TM, Chalmers JD, Schembri S. The effect of changes to GOLD severity stage on long term morbidity and mortality in COPD. Respir Res. 2018;19:249. doi:10.1186/s12931-018-0960-3
17. Morales DR, Flynn R, Zhang J, Trucco E, Quint JK, Zutis K. External validation of ADO, DOSE, COTE and CODEX at predicting death in primary care patients with COPD using standard and machine learning approaches. Respir Med. 2018;138:150–155. doi:10.1016/j.rmed.2018.04.003
18. Pencina MJ, D’Agostino RB, D’Agostino RB, Vasan RS. Evaluating the added predictive ability of a new marker: from area under the ROC curve to reclassification and beyond. Stat Med. 2008;27:157–172. doi:10.1002/sim.2929
19. Soriano JB, Alfageme I, Almagro P, et al. Distributionn and prognostic validity of the new global initiative for chronic obstructive lung disease grading classification. Chest. 2013;143(U39):694–702. doi:10.1378/chest.12-1053
20. Nishimura M. Lessons for COPD from the GOLD 2017 report. Respirology. 2017;22:621. doi:10.111/resp.13038
21. Goossens LM, Leimer I, Metzdorf N, et al. Does the 2013 GOLD classification improve the ability to predict lung function decline, exacerbations and mortality: a post-hoc analysis of the 4-year UPLIFT trial. BMC Pulm Med. 2014;14:163. doi:10.1186/1471-2466-14-163
Supplementary material
Inclusion and exclusion criteria for the GenKOLS study
Common inclusion criteria for both cases and controls were:
- Self‐reported Caucasian.
- Age ≥40 years.
- Current or ex‐smoker with a minimum of 2.5 pack‐years.
- No severe alpha‐1 antitrypsin deficiency (ZZ, Z Null, Null‐Null or SZ) assessed by PI type.
- No previous chronic pulmonary disorder (other than COPD for the cases). Inactive tuberculosis and previous diagnosis of asthma were not exclusion criteria.
- No HIV, hepatitis B or C, dementia, severe anemia (defined as hemoglobin≤9.0g/dL), previous organ transplantation, or lung–volume reduction surgery.
- No antibiotics for respiratory disease within 1 month of the visit, and no respiratory infection within 6 weeks of the visit.
- Able and willing to sign an informed consent form. In addition, cases were required to have spirometry‐defined COPD with a postbronchodilator (post‐BD) FEV1/FVC<0.7 and FEV1<80% (GOLD stage II or worse). Controls were required to have post‐BD FEV1/FVC≥0.7 and FEV1≥80%. Predicted values of FEV1 were assessed using equations from a Norwegian reference population.
Table S1 Characteristics of female participants in the GenKOLS study 2003–2005, by GOLD 2017 classification
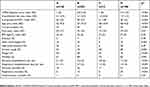
Table S2 Characteristics of male participants in the GenKOLS study 2003–2005, by GOLD 2017 classification
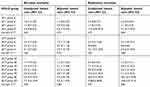
Table S3 Mortality outcomes by GOLD 2011 and GOLD 2017 classifications, unadjusted and adjusted cox regression statistics
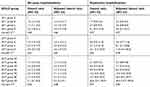
Table S4 All-cause and respiratory hospitalization by GOLD 2011 and GOLD 2017 classifications, univariate and multivariate* Cox proportional hazards regression analyses

Figure S1 Distribution (%) of female and male by GOLD 2011 classification and by GOLD 2017 classification.

Figure S2 Kaplan–Meier graphs for all-cause mortality according to GOLD 2011, GOLD 2017 ABCD and GOLD 2017 2A–4D.


 © 2019 The Author(s). This work is published and licensed by Dove Medical Press Limited. The
full terms of this license are available at https://www.dovepress.com/terms
and incorporate the Creative Commons Attribution
- Non Commercial (unported, 3.0) License.
By accessing the work you hereby accept the Terms. Non-commercial uses of the work are permitted
without any further permission from Dove Medical Press Limited, provided the work is properly
attributed. For permission for commercial use of this work, please see paragraphs 4.2 and 5 of our Terms.
© 2019 The Author(s). This work is published and licensed by Dove Medical Press Limited. The
full terms of this license are available at https://www.dovepress.com/terms
and incorporate the Creative Commons Attribution
- Non Commercial (unported, 3.0) License.
By accessing the work you hereby accept the Terms. Non-commercial uses of the work are permitted
without any further permission from Dove Medical Press Limited, provided the work is properly
attributed. For permission for commercial use of this work, please see paragraphs 4.2 and 5 of our Terms.