")
Back to Journals » Patient Preference and Adherence » Volume 18
Prevalence and Correlators of Diabetes Distress in Adults with Type 2 Diabetes: A Cross-Sectional Study
Authors Zhang YY , Li W, Sheng Y, Wang Q, Zhao F, Wei Y
Received 9 October 2023
Accepted for publication 9 January 2024
Published 13 January 2024 Volume 2024:18 Pages 111—130
DOI https://doi.org/10.2147/PPA.S442838
Checked for plagiarism Yes
Review by Single anonymous peer review
Peer reviewer comments 2
Editor who approved publication: Dr Jongwha Chang
Yu-Yun Zhang,1 Wei Li,2 Yu Sheng,1 Qun Wang,3,* Fang Zhao,4,* Ying Wei4
1School of Nursing, Chinese Academy of Medical Sciences & Peking Union Medical College, Beijing, People’s Republic of China; 2Department of Endocrinology, Peking Union Medical College Hospital, Beijing, People’s Republic of China; 3Endocrinology and Metabolism Department, Peking University Third Hospital, Beijing, People’s Republic of China; 4Department of Endocrinology, China-Japan Friendship Hospital, Beijing, People’s Republic of China
*These authors contributed equally to this work
Correspondence: Yu Sheng, School of Nursing, Chinese Academy of Medical Sciences & Peking Union Medical College, No. 33 Badachu Road, Shijingshan District, Beijing, People’s Republic of China, Tel +86 138 1069 1298, Email [email protected]
Purpose: To address the prevalence of diabetes distress (DD) and its correlators in adults with type 2 diabetes.
Patients and Methods: During 2021 and 2022, we conducted a cross-sectional study in three Class A tertiary comprehensive hospitals in China, and received 947 participants who completed a printed survey covering DD, demographic, diabetic, physiological, and psychosocial factors. We used Jonckheere-Terpstra, chi-square, and Fisher’s exact tests to assess intergroup differences between different levels of DD. We used ordinal logistic regression analysis to analyze correlators of DD further.
Results: The prevalence of DD was 34.64%. In univariate analysis, those with lower satisfaction with financial status, longer durations of diabetes, more complications, higher glycemia, more severe insomnia, treatment by medications only, poorer lifestyle interventions, fewer self-care activities, more types and frequencies of insulin injections, and spending more money and time on treatment were susceptible to DD. Type D personality, negative illness perceptions, negative coping styles, and psychological effects of major life events were related to higher DD. Hope, self-efficacy, positive coping styles, and social support can reduce DD. In ordinal logistic regression analysis, hypoglycemic episode (β=− 1.118, p=0.019, “have hypoglycemic” as reference) and Brief Illness Perception Questionnaire (β=0.090, p< 0.001) were significant positive correlators for DD, while diet intervention (β=0.803, p=0.022, “have diet intervention” as reference), money spent on diabetes treatment (β<-0.001, p=0.035), and SES (β=− 0.257, p< 0.001) were significant negative correlators.
Conclusion: More than one-third of Chinese adults with type 2 diabetes experience moderate or high levels of DD. DD was associated with financial, diabetic, physiological, and psychosocial status.
Keywords: correlation of data, psychological distress, psychosocial factors, type 2 diabetes
Introduction
The prevalence of diabetes, which currently affects 537 million adults worldwide and 144 million adults in China (including the mainland, Hong Kong, Macao, and Taiwan of China), is increasing rapidly.1 Type 2 diabetes accounts for over 95.00% of all diabetes cases.2 As a challenging and multifaceted disease, type 2 diabetes is closely related to mental health problems3 —up to two-fifths of adults with type 2 diabetes experience emotional problems.4 Diabetes distress (DD) is a diabetes-specific psychological problem.3 It is a series of negative emotional responses to having diabetes, which encompasses the worries, fears, and frustrations caused by living with and managing diabetes daily.5 Studies have shown that 36% (95% CI [2%, 84%]) of adults with type 2 diabetes globally experience DD, and approximately 50% (95% CI [39%, 60%]) of patients in China experience DD.6,7 It is highly associated with worse health outcomes and higher healthcare costs.4
According to the comprehensive task-based model (CTBM) (Figure 1),8 which was proposed by Samson et al in 2008 after integrating four task models by Moos, Cohen, Corr, and Samson, the effects of type 2 diabetes and its treatment and management process are common stressors that initiate the process of psychological and social adaptation of individuals to chronic diseases. Under the influence of specific personal and social backgrounds, patients made an initial cognitive assessment of type 2 diabetes, resulting in understanding, perception, attention, and emotional responses to the disease consequences, symptoms, and duration of type 2 diabetes. In the second cognitive assessment, patients developed a perception of personal and therapeutic control of type 2 diabetes and a sense of self-efficacy in disease management. Patients used different coping styles to complete part or all of the type 2 diabetes adaptation tasks. Good adaptation results in little or no DD, whereas poor adaptation results in moderate and high DD.
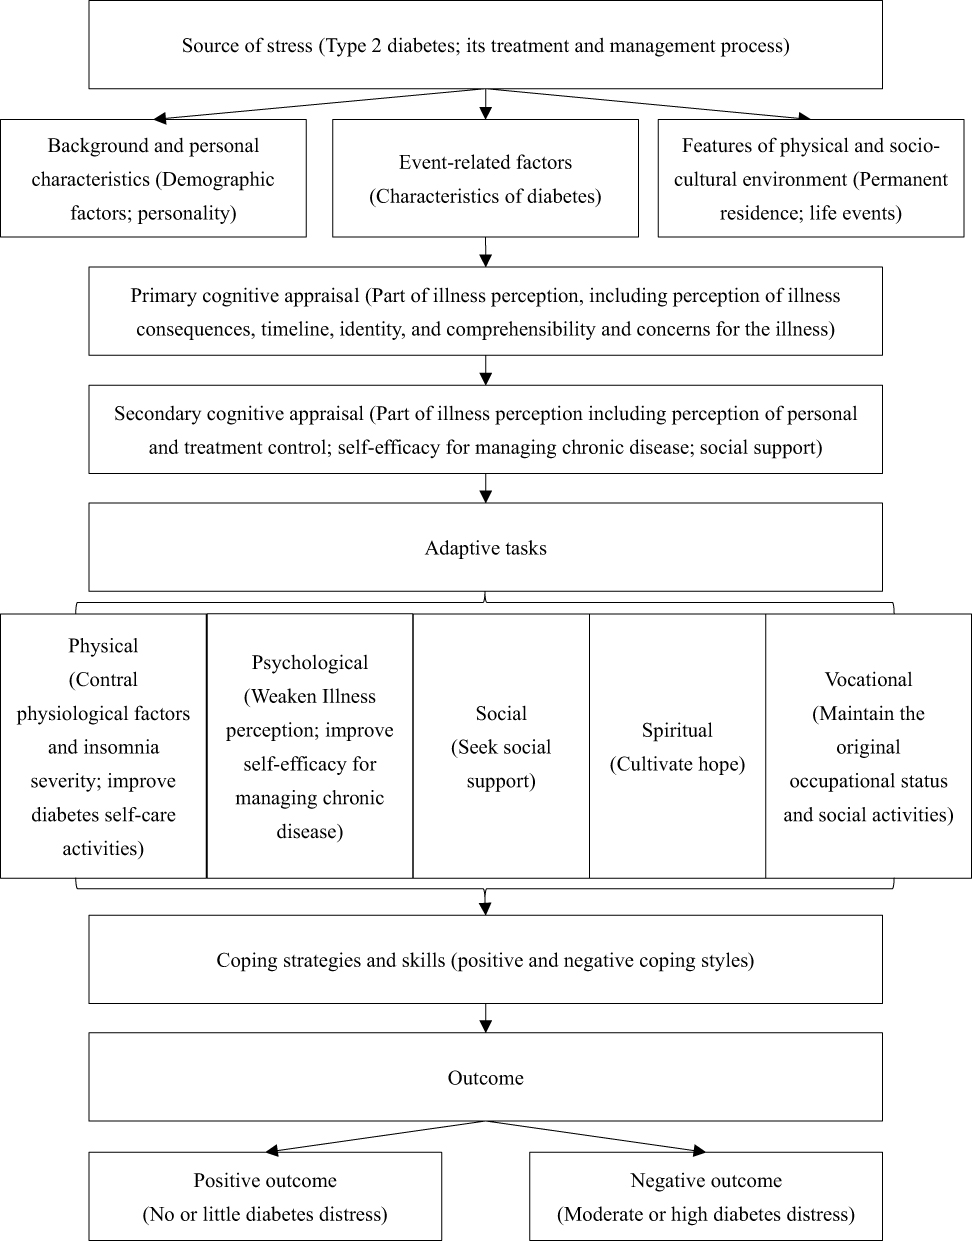 |
Figure 1 Comprehensive task-based model adjusted for diabetes distress in patients with type 2 diabetes. |
Accordingly, the severity of DD is associated with demographic factors, which include younger age, female sex, minority ethnicity, no religious affiliation, residence in rural areas, unmarried status, lower educational level, unemployed status, and lower-income.9–11 The characteristics of type 2 diabetes, including duration, complications, comorbidities, complex therapeutic requirements, and treatment locations, are also associated with DD.3,9 Living habits, including poor self-management, sleep disorders, smoking, and drinking, are also identified factors of DD.9,10 Physiological indices, including overweight, hyperglycemia, hypertension, hyperlipidemia, and poor renal function, are related to higher DD scores.10,12 Patients with type D personality, negative perception of the disease, low self-efficacy, negative coping styles, and lack of social support also had higher levels of DD than others.9,11,13
In 1996, Denollet proposed the “type D personality”.14 Type D personality, the distressed personality type, integrates negative affectivity (NA) and social inhibition (SI). People with type D personality tend to worry, take a pessimistic perspective, and keep others at a distance, and they often feel unhappy or irritated, inhibit expression of their true feelings, have symptoms of depression and chronic tension, have low subjective well-being and low levels of perceived social support.14
This paper aims to investigate the prevalence of DD in adults with type 2 diabetes and explore the associations of DD with demographics, diabetic characteristics, living habits, physiological factors, and psychological factors in Beijing, China. We hypothesized that demographics, diabetic characteristics, living habits, physiological factors, and psychological factors would be significantly associated with DD, and some of these factors would significantly affect or predict the levels of DD.
Materials and Methods
Study Design and Participants
To address the prevalence of DD and its correlators in adults with type 2 diabetes living in Beijing, China, we conducted a cross-sectional study from June 7, 2021, to January 19, 2022.
We calculated sample size with G*Power 3.1.9.7, using the priori power analysis for logistic regression by Demidenko’s procedure with variance correction and assuming odds ratio (OR)=1.5, null hypothesis (H0)=0.5, two tailed α=0.05, power level 1-β=0.95, R2=0.6, and normal distributed independent variable. The estimated minimum sample size was 843. Considering 10% of invalid questionnaires, the minimum of 937 participants were required. Finally, we recruited 961 adults with type 2 diabetes from the department of endocrinology of three Class A tertiary comprehensive hospitals in Beijing, China, by convenience sampling.
The inclusion criteria were diagnosis of type 2 diabetes by endocrinologists according to the World Health Organization’s 1999 Diagnosis and Classification of Diabetes Mellitus, aged ≥18 years, clear consciousness, the ability to understand and communicate in written or spoken Chinese, signed informed consent, and voluntary participation.
Those with severe cognitive impairment or the inability to cooperate, express clearly, or act independently; those with acute or severe complications, such as those who are in diabetic ketoacidosis, a hypoglycemic state, or on dialysis; those with serious comorbidities, such as severe or acute cardiac, cerebral, pulmonary, hepatic and renal diseases, severe or acute infections, tumors, immune system diseases or hematologic diseases; those with clearly diagnosed severe mental disorders (including schizophrenia, schizoaffective disorder, paranoid psychosis, bipolar affective disorder, mental disorders due to epilepsy, intellectual disability with mental disorders or long-term use of antipsychotic drugs; and those missing more than 20% of the items in the questionnaire were excluded.
Data Collection Process
After being approved by the ethics committee, registered in trial registry, and obtained support from medical staffs in the study sites, we selected individuals meeting the inclusion criteria to ask their participation willingness. First, the researcher introduced herself to the potential participants, explained the purpose and significance of the study, and promised to follow the ethical principles of voluntary, confidentiality, fairness, benefit and harmlessness.
After they voluntarily participate and signed the informed consent form, the participants’ data were collected by face-to-face on-site paper-based questionnaire survey. For those who can fill in answers by themselves, the researcher clearly explained the contents and requirements of each part, and then the participants filled the questionnaire by themselves. For those who cannot complete the written questionnaires due to visual or education limitations, the researcher used unified guidance to describe the contents, questions and options of all questions and items, and filled out the questionnaire following the patients’ answers. After checking, if there were any missing or wrong items, the researcher had assisted participants to complete and modify them.
After investigation, we give 3 medical surgical masks to each participant as gift.
Measurements
According to the DD generation process supposed by the CTBM,8 the paper-based questionnaire included the following scales and questions that were measured in order:
- We used researcher-designed questions to elicit demographic factors, including sex, age, ethnic group, religion, permanent residence, marital status, educational level, employment status, occupation, primary payment of medical expenses, financial satisfaction, and monthly income.
- We used researcher-designed questions to elicit characteristics of diabetes, including duration, comorbidities, complications, family history, main treatment spot, treatment regimens, methods, participation in earlier and/or current intervention programs, and money and time spent on treatment per month.
- We used the 17-item Chinese Diabetes Distress Scale (C-DDS17), which includes emotional burden, physician distress, regimen distress, and interpersonal distress, to measure DD.5 Scores are rated from “1=not a problem” to “6=a severe problem”. Scores less than 2.00 indicate “little or no distress”. Scores no less than 2.00 but less than 3.00 are considered “moderate distress”. Scores equal to or more than 3.00 indicate “high distress”. The Cronbach’s alpha of the scale was 0.90, and the four subdimensions were 0.83, 0.78, 0.80, and 0.83.
- We used the Summary of Diabetes Self-Care Activities (SDSCA) to evaluate self-management behaviors.15 It is an eight-point Likert scale reflecting the number of days of self-care behaviors over the past seven days, covering general diet, specific diet, physical activity, blood glucose monitoring, foot care, and medication. We calculated the score by averaging item responses, where higher scores show more frequent self-care activities. The Cronbach’s alpha was 0.67.
- We used the Insomnia Severity Index (ISI) scale, which consists of seven questions scored from zero to four, to evaluate the participants’ sleeping status.16 We divided the scores for the severity of insomnia into an absence of insomnia (scored 0‒7), subthreshold insomnia (scored 8‒14), moderate insomnia (scored 15‒21), and severe insomnia (scored 22‒28).17 The Cronbach’s alpha was 0.89. We assessed smoking and drinking habits with researcher-designed questions.
- Physiological factors included participants’ body shapes, blood pressure, blood glucose, lipids, and renal function indices. We assessed participants’ body shapes by body mass index (BMI = weight [kg]/square of height [m2]), waist-hip ratio (WHR = waist circumference [cm]/hip circumference [cm]), and waist-height ratio (WHtR = waist circumference [cm]/height [cm]).18 We measured participants’ waist and hip circumferences with the same tape measure. We took their weight, height, systolic blood pressure (SBP), and diastolic blood pressure (DBP) from their medical records. We assessed blood glucose by HbA1c, fasting blood glucose (FBG), and 2-hour postprandial blood glucose (2hPBG). Serum lipids included serum levels of total cholesterol (TC), triglyceride (TG), high-density lipoprotein cholesterol (HDL-C), and low-density lipoprotein cholesterol (LDL-C). Renal function was reflected by serum creatinine (SCr), serum uric acid (SUA), and urinary albumin‒creatinine ratio (ACR). We took these indices from laboratory test reports.
- We measured participants’ personality by the Chinese version of the Type D Personality Scale-14 (DS-14), which is a five-point Likert scale with scores ranging from “0=false” to “4=true” and consisting of social inhibition (SI) and negative affectivity (NA) subdimensions.19 Participants were categorized as having type D personalities if their SI and NA scores were not less than 10 points, whereas the SI and NA scores of those with non-type D personalities were below 10 points. Only one dimension reaching 10 points indicates social inhibition personality (SI≥10, NA<10) or negative affectivity personality (SI<10, NA≥10). The Cronbach’s alpha of the scale, SI, and NA were 0.88, 0.75, and 0.88, respectively.
- We used the 12-item Chinese version of the Herth Hope Index (HHI) to measure participants’ hope.20 It is a four-point Likert scale rating from “1=strongly disagree” to “4=strongly agree”, and it consists of three subscales: the inner sense of temporality and future (T), inner positive readiness and expectancy (P), and interconnectedness with self and others (I). Higher scores reflect higher levels of hope. We divided hope into low level (scored 12‒23), medium level (scored 24‒35), and high level (scored 36‒48). The Cronbach’s alpha of the scale and subscales were 0.87, 0.63, 0.71, and 0.69, respectively.
- We used the Chinese version of the Brief Illness Perception Questionnaire (BIPQ) to assess the illness perception of type 2 diabetes.21 The items cover cognitive and emotional illness representations and are scored from 0 to 10. The total score is the sum of all item responses. A higher total score indicates a stronger perception of the threat of illness. The Cronbach’s alpha was 0.54.
- We employed the Chinese version of the Self-Efficacy for Managing Chronic Disease Six-item Scale (SES6G) to assess self-efficacy for diabetic management.22 Each item is scored from “1=not confident at all” to “10=absolutely confident”. The higher the mean score, the greater the self-efficacy. The Cronbach’s alpha was 0.92.
- We assessed the participants’ coping styles with the 20-item Simplified Coping Style Questionnaire (SCSQ).23 It is a four-point Likert scale with scores ranging from “0=never” to “3=always”. We divided the scale into positive and negative coping styles; a higher mean score means more frequent use of the coping style when encountering setbacks and difficulties. The Cronbach’s alpha of the scale and the positive and negative coping styles were 0.84, 0.86, and 0.71, respectively.
- We used the ten-item Social Support Rating Scale (SSRS) to assess the participants’ social support.24 The scale includes objective support, subjective support, and social support availability. The total score ranges from 12 to 66, wherein a higher total score represents a greater degree of social support. The Cronbach’s alpha of the scale and the three dimensions were 0.71, 0.47, 0.61, and 0.43, respectively.
- We used the Life Event Scale (LES) to assess the psychological effects of major life events within the past three months.25 The scale contains 48 common life events and two blanks for unlisted events. As the study was conducted during the post-COVID-19 era, we filled one blank of LES with the “COVID-19 pandemic” to evaluate its effects as a major life event. All events were characterized as being either positive or negative. We quantified the total score by multiplying the incident and impact scores. A higher total score indicates a greater psychological impact.
Statistical Analyses
The data entry and collation was done in Epidata 3.1, and the accuracy was ensured by double-entry check. The following statistical analyses were conducted in SPSS 26 (IBM, Armonk, NY, USA).
We used mean and standard deviation (mean±SD) and median (interquartile range) (median [IQR]) to represent continuous variables such as age, income, diabetes duration, money, time, and scale scores; and used frequencies and proportions to describe categorical variables such as ethnic group, religion, residence, marital status, educational level, employment status, financial satisfaction, family history, treatment spot, treatment regimens, insomnia severity, personality types, and count variables such as numbers of comorbidities and complications.
With the DD degree (little or no, moderate, and high distress) as a grouping variable, we used the Jonckheere-Terpstra test with “smallest to large” as hypothesis order and using all pairwise multiple comparisons to evaluate the intergroup differences in continuous variables and ordinal categorical variables (eg educational level, insomnia severity) between participants with different DD degrees. To compare the intergroup differences of unordered categorical variables, we conducted chi-square test when expected frequencies≥5, and Fisher’s exact test when expected frequencies<5.
For multivariate analysis, we performed an ordinal logistic regression analysis taking DD degrees as dependent variable, all variables with p<0.2 in the univariate analysis and without multicollinearity (tolerance≥0.1, variance inflation factor [VIF]≤10) as independent variables; and setting 95% confidence interval, a maximum of 100 iterations, and a maximum of 5 step sizes.
All tests were two-sided, and p<0.05 was considered to indicate statistical significance.
Results
Population Characteristics
A total of 947 participants completed the survey, with an effective response rate of 98.54%. Demographics are summarized in Table 1. The average age was 55.67±14.12 years. Approximately half of the sample were male (n=525, 55.44%), had college/university degrees (n=507, 53.54%), were retired (n=474, 50.05%), and were satisfied with their financial situations (n=481, 50.79%). Most of the participants were Han (n=908, 95.88%), had no religious affiliation (n=903, 95.36%), permanently lived in cities (n=822, 86.80%), were married (n=821, 86.70%), and primarily used basic medical insurance for the payment of diabetes-related medical expenses (n=752, 79.41%). Approximately one-third of the participants worked full-time (n=368, 38.86%) and were professional or technical personnel. The median (IQR) personal and family average monthly incomes were 7000.00 (4000.00, 10,000.00) CNY and 7500.00 (5000.00, 10,000.00) CNY, respectively.
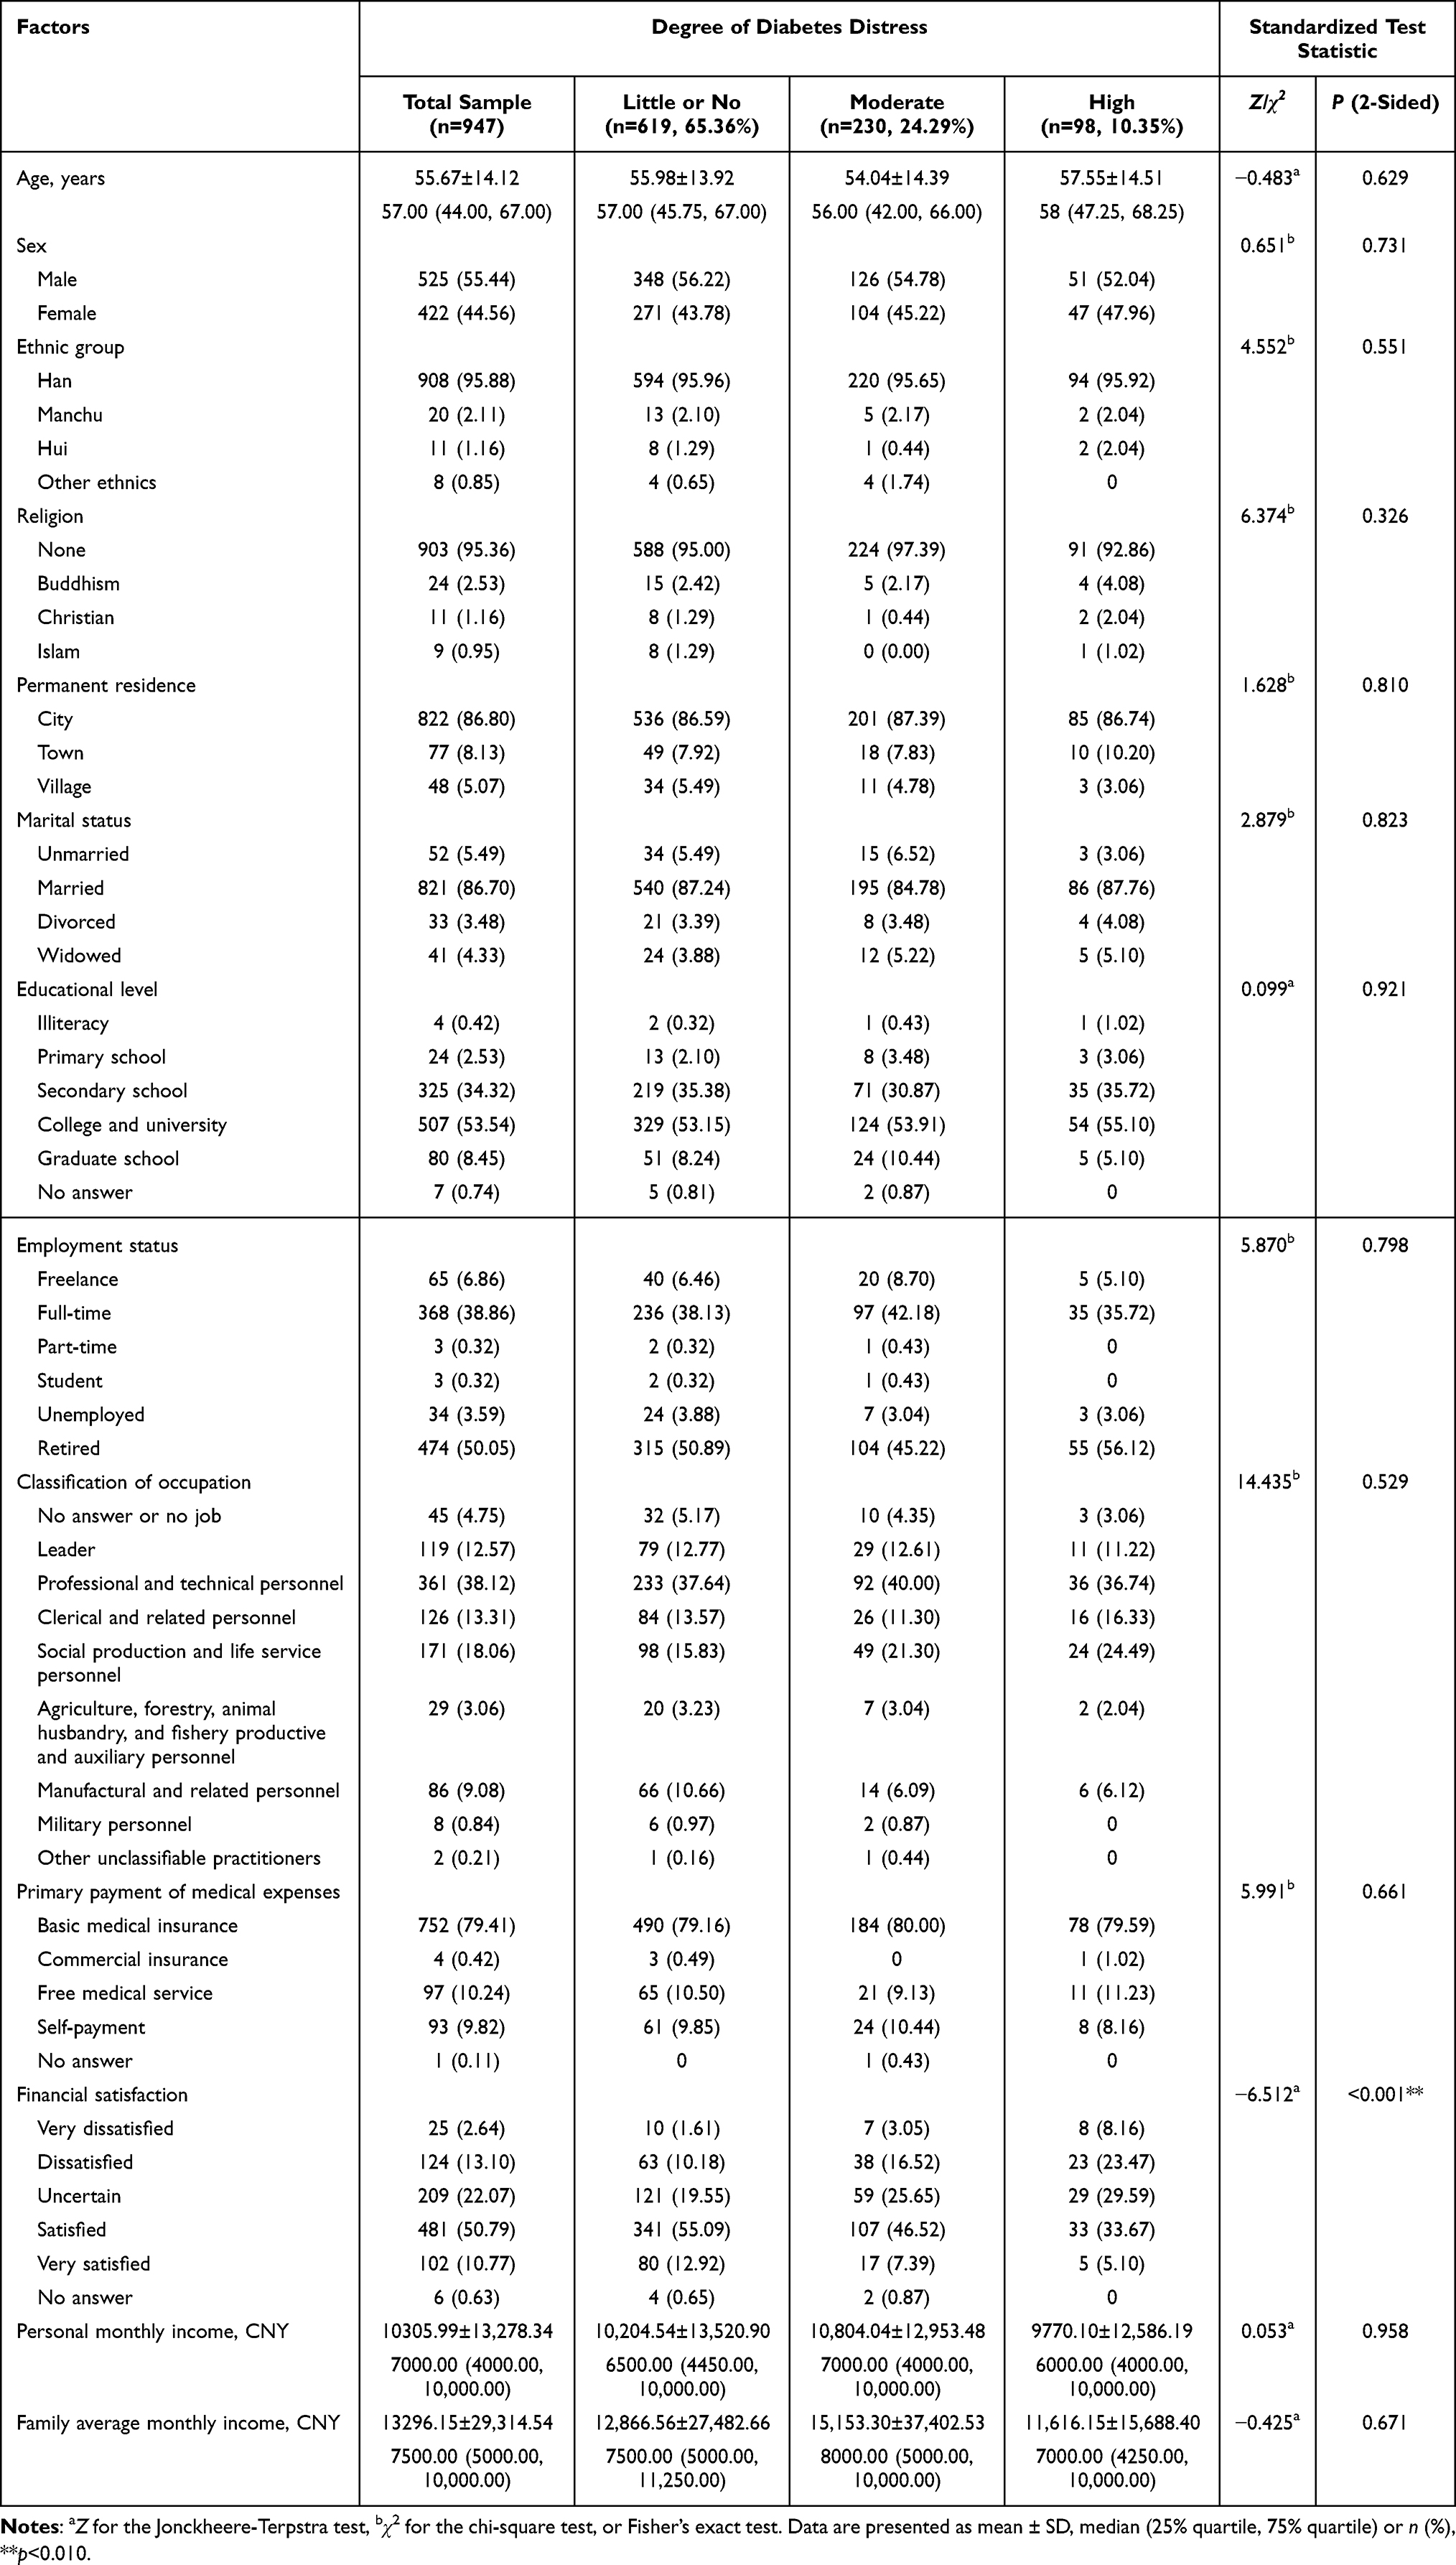 |
Table 1 Demographics of the Participants Across Degrees of Diabetes Distress |
Prevalence of DD
The mean±SD score of the C-DDS17 was 1.84±0.80; the median (IQR) was 1.59 (1.24, 2.24). Emotional burden had the highest score (median [IQR]: 1.80 [1.20, 2.60]), followed by regimen distress (1.60 [1.20, 2.40]) and physician distress (1.25 [1.00, 2.00]). Interpersonal distress had the lowest score (1.00 [1.00, 1.67]). As depicted by a percentage of severity, the prevalence of DD was 34.64%, 24.29% of the participants had moderate DD (n=230), and 10.35% had high DD (n=98).
Demographic Differences Between DD Groups
Of the sample, 149 individuals (15.74%) were dissatisfied or very dissatisfied with their financial status. The percentage was significantly higher in the high DD group (n=31, 31.63%) than in the moderate (n=45, 19.57%) and little or no DD groups (n=73, 11.79%, Z=−6.512, p<0.001). However, other demographic characteristics were not correlated with the DD score. Table 1 provides all the relevant results.
Differences in Characteristics of Diabetes and Living Habits Between DD Groups
Table 2 provides the specific details of the characteristics and living habits of type 2 diabetes by the degrees of DD. The average duration of diabetes was 9.02±8.57 years with a median (IQR) of 6.84 (1.33, 15.00) years, and it was positively related to the degrees of DD with significant between-group differences (Z=2.600, p=0.009).
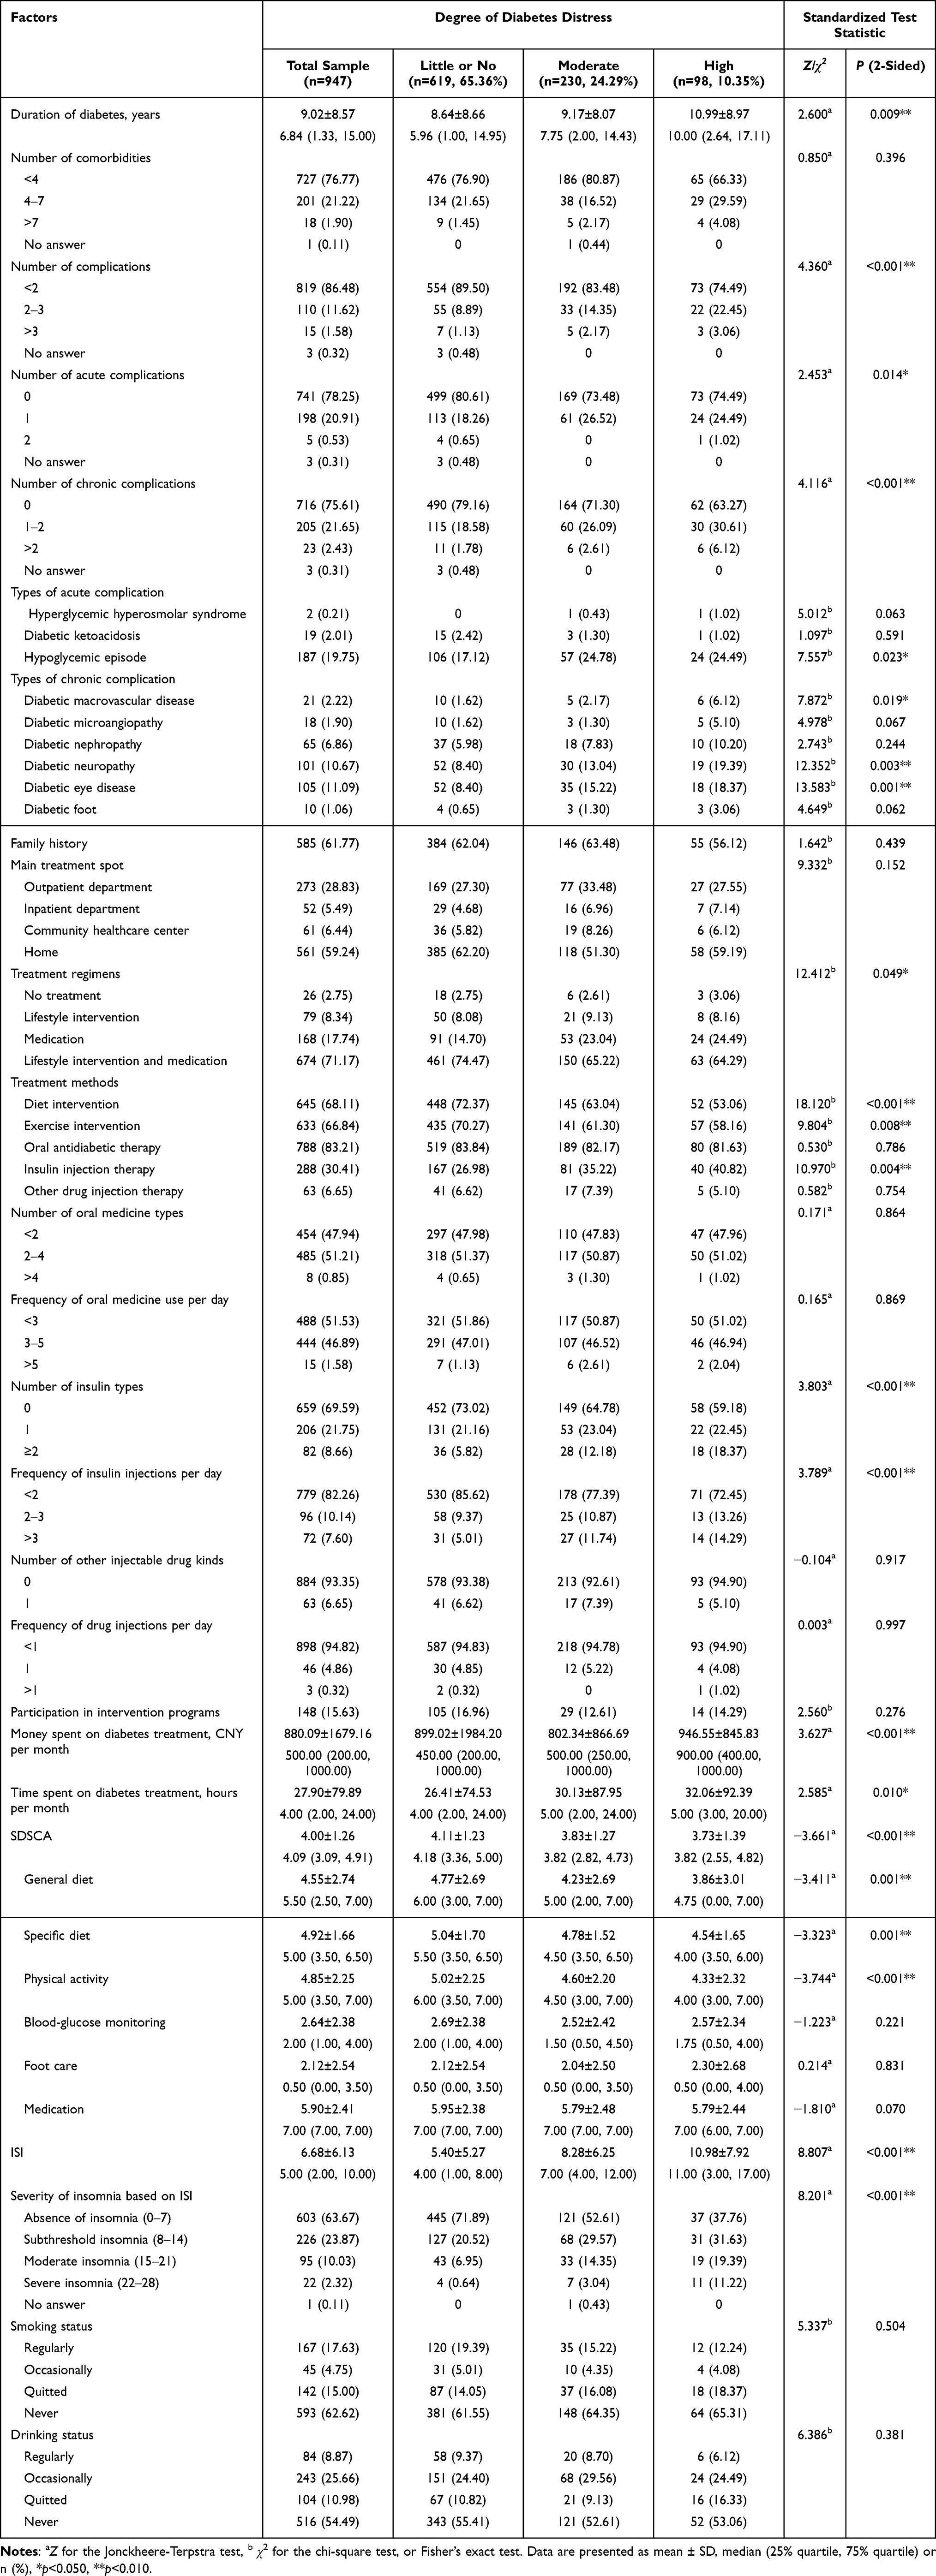 |
Table 2 Characteristics and Living Habits of Type 2 Diabetes by Degree of Diabetes Distress |
Participants with higher DD tended to have more complications that 25.51% of the participants with high DD (n=25), 16.52% of those with moderate DD (n=38), and 10.02% of those with little or no DD (n=62) had two or more complications (Z=4.360, p<0.001). Specifically, 25.51% (n=25) and 36.73% (n=36) of the participants with high DD, 26.52% (n=61) and 28.70% (n=66) with moderate DD, and 18.91% (n=117) and 20.36% (n=126) with little or no DD reported having acute (Z=2.453, p=0.014) and chronic complications (Z=4.116, p<0.001), respectively. Regarding types of complications, hypoglycemic episodes (χ2=7.557, p=0.023), diabetic macrovascular disease (χ2=7.872, p=0.019), diabetic neuropathy (χ2=12.352, p=0.003), and diabetic eye disease (χ2=13.583, p=0.001) showed a greater proportion in the groups with higher DD scores.
Treatment regimens were significantly related to the degrees of DD (χ2=12.412, p=0.049). The moderate DD group (n=6, 2.61%) had the lowest percentage of people with no treatment regimen, followed by the little or no DD group (n=18, 2.75%) and the high DD group (n=3, 3.06%). However, the moderate DD group (n=21, 9.13%) had the highest percentage of adults treated only by lifestyle interventions, followed by the high DD group (n=8, 8.16%) and the little or no DD group (n=50, 8.08%). In higher DD groups, more participants were treated only with medication. The percentage of participants was 14.70% in the little or no DD group (n=91), 23.04% in the middle DD group (n=53), and 24.49% in the high DD group (n=24). However, more participants in the lower DD groups were simultaneously treated by lifestyle intervention and medication. Indeed, 74.47% of the participants in the little or no DD group (n=461), 65.22% in the middle DD group (n=150), and 64.29% in the high DD group (n=63) received both lifestyle intervention and medication treatment.
For the specific treatment methods, diet (χ2=18.120, p<0.001) and exercise (χ2=9.804, p<0.001) were negatively related to the degree of DD. In contrast, insulin injection therapy was positively related to DD (χ2=10.970, p=0.004). Specifically, the more types (Z=3.803, p<0.001) and frequencies (Z=3.789, p<0.001) of insulin injections, the higher the DD scores. In addition, those who spent more money (Z=3.627, p<0.001) and time (Z=2.585, p=0.01) on diabetes tended to have higher DD.
Regarding self-care behaviors, the Jonckheere-Terpstra test revealed significant negative relationships between DD and SDSCA total scores (Z=−3.66, p<0.001), general diet scores (Z=−3.41, p=0.001), specific diet scores (Z=−3.32, p=0.001) and physical activity scores (Z=−3.74, p<0.001). However, participants’ DD was not impacted by the activities in blood glucose monitoring, foot care, and medication.
We observed a statistically significant difference in ISI across the DD groups (Z=8.81, p<0.001). The high DD group (11.00 [3.00, 17.00]) scored higher on the ISI than the middle DD (7.00 [4.00, 12.00]) and the little or no DD groups (4.00 [1.00, 8.00]). Most participants in the little or no DD group (n=445, 71.89%) had no insomnia, while half of the participants in the middle DD group (n=108, 46.96%) and most of those in the high DD group (n=61, 62.24%) experienced insomnia.
However, the chi-square test showed that patients’ DD was unrelated to whether they smoked or drank.
Differences in Physiological Factors Between DD Groups
As shown in Table 3, participants with higher DD showed higher levels of glycemia (p<0.001). The HbA1c levels of the participants with little or no distress, middle distress, and high distress were 7.36%±1.89% (56.99±20.71 mmol/mol), 7.81%±1.79% (61.84±19.52 mmol/mol) and 8.08%±1.90% (64.83±20.78 mmol/mol), respectively. The FBG levels of the three groups were 7.83±2.45 mmol/L, 8.54±2.83 mmol/L, and 8.74±3.35 mmol/L, respectively. The PBG levels were 10.81±4.35 mmol/L, 11.25±4.03 mmol/L and 13.18±6.58 mmol/L, respectively. However, the participants did not show statistically significant differences in other physiological factors.
 |
Table 3 Physiological Characteristics of the Patients by Degree of Diabetes Distress |
Differences in Psychosocial Factors Between DD Groups
Table 4 presents the associations between psychosocial factors and DD. Type D personality was significantly related to higher DD, whereas non-type D personality was related to lower DD (χ2=106.65, p<0.001). More than half of the participants in the high DD group had type D personality (n=51, 52.04%), while approximately one-third of the participants in the moderate DD group (n=82, 35.65%) and less than one-fifth of the participants in the little or no DD group (n=108, 17.45%) had type D personality. We saw an opposite pattern in those who had non-type D personality, with 25.51% (n=25), 31.74% (n=73), and 57.19% (n=354) of the participants in those three groups having non-type D personality, respectively. In addition, the study found negative affectivity personality primarily in the moderate group (n=45, 19.57%), while the social inhibition personality accounted for the smallest percentage in the same group (n=30, 13.04%). In terms of scoring, participants with higher DD had higher social inhibition (Z=6.894, p<0.001) and negative affectivity scores (Z=11.377, p<0.001).
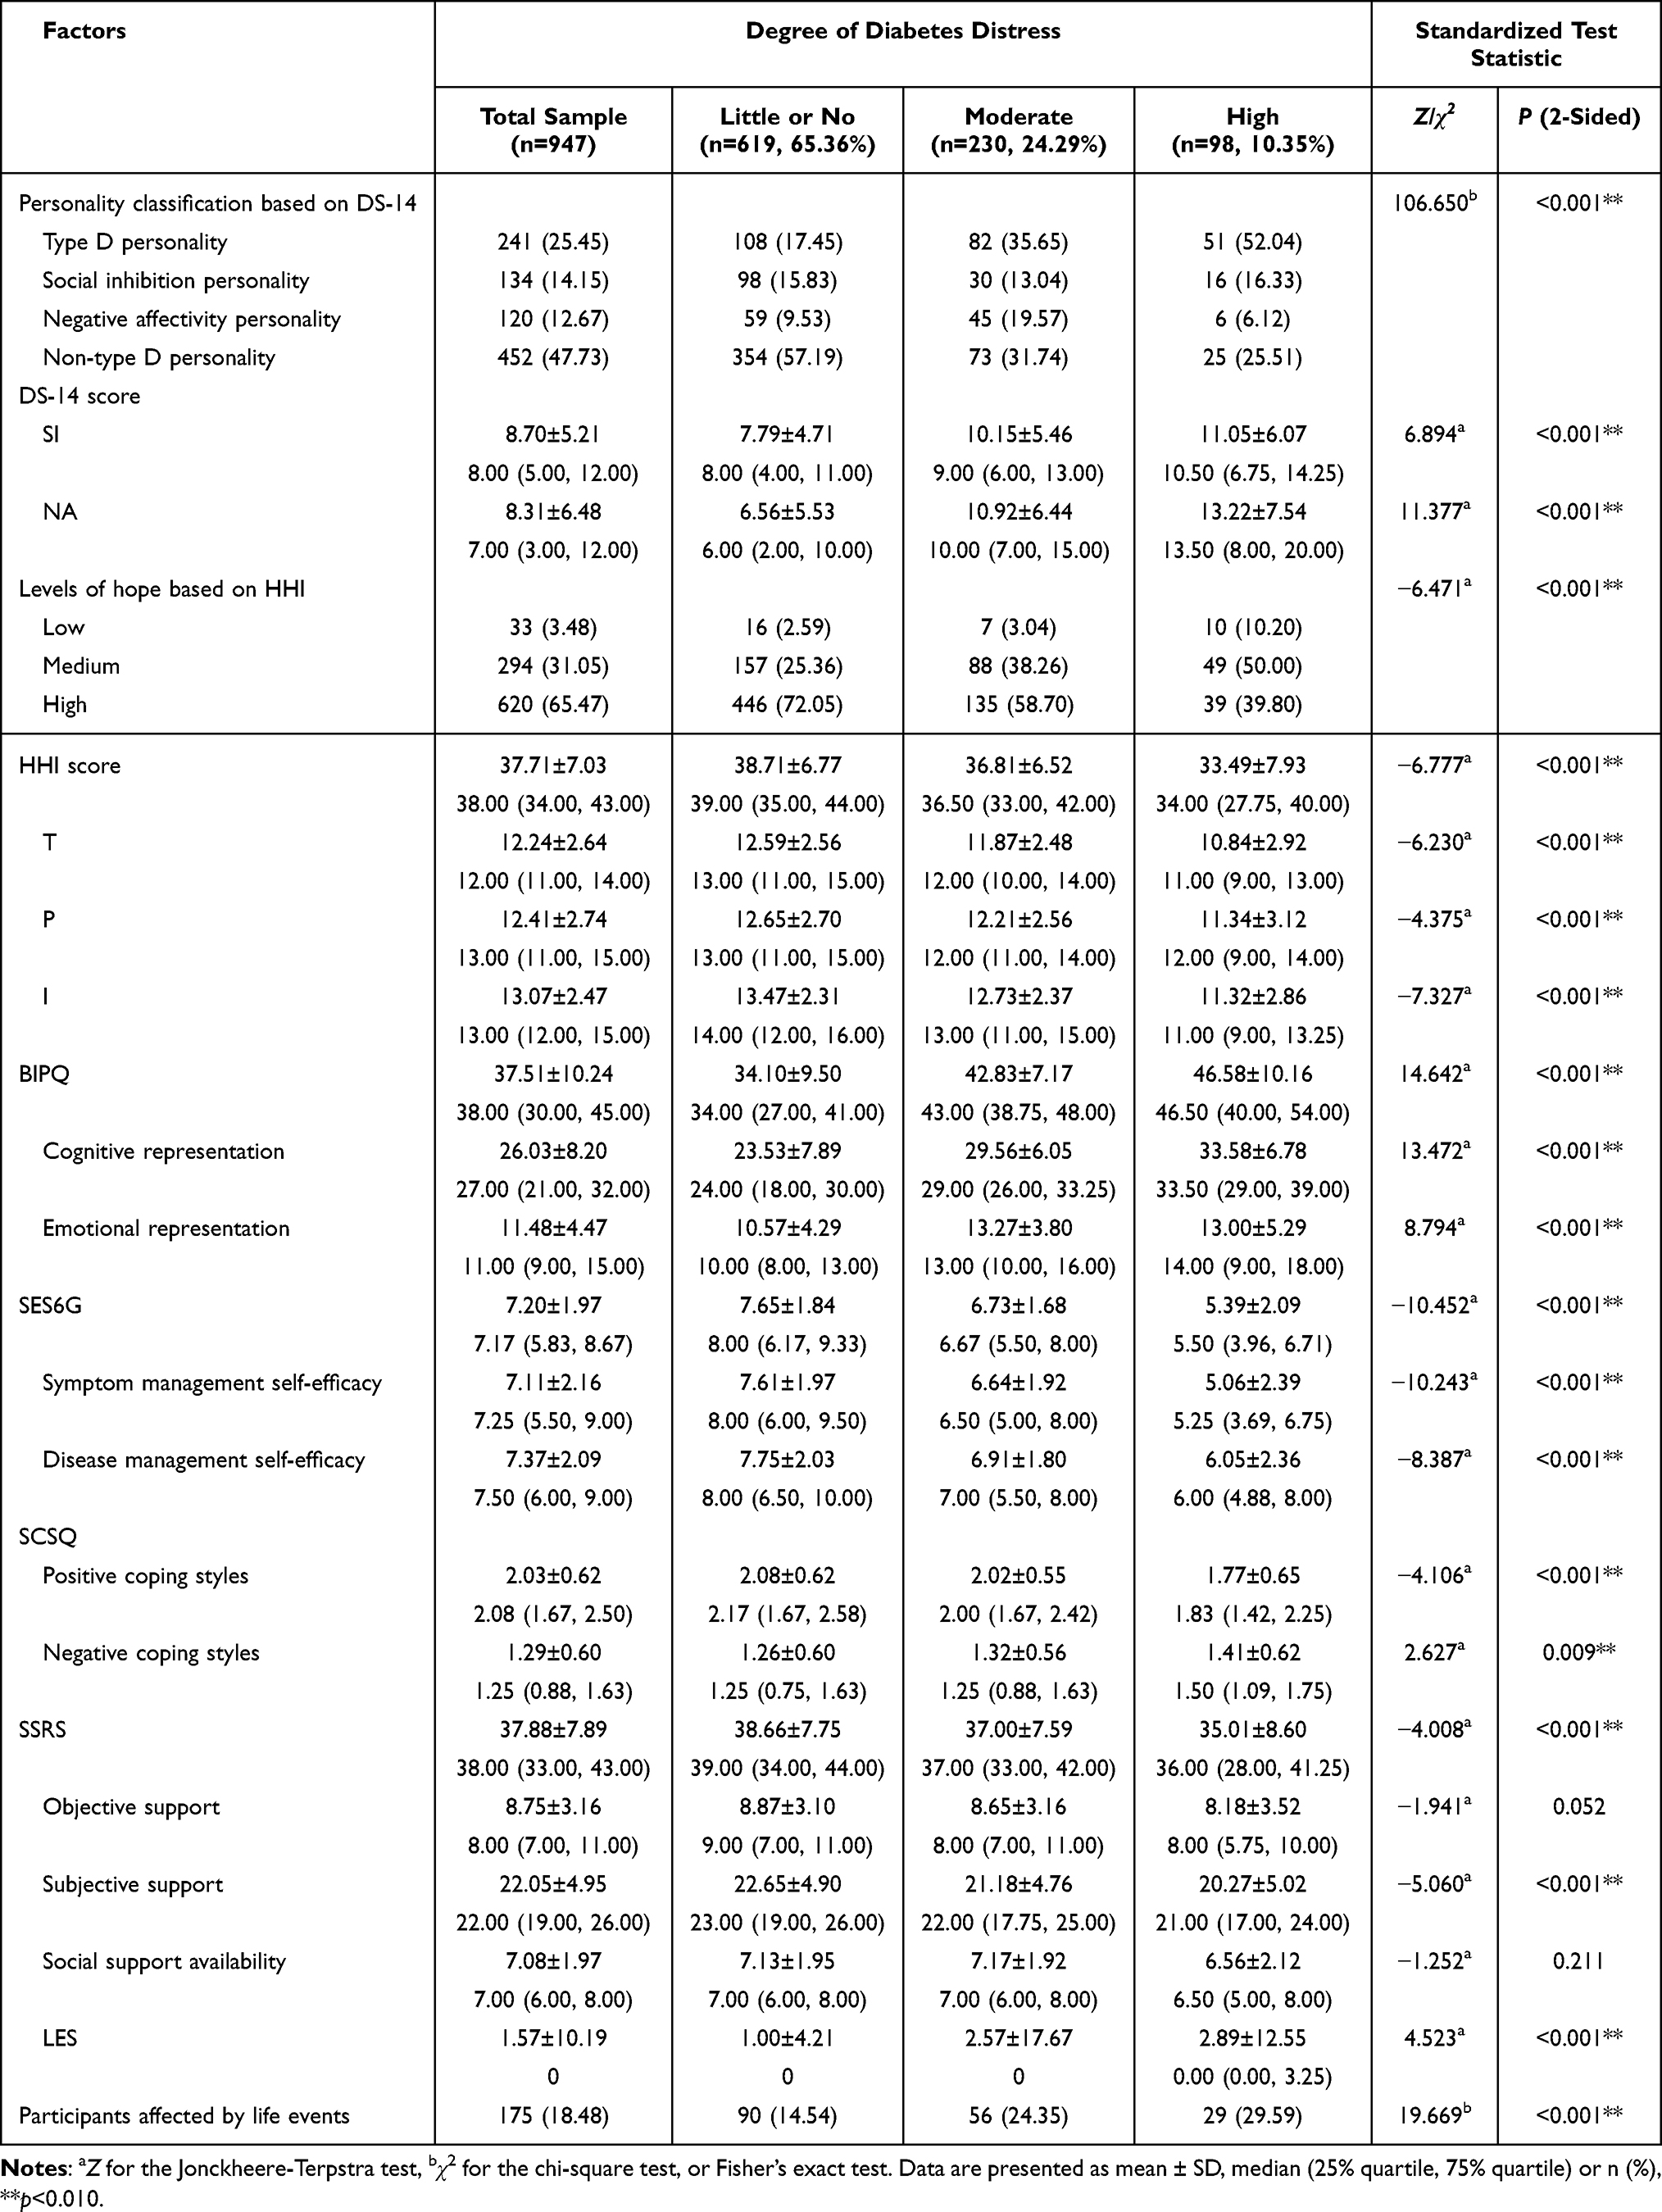 |
Table 4 Psychosocial Characteristics of the Patients by Degree of Diabetes Distress |
The Jonckheere-Terpstra test revealed statistically significant differences across the three DD groups studied in HHI (Z=−6.78, p<0.001), with the participants who had little or no DD scoring the highest (38.71±6.77), followed by those who had middle DD (36.81±6.52) and high DD (33.49±7.93), as well as in SES6G (Z= −10.45, p<0.001), with the little or no DD group (7.65±1.84) scoring higher than the middle (6.73±1.68) and high DD groups (5.39±2.09). The same was true for the SSRS (Z=−4.01, p<0.001), where the participants with little or no DD (38.66±7.75) scored higher than the participants with middle DD (37.00±7.59) and high DD (35.01±8.60). The BIPQ scores showed the opposite pattern (Z=14.64, p<0.001), with the high DD group (46.58±10.16) scoring higher than the middle DD group (42.83±7.17) and the little or no DD group (34.10±9.50).
Participants with less DD often used positive coping styles (Z=−4.11, p<0.001), whereas those with higher DD often used negative coping styles (Z=2.63, p<0.001). The average scores of positive coping styles of the little or no DD, middle DD, and high DD groups were 2.08±0.62, 2.02±0.55 and 1.77±0.65, respectively, while the average scores of negative coping styles of the three groups were 1.26±0.60, 1.32±0.56 and 1.41±0.62, respectively.
We also found statistically significant positive relationships between DD and LES, with the little or no DD group (1.00±4.21) scoring lower than the middle DD (2.57±17.67) and high DD groups (2.89±12.55).
Multivariable Logistic Regression Analysis
There was no multicollinearity among independent variables contained in ordinal logistic regression analysis that all values of tolerance >0.1 and VIF<10.
Ordinal logistic regression model showed that hypoglycemic episode (β=−1.118, p=0.019, “have hypoglycemic” as reference group) and BIPQ score (β=0.090, p<0.001) were significant positive correlators for diabetes distress, while diet intervention (β=0.803, p=0.022, “have diet intervention” as reference group), money spent on diabetes treatment (β<-0.001, p=0.035), and SES score (β=−0.257, p<0.001) were significant negative correlators. However, the effect of money spent on diabetes treatment on diabetes distress was very little (Table 5).
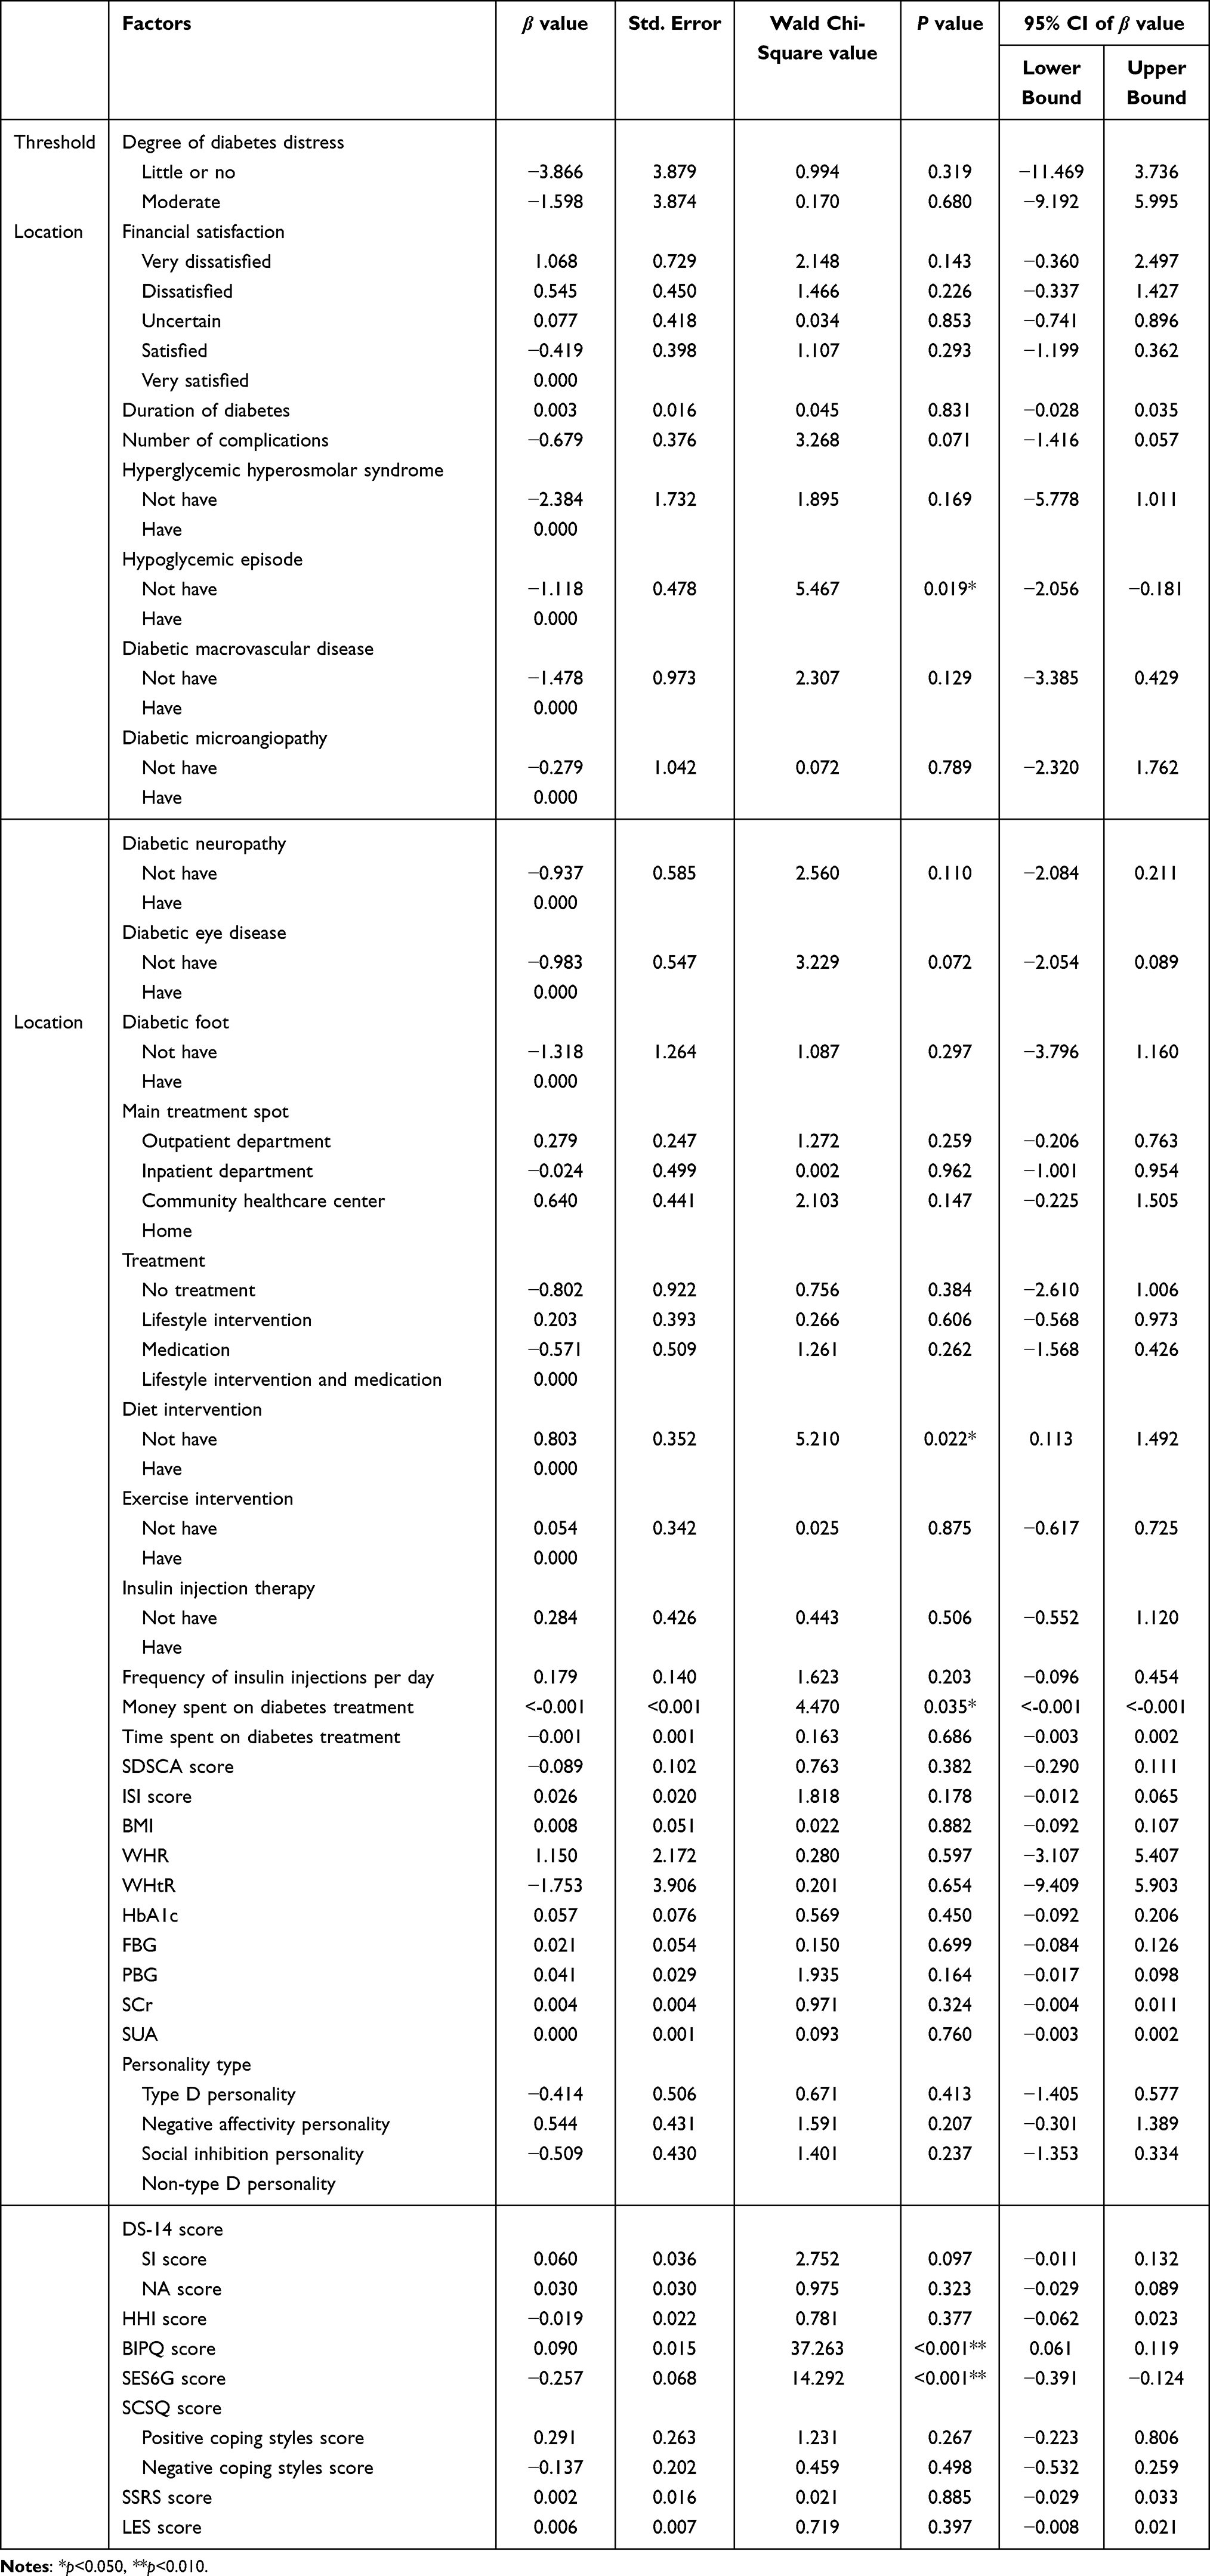 |
Table 5 Multivariate Analysis of Influence Factors of Degree of Diabetes Distress |
Discussion
In this sample, the median (IQR) of the C-DDS17 was 1.59 (1.24, 2.24), which was at the level of little distress, and was similar to that of 706 patients with type 2 diabetes in primary and specialized hospitals in the UK (1.50 [1.20, 2.20]).26 The prevalence of DD was 34.64%, similar to the cross-sectional study of 600 patients with type 2 diabetes in general hospitals in Shandong province, which may be related to the similar distribution of age, BMI, and smoking status in the two studies.27 However, it was significantly lower than the average prevalence of diabetes distress in China (50.00% [95% CI: 39.00–60.00%]).7 This difference may be related to different distributions of related factors in different sample sizes and age groups that studies with a small sample size or specifically targeting patients of a specific age group usually show a higher prevalence of diabetes distress.7
Participants with higher DD were generally less satisfied with their financial status, partly because those with lower income were less able to maintain appropriate glycemic control strategies and manage the stress caused by diabetes.28 Therefore, we need to develop cost-effective diabetes management, supportive interventions, and financial incentives to improve diabetes care. Other demographic characteristics were not correlated with the DD scores in this study. In contrast, several studies have shown that age, sex, ethnicity, marital status, and educational level are related to DD.10,29 The differences may be due to the interactions among these factors and their indirect relationships with DD.9
Higher degrees of DD were also related to a longer duration of diabetes, more acute and chronic complications, poorer lifestyle intervention, fewer self-care activities, more types and frequencies of insulin injections, and more money and time spent on treatment (p<0.010). More participants in the higher-degree DD groups had hypoglycemic episodes, diabetic macrovascular disease, neuropathy, eye disease, worse glycemic control, and more severe insomnia problems (p<0.050). The effect of hypoglycemic episodes, diet intervention, and money on DD maintained significantly in multivariable analysis. These results are consistent with those of previous studies.29,30 According to one study, a longer duration of diabetes was associated with poorer adherence to management regimens, worse glycemic control, and more severe complications.31 Those individuals often experienced more physical, emotional, social, and financial burdens, leading to a remarkable increase in DD.9,32 Although continuing self-care activities were beneficial for decreasing DD, intense management regimens, especially those in which insulin injections required more money and time, often caused more distress.33,34 However, smoking and drinking status, body shape, blood pressure, serum lipids, and renal function were unrelated to DD, possibly due to the indirect relationships between DD and these indices.
We also found that people with type D personality were more likely to experience higher DD, and the percentages of social inhibition personality and negative affectivity personality were the highest in the middle DD group (p<0.001). The reason was that type D personality was characterized by a high level of social inhibition (SI) and negative affectivity (NA). People with a high level of SI found it more difficult to release pressure through interactions with others; people with a high level of NA were more likely to have negative emotions such as worry, anger, depression, and despair.35 The interaction of the two traits resulted in impaired self-efficacy and self-management behaviors, which then resulted in higher diabetes distress.13,36
In addition, negative perceptions of their illness and negative coping styles were positively correlated with DD. In contrast, hope, self-efficacy, positive coping styles, and social support were inversely related to DD (p<0.001). In ordinal logistic regression analysis, illness perception and self-efficacy still showed a significant effect on DD. The results conformed to the theoretical hypothesis of the study. Namely, illness perceptions constituted patients’ primary cognitive appraisal. Then, illness perceptions and self-efficacy served as secondary cognitive appraisal, helping patients to assess their ability and resources to deal with stressors. This forms the basis for patients to choose different coping styles. People who perceived less threat of type 2 diabetes and higher self-efficacy were more likely to choose positive coping styles. Those people performed significantly better than those who adopted negative coping styles in adaptive tasks including controlling blood glucose, improving lifestyle, re-establishing positive perception and self-efficacy, seeking efficient social support, and cultivating hope. Good adaptation resulted in the positive outcome of little or no diabetes distress. On the contrary, people who perceived a greater threat of type 2 diabetes and had lower self-efficacy in managing type 2 diabetes usually believed that their ability and existing resources were not enough to cope with stressors, so they had negative emotional reactions, tend to choose negative coping styles, and then perform poorly in adaptive tasks, which lead to moderate or high diabetes distress.
Thus, within the context of an intervention, particular attention should be given to those with type D personality. Culturally tailored diabetes interventions that enhance positive perceptions, hope, self-efficacy, positive coping styles, and social support can buffer DD.
In addition, this study found that major life events had an adverse psychological impact on the participants, and the effect was positively related to DD (p<0.010). According to the comprehensive task-based model, life events add additional stress to patients and then affect their psychosocial adaptation to type 2 diabetes.8
This study has several strengths. The sample size was considerable, and the participants were recruited from different hospitals, thus representative of the general population with type 2 diabetes in China. The study used reliable tools to assess DD and psychological variables, and extracted physiological factors from medical records, so the results were relatively accurate.
However, the study also has some limitations that could be investigated further. Given the convenience sampling approach and social desirability bias related to the disease, study settings, and social-psychological issues, we must be cautious about generalizing our findings. Due to the cross-sectional design, we cannot infer causality. Future longitudinal studies and complex statistical analysis are needed to clarify the causality of the variates.
As for assessment tools, more intelligent, comprehensive, and reliable measures such as “Information and Communication Technologies-based type 2 diabetes management system” and “vocal biomarkers for mental health monitoring” can be used to measure physiological and psychological factors continuously and repeatedly, and greatly improve the measurement accuracy and convenience, and reduce the burden for patients and researchers.
Furthermore, although one-third of the participants with type 2 diabetes had moderate or high DD, DD is not assessed nor managed in most clinical care programs.4,30 Future studies might promote the routine evaluation and intervention of DD in clinical practice.
Conclusion
In summary, we revealed meaningful links between DD and the financial, physical, and psychological status of individuals with type 2 diabetes. More specifically, those who had less satisfaction with their financial status, a longer duration of diabetes, more acute and chronic complications, poorer lifestyle intervention, fewer self-care activities, and more types and frequencies of insulin injections, and those who spent more money and time treating their diabetes were more likely to experience DD. Having type D personality, negative perception of their illness, and negative coping styles were related to high DD. In contrast, the study showed that hope, self-efficacy, positive coping styles, and social support can reduce DD potentially. These findings may help identify and prevent DD in people with type 2 diabetes. Further large-scale longitudinal studies are needed to extend these results and generate more effective interventions.
Abbreviations
DD, diabetes distress; STROBE, Strengthening the Reporting of Observational Studies in Epidemiology; C-DDS17, 17-item Chinese Diabetes Distress Scale; SDSCA, Summary of Diabetes Self-Care Activities; ISI, Insomnia Severity Index; BMI, body mass index; WHR, waist-hip ratio; WHtR, waist-height ratio; SBP, systolic blood pressure; DBP, diastolic blood pressure; FBG, fasting blood glucose; 2hPBG, 2-hour postprandial blood glucose; TC, total cholesterol; TG, triglyceride; HDL-C, high-density lipoprotein cholesterol; LDL-C, low-density lipoprotein cholesterol; SCr, serum creatinine; SUA, serum uric acid; ACR, urinary albumin‒creatinine ratio; DS-14, Type D Personality Scale-14; SI, social inhibition; NA, negative affectivity; HHI, Herth Hope Index; T, inner sense of temporality and future; P, inner positive readiness and expectancy; I, interconnectedness with self and others; BIPQ, Brief Illness Perception Questionnaire; SES6G, Self-Efficacy for Managing Chronic Disease Six-item Scale; SCSQ, Simplified Coping Style Questionnaire; SSRS, Social Support Rating Scale; LES, Life Event Scale; SD, standard deviation; IQR, interquartile range.
Data Sharing Statement
The data that support the findings of this study are available on request from the corresponding author YS, and the first author Y-YZ. The data are not publicly available due to ethical restrictions that their containing information could compromise the privacy of research participants.
Ethics Approval and Informed Consent
This study was approved by the Human Biomedical Research Ethics Committee of School of Nursing, Chinese Academy of Medical Sciences & Peking Union Medical College (no. [2020]03), registered in the Chinese Clinical Trial Registry (no. ChiCTR2100047071), and complies with the Strengthening the Reporting of Observational Studies in Epidemiology (STROBE) checklist. All methods were carried out following relevant guidelines and regulations.
We performed this study according to the Declaration of Helsinki. Before the formal investigation, the researcher provided and clearly explained the written informed consent to the participants. On the premise of fully understanding the informed consent and voluntarily participating in the study, the participants voluntarily signed their name (usually family name), contact information (selected), and date. Because the illiterate participants in this study could fully understand the informed consent after the researcher’s explanation and could write their names and Arabic numerals, they signed their names and left their telephone numbers (optional) on the signature page of the informed consent by themselves after listening carefully to the researcher’s explanation and fully understanding the informed consent.
Consent for Publication
The details of any texts, images and recordings can be published, and that the participants providing consent have been shown the article contents to be published.
Acknowledgments
The authors thank all study participants for spending their time on the investigation. The authors also gratefully thank the Department of Endocrinology medical staff of the Peking Union Medical College Hospital, China-Japan Friendship Hospital, and the Peking University Third Hospital for their support during data collection. Finally, the authors thank the School of Nursing, Chinese Academy of Medical Sciences & Peking Union Medical College for supporting this study. The authors also would like to thank TopEdit (www.topeditsci.com) and Springer Nature (authorservices.springernature.com) for the English language editing of this manuscript.
Author Contributions
Y-YZ conceptualized and designed the study, collected, analyzed and interpreted the data, and drafted and wrote the manuscript. WL modified the conception, study design, assisted with data acquisition, analysis, and interpretation; and substantially reviewed and revised the manuscript. YS completed and supervised the whole study design, data collection, analysis and interpretation, and reviewed and revised the manuscript. QW and FZ helped modifying the study design, assisted with data collection, participated in data analysis and interpretation, and critically reviewed the manuscript. YW contributed in data acquisition and interpretation, and critically reviewed the manuscript. Y-YZ and YS are the guarantors of this work, have full access to all the data in the study, and take responsibility for the integrity of the data and the accuracy of the data analysis. All aforementioned authors agreed on the journal Patient Preference and Adherence to which the article will be submitted, reviewed and agreed on all versions of the article, and agreed to take responsibility and be accountable for the contents of the article.
Disclosure
Yu Sheng is the vice-chairperson of the Disaster Nursing Committee of the Chinese Nursing Association. Fang Zhao is the chairperson of the Diabetes Nursing Committee of the Chinese Nursing Association. The authors report no other conflicts of interest in this work.
References
1. International Diabetes Federation. IDF Diabetes Atlas.
2. Ong KL, Stafford LK, McLaughlin SA, et al. Global, regional, and national burden of diabetes from 1990 to 2021, with projections of prevalence to 2050: a systematic analysis for the Global Burden of Disease Study 2021. Lancet. 2023;402:203–234.
3. Kintzoglanakis K, Gkousiou A, Vonta P, Sagmatopoulos A, Copanitsanou P. Depression, anxiety, and diabetes-related distress in type 2 diabetes in primary care in Greece: different roles for glycemic control and self-care. SAGE Open Med. 2022;10:383019875. doi:10.1177/20503121221096605
4. McMorrow R, Hunter B, Hendrieckx C, et al. Effect of routinely assessing and addressing depression and diabetes distress on clinical outcomes among adults with type 2 diabetes: a systematic review. BMJ Open. 2022;12(5):e054650. doi:10.1136/bmjopen-2021-054650
5. Zhang YY, Li W, Sheng Y. The Chinese version of the revised Diabetes Distress Scale for adults with type 2 diabetes: translation and validation study. Int J Nurs Sci. 2022;9(2):243–251. doi:10.1016/j.ijnss.2022.03.002
6. García-Lara RA, Gómez-Urquiza JL, Membrive-Jiménez MJ, et al. Anxiety, distress and stress among patients with diabetes during COVID-19 pandemic: a systematic review and meta-analysis. J Pers Med. 2022;12(9):1–20. doi:10.3390/jpm12091412
7. Li J, Jiang Y, Peng H, Liao S, Liu M, Lu Y. A meta-analysis of cross-sectional studies of psychological distress with type diabetes patients in China. Chin Mental Health J. 2023;37(04):312–317.
8. Samson A, Siam H. Adapting to major chronic illness: a proposal for a comprehensive task-model approach. Patient Educ Couns. 2008;70(3):426–429. doi:10.1016/j.pec.2007.10.018
9. Kamrul-Hasan ABM, Hannan MA, Asaduzzaman M, et al. Prevalence and predictors of diabetes distress among adults with type 2 diabetes mellitus: a facility-based cross-sectional study of Bangladesh. BMC Endocr Disord. 2022;22(1):28. doi:10.1186/s12902-022-00938-3
10. Liew JY, Vanoh D. Predictors affecting diabetes related distress among diabetes patients. Malays J Med Sci. 2022;29(2):94–101. doi:10.21315/mjms2022.29.2.9
11. Alzubaidi H, Sulieman H, Mc NK, Samorinha C, Browning C. The relationship between diabetes distress, medication taking, glycaemic control and self-management. Int J Clin Pharm. 2022;44(1):127–137. doi:10.1007/s11096-021-01322-2
12. Lee AA, Heisler M, Trivedi R, et al. Diabetes distress among dyads of patients and their health supporters: links with functional support, metabolic outcomes, and cardiac risk. Ann Behav Med. 2021;55(10):949–955. doi:10.1093/abm/kaaa081
13. Lin YH, Chen DA, Lin C, Huang H. Type D personality is associated with glycemic control and socio-psychological factors on patients with type 2 diabetes mellitus: a cross-sectional study. Psychol Res Behav Manag. 2020;13:373–381. doi:10.2147/PRBM.S245226
14. Denollet J, Rombouts H, Gillebert TC, Brutsaert DL, Sys SU, Stroobant N. Personality as independent predictor of long-term mortality in patients with coronary heart disease. Lancet. 1996;347(8999):417–421. doi:10.1016/S0140-6736(96)90007-0
15. Wang X, Lyu W, Aronson R, et al. Reliability and validity of the Chinese version of the LMC Skills, Confidence & Preparedness Index (SCPI) in patients with type 2 diabetes. Health Qual Life Outcomes. 2021;19(1):25. doi:10.1186/s12955-020-01664-x
16. Yang S, Wang J, Xu X. Psychological health status among thyroid cancer patients during the COVID-19 epidemic in China. Support Care Cancer. 2021;30:1–9.
17. Ileri I, Borazan FY, Cavusoglu C, Göker B. The relationship between the severity of insomnia and falls in the elderly. Psychogeriatrics. 2021;22(1):22–28. doi:10.1111/psyg.12767
18. Zeng X, Liu D, An Z, Li H, Song J, Wu W. Obesity parameters in relation to lung function levels in a large Chinese rural adult population. Epidemiol Health. 2021;e2021047. doi:10.4178/epih.e2021047
19. Chen X, Yuan C, Zhang H, Chen X. Mediating effect of self-efficacy on type D personality and self-management in patients with type 2 diabetes. China J Health Psychol. 2020;28(02):194–198.
20. Wu X, Xu H, Zhang X, et al. Self-efficacy, hope as mediators between positive coping and resilience among patients with gastric cancer before the first chemotherapy. Cancer Nurs. 2021;44(1):79–85. doi:10.1097/NCC.0000000000000753
21. Li J, Qiu X, Yang X, et al. Relationship between illness perception and depressive symptoms among type 2 diabetes mellitus patients in china: a mediating role of coping style. J Diabetes Res. 2020;2020:3142495. doi:10.1155/2020/3142495
22. Wang R, Zhou C, Wu Y, et al. Patient empowerment and self-management behaviour of chronic disease patients: a moderated mediation model of self-efficacy and health locus of control. J Adv Nurs. 2021;78(4):1055–1065. doi:10.1111/jan.15077
23. Chen Z, Li Y, Chen J, Guo X. The mediating role of coping styles in the relationship between perceived social support and antenatal depression among pregnant women: a cross-sectional study. BMC Pregnancy Childbirth. 2022;22(1):188. doi:10.1186/s12884-022-04377-9
24. Wu C, Zhang LY, Zhang XY, et al. Factors influencing career success of clinical nurses in northwestern China based on Kaleidoscope Career Model: structural equation model. J Nurs Manag. 2021;30(2):428–438. doi:10.1111/jonm.13499
25. Wang C, Fan G, Xu R, et al. A case-control study of the association between psychosocial factors and the occurrence of laryngeal cancer. Mol Clin Oncol. 2017;7(3):443–448. doi:10.3892/mco.2017.1348
26. Barker MM, Davies MJ, Zaccardi F, et al. Age at diagnosis of type 2 diabetes and depressive symptoms, diabetes-specific distress, and self-compassion. Diabetes Care. 2023;46(3):579–586. doi:10.2337/dc22-1237
27. Yang QQ, Sun JW, Shao D, Zhang HH, Bai CF, Cao FL. The association between diabetes complications, diabetes distress, and depressive symptoms in patients with type 2 diabetes mellitus. Clin Nurs Res. 2021;30(3):293–301. doi:10.1177/1054773820951933
28. Im J, Escudero C, Zhang K, et al. Perceptions and correlates of distress due to the COVID-19 pandemic and stress management strategies among adults with diabetes: a mixed-methods study. Can J Diabetes. 2022;46(3):253–261. doi:10.1016/j.jcjd.2021.10.006
29. de Wit M, Pouwer F, Snoek FJ. How to identify clinically significant diabetes distress using the Problem Areas in Diabetes (PAID) scale in adults with diabetes treated in primary or secondary care? Evidence for new cut points based on latent class analyses. BMJ Open. 2022;12(3):e056304. doi:10.1136/bmjopen-2021-056304
30. Gordon C. Supporting the emotional well-being of patients with diabetes mellitus in primary care. Nurs Stand. 2022;37(7):77–82. doi:10.7748/ns.2022.e11863
31. Vlachou E, Ntikoudi A, Owens DA, Nikolakopoulou M, Chalimourdas T, Cauli O. Effectiveness of cognitive behavioral therapy-based interventions on psychological symptoms in adults with type 2 diabetes mellitus: an update review of randomized controlled trials. J Diabetes Complications. 2022;36(5):108185. doi:10.1016/j.jdiacomp.2022.108185
32. Sultana MS, Islam MS, Sayeed A, et al. Prevalence and correlates of diabetes distress and depressive symptoms among individuals with type-2 diabetes mellitus during Ramadan fasting: a cross-sectional study in Bangladesh amid the COVID-19. Diabet Res Clin Pract. 2022;185:109210. doi:10.1016/j.diabres.2022.109210
33. Ehrmann D, Eichinger V, Vesper I, et al. Health care effects and medical benefits of a smartphone-based diabetes self-management application: study protocol for a randomized controlled trial. Trials. 2022;23(1):282. doi:10.1186/s13063-022-06248-2
34. Nance CM, Betancourt H, Flynn PM. The role of cultural beliefs and distress in adherence to recommended physical activity among patients with type 2 diabetes mellitus. J Behav Med. 2022;45(3):472–480. doi:10.1007/s10865-022-00301-w
35. Denollet J. DS14: standard assessment of negative affectivity, social inhibition, and Type D personality. Psychosom Med. 2005;67(1):89–97. doi:10.1097/01.psy.0000149256.81953.49
36. Chen SY, Hsu HC, Huang CL, Chen YH, Wang RH. Impact of type D personality, role strain, and diabetes distress on depression in women with type 2 diabetes: a cross-sectional study. J Nurs Res. 2023;31(1):e258. doi:10.1097/jnr.0000000000000536
 © 2024 The Author(s). This work is published and licensed by Dove Medical Press Limited. The full terms of this license are available at https://www.dovepress.com/terms.php and incorporate the Creative Commons Attribution - Non Commercial (unported, v3.0) License.
By accessing the work you hereby accept the Terms. Non-commercial uses of the work are permitted without any further permission from Dove Medical Press Limited, provided the work is properly attributed. For permission for commercial use of this work, please see paragraphs 4.2 and 5 of our Terms.
© 2024 The Author(s). This work is published and licensed by Dove Medical Press Limited. The full terms of this license are available at https://www.dovepress.com/terms.php and incorporate the Creative Commons Attribution - Non Commercial (unported, v3.0) License.
By accessing the work you hereby accept the Terms. Non-commercial uses of the work are permitted without any further permission from Dove Medical Press Limited, provided the work is properly attributed. For permission for commercial use of this work, please see paragraphs 4.2 and 5 of our Terms.