Back to Journals » OncoTargets and Therapy » Volume 13
Pretreatment CT-Based Radiomics Signature as a Potential Imaging Biomarker for Predicting the Expression of PD-L1 and CD8+TILs in ESCC
Authors Wen Q, Yang Z, Zhu J, Qiu Q, Dai H, Feng A, Xing L
Received 13 May 2020
Accepted for publication 13 October 2020
Published 20 November 2020 Volume 2020:13 Pages 12003—12013
DOI https://doi.org/10.2147/OTT.S261068
Checked for plagiarism Yes
Review by Single anonymous peer review
Peer reviewer comments 2
Editor who approved publication: Prof. Dr. Geoffrey Pietersz
Qiang Wen,1 Zhe Yang,1 Jian Zhu,2 Qingtao Qiu,2 Honghai Dai,1 Alei Feng,1 Ligang Xing3
1Department of Oncology, Shandong Provincial Hospital Affiliated to Shandong University, Shandong University, Jinan 250021, People’s Republic of China; 2Department of Radiation Physics, Shandong Cancer Hospital and Institute, Shandong First Medical University, Jinan 250117, People’s Republic of China; 3Department of Radiation Oncology, Shandong Cancer Hospital and Institute, Shandong First Medical University, Jinan 250117, People’s Republic of China
Correspondence: Zhe Yang
Department of Oncology, Shandong Provincial Hospital Affiliated to Shandong University, Shandong University, Jinan, Shandong 250021, People’s Republic of China
Tel +86-18560222576
Email [email protected]
Background: The present study constructed and validated models to predict PD-L1 and CD8+TILs expression levels in esophageal squamous cell carcinoma (ESCC) patients using radiomics features and clinical factors.
Patients and Methods: This retrospective study randomly assigned 220 ESCC patients to a discovery dataset (n= 160) and validation dataset (n= 60). A total of 462 radiomics features were extracted from the segmentation of regions of interest (ROIs) based on pretreatment CT images of each patient. The LASSO algorithm was applied to reduce the dimensionality of the data and select features. A multivariable logistic regression analysis was adopted to build radiomics signatures. Receiver operating characteristic (ROC) curve analysis was performed to evaluate the predictive accuracy of these models.
Results: There was no significant difference between the training and validation datasets for any clinical factors in patients with ESCC. The PD-L1 expression level correlated with the differentiation degree (p= 0.011) and tumor stage (p= 0.032). Smoking status (p= 0.043) and differentiation degree (p= 0.025) were associated with CD8+TILs expression levels. The radiomics signatures achieved good performance in predicting PD-L1 and CD8+TILs with AUCs= 0.784 and 0.764, respectively. The combined model showed a favorable predictive ability compared to radiomics signatures or clinical factors alone and improved the AUCs from 0.669 to 0.871 for PD-L1 and from 0.672 to 0.832 for CD8+TILs. These results were verified in the validation dataset with the AUCs of 0.817 and 0.795, respectively.
Conclusion: CT-based radiomics features have a potential value for classifying patients according to PD-L1 and CD8+TILs expression levels. The combination of clinical factors and radiomics signatures significantly improved the predictive performance in ESCC.
Keywords: radiomics features, PD-L1, CD8+TILs, esophageal squamous cell carcinoma, computed tomography
Introduction
Esophageal squamous cell carcinoma (ESCC) is a substantial cause of cancer-related death worldwide, with high rates of recurrence and metastasis.1 Despite developments in screening, diagnosis and therapeutic modalities, ESCC patients are generally associated with a poor prognosis, with a 5-year survival rate less than 20%.2 Therefore, the unsatisfactory survival time necessitates a novel treatment strategy and related predictive biomarkers for ESCC patients. The roles of immune checkpoints and tumor-infiltrating lymphocytes (TILs) were investigated in several recent clinical trials and showed inspiring results.3,4
Immunotherapy is changing the therapeutic strategy for ESCC patients via checkpoint inhibitors.5 Antibodies binding to programmed death 1 (PD-1) and programmed death-ligand 1 (PD-L1) reversed the immune escape microenvironment and improved the endogenous antitumor immune response.6 Blockade of the PD-1/PD-L1 pathway is an approved treatment for ESCC patients who are not sensitive to platinum-based chemotherapy.7 There was evidence that monoclonal antibodies hindered the combination of PD-1/PD-L1 and extended patients’ progression-free survival (PFS) or overall survival (OS) with lower side effects8 in various types of malignancies, including lung cancer, colorectal cancer and ESCC.9–11 A large number of previous studies and the NCCN guidelines recommended the PD-L1 expression level as a standard criterion for immune checkpoint inhibitor (ICI) intervention in ESCC.12 However, a certain number of PD-L1-negative or low-positive patients also had a good response to antibodies due to tumor heterogeneity.13 The development of novel surrogate indicators and validation of the related clinical management decisions is a priority for novel treatment. PD-L1 expression level alone was treated as a predictive biomarker of response, and a risk factor to identify patients who were more likely to benefit from antitumor immunotherapy. The tumor immune microenvironment (TIM) has the ability to identify potential candidates for immune-induced anticancer therapy in solid tumors.14 Particularly, cluster of differentiation (CD8) + tumor-infiltrating lymphocytes (TILs), as a marker of main anticancer T-cell effectors, may directly reflect tumor biology and affect immunotherapy efficiency in ESCC.15,16 However, the predictive power of the combination of CD8 with other biomarkers is not clear. Notably, the gold standard for evaluating these factors is primarily immunohistochemical staining (IHC) of biopsy specimens or surgical resection, which is limited in patients with poor condition due to its invasiveness, time consumption, tumor heterogeneity and unrepeatability. Furthermore, it is also difficult to obtain tissue samples from inaccessible locations in some cases. Therefore, examining a novel, accurate and noninvasive method for assessing PD-L1 and CD8+TILs is appealing in clinical practice.
Computed tomography (CT) is widely used for tumor detection, staging and therapeutic response monitoring in clinical practice. Radiomics proposes a method to extract quantitative and high-throughput data from medical images,17 which reflect the underlying pathophysiology and reveal information on tumor phenotypes. Previous studies demonstrated that CT features distinguished epidermal growth factor receptor (EGFR),18 anaplastic lymphoma kinase (ALK) and breast cancer susceptibility gene (BRCA) mutations from the wild type.19,20 Jiang et al reported that PET/CT radiomics features were able to assess PD-L1 expression levels in NSCLC,21 and Yoon et al confirmed these results in patients with lung adenocarcinoma.22 Liao et al developed and validated a radiomics-based biomarker (Rad score) to predict the infiltration of tumor-infiltrating CD8+TILs in hepatocellular carcinoma (HCC).23 However, no investigation has confirmed the relationship between CT quantitative features and PD-L1 or CD8+TILs expression status in esophageal cancer. Theoretically, the tumor phenotype provided by CT radiomics may correlate with PD-L1, CD8+TILs and should be quantitatively analyzed. We hypothesized that pretreatment CT radiomics analysis would effectively reveal PD-L1 and CD8+TILs expression levels in ESCC. The present retrospective study evaluated the predictive performance of pretreatment CT-based radiomics features and clinical factors for PD-L1 and CD8+TILs expression levels, then further established and validated combined predictive models in ESCC.
Patients and Methods
Patient Eligibility
From February 2010 to May 2017, 220 ESCC patients who underwent surgical resection or biopsy without preoperative chemotherapy or radiotherapy were included in this study. Only tissue from primary tumors was investigated. The following inclusion criteria were used: 1) confirmed ESCC by histology; 2) patients underwent pretreatment contrast-enhanced chest, abdomen and neck CT and brain magnetic resonance (MR) scanning for staging and standard radiological evaluation; 3) no previous anticancer therapy; and 4) an Eastern Cooperative Oncology Group performance status (ECOG PS) of 0 to 2. Staging was defined according to the American Joint Committee on Cancer Staging Manual (AJCC) (7th edition).24 Clinical and pathological characteristics are detailed in Table 1. Data are presented as averages and standard deviations or medians and ranges. Computer-generated random numbers were applied to assign 160 patients to the discovery dataset and 60 patients to the validation dataset in this study.
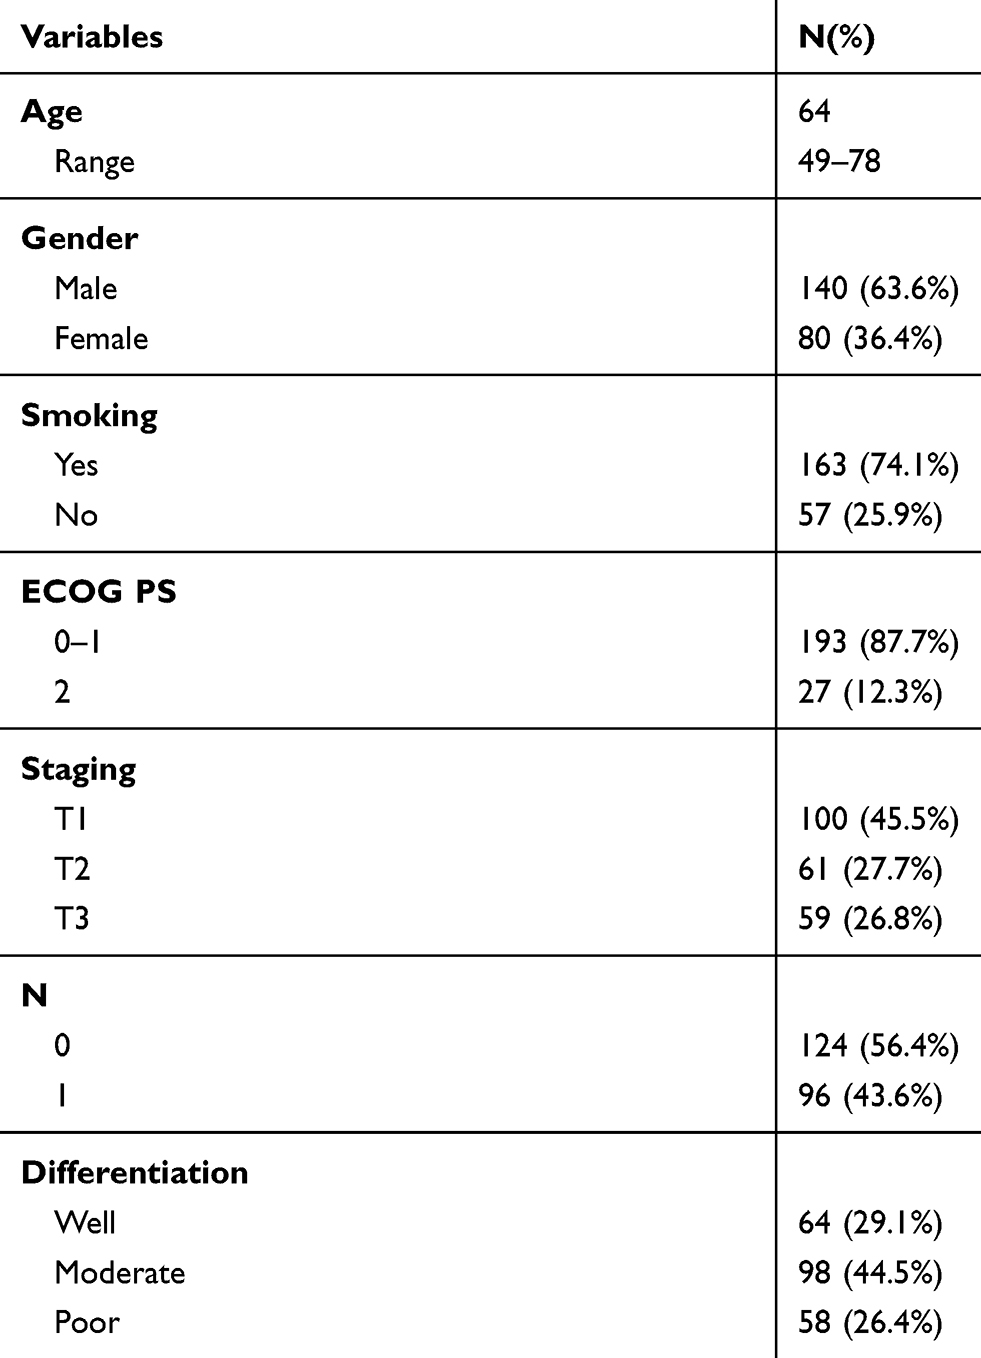 |
Table 1 Patient Characteristics of Enrolled Patients |
This study was approved by the Research Ethics Committee of Shandong Provincial Hospital Affiliated to Shandong University. All protocols were in accordance with the guidelines and the ethical principles stated in the 1964 Helsinki declaration. Informed consent was obtained from all participants.
Immunohistochemistry
Postoperative specimens of all tumors were performed IHC through standard procedure. Four-μm unstained sections were de-waxed in xylene and rehydrated with graded alcohol solution, then subjected to antigen retrieval by microwaving under high pressure for 2 minutes. Sections were stained with the following primary antibodies: anti-PD-L1 (VENTANA, clone(c): sp-263) and anti-CD8 (Beijing Zhongshan Golden Bridge Biotechnology Company, clone SP16) in a humidified chamber at 37°C for 60 minutes and then incubated with the secondary anti-rabbit and anti-mouse antibodies (Beijing Zhongshan Golden Bridge Biotechnology Company) at 37°C for 15min. Subsequently, 3ʹ3ʹdiamino-benzidine (DAB) was performed to visualize PD-L1 and CD8 staining and slides were counterstained with hematoxylin.
Evaluation of PD-L1 and CD8+TILs Expression
Two independent pathologists who were blinded to clinical and pathological information evaluated the immunohistochemical slides, and any disagreement between the two pathologists was resolved via consensus. Similar to previous studies,25 PD-L1 expression was considered positive when membranous or cytoplasmic staining was detected in tumor cells and stromal cells. PD-L1 expression was considered positive if membranous or cytoplasmic staining were detected in tumor cells and stromal cells. PD-L1 staining was estimated by staining-intensity-distribution score, staining intensity was scored as 0(none staining), 1(weak staining, <10% of neoplastic cells staining), 2(moderate staining, 10–50% of neoplastic cells staining) and 3 (strong staining, 10–50% of neoplastic cells staining), respectively. The H-score was calculated by the formula: (Intensity+1) X Percentage. In accordance with Fukouka et al26 and Tumeh et al,27 the expression of CD8+TILs was scored according to the percentage of positive lymphocytes in the stromal compartment in 5 randomly and averagely selected high-power fields (HPFs). Because the cut-off values of PD-L1 and CD8+TILs remain controversial and non-uniform, patients were sub-divided by thresholds, which were defined as median counts.
Computed Tomography Imaging and ROI Segmentation
All patients underwent pretreatment contrast-enhanced diagnostic chest, abdomen and neck CT. CT images were obtained with a 256 detector row CT scanner (Phillips, the Netherlands). The images parameters performed as follows: tube rotation time 0.5s, a voltage of 110–120Kvp, tube current of 150–200mA and reconstruction slice thickness was 2.5mm with standard soft-tissue algorithm reconstruction.
Primary tumor was volumetrically segmented through a semiautomatic algorithm before manual adjustment, which was operated in the lung window at −300–1300 HU and threshold was 0–500HU. GrowCut is a sensitive and fast tumor segmentation method that uses a competitive region growing algorithm that contains the following steps: Initially, we identified the tumor and non-tumor regions with disparate label values, and the algorithm automatically developed regions of interest (ROIs). After that, all of the voxels in the ROIs were labeled iteratively by the algorithm until no voxel could change its label any more. Independent radiologists with rich experience in CT images of esophageal cancer manually modified the contour of ROIs if necessary. Two observers with 10 years and 15 years of experience who were blinded to clinical data reviewed image segmentations, and any difference ≥5% was reached via consensus.
Radiomics Features Extraction and Selection
All features extraction were performed using the open-source Imaging Biomarker Explorer software (IBEX, MD Anderson, Houston, TX, USA). In this work, 462 radiomics features from pretreatment CT images were resampled down to 0.25mm resolution in three directions, which were divided into 6 subtypes, involving size and shape features, histogram intensity features, wavelet feature and texture features (gray-level co-occurrence matrix (GLCM), gray-level run length matrix (GLRLM) and gray-level size zone matrix (GLSZM)). Size and shape features describe the morphological structure of the lesion. Histogram intensity features characterize the distribution of voxel intensities in the tumor. Wavelet features provide a tractable method of decomposing features into different frequency sub-bands. Texture features (GLCM, GLRLM and GLSZM) convey information on the spatial arrangement of the tumor.
CT features were subjected to z-score normalization and transferred to a mean of 0 and a standard deviation of 1 before subsequent analyses. To determine the reproducibility of radiomics features, the interobserver reproducibility of features was calculated by computing the interclass correlation coefficients (ICCs) based on 30 random patients. Features with ICC ≥ 0.9 were considered stable. A machine learning method was used for feature selection and dimension reduction. The least absolute shrinkage and selection operator (LASSO) was applied for selecting the optimal predictive features for PD-L1 and CD8+TILs in the training dataset. The tuning parameter λ was selected in the LASSO through 10-fold cross validation based on minimum criteria.
Model Development and Statistical Analysis
After feature selection, a logistic regression model was developed to validate the efficacy of the selected radiomics features on the basis of radiomics signatures (Rad score), which was calculated via the linear combination of selected features weighted by their respective LASSO coefficients in the training group. Models based on clinical factors or combined clinical factors and radiomics features were constructed using logistic regression for immune factors expression prediction. The area under the curve (AUC) of the receiver operator characteristics (ROC) was calculated to estimate the predictive performance of the models.
Statistical analysis was performed using R software version 3.4.2 (Auckland, New Zealand) and SPSS version 22.0 for Windows (Chicago, USA). The “glment” package was used for executing the LASSO algorithm. The predictive values of radiomics features were performed by the “pROC” package in R software. The Chi-squared test or Fisher’s test was employed to analyze the categorical variables. The Mann–Whitney U-test was used to determine the continuous variable between these groups. All statistical analyses were two sided, and p-value < 0.05 was considered to be significant difference.
Results
Patient Characteristics
A total of 220 patients with ESCC who underwent pretreatment contrast-enhanced chest and abdomen CT were included in this retrospective study. The median age of the discovery dataset was 64 years (range, 49–76). One hundred and forty of the 220 ESCC patients in our study were male, and 80 patients were female. The ECOG PS score was 0–1 for 193 patients and 2 for 27 patients in both groups. According to the TNM staging system, 100 ESCC patients were T1, and the numbers of T2 and T3 were similar at 64 and 58, respectively. Moreover, 98 of patients were moderately differentiated, and only a small proportion of the patients were well and poorly differentiated. Table 2 shows that all demographic factors were similar between the discovery dataset and validation dataset, and there was no statistically significant difference between the two datasets (p> 0.05).
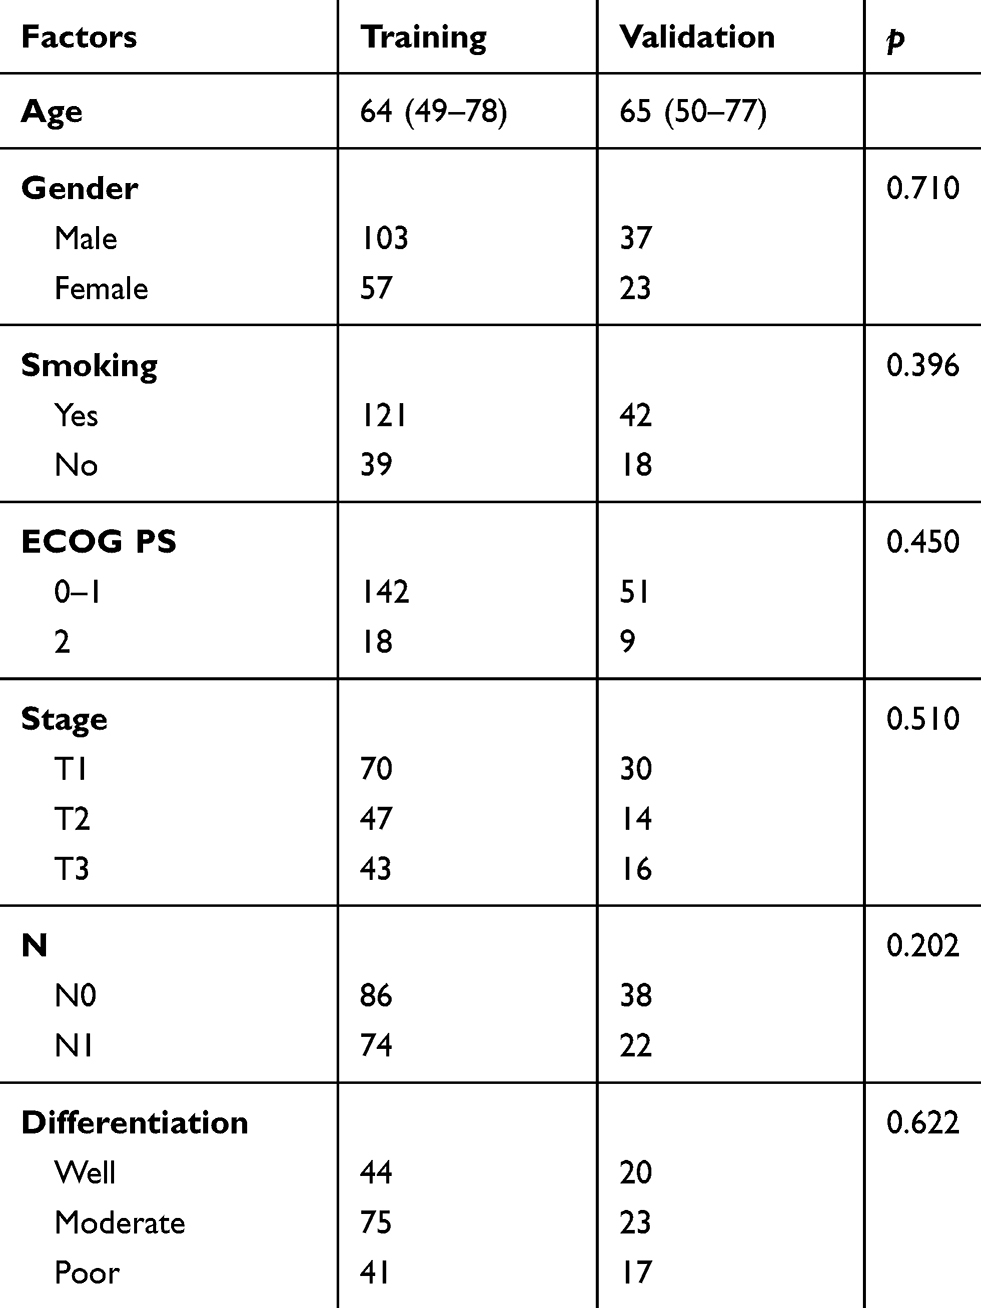 |
Table 2 Clinical Factors of Patients in Training and Validation Set |
Immunohistochemistry Staining
PD-L1 and CD8+TILs expression in patients with ESCC was analyzed. Representative microscopic images are shown in Figure 1. PD-L1 was clearly stained in the cell membrane and cytoplasm of tumor cells and stromal cells. To discriminate groups, the median counts were regarded as cut-off points. PD-L1 staining was detected using H-scores ranging from 10 to 170, and the median count was 40. CD8+TILs staining varied between cases. After excluding fibrotic, necrotic and hemorrhagic areas, the cut-off point for CD8+TILs was 47%/HPF.
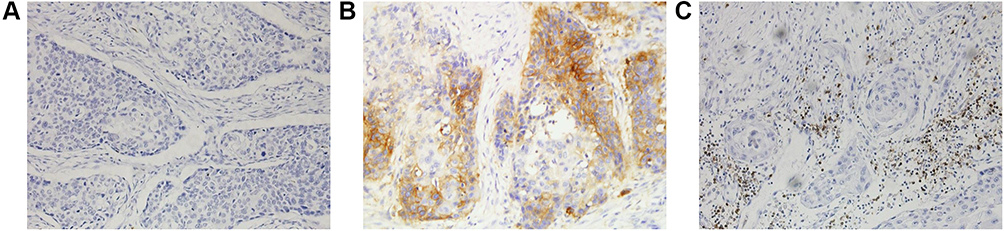 |
Figure 1 Immunohistochemical staining for immunological biomarkers in ESCC (X400). (A) Negative expression. (B) PD-L1 positive. (C) CD8+TILs positive. |
Associations Between Clinical Factors and PD-L1/CD8+TILs Expression
The results of the correlation between pretreatment clinical factors and PD-L1 expression level are summarized in Table 3. Tumor stage and differentiated grade showed apparent differences between the positive and negative PD-L1 groups in the training group (p= 0.032 and 0.011, respectively) and validation group (p= 0.013 and 0.014, respectively). The clinical models achieved moderate performance for PD-L1 prediction with an AUC= 0.669 for the training set and AUC= 0.692 for the validation set (Table 4). CD8+TILs high densities were significantly related to differentiation grade in both datasets (p = 0.025, training; p= 0.037, validation). Smoking status was significantly different between the two groups with p= 0.043 and 0.005, respectively. Table 5 illustrates that smoking status and differentiated grade were selected for the clinical-based model construction. The values of the clinical characteristics were estimated by developing and evaluating the clinical model for CD8+TILs prediction, which yielded AUCs of 0.672 in the training group and 0.660 in the validation groups (Table 6).
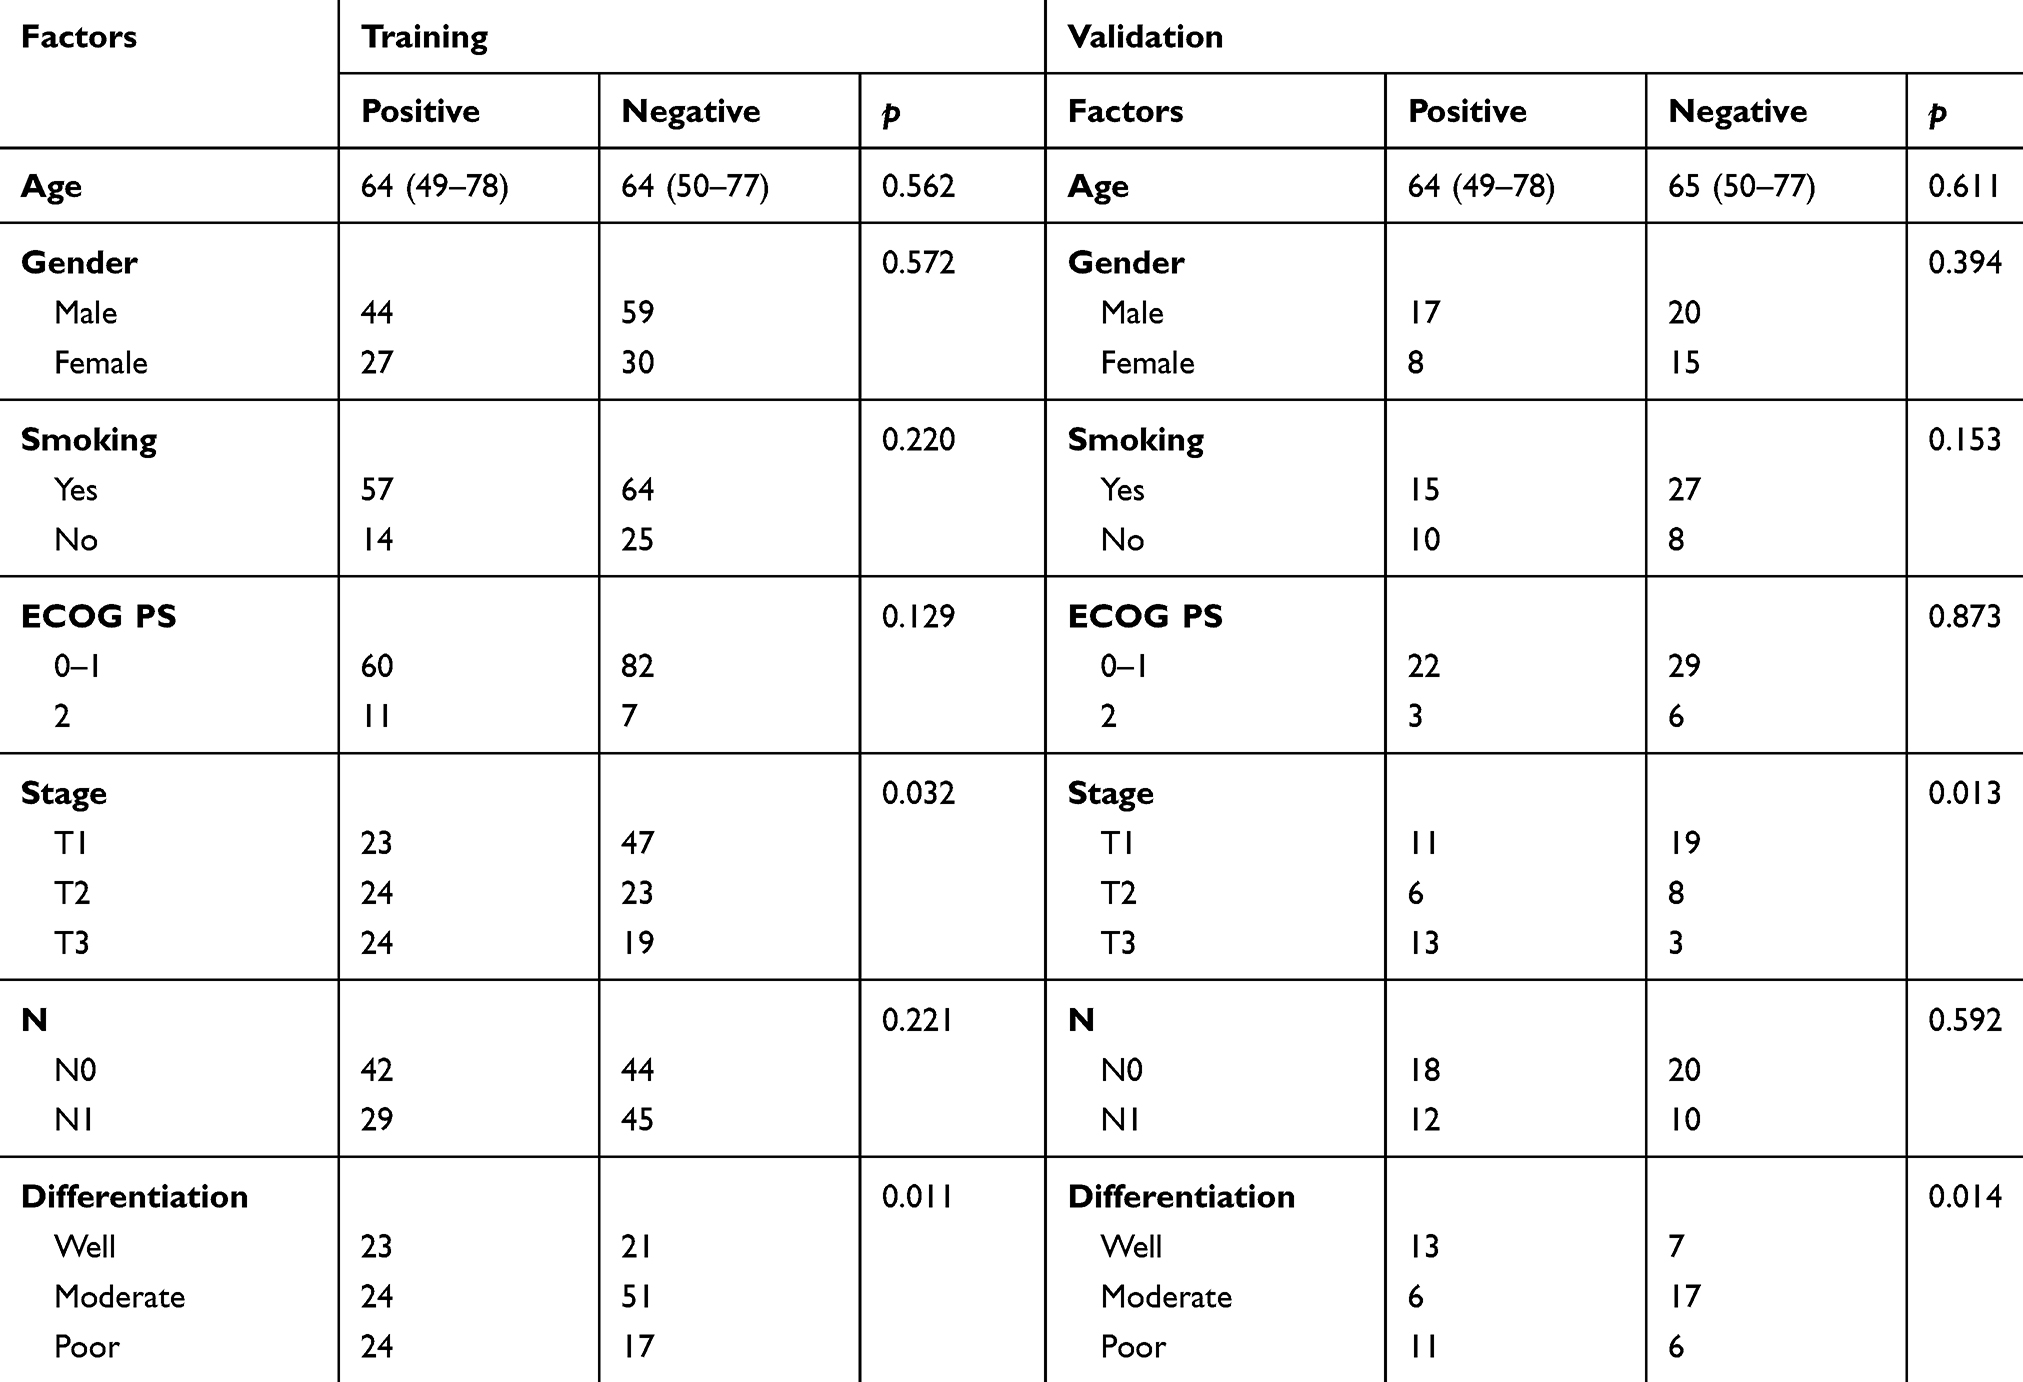 |
Table 3 The Correlation Between PD-L1 Expression Level and Clinicopathological Factors |
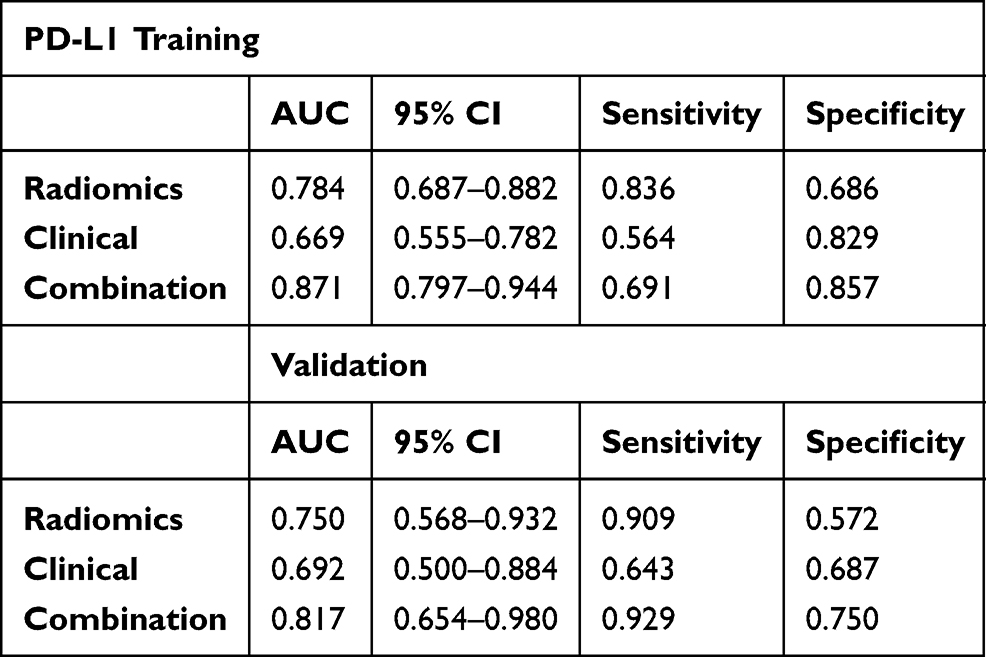 |
Table 4 The Performance of Radiomics Model, Clinical Model and the Combine Model for Predicting PD-L1 Expression Level in the Training and Validation Set |
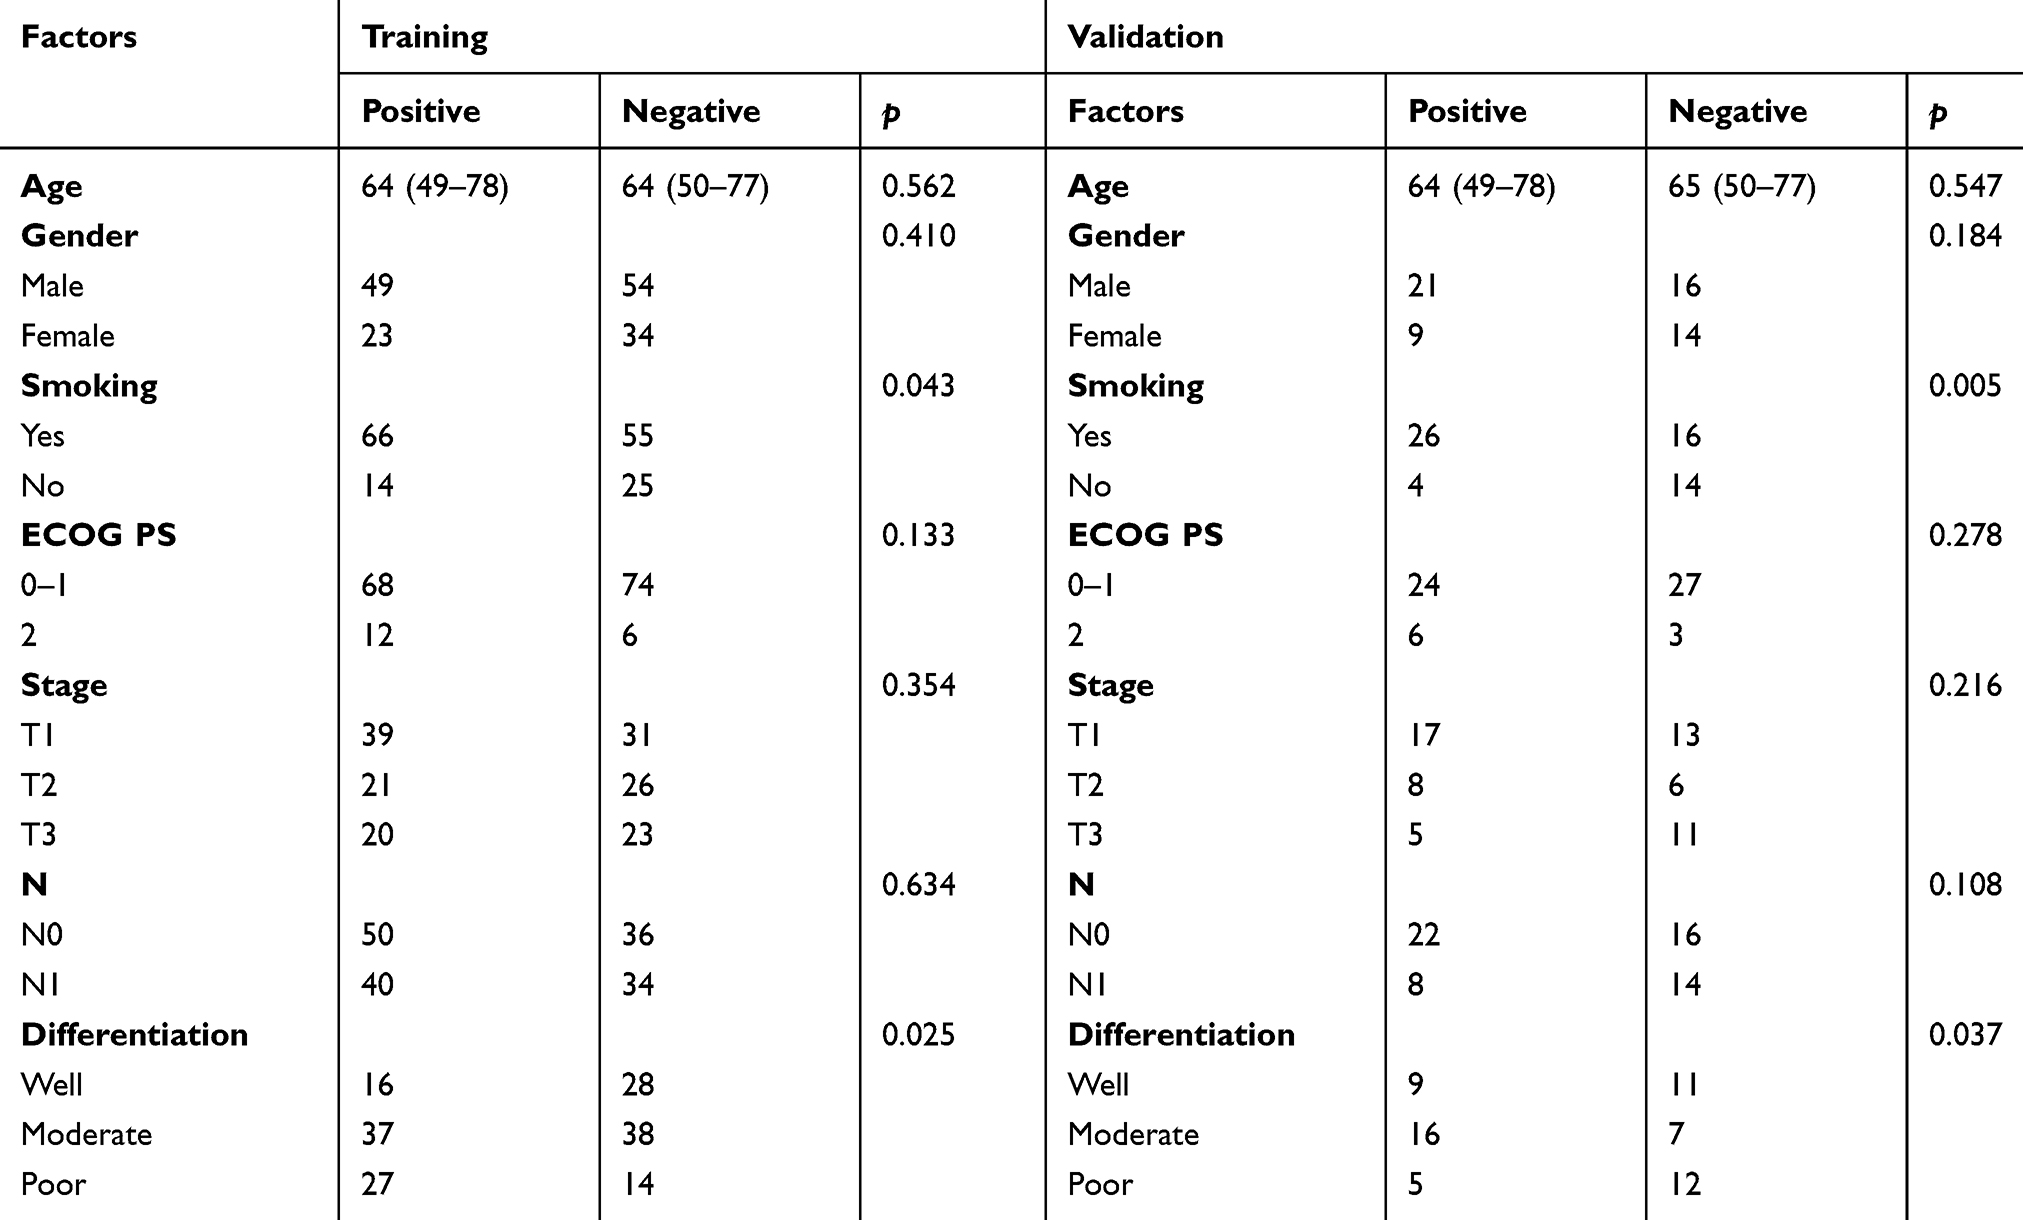 |
Table 5 The Correlation Between CD8+TILs Density and Clinicopathological Factors |
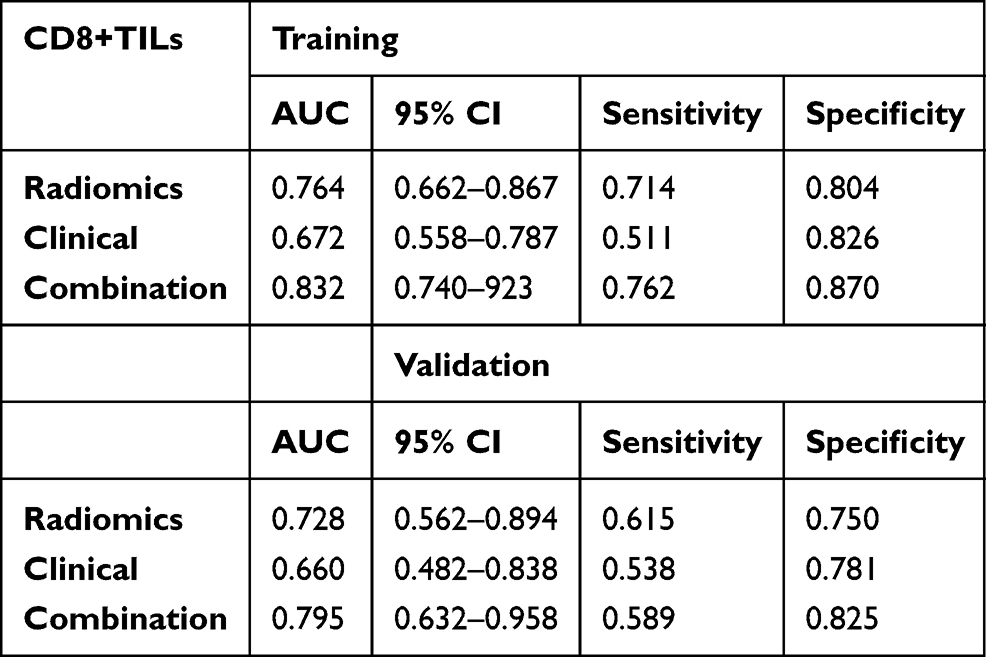 |
Table 6 The Performance of Radiomics Model, Clinical Model and the Combine Model for Predicting CD8+TILs in the Training and Validation Set |
Construction of Radiomics Signatures
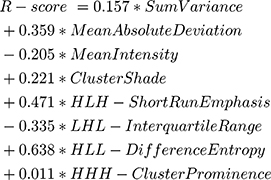
The radiomics analysis contained 462 features, all of which were extracted from segmented pretreatment CT images on the basis of 160 patients with ESCC. After the reproducibility test using an interclass correlation coefficient cut-off value of 0.9, 329 features were preserved for further analysis. To construct the radiomics signatures for PD-L1 and CD8+TILs assessment, 8 potential predictive features for PD-L1 and 8 features for CD8+TILs with nonzero coefficients were selected in the LASSO logistic regression model. The features were weighted according to their corresponding coefficients. The equation for calculating the R-score for PD-L1 prediction:
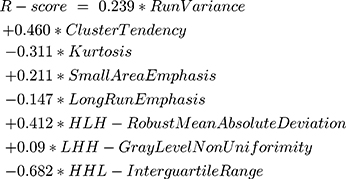
The linear combination of the selected features and their respective coefficients for CD8+TILs prediction:
PD-L1 expression prediction using the above radiomics signature showed a favorable assessment efficacy with an AUC of 0.784 (p <0.001), sensitivity of 0.836 and specificity of 0.686 (Table 4). The radiomics classifier exhibited good performance for the classification of CD8+TILs with AUC= 0.764, sensitivity= 0.714 and specificity= 0.804 (Table 6)
Development and Validation of the Predictive Models
The multivariable combined model showed the best predictive efficiency compared to the clinical model or radiomics signatures alone for PD-L1, which achieved the greatest AUC in the training group (AUC= 0.871) (Figure 2) and validation group (AUC= 0.817). The other combined model distinguished positive CD8+TILs from negative CD8+TILs, which improved the AUC to 0.832 in the training dataset (Figure 3) and AUC= 0.795 in the validation dataset. The characteristic performance of the classifier is listed in Tables 4 and 6 for sensitivity and specificity.
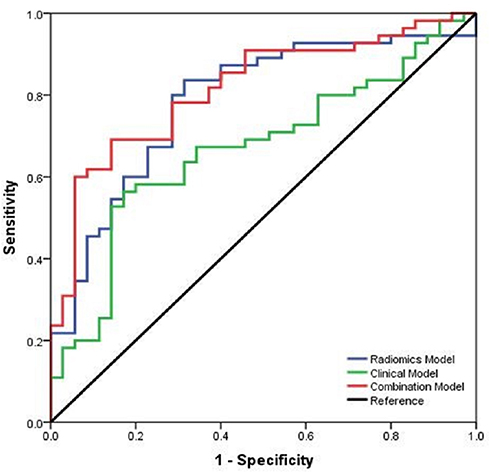 |
Figure 2 Receiver operating characteristic curves (ROC) of the biomarkers for classifying PD-L1 expression level based on clinical factors alone (Green), radiomics features alone (Blue) and a combined model which combined clinical and radiomics features (Red) in the training set. |
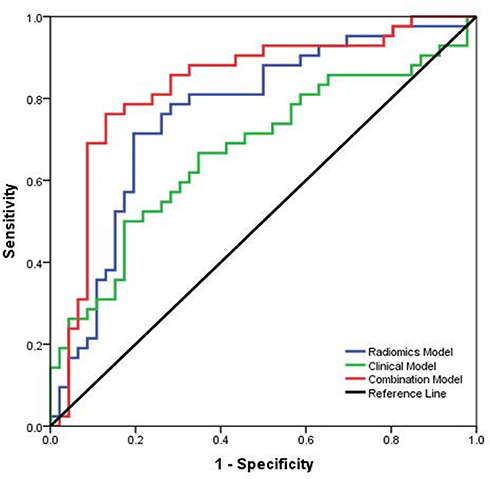 |
Figure 3 Receiver operating characteristic curves (ROC) of the biomarkers for CD8+TILs prediction based on clinical model (Green), radiomics model (Blue) and a combined model which combined clinical and radiomics features (Red) in the training set. |
Discussion
As a novel treatment trend, the importance of immunotherapy has gradually increased in ESCC treatment. A number of randomized trials investigated the binding of checkpoint inhibitors to PD-1 or PD-L1 and reported promising results in ESCC.28,29 Therefore, biomarkers that predict tumor PD-L1 and CD8+TILs expression levels are necessary for ICI intervention in the future. The gold standards for these immunological factor evaluations were primarily detected using IHC staining of biopsy specimens or surgical resection, but these histological methods are unsatisfactory due to tumor heterogeneity and the low percentage of tumor cells. Radiomics extracted large amounts of quantitative features from radiological images, and it quantified tumor phenotypical differences and provided noninvasive predictive information.30,31 The present study observed that clinical and radiomics parameters had potential roles in predicting PD-L1 and CD8+TILs expression in ESCC patients. Our results showed that a combination of clinicopathological variables and imaging features provided support and complementarities for capturing tumor phenotypes, which suggests that radiomics features reveal more characteristics than conventional clinical factors.
High PD-L1 expression was related to a good response to immune checkpoint inhibitors in previous studies and to an adverse prognosis in various tumors, including esophageal cancer.32,33 Nevertheless, few studies demonstrated the opposite results and found that the correlation between positive PD-L1 and response to immunotherapy was weak or the efficacy of ICIs remained low, as Wakita et al34 and Jesinghaus et al35 reported. For the discrepancy in results, in addition to the experimental methods, histological types, ethnically diverse population and antibodies, the evaluation criteria and cut-off values of PD-L1 also deserve discussion. There is no uniform opinion about how to evaluate PD-L1 expression in IHC. Tumor proportion scores (TPS), combined positive score (CPS) and H-score were all used as evaluation criteria in previous research. Cases with PD-L1-stained cells ranging from 1% to 10% of the total tumor cells were considered PD-L1-positive in pancreatic cancer,36 and Yoon et al applied CT radiomics for predicting PD-L1 expression and defined PD-L1 positive as ≥50% (TPS) with any intensity in NSCLC.22 Some research ignored the intensity of staining to a certain extent, which influenced on the PD-L1 predictive accuracy and response to immunotherapy. Consequently, standard evaluation criteria and accurate cut-off values are urgently needed in the future.
Many studies explored the relationship between clinicopathological factors and positive PD-L1 expression, but the results are unstable. Tumor staging and differentiated grade were independent predictors of PD-L1 expression in ESCC in our study. Consistent with our results, Zhu et al37 and Jiang et al38 found that PD-L1 positive expression was associated with deeper tumor depth and poorly differentiated tumors, respectively. Notably, a similar conclusion was confirmed in other tumor types,39,40 although the mechanisms of PD-L1 in tumor growth and differentiation are indistinct and unclear. One reasonable explanation for this result is that the PD-1/PD-L1 pathway mediates immune evasion, which allows tumor cells to proliferate and invades to a greater depth.41 A recent study found that the hypoxic tumor microenvironment caused by tumor invasion depth had an effect on PD-L1 expression.42
The genomic heterogeneity of malignant tumors contributes to regional variations in the stromal structure and may be described as phenotypes using imaging features.43 Several studies have shown that imaging features identified characteristics of tumor gene expression and phenotypes. However, majority of radiomics investigations on esophageal cancer mainly focused on the fields of staging,44 prediction of treatment response45 and prognosis,46,47 and few studies were linked to the phenotype. Chen et al observed that the textural features extracted from 18F-FDG PET images were predictive factors of PD-L1 in 53 head and neck squamous cell carcinomas (HNSCCs) before radiotherapy.48 Jiang et al reported that PET/CT radiomics features could be used to assess PD-L1 expression levels in NSCLC,21 and a similar conclusion was confirmed by Yoon et al in patients with lung adenocarcinoma.22 Our results demonstrated that radiomics-based features were superior to conventional clinical models in identifying PD-L1 expression, but the mechanism of the relationship between radiomics and underlying driving biology must be validated.
Compared to previous studies, we also investigated the association between radiomics features and CD8+TILs density.49 CD8 is primarily expressed on cytotoxic T lymphocytes (CTLs), which kills tumor cells by releasing perforin and mediating immune suppression.50–52 There is evidence that a radiomics-based biomarker (Rad score) predicts the infiltration of tumor-infiltrating CD8+TILs in HCC and identifies potential candidates for immunotherapies.23 The clinical model in the present study had a smaller AUC than the radiomics-based model in the prediction of CD8+TILs, and the quantitative parameters achieved a higher predictive performance and improved the ROC curve. In summary, CT radiomics feature analysis reflected more infiltration characteristics than clinical data and was more easily performed and automatically acquired. Given the basis of molecular characterization, anti-tumor treatment has increasingly focused on the specific characteristics of each patient.53 The desire for optimized and individualized treatment requires an advanced approach, such as radiomics, to improve immunotherapy efficiency in anti-cancer treatment.
Although CT radiomics were studied further in clinical practice, differences in study design and analysis methods were still major challenges for subjective comparison. Radiomics data were susceptible to multiple factors, involving image acquisitions, constructions and segmentations. Consequently, it was necessary to establish a standard protocol for radiomics analysis and improve the performance of prediction and prognosis. Fortunately, the Quantitative Imaging Network (QIN) of the National Institute of Health and other organizations are constantly striving for standardization and normalization.54
There are some shortcomings in this study. Firstly, it was limited due to the retrospective nature of the study. Therefore, future studies must be prospectively evaluated to confirm our results. Secondly, the small number of patients and the single-center study contributed to the conclusion that is hardly generalizable to other institutions or databases. A multicenter study with a large sample size might compensate for this limitation. However, the difference between multicenter CT imaging protocols and variations in CT image acquisitions and reconstructions affected the reproducibility and resulted in inevitable deviation. Thirdly, our study did not detect a correlation between CT radiomics features and treatment effects. CT radiomics has the potential to be a prognostic biomarker of immunotherapy response. Finally, CT images captured the characteristics of underlying tumor biology, combined with multiple modality functional images, such as PET-CT, MR and radiogenomics, which may further improve the predictive ability. Although deficiencies exist, CT imaging features were still significantly related to immunological biomarkers.
Conclusion
In general, the present study demonstrated a strong correlation between pretreatment CT radiomics features and immunological biomarker expression status for patients with ESCC. The combination of radiomics features and clinical variables may improve the predictive performance of identifying PD-L1 and CD8+TIL expression via CT scanning. The predictive model must be validated and evaluated in further prospective cohorts with large sample sizes.
Acknowledgement
This study was supported by the Natural Science Foundation of Shandong (Grant No. ZR201911150022), the special foundation for CSCO-Xinda Cancer Reserach (Grant No. 320.6750.19088-88) and the Natural Science Foundation of China (Grant No. 81502508). The funding sources had no role in the study design, data collection,analysis of interpretation, or the writing of this manuscript.
Author Contributions
All authors made substantial contributions to conception and design, acquisition of data, or analysis and interpretation of data; took part in drafting the article or revising it critically for important intellectual content; agreed to submit to the current journal; gave final approval of the version to be published; and agree to be accountable for all aspects of the work.
Disclosure
The authors have no potential conflicts of interest relevant to the content of this manuscript.
References
1. Ohashi S, Miyamoto S, Kikuchi O, Goto T, Amanuma Y, Muto M. Recent advances from basic and clinical studies of esophageal squamous cell carcinoma. Gastroenterology. 2015;149(7):1700–1715. doi:10.1053/j.gastro.2015.08.054
2. Rustgi AK, El-Serag HB, Ingelfinger JR. Esophageal carcinoma. N Engl J Med. 2014;371(26):2499–2509. doi:10.1056/NEJMra1314530
3. Antonia SJ, López-Martin JA, Bendell J, et al. Nivolumab alone and nivolumab plus ipilimumab in recurrent small-cell lung cancer (CheckMate 032): a multicentre, open-label, Phase 1/2 trial. Lancet Oncol. 2016;17(7):883–895.
4. Yagi T, Baba Y, Ishimoto T, et al. PD-L1 expression, tumor-infiltrating lymphocytes, and clinical outcome in patients with surgically resected esophageal cancer. Ann Surg. 2019;269(3):471–478. doi:10.1097/SLA.0000000000002616
5. Yang J, Riella LV, Chock S, et al. The novel costimulatory programmed death ligand 1/B7. 1 pathway is functional in inhibiting alloimmune responses in vivo. J Immuno. 2011;187(3):1113–1119. doi:10.4049/jimmunol.1100056
6. Leng C, Li Y, Qin J, et al. Relationship between expression of PD-L1 and PD-L2 on esophageal squamous cell carcinoma and the antitumor effects of CD8+ T cells. Oncol Rep. 2016;35(2):699–708. doi:10.3892/or.2015.4435
7. Qu H-X, Zhao L-P, Zhan S-H, et al. Clinicopathological and prognostic significance of programmed cell death ligand 1 (PD-L1) expression in patients with esophageal squamous cell carcinoma: a meta-analysis. J Thorac Dis. 2016;8(11):3197. doi:10.21037/jtd.2016.11.01
8. Herbst RS, Soria J-C, Kowanetz M, et al. Predictive correlates of response to the anti-PD-L1 antibody MPDL3280A in cancer patients. Nature. 2014;515(7528):563–567. doi:10.1038/nature14011
9. Herbst RS, Baas P, Kim D-W, et al. Pembrolizumab versus docetaxel for previously treated, PD-L1-positive, advanced non-small-cell lung cancer (KEYNOTE-010): a randomised controlled trial. Lancet. 2016;387(10027):1540–1550. doi:10.1016/S0140-6736(15)01281-7
10. Droeser RA, Hirt C, Viehl CT, et al. Clinical impact of programmed cell death ligand 1 expression in colorectal cancer. Eur J Cancer. 2013;49(9):2233–2242. doi:10.1016/j.ejca.2013.02.015
11. Chen K, Cheng G, Zhang F, et al. Prognostic significance of programmed death-1 and programmed death-ligand 1 expression in patients with esophageal squamous cell carcinoma. Oncotarget. 2016;7(21):30772. doi:10.18632/oncotarget.8956
12. Guo W, Wang P, Li N, et al. Prognostic value of PD-L1 in esophageal squamous cell carcinoma: a meta-analysis. Oncotarget. 2018;9(17):13920. doi:10.18632/oncotarget.23810
13. Diggs LP, Hsueh EC. Utility of PD-L1 immunohistochemistry assays for predicting PD-1/PD-L1 inhibitor response. Biomark Res. 2017;5(1):12.
14. Jiang D, Liu Y, Wang H, et al. Tumour infiltrating lymphocytes correlate with improved survival in patients with esophageal squamous cell carcinoma. Sci Rep. 2017;7:44823. doi:10.1038/srep44823
15. Kato T, Noma K, Ohara T, et al. Cancer-associated fibroblasts affect intratumoral CD8+ and FoxP3+ T cells via IL6 in the tumor microenvironment. Clin Cancer Res. 2018;24(19):4820–4833. doi:10.1158/1078-0432.CCR-18-0205
16. Noble F, Mellows T, Matthews LHM, et al. Tumour infiltrating lymphocytes correlate with improved survival in patients with oesophageal adenocarcinoma. Cancer Immunol Immunother. 2016;65(6):651–662. doi:10.1007/s00262-016-1826-5
17. Aerts HJ, Velazquez ER, Leijenaar RT, et al. Decoding tumour phenotype by noninvasive imaging using a quantitative radiomics approach. Nat Commun. 2014;5(1):1–9.
18. Liu Y, Kim J, Balagurunathan Y, et al. Radiomic features are associated with EGFR mutation status in lung adenocarcinomas. Clin Lung Cancer. 2016;17(5):441–448. e446. doi:10.1016/j.cllc.2016.02.001
19. Yoon HJ, Sohn I, Cho JH, et al. Decoding tumor phenotypes for ALK, ROS1, and RET fusions in lung adenocarcinoma using a radiomics approach. Medicine. 2015;94:41. doi:10.1097/MD.0000000000001753
20. Rizzo S, Botta F, Raimondi S, et al. Radiomics of high-grade serous ovarian cancer: association between quantitative CT features, residual tumour and disease progression within 12 months. Eur Radiol. 2018;28(11):4849–4859. doi:10.1007/s00330-018-5389-z
21. Jiang M, Sun D, Guo Y, et al. Assessing PD-L1 expression level by radiomic features from PET/CT in nonsmall cell lung cancer patients: an initial result. Acad Radiol. 2020;27(2):171–179.
22. Yoon J, Suh YJ, Han K, et al. Utility of CT radiomics for prediction of PD‐L1 expression in advanced lung adenocarcinomas. Thoracic Cancer. 2020;11(4):993–1004. doi:10.1111/1759-7714.13352
23. Liao H, Zhang Z, Chen J, et al. Preoperative radiomic approach to evaluate tumor-infiltrating CD8+ T cells in hepatocellular carcinoma patients using contrast-enhanced computed tomography. Ann Surg Oncol. 2019;26(13):4537–4547. doi:10.1245/s10434-019-07815-9
24. Rice TW, Blackstone EH, Rusch VW. 7th Edition of the AJCC cancer staging manual: esophagus and esophagogastric junction. Ann Surg Oncol. 2010;17(7):1721–1724. doi:10.1245/s10434-010-1024-1
25. Beckers RK, Selinger C, Vilain R, et al. PDL1 expression in triple-negative breast cancer is associated with tumour-infiltrating lymphocytes and improved outcome. Pathology. 2016;48:S146–S147. doi:10.1016/j.pathol.2015.12.399
26. Fukuoka E, Yamashita K, Tanaka T, Sawada R, Kakeji Y. Neoadjuvant chemotherapy Increases PD-L1 expression and CD8 + tumor-infiltrating lymphocytes in esophageal squamous cell carcinoma. Anticancer Res. 2019;39(8):4539–4548. doi:10.21873/anticanres.13631
27. Tumeh PC, Harview CL, Yearley JH, et al. PD-1 blockade induces responses by inhibiting adaptive immune resistance. Nature. 2014;515(7528):568–571. doi:10.1038/nature13954
28. Muro K, Chung HC, Shankaran V, et al. Pembrolizumab for patients with PD-L1-positive advanced gastric cancer (KEYNOTE-012): a multicentre, open-label, phase 1b trial. Lancet Oncol. 2016;17(6):717–726. doi:10.1016/S1470-2045(16)00175-3
29. Kudo T, Hamamoto Y, Kato K, et al. Nivolumab treatment for oesophageal squamous-cell carcinoma: an open-label, multicentre, Phase 2 trial. Lancet Oncol. 2017;18(5):631–639. doi:10.1016/S1470-2045(17)30181-X
30. Kumar V, Gu Y, Basu S, et al. Radiomics: the process and the challenges. Magn Reson Imaging. 2012;30(9):1234–1248. doi:10.1016/j.mri.2012.06.010
31. Lambin P, Van Stiphout RG, Starmans MH, et al. Predicting outcomes in radiation oncology—multifactorial decision support systems. Nat Rev Clin Oncol. 2013;10(1):27–40.
32. Wang A, Wang H, Liu Y, et al. The prognostic value of PD-L1 expression for non-small cell lung cancer patients: a meta-analysis. Eur J Surg Oncol. 2015;41(4):450–456. doi:10.1016/j.ejso.2015.01.020
33. Wang Q, Feng F, Wang F, et al. PD-L1 expression on tumor cells was associated with unfavorable prognosis in esophageal squamous cell carcinoma. J Cancer. 2018;9(12):2224.
34. Wakita A, Motoyama S, Nanjo H, et al. PD-L1 expression is a prognostic factor in patients with thoracic esophageal cancer treated without adjuvant chemotherapy. Anticancer Res. 2017;37(3):1433–1441.
35. Jesinghaus M, Steiger K, Slotta-Huspenina J, et al. Increased intraepithelial CD3+ T-lymphocytes and high PD-L1 expression on tumor cells are associated with a favorable prognosis in esophageal squamous cell carcinoma and allow prognostic immunogenic subgrouping. Oncotarget. 2017;8(29):46756. doi:10.18632/oncotarget.18606
36. Iwatate Y, Hoshino I, Yokota H, et al. Radiogenomics for predicting p53 status, PD-L1 expression, and prognosis with machine learning in pancreatic cancer. Br J Cancer. 2020;1–9.
37. Zhu Y, Li M, Mu D, et al. CD8+/FOXP3+ ratio and PD-L1 expression associated with survival in pT3N0M0 stage esophageal squamous cell cancer. Oncotarget. 2016;7(44):71455. doi:10.18632/oncotarget.12213
38. Jiang Y, Lo AW, Wong A, et al. Prognostic significance of tumor-infiltrating immune cells and PD-L1 expression in esophageal squamous cell carcinoma. Oncotarget. 2017;8(18):30175. doi:10.18632/oncotarget.15621
39. Nakanishi J, Wada Y, Matsumoto K, Azuma M, Kikuchi K, Ueda S. Overexpression of B7-H1 (PD-L1) significantly associates with tumor grade and postoperative prognosis in human urothelial cancers. Cancer Immunol Immunother. 2007;56(8):1173–1182. doi:10.1007/s00262-006-0266-z
40. Lin Z, Xu Y, Zhang Y, et al. The prevalence and clinicopathological features of programmed death-ligand 1 (PD-L1) expression: a pooled analysis of literatures. Oncotarget. 2016;7(12):15033. doi:10.18632/oncotarget.7590
41. Muenst S, Schaerli A, Gao F, et al. Expression of programmed death ligand 1 (PD-L1) is associated with poor prognosis in human breast cancer. Breast Cancer Res Treat. 2014;146(1):15–24. doi:10.1007/s10549-014-2988-5
42. Noman MZ, Desantis G, Janji B, et al. PD-L1 is a novel direct target of HIF-1α, and its blockade under hypoxia enhanced MDSC-mediated T cell activation. J Exp Med. 2014;211(5):781–790.
43. O’Connor JP, Rose CJ, Waterton JC, Carano RA, Parker GJ, Jackson A. Imaging intratumor heterogeneity: role in therapy response, resistance, and clinical outcome. Clin Cancer Res. 2015;21(2):249–257. doi:10.1158/1078-0432.CCR-14-0990
44. Dong X, Xing L, Wu P, et al. Three-dimensional positron emission tomography image texture analysis of esophageal squamous cell carcinoma: relationship between tumor 18F-fluorodeoxyglucose uptake heterogeneity, maximum standardized uptake value, and tumor stage. Nucl Med Commun. 2013;34(1):40–46. doi:10.1097/MNM.0b013e32835ae50c
45. Zhang H, Tan S, Chen W, et al. Modeling pathologic response of esophageal cancer to chemoradiation therapy using spatial-temporal 18F-FDG PET features, clinical parameters, and demographics. Int J Radiat Oncol Biol Phys. 2014;88(1):195–203. doi:10.1016/j.ijrobp.2013.09.037
46. Yip C, Landau D, Kozarski R, et al. Primary esophageal cancer: heterogeneity as potential prognostic biomarker in patients treated with definitive chemotherapy and radiation therapy. Radiology. 2014;270(1):141–148. doi:10.1148/radiol.13122869
47. Yip C, Davnall F, Kozarski R, et al. Assessment of changes in tumor heterogeneity following neoadjuvant chemotherapy in primary esophageal cancer. Dis Esophagus. 2015;28(2):172–179. doi:10.1111/dote.12170
48. Chen R-Y, Lin Y-C, Shen W-C, et al. Associations of tumor PD-1 ligands, immunohistochemical studies, and textural features in 18 F-FDG PET in squamous cell carcinoma of the head and neck. Sci Rep. 2018;8(1):1–10.
49. Schumacher K, Haensch W, Röefzaad C, Schlag PM. Prognostic significance of activated CD8+ T cell infiltrations within esophageal carcinomas. Cancer Res. 2001;61(10):3932–3936.
50. Hodi FS, O’Day SJ, McDermott DF, et al. Improved survival with ipilimumab in patients with metastatic melanoma. N Engl J Med. 2010;363(8):711–723. doi:10.1056/NEJMoa1003466
51. Lee H, Park DJ, Kim WH, Kim -H-H, Lee HS. High FOXP3+ regulatory T-cell density in the sentinel lymph node is associated with downstream non-sentinel lymph-node metastasis in gastric cancer. Br J Cancer. 2011;105(3):413–419. doi:10.1038/bjc.2011.248
52. Hatogai K, Kitano S, Fujii S, et al. Comprehensive immunohistochemical analysis of tumor microenvironment immune status in esophageal squamous cell carcinoma. Oncotarget. 2016;7(30):47252. doi:10.18632/oncotarget.10055
53. Chen K, Zhu Z, Zhang N, et al. Tumor-infiltrating CD4+ lymphocytes predict a favorable survival in patients with operable esophageal squamous cell carcinoma. Med Sci Monit. 2017;23:4619.
54. Clarke LP, Nordstrom RJ, Zhang H, et al. The quantitative imaging network: NCI’s historical perspective and planned goals. Transl Oncol. 2014;7(1):1. doi:10.1593/tlo.13832
 © 2020 The Author(s). This work is published and licensed by Dove Medical Press Limited. The
full terms of this license are available at https://www.dovepress.com/terms
and incorporate the Creative Commons Attribution
- Non Commercial (unported, 3.0) License.
By accessing the work you hereby accept the Terms. Non-commercial uses of the work are permitted
without any further permission from Dove Medical Press Limited, provided the work is properly
attributed. For permission for commercial use of this work, please see paragraphs 4.2 and 5 of our Terms.
© 2020 The Author(s). This work is published and licensed by Dove Medical Press Limited. The
full terms of this license are available at https://www.dovepress.com/terms
and incorporate the Creative Commons Attribution
- Non Commercial (unported, 3.0) License.
By accessing the work you hereby accept the Terms. Non-commercial uses of the work are permitted
without any further permission from Dove Medical Press Limited, provided the work is properly
attributed. For permission for commercial use of this work, please see paragraphs 4.2 and 5 of our Terms.