")
Back to Journals » International Journal of Nanomedicine » Volume 18
Preparation of the Levo-Tetrahydropalmatine Liposome Gel and Its Transdermal Study
Authors Zhang G, Li X, Huang C, Jiang Y, Su J, Hu Y
Received 27 May 2023
Accepted for publication 3 August 2023
Published 14 August 2023 Volume 2023:18 Pages 4617—4632
DOI https://doi.org/10.2147/IJN.S422305
Checked for plagiarism Yes
Review by Single anonymous peer review
Peer reviewer comments 2
Editor who approved publication: Dr Yan Shen
Guizhen Zhang,1,* Xuejian Li,1,* Chunyun Huang,1 Yuanyuan Jiang,1 Jian Su,1 Ying Hu2
1Guangxi Scientific Research Center of Traditional Chinese Medicine, Guangxi University of Chinese Medicine, Nanning, Guangxi, People’s Republic of China; 2Faculty of Pharmacy, Guangxi University of Chinese Medicine, Nanning, Guangxi, People’s Republic of China
*These authors contributed equally to this work
Correspondence: Jian Su, Guangxi Key Laboratory of Zhuang and Yao Ethnic Medicine, Guangxi Scientific Research Center of Traditional Chinese Medicine, Guangxi University of Chinese Medicine, 13 Wuhe Avenue, Nanning, Guangxi, 530200, People’s Republic of China, Tel +86-0771-3946492, Fax +86-0771-3946492, Email [email protected] Ying Hu, Department of Pharmacology, Faculty of Pharmacy, Guangxi University of Chinese Medicine, 13 Wuhe Avenue, Nanning, Guangxi, 530200, People’s Republic of China, Tel +86-0771-3946492, Fax +86-0771-3946492, Email [email protected]
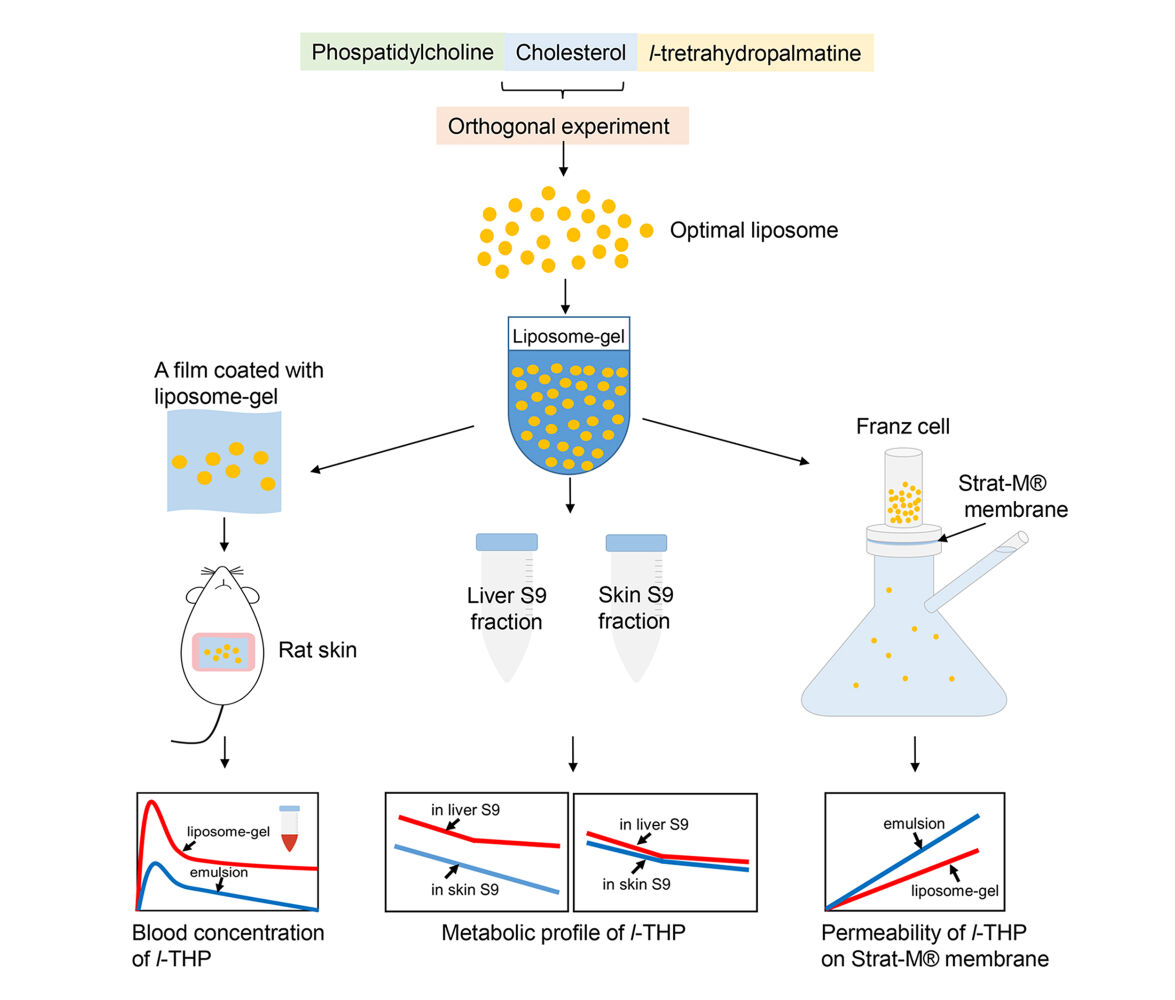
Purpose: The aim of this study was to develop a liposome gel containing levo-tetrahydropalmatine (l-THP) and evaluate its transdermal properties.
Methods: A L16 (43) orthogonal experiment was conducted to optimize the preparation of l-THP liposomes and assess their characterization and stability in a gel. The transdermal features were analyzed through in vivo and in vitro experiments on rats and Strat-M® membrane, respectively. The metabolism of l-THP in liver and skin S9 fractions was also studied.
Results: The optimization of the orthogonal experiment revealed that the ideal mass ratio of phosphatidylcholine, cholesterol, and l-THP during preparation was 10:1:3. The resulting liposome exhibited a particle size of 68 nm, a PDI of 0.27, a drug loading of 4.33%, an encapsulation of 18.79%, and a zeta potential of − 41.27 mV. Both the l-THP and its liposome-gel formulation were found to be stable for a duration of 45 days at 4 °C and 30 °C. During the in vivo transdermal study, the maximum concentration (Cmax) of l-THP from the liposome gel was 0.16 μg/mL, and the time to reach this maximum concentration (tmax) was 1.2 hours. The relative bioavailability of l-THP in the liposome gel was 233.8% compared to the emulsion. The concentration of l-THP (prepared in PBS) decreased at a rate of 0.0067 μg/mL/min in the liver S9 fraction and 0.0027 μg/mL/min in the skin S9 fraction, however, this difference was not observed when l-THP was encapsulated in liposomes. l-THP passed through the Strat-M® membrane at a rate of 0.0032 mg/cm2/h and 0.002 mg/cm2/h for the emulsion and liposome gel, respectively.
Conclusion: The optimal process for the preparation of l-THP liposomes was obtained. Compared to the emulsion, the liposomes provided greater bioavailability when used transdermally. The liposomes also provided greater stability for l-THP during storage.
Keywords: liposome, transdermal property, l-tetrahydropalmatine, S9 fraction, orthogonal experiment, stability
Graphical Abstract:
Introduction
The levo-enantiomer of tetrahydropalmatine (l-THP) is categorized as a tetrahydroprotoberberine isoquinoline alkaloid.1 This compound is found in various plants,2 including Corydalis yanhusuo W. T. Wang, which has been used in Chinese traditional medicine for a long time due to its ability to activate blood, reinforce vital energy, and relieve pain.3 l-THP has been considered one of the major active compounds of Corydalis yanhusuo.4 Its pharmacological information has been extensively reviewed in a recent publication.2 l-THP has been shown to possess numerous pharmacological effects, such as anti-opioid-addiction, analgesic, anti-inflammatory, neuroprotective, anti-cancer, and hypotensive activity.
The efficacy of l-THP is widely recognized, but its oral administration has been found to have low bioavailability. Studies conducted on rats have shown that the bioavailability of l-THP prepared in three different formulations was 10.4%, 2.5%, and 17.8%, respectively.5 Another study on rabbits showed the bioavailability of l-THP to be 1.24%.6 The poor bioavailability is likely due to poor intestinal absorption and first-pass metabolism.7,8 To address this issue, a transdermal formulation may be a viable option. Transdermal drug delivery has many advantages over oral delivery, as it avoids first-pass metabolism and provides less fluctuations in plasma drug levels. Additionally, it results in good patient compliance with ease of termination of drug delivery.9 The topical use of Corydalis yanhusuo in Chinese traditional medicine provides circumstantial evidence for this approach, and several studies have provided transdermal information in this regard.10–12
Liposomes are a sophisticated approach to drug delivery systems. They are primarily composed of lipids and fatty acids that are assembled into bilayer spheres, with the hydrophilic head groups facing the exterior environment and the hydrocarbon chains assembling within the hydrophobic interior of the bilayer. This structure enables liposomes to encapsulate and deliver both hydrophilic and hydrophobic substances.13,14 Liposomes are considered biocompatible, as the composition of lipids and fatty acids is a natural occurrence in cell membranes.15 Extensive research has been conducted on the use of liposomes in transdermal formulations for various medical conditions, including nutrient deficiencies, transcutaneous immunization, rheumatism, and analgesics.16–19 The use of liposomes as a carrier offers several advantages, such as relieving adverse effects, improving bioavailability, controlling drug release, avoiding gastrointestinal problems and first-pass metabolism, and providing greater drug stability.20
Rodents, particularly rats, have been extensively employed as the animal model in both in vivo and in vitro studies to predict transdermal absorption in human skin during the development of transdermal formulations. The advantages of using rats are their small size for easier handling and the similarity in thickness between rat and human stratum corneum, which is considered to be the main barrier to permeability.21,22 Numerous studies have been conducted to compare permeation through human and rat skin; the skin from the dorsal and abdominal areas of rats was most commonly used in transdermal studies.22–25 A histologic study by Monteiro-Riviere et al compared the thickness and the number of cell layers across the body sites, finding that the skin from the abdominal area was thinner and had a higher blood flow than the dorsal area.26
The current research involved the development of a formulation wherein l-THP was encapsulated within liposomes and subsequently embedded in a gel. The transdermal properties of this formulation were assessed through in vivo and in vitro studies.
Materials and Methods
Chemicals
l-THP was obtained from Xi’an Yunyue Biotechnology Co., Ltd. Soybean phosphatidylcholine (Cat# D0105) and cholesterol (Cat# D0010) were obtained from Hefei BOSF Biotechnology Co., Ltd. Carbomer 940 was purchased from Zhejiang Yinuo Biotechnology Co., Ltd. Triethanolamine, dichloromethane, absolute ethanol, and methanol were purchased from Sinopharm Chemical Reagent Co., Ltd. Polysorbate 80 was purchased from Guangzhou SuiXin Chemical Co., Ltd. The blank oil-in-water emulsion was obtained from Guangzhou Boxin Cosmetics Co., Ltd. Formic acid and acetonitrile (LC/MS grade) were purchased from Thermo Fisher Scientific Inc. Bovine albumin (Cat# A8020) and Coomassie Brilliant Blue G-250 (Cat# C8420) were purchased from Beijing Solaibao Technology Co., Ltd (China). Metoprolol tartrate was obtained from the National Institutes for Food and Drug Control, (Cat# TC5E-NENE). NADPH-Na4 was purchased from Anhui Cool Biological Engineering Co. Ltd. Strat-M® membrane (Cat# SKBM025TP) was purchased from Merck KGaA (Germany).
Animals
The male Sprague Dawley rats, weighing 160–180 g, were obtained from Hunan SJA Laboratory Animal Co., Ltd. The rats were allowed to become familiar with the environment for one week. They were housed in a room with a constant temperature of 25 ± 2 °C, humidity ranging from 40% to 60%, and a 12-hour light-dark cycle. Standard food (code: MD17122, Medicience Ltd.) and water were provided ad libitum. All experimental designs were approved by the Institutional Animal Ethics and Welfare Committee of Guangxi University of Chinese Medicine (reference no. DW20221221-243). All experiments were carried out in accordance with the guideline of “Laboratory animals—Guideline for ethical review of animal welfare”, which was issued by the Standardization Administration of P.R.C. Efforts were made to minimize the pain and suffering of the animals.
Preparation of Liposome
A mixture of 2 g of phosphatidylcholine (PC), 0.2 g of cholesterol (CHL), and 0.6 g of l-THP was dissolved in 50 mL of dichloromethane in a round-bottom flask. The solvent was then evaporated using a rotary evaporator with a 45 °C water bath to create a thin lipid film. Next, 200 mL of distilled water was added to the dry lipid film to suspend the materials. The mixture was then transferred to a 250 mL beaker and stirred on a magnetic stirrer at 700 rpm for 3 hours. The hydrated lipid was then sonicated using a probe sonicator (JY92-IIN, Ningbo Scientz Biotechnology Co., Ltd., China) at a power of 250 W for 40 seconds, followed by passing it through a high-pressure homogenizer (NanoGenizer30k, Genizer LLC., USA) at the maximum pressure of 30,000 psi three times. The homogenate was centrifuged at 3000 rpm for 5 minutes to remove any visible precipitates, and a liposome suspension was obtained. The liposome suspension was then centrifuged in an ultracentrifuge (CP100NX, Hitachi Ltd., Japan) at 100,000×g for 1 hour to obtain the liposome pellet. During the optimization experiment to prepare the liposomes, the process of preparation was conducted following this protocol, except for the alteration of the amounts of the materials.
Optimization of Liposome Preparation
For the preparation of liposomes, three factors were evaluated: the mass ratio between PC and CHL (A), the mass ratio between PC and l-THP (B), and the concentration of PC during the hydration process (C).
Single-Factor Experiment
The mass ratios of PC to l-THP (Factor A) were tested at 10:1, 10:2, 10:3, 10:4, and 10:5, while the mass ratios of PC to CHL (Factor B) were tested at 10:1, 10:3, 10:5, 10:7, and 10:10. The concentration of PC was also varied during the hydration process (Factor C), ranging from 10 to 50 mg/mL. Tables 1–3 displays the single-factor experimental design.
 |
Table 1 The Characterization of Liposomes Varied by Different Ratios of PC to l-THP (Factor A) |
 |
Table 2 The Characterization of Liposomes Varied by Different Ratios of PC to CHL (Factor B) |
 |
Table 3 The Characterization of Liposomes Varied by Different Concentrations of PC During the Hydration Process (Factor C) |
Orthogonal Experiment
Based on the results of previous single-factor experiments, four levels were selected for each factor, as shown in Table 4. The details of the orthogonal test table L16 (43), which includes three factors and four levels each, can be found in Table 5.
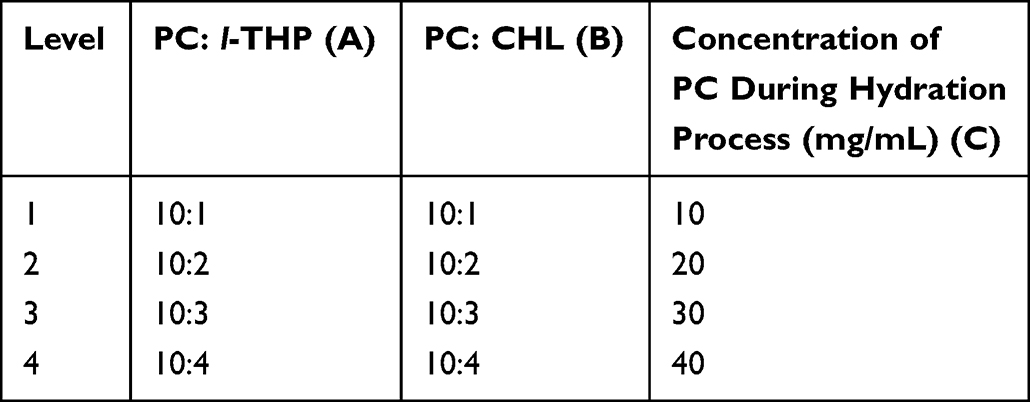 |
Table 4 Influencing Factors and Levels of L16 (43) Orthogonal Experiment |
 |
Table 5 The L16 (43) Orthogonal Test Table and Results |
The Validated Experiment
The optimal combination of factors and levels derived from the orthogonal experiment was selected and subsequently prepared according to the instructions detailed in the section on “Preparation of liposome”. The accuracy of the orthogonal results was confirmed by liposome characterization.
Liposome Characterization
Transmission Electron Microscope (TEM)
After passing through the high-pressure homogenizer, the liposome suspension was diluted with distilled water 20-fold. Following this, 10 μL of the diluted liposomes were placed on a TEM copper grid and allowed to settle for 1 minute. The excess water was then removed using filter paper, and uranyl acetate staining was applied. The grid was then left to dry for a few minutes before being observed for liposome morphology using a TEM (Hitachi, HT7800, Japan) operating at 80 kV.
Zeta Potential, Particle Size, and Distribution
The particle size, zeta potential, and polydispersity index (PDI) of the liposome were analyzed using a Malvern Laser Particle Size Analyzer (Nano ZS90, Malvern Instruments Ltd., UK).
Encapsulation Efficiency and Drug Loading
Encapsulation and drug loading were calculated using the following formulas:


To quantify l-THP, PC, and CHL in liposomes, the liposome pellet collected from 5 mL of the liposome suspension through ultra-high-speed centrifugation was dissolved in 25 mL of absolute ethanol for l-THP and PC analysis, and in 50 mL of absolute ethanol for CHL analysis, respectively, using the UPLC method as described in the section on “Chromatographic Conditions”.
Preparation of l-THP Liposome Gel and Emulsion
To prepare the l-THP liposome gel, 0.1 g of Carbomer 940 was soaked in 1 mL of water for 5 hours until it completely dissolved, and then mixed with 1 mL of water containing 10 μL of Kathon. Liposome pellets containing l-THP were re-suspended in 4 mL of distilled water, and then added to the Carbomer solution by stirring. After that, 0.1 mL of triethanolamine was added to prepare the liposome gel.
To prepare the l-THP emulsion, 10 g of the blank emulsion was warmed up in a water bath (70 °C) until it transformed into a liquid form, followed by adding 10 μL of Kathon. Then, 15 mg of l-THP, which was pre-dissolved in 0.1 mL of polysorbate 80, was added and stirred until the temperature decreased and an emulsion formed again. The calculated concentration of l-THP in the liposome-gel or emulsion was 1.5 mg/mL.
Stability of the Liposome Gel
The liposome-gel and emulsion prepared above were packaged in light-resistant containers and then kept at 4 °C, 30 °C, and 40 °C, respectively. At 0, 30, and 45 days after preparation, liposome characteristics and the concentration of l-THP were analyzed in triplicate. To quantify l-THP in the liposome gel, 0.5 g of the gel was dissolved in 10 mL of water and then centrifuged at 100,000×g for 1 hour. The precipitate was dissolved in 10 mL of absolute ethanol for UPLC analysis, as described in section on “Chromatographic Conditions”. The emulsion was used as a reference for l-THP stability study.
Chromatographic Conditions
To analyze l-THP, PC, and CHL in liposomes, a Waters Acquity UPLC system (Waters Corporation, USA) was used with an Acquity UPLC BEH C18 column (1.7 μm, 2.1×50 mm, Waters). The column temperature was set at 40 °C, and the mobile phase was methanol with a flow rate of 0.3 mL/min. The injection volume was 10 μL, and the run time for analysis was 10 minutes. The detected wavelength was 280 nm for l-THP. An evaporative light-scattering detector (ELSD) was used to detect PC and CHL. The drift tube temperature was set at 70 °C, and the nitrogen gas pressure was 40 psi. The nebulizer cooler was turned on, and the gain was set to 500. The amounts of each compound were calculated from a standard curve derived from a series of standard reference solutions that covered the sample concentration. Correlation coefficients of the standard curve were subsequently obtained by linear regression analysis. The stability of the samples, as well as the precision and accuracy of the analysis, were verified by comparing the peak area of the sample in different solutions.
A Waters Acquity UPLC-MS system (Waters Corporation, USA) was used for the analysis of l-THP in blood and the S9 mixture. Chromatographic separation was performed on a Waters Acquity HSS T3 column (2.1 × 100 mm, 1.8 μm). All samples were eluted with a gradient of acetonitrile (A) and water with 0.1% formic acid (B), at a flow rate of 0.3 mL/min at 40 °C. The gradient sequence was 30–100% A from 0–7 minute and kept at 100% for 1 minute, and then decreased to 30% in 2 minutes. The injection volume was 2 μL.
Mass Spectrometry Conditions
Mass spectrometry was performed on a Waters Xevo Q-TOF Mass Spectrometer (Waters Corporation, USA) equipped with an Electrospray Ionization (ESI) source in positive-ion mode. The following conditions were applied: the desolvation gas flow of 800 L/h, the desolvation gas temperature of 450 °C, the capillary voltage of 3.0 kV, the cone voltage of 40 V, the collision gas flow of 45 L/h, and the source temperature of 100 °C. Data were acquired in MSE mode, and the scan time was 0.5 s with a 0.02 seconds interscan delay. The range of m/z was 50–2000 Da. The mass signals were acquired and processed by Masslynx 4.1 and Progenesis QI software.
In vivo Transdermal PK Study
Preparing the Animal for Transdermal Study
The animal was anesthetized with isoflurane. Then, the hair in the abdominal area was shaved off using a shaver. After that, the area was coated with a depilatory cream (Reckitt Benckiser Group Plc., UK) which was allowed to stay on the skin for two minutes to completely remove the remaining hairs.
Experimental Design
Thirty animals were randomly divided into two groups. The first group was treated with the l-THP liposome gel, and the other group was treated with the l-THP emulsion transdermally, following the protocol described in the following section. Each group consisted of 15 animals, with three animals assigned for each of the designated time points of 1, 4, 8, 12, and 24 hours subsequent to treatment. Additionally, a further three animals underwent hair removal but did not receive any treatment and were employed as blank controls.
In vivo Transdermal Study
The experiment was carried out 24 hours after hair removal. On a 6 cm x 6 cm square piece of Parafilm, 0.4 g of liposome gel containing 0.6 mg of l-THP was spread evenly with a thickness of 0.2 mm using a blade spreader (1806/50, BEVS Industrial Co., Ltd., China). The gel-coated Parafilm was then attached to the hairless skin of the rat’s abdomen and secured with a medical elastic sleeve of 5 cm width, which was suitable for the current experiment. The medical elastic sleeve was transversely cut into a 7 cm long piece, and stretched to put the rat into it and allowed the elastic sleeve to contract to wrap the lower part of the rat’s body, followed by wrapping one layer of medical adhesive tape outside the elastic sleeve. This method kept the gel-coated film on the abdomen of the animal for up to 24 hours. At 1, 4, 8, 12, and 24 hours after treatment, the Parafilm was removed and rinsed in 50% ethanol. The animals were sacrificed by dislocation, and 4 mL of a blood sample was obtained from the heart, followed by heart perfusion of 200 mL of ice-cold normal saline. The skin to which the treatment had been applied was removed, rinsed with 10 mL of 50% ethanol, and stored at −80 °C for further use. The 50% ethanol used for rinsing the skin and Parafilm was collected and filtered through a 0.22 μm Millipore filter for UPLC-MS analysis as described in the sections on “Chromatographic Conditions” and “Mass Spectrometry Conditions”.
After sampling from the animal, the blood sample was kept at 4 °C for 1 hour, followed by a 20-minute centrifugation at 4000 rpm, 4 °C. The serum was removed and added to three-fold ice-cold isopropyl alcohol followed by vortexing for 1 minute, and then kept at −20 °C for 24 hours, followed by centrifugation at 12,000 rpm, 4 °C for 10 minutes. The supernatant was transferred into a centrifuge-evaporator (B09-1LS0020, Ningbo Scientz Biotechnology Co., Ltd., China) to remove the solvent, and then re-dissolved in 1 mL of absolute ethanol, followed by filtration through a 0.22 μm Millipore filter for UPLC-MS analysis.
Approximately 1.5 g of the rat skin was cut into small pieces (1–2 mm) and placed into a homogenizer containing twice the amount of ice-cold methanol. The mixture was homogenized for 2.5 minutes under ice-cold conditions. The homogenate was then centrifuged at 4000 rpm, 4 °C for 5 minutes. The resulting precipitate was homogenized and centrifuged again following the same protocol, and the supernatant was combined with the first extraction. The solvent was then removed from the supernatant, and the precipitate was re-dissolved in 1 mL of absolute ethanol, which was then filtered using a 0.22 μm Millipore filter for UPLC-MS analysis.
The area under the curve (AUC) in the pharmacokinetics study was calculated using the trapezoidal integration method.
Metabolism of l-THP in Rat Liver and Skin S9 Fractions
Preparation of Liver and Skin S9 Fractions
Three male Sprague Dawley rats weighing 250 g each underwent hair removal in the abdominal area as described in the section on “Preparing the Animal for Transdermal Study”. Twenty-four hours later, the rats were sacrificed by cervical dislocation, followed by heart perfusion with 200 mL of ice-cold normal saline. The livers were then extracted and rinsed in a 0.15 M KCl solution. Approximately 3 g of liver tissue was dissected and homogenized in 9 mL of 0.15 M KCl solution under ice-cold conditions for two minutes. The resulting homogenate was centrifuged at 9000×g, 4 °C, for 10 minutes, and the supernatant obtained was used as the liver S9 fraction. The hairless skin was removed and processed using the same protocol as the liver to obtain the skin S9 fraction. To verify the efficacy of the S9 fractions, metoprolol tartrate was used as a control.
Protein Concentration of S9 Fractions
The S9 fraction was diluted in 10 times normal saline, and then 100 μL of the diluted S9 fraction was mixed with 5 mL of Comassie Brilliant Blue solution (0.1 mg/mL in 8.5% phosphoric acid). The mixture was then vortexed and kept at room temperature for 5 minutes, followed by measuring the absorbance at 595 nm using a microplate reader (Synergy H1, Bio-Tek Instruments Co., Ltd., USA). The obtained absorbance was compared to a standard curve derived from a series of bovine serum albumin standards ranging from 1.0 to 3.0 mg/mL to calculate the protein concentration of the S9 fraction.
The Metabolism of l-THP in S9 Fractions
The metabolism mixture included 200 μL of the S9 fraction, 40 μL of an electrolyte solution (1.65 M KCl and 0.4 M MgCl2), 760 μL of NADPH solution (2.18 mg/mL), and 1000 μL of a l-THP solution (7.0 μg/mL in 0.2 M PBS containing 1% DMSO). Each solution was pre-incubated at 37 °C for 5 minutes, and then all the solutions were thoroughly mixed by pipetting. The l-THP solution was added last to initiate the metabolism. At 10, 30, and 60 minutes after the addition of the l-THP solution, 400 μL of the metabolism mixture was transferred into 1200 μL of ice-cold isopropyl. The mixture was then vortexed for 1 minute and centrifuged at 12,000 rpm, 4 °C, for 10 minutes. The supernatant was subsequently transferred into a centrifuge concentrator (B09-1LS0020, Ningbo Scientz Biotechnology Co., Ltd., China) to remove the solvent. The resulting precipitate was re-dissolved in 1 mL of absolute ethanol, filtered through a 0.45 μm Millipore filter for UPLC-MS analysis. The MS abundance of l-THP was compared to a series of l-THP standard solutions ranging from 0.6–4.0 μg/mL to calculate the l-THP concentration in the reaction mixture and the rate of l-THP reduction in the S9 fraction. The amount of liver and skin S9 fractions utilized in the reaction was adjusted to contain the same quantity of protein. The reaction was performed in triplicate. The l-THP liposome suspension was diluted in 0.2 M PBS to obtain a liposome solution containing 7.0 μg/mL of l-THP. This solution was used for the metabolism in the S9 fraction, as the l-THP solution was.
The Strat-M® Membrane Permeability Test
The Start-M® membrane was mounted on Franz diffusion cells with a donor area of 1.77 cm2 and a 15 mL receptor (TP-6, Tianjin Jingtuo Instrument Technology Co., Ltd., China). Each cell of the receptor was filled with 50% ethanol PBS (0.1 M, pH=6.6) and maintained at 32 °C in a water bath, with continuous stirring by magnetic stirrers at 400 rpm. Each of 0.3 g of liposome-gel and emulsion containing 0.45 mg of l-THP, prepared as described earlier, was coated on the membrane. At 1, 4, 8, 12, and 24 hours, all the liquids in the receptor were replaced with fresh 15 mL of 50% ethanol PBS (pre-warmed at 32 °C). The samples collected were subjected to freeze-drying to remove the solvent and then re-dissolved in 1 mL of absolute ethanol for UPLC analysis. Each formulation was tested on the membrane in triplicate. The accumulated amount of l-THP that passed through the membrane was calculated at each time point using the following formula:

Qn: accumulated amount of l-THP passed through the membrane
Ci: concentration of l-THP in receptor at each time point
V: volume of the receptor
S: donor area of Franz cell
Statistics
The orthogonal data were analyzed using SPSS software (version 24.0) through univariate (multivariate) analysis of variance followed by the Newman-Keuls test. A P-value of less than 0.05 was considered significant for the factors from the tests of between-subjects effects. Subsequently, levels were selected from the post-hoc test.
Results
The Liposome Characterization
After optimizing the preparation, the morphology of the liposome was captured using TEM, while the particle size distribution was obtained through the Malvern Laser Particle Size Analyzer, as depicted in Figure 1a and b). The particle size, PDI, zeta potential, drug loading, and encapsulation are shown in Table 6. Upon embedding the liposomes in the gel, the particle size increased, and the zeta potential became more negative, as determined under the same analytical conditions. The UPLC chromatograms of PC, CHL, and l-THP derived from the liposomes are shown in Figure 2a–c).
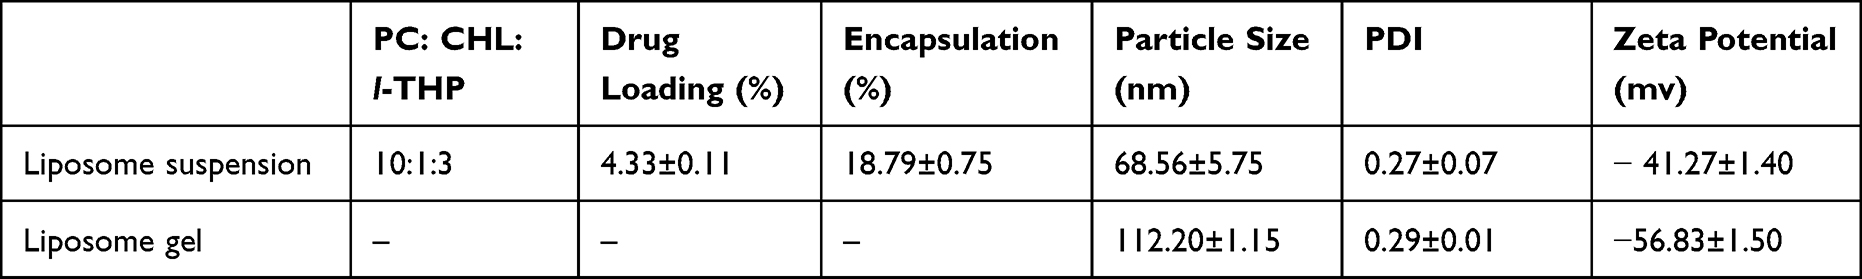 |
Table 6 The Characterization of the Liposome of the Optimal Preparation (mean±SD, n=3) |
 |
Figure 1 Liposome morphology captured by a Transmission Electron Microscope (a); particle size distribution obtained from the Malvern Laser Particle Size Analyzer (b). The black arrow denoted the liposome. |
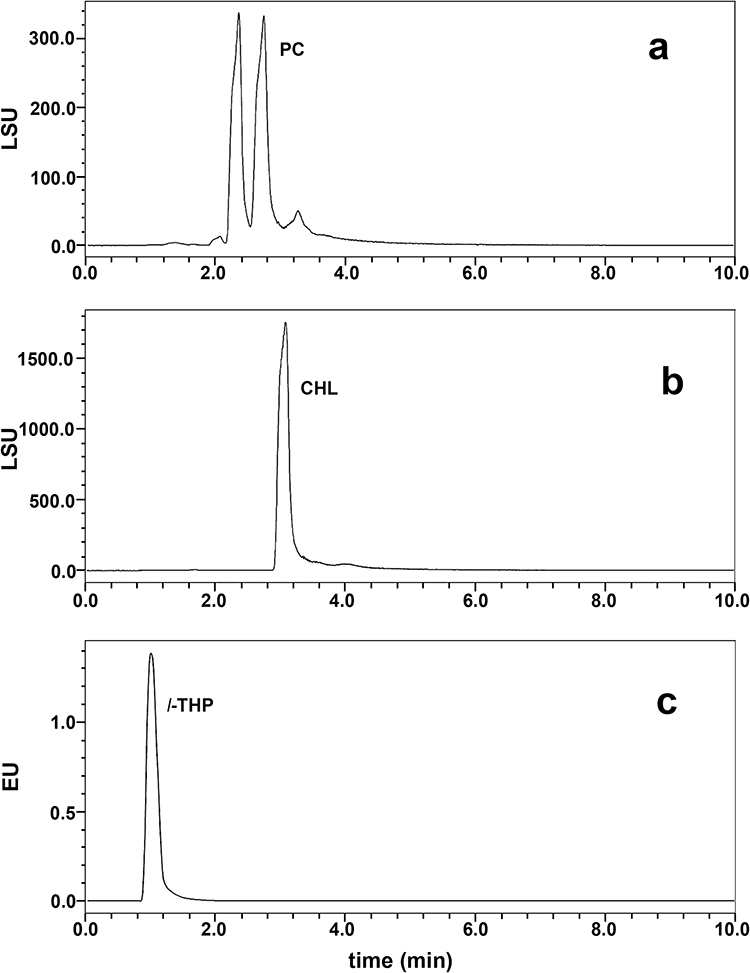 |
Figure 2 UPLC chromatograms of PC, CHL and l-THP. (a) PC (0.5 mg/mL, ELSD), (b) CHL (0.5 mg/mL, ELSD), (c) l-THP (0.5 mg/mL, UV). |
Optimization of Liposome Preparation
Single Factor Experiment
Tables 1–3 illustrate the impact of three individual factors on the characteristics of liposomes. The elevated CHL ratio led to a decrease in drug loading and an increase in particle size and PDI. The increase in l-THP resulted in improved drug loading, but there was a reduction in encapsulation efficiency and an increase in particle size. Furthermore, a higher concentration of PC at the hydration process led to an increase in particle size and PDI.
Orthogonal Experiment
The results of the L16 (43) orthogonal test and between-subjects effects test are shown in Table 5 and Supplementary Table 1, revealing that the PC to l-THP ratio significantly impacted drug loading (P<0.05), while the concentration of PC during the hydration process significantly affected drug loading, particle size, and zeta potential (P<0.05). Following post hoc tests, the optimal combination for each factor was determined to be A4B1C1 or A3B1C1 for drug loading, and A3B1C1 for particle size and zeta potential. The formula chosen for subsequent studies was A3B1C1, with a preparation ratio of PC: CHL: l-THP at 10:1:3 and a concentration of PC during the hydration process at 10 mg/mL.
Stability of the Liposome Gel
According to the data presented in Table 7, the concentration of l-THP in the liposome-gel remained stable at both 4 and 30 °C for 45 days, with a consistent level of 1.1 mg/mL or higher. Conversely, the concentration of l-THP in the emulsion decreased to 0.58 mg/mL over the same time period. The particle size of the liposomes remained stable at both 4 and 30 °C, but was observed to change from 137.63 to 176.85 nm when the temperature was raised to 40 °C. Furthermore, as the temperature increased, both formulations underwent a color change from white to yellow, indicating the presence of a metabolite.
 |
Table 7 Results of Stability Study of l-THP Liposome Gels and Emulsions |
In vivo Transdermal Study
The pharmacokinetic profile of l-THP is outlined in Table 8 and Figure 3. The results indicate that the liposome-gel group achieved a higher maximum concentration (Cmax) of l-THP in the blood, at 0.16 μg/mL, compared to the emulsion group, which recorded a Cmax of 0.10 μg/mL. Furthermore, the liposome-gel group demonstrated a superior bioavailability of 233.8% relative to the emulsion group, as evidenced by the AUC. Although both groups registered a peak concentration of l-THP in 1.2 hours, the liposome-gel group exhibited a longer elimination half-life (t1/2).
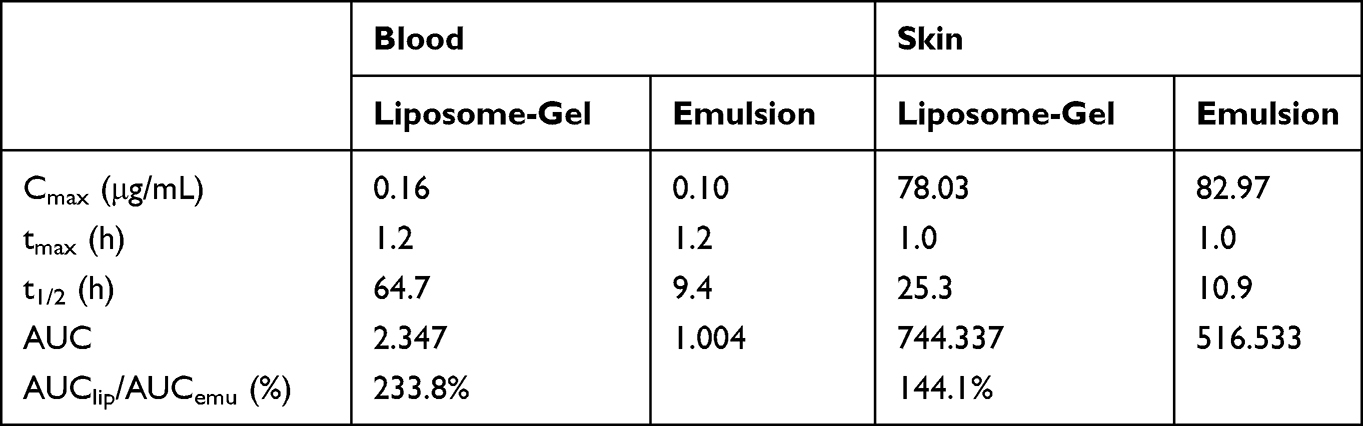 |
Table 8 The Pharmacokinetic Characteristics of l-THP after the Treatment with Liposome-Gel and Emulsion on the Skin |
 |
Figure 3 The concentration-time curve of l-THP in rat blood in the transdermal study. |
As shown in Figure 4, both formulas showed a peak concentration of l-THP remaining in the skin within an hour of treatment, with the liposome-gel and emulsion having Cmax values of 78.03 and 82.97 μg/mL, respectively. Furthermore, l-THP was found to clear from the skin at a slower rate in the liposome-gel group compared to the emulsion group.
 |
Figure 4 The concentration-time curve of l-THP remaining in rat skin in the in vivo transdermal study. |
The amount of l-THP released from the skin surface and the parafilm after 24 hours was 0.43 ± 0.05 mg and 0.37 ± 0.09 mg for the liposome-gel and emulsion groups, respectively.
Metabolism of l-THP in S9 Fractions
Protein of the S9 Fractions
The protein concentrations of the liver and skin S9 fractions were 22.06 mg/mL and 13.05 mg/mL, respectively. The amounts of the liver and skin S9 fractions used in the reaction were adjusted to protein equivalents.
Metabolism of l-THP in S9 Fractions
The metoprolol tartrate decreased at rates of 0.089 μg/mL/min and 0.004 μg/mL/min for the liver and skin S9 fractions, respectively, indicating the efficacy of the S9 fractions. As shown in Figure 5, upon mixing with the S9 fractions, the concentration of l-THP (prepared in PBS) decreased at rates of 0.0067 and 0.0027 μg/mL/min in the liver S9 and skin S9 fractions, respectively. This discrepancy in the metabolic enzymes of these two organs was evident. Conversely, the reduction rates of l-THP encapsulated in liposomes were comparable in the liver and skin S9 fractions, measuring 0.0032 and 0.0031 μg/mL/min, respectively.
 |
Figure 5 The metabolic profiles of l-THP (a) or l-THP-liposome (b) in live and skin S9 fractions. y1, y2, y3, and y4 present the trend lines derived from the curves of metabolism of l-THP in skin and liver S9 fractions, and l-THP-liposome in skin and liver S9 fractions, respectively. |
The Strat-M® Membrane Permeability Tests
The permeability of l-THP prepared in the emulsion was found to be higher (0.0032 mg/cm2/h) than that in the liposome gel (0.002 mg/cm2/h) when tested on the Strat-M® membrane, as depicted in Figure 6.
 |
Figure 6 The l-THP permeability of the liposome gel and the emulsion on Strat-M® membrane. y1 and y2 represent the trend lines derived from the curves of the permeation rates of the l-THP emulsion and the l-THP liposome gel, respectively. |
Discussion
The ratio of PC to CHL is a crucial factor that influences the physical and chemical properties of liposomes.27 CHL can be incorporated into the phospholipid bilayer to regulate fluidity, thereby enhancing the rigidity of the vesicles and providing improved stability.28,29 Our study revealed that the optimal mass ratio of PC to CHL was 10:1, resulting in the highest drug loading and smallest particle size. As the proportion of CHL increased, drug loading decreased and particle size increased. Attempts to increase encapsulation efficiency by elevating the mixture concentration during the hydration process would also lead to a decrease in drug loading and an increase in the particle size.
In the in vivo transdermal test, with approximately 10% of the total surface area of rat skin, the maximum blood concentration of l-THP was found to be 0.16 μg/mL. This concentration is similar to that in the experiment designed for oral administration. However, the time to reach the maximum concentration was longer via the skin compared to the studies of oral administration in which most of the tmaxs were less than one hour.5,30–33 The amount of l-THP administered in the current experiment was approximately 0.2 mg/kg body weight, which was far less than the amount used in the oral administration studies,6,32,33 where the dosages were typically higher than 4.5 mg/kg body weight. This is evidence of higher bioavailability from the cutaneous route.
The in vivo investigation revealed that liposomes facilitated the permeation of l-THP into the systemic blood circulation more effectively than emulsions. However, on the Strat-M® membrane, l-THP in the emulsion penetrated more rapidly than in the liposome gel. These findings suggest that the transdermal mechanisms of liposomes on rat skin are more complex than the free drug diffusion model. The potential mechanisms of liposome delivery include permeation enhancement, vesicle adsorption, fusion with the stratum corneum, intact vesicular skin penetration, and trans-appendage penetration.27,34 The negative charge of the liposomes may also promote their movement through the skin.35 Following the administration of a liposome gel, a double peak profile of l-THP was observed in the rat skin over 24 hours (Figure 4). This could be because the liposome deliver l-THP into deeper layers of the skin more slowly than free diffusion, causing a second peak, and the l-THP entering the blood circulation would not be significantly affected by this “diffusion” in the skin. More research is necessary to understand these findings.
The stability of l-THP had been known to be affected by exposure to light and heat, resulting in the generation of a yellow color.36 This was consistent with the findings of the current study, which showed that an increase in temperature and storage time led to a more yellow color in the formulations. The yellow color may be due to the de-hydrogenation of tetrahydropalmatine, leading to the oxidation form of dihydropalmatine or palmatine, and both of these compounds appear yellow. However, encapsulating l-THP in liposomes helped to reduce the color change of the formulation, indicating that liposomes can protect l-THP from storage environments and improve its stability. Additionally, l-THP encapsulated in liposomes was found to have a slower metabolism rate in the liver S9 fraction, which might be because the liposomes provide a shield for l-THP against metabolic enzymes, resulting in a greater amount of l-THP prototype being available prior to release from the liposome.
The particle size of the liposome increased when stored at higher temperatures, suggesting that a lower storage temperature should be used for this l-THP liposome gel. Moreover, the PDIs of the liposomes remained constant, demonstrating that the size of each liposome had changed in a uniform manner, likely due to the high viscosity of the gel, which significantly limited particle collisions and subsequently, fusion or flocculation.37 Thus, the instability concerns of liposomes are prone to chemical instability during the storage period as lipids are more susceptible to degradation because of their chemical structure, which contains functional groups vulnerable to oxidation and hydrolysis.38
Conclusion
l-THP liposome gel provided more than a twofold increase in bioavailability compared to the emulsion. Liposomes protected against the degradation of l-THP during storage and against metabolic enzymes from the S9 fractions. Liposome gel is an attractive option for delivering l-THP, as it had been proven in the current study.
Abbreviations
AUC, areas under the curve; CHL, cholesterol; Cmax, maximum concentration; DMSO, dimethylsulfoxide; ELSD, evaporative light-scattering detector; ESI, electrospray ionization; LC/MS, liquid chromatography–mass spectrometry; l-THP, levo-tetrahydropalmatine; NADPH, nicotinamide adenine dinucleotide phosphate; PBS, phosphate buffer saline; PC, phosphatidylcholine; PDI, polydispersity index; t1/2, elimination half-life; tmax, time to reach the maximum concentration; TEM, transmission electron microscope; UPLC, ultra-performance liquid chromatography; UPLC-MS, ultra-performance liquid chromatography-mass spectrometry.
Acknowledgments
This research was funded by the Guangxi Key Laboratory of Zhuang and Yao Ethnic Medicine, the Collaborative Innovation Center of Zhuang and Yao Ethnic Medicine, and the Key Laboratory of TCM Pharmacology of Guangxi Education Department.
Disclosure
The authors report no conflicts of interest in this work.
References
1. Wang JB, Mantsch JR. l-tetrahydropalamatine: a potential new medication for the treatment of cocaine addiction. Future Med Chem. 2012;4(2):177–186. doi:10.4155/fmc.11.166
2. Du Q, Meng X, Wang S. A comprehensive review on the chemical properties, plant sources, pharmacological activities, pharmacokinetic and toxicological characteristics of tetrahydropalmatine. Front Pharmacol. 2022;13:890078. doi:10.3389/fphar.2022.890078
3. Commission CP, ed.. Pharmacopoeia of the People’s Republic of China (2015). Beijing: China Medical Science Press; 2017.
4. Tian B, Tian M, Huang S. Advances in phytochemical and modern pharmacological research of Rhizoma Corydalis. Pharm Biol. 2020;58(1):265–275. doi:10.1080/13880209.2020.1741651
5. Wu C, Yan R, Zhang R, et al. Comparative pharmacokinetics and bioavailability of four alkaloids in different formulations from Corydalis decumbens. J Ethnopharmacol. 2013;149(1):55–61. doi:10.1016/j.jep.2013.05.043
6. Tung N, Tran C, Nguyen T, et al. Effect of surfactant on the in vitro dissolution and the oral bioavailability of a weakly basic drug from an amorphous solid dispersion. Eur J Pharm Sci. 2021;162:105836. doi:10.1016/j.ejps.2021.105836
7. He C, Fu J, Shou J, et al. In vitro study of the metabolic characteristics of eight isoquinoline alkaloids from natural plants in rat gut microbiota. Molecules. 2017;22(6):932. doi:10.3390/molecules22060932
8. Zhao M, Li L, Sun D, et al. Stereoselective metabolism of tetrahydropalmatine enantiomers in rat liver microsomes. Chirality. 2012;24(5):368–373. doi:10.1002/chir.22020
9. Haq A, Dorrani M, Goodyear B, Joshi V, Michniak-Kohn B. Membrane properties for permeability testing: skin versus synthetic membranes. Int J Pharm. 2018;539(1–2):58–64. doi:10.1016/j.ijpharm.2018.01.029
10. Xing J, Deng L, Li J, Dong A. Amphiphilic poly[alpha-maleic anhydride-omega-methoxy-poly(ethylene glycol)]-co-(ethyl cyanoacrylate) graft copolymer nanoparticles as carriers for transdermal drug delivery. Int J Nanomedicine. 2009;4:227–232. doi:10.2147/ijn.s7814
11. Li C, Liu C, Liu J, Fang L. Correlation between rheological properties, in vitro release, and percutaneous permeation of tetrahydropalmatine. AAPS Pharm Sci Tech. 2011;12(3). doi:10.1208/s12249-011-9664-4
12. Wang H, Wang Z, Jiang M, et al. Pharmacokinetics and tissue distribution of five bioactive components in the Corydalis yanhusuo total alkaloids transdermal patch following Shenque acupoint application in rats assessed by ultra-performance liquid chromatography-tandem mass spectrometry. Biomed Chromatogr. 2023;37(1):e5508. doi:10.1002/bmc.5508
13. Large DE, Abdelmessih RG, Fink EA, Auguste DT. Liposome composition in drug delivery design, synthesis, characterization, and clinical application. Adv Drug Deliv Rev. 2021;176:113851. doi:10.1016/j.addr.2021.113851
14. Alavi M, Karimi N, Safaei M. Application of various types of liposomes in drug delivery systems. Adv Pharm Bull. 2017;7(1):3–9. doi:10.15171/apb.2017.002
15. Akbarzadeh A, Rezaei-Sadabady R, Davaran S, et al. Liposome: classification, preparation, and applications. Nanoscale Res Lett. 2013;8(1):102. doi:10.1186/1556-276X-8-102
16. Sacha M, Faucon L, Hamon E, Ly I, Haltner-Ukomadu E. Ex vivo transdermal absorption of a liposome formulation of diclofenac. Bio Pharmacoth. 2019;111:785–790. doi:10.1016/j.biopha.2018.12.079
17. Kapoor MS, D’Souza A, Aibani N, et al. Stable liposome in Cosmetic Platforms for transdermal folic acid delivery for fortification and treatment of micronutrient deficiencies. Sci Rep. 2018;8(1):16122. doi:10.1038/s41598-018-34205-0
18. Tyagi RK, Garg NK, Jadon R, et al. Elastic liposome-mediated transdermal immunization enhanced the immunogenicity of P. falciparum surface antigen, MSP-119. Vaccine. 2015;33(36):4630–4638. doi:10.1016/j.vaccine.2015.06.054
19. Xu Y, Cai Y, Meng Y, et al. Liposome and microemulsion loaded with ibuprofen: from preparation to mechanism of drug transport. J Microencapsul. 2022;39(6):539–551. doi:10.1080/02652048.2022.2131920
20. Cheng Y, Li TS, Su HL, Lee PC, Wang HD. Transdermal delivery systems of natural products applied to skin therapy and care. Molecules. 2020;25(21):5051. doi:10.3390/molecules25215051
21. Bronaugh RL, Stewart RF, Congdon ER. Methods for in vitro percutaneous absorption studies. II. Animal models for human skin. Toxicol Appl Pharmacol. 1982;62(3):481–488. doi:10.1016/0041-008X(82)90149-1
22. Hughes MF, Edwards BC. In vitro dermal absorption of pyrethroid pesticides in human and rat skin. Toxicol Appl Pharmacol. 2010;246(1–2):29–37. doi:10.1016/j.taap.2010.04.003
23. Barber ED, Teetsel NM, Kolberg KF, Guest D. A comparative study of the rates of in vitro percutaneous absorption of eight chemicals using rat and human skin. Fundam Appl Toxicol. 1992;19(4):493–497. doi:10.1016/0272-0590(92)90086-W
24. Chowhan ZT, Pritchard R. Effect of surfactants on percutaneous absorption of naproxen I: comparisons of rabbit, rat, and human excised skin. J Pharm Sci. 1978;67(9):1272–1274. doi:10.1002/jps.2600670921
25. Schmook FP, Meingassner JG, Billich A. Comparison of human skin or epidermis models with human and animal skin in in-vitro percutaneous absorption. Int J Pharm. 2001;215(1):51–56. doi:10.1016/S0378-5173(00)00665-7
26. Monteiro-Riviere NA, Bristol DG, Manning TO, Rogers RA, Riviere JE. Interspecies and interregional analysis of the comparative histologic thickness and laser Doppler blood flow measurements at five cutaneous sites in nine species. J Invest Dermatol. 1990;95(5):582–586. doi:10.1111/1523-1747.ep12505567
27. Carita AC, Eloy JO, Chorilli M, Lee RJ, Leonardi GR. Recent advances and perspectives in liposomes for cutaneous drug delivery. Curr Med Chem. 2018;25(5):606–635. doi:10.2174/0929867324666171009120154
28. Rog T, Pasenkiewicz-Gierula M, Vattulainen I, Karttunen M. Ordering effects of cholesterol and its analogues. Biochim Biophys Acta. 2009;1788(1):97–121. doi:10.1016/j.bbamem.2008.08.022
29. Doole FT, Kumarage T, Ashkar R, Brown MF. Cholesterol stiffening of lipid membranes. J Membr Biol. 2022;255(4–5):385–405. doi:10.1007/s00232-022-00263-9
30. Jung JW, Kwon YS, Jeong JS, et al. Pharmacokinetics and brain distribution of tetrahydropalmatine and trahydroberberine after oral administration of DA-9701, a new botanical gastroprokinetic agent, in rats. Biol Pharm Bull. 2015;38(2):285–291. doi:10.1248/bpb.b14-00678
31. Li C, Zhang S, Gao H, Zhang X. Determination of l-tetrahydropalmatine in human plasma by HPLC and pharmacokinetics of its disintegrating tablets in healthy Chinese. Eur J Drug Metab Pharmacokinet. 2011;36(4):257–262. doi:10.1007/s13318-011-0045-x
32. Xiao W, Deng Z, Lai C, et al. Inhibitory effect of ketoconazole, quinidine and 1-aminobenzotriazole on pharmacokinetics of l-tetrahydropalmatine and its metabolite in rats. Xenobiotica. 2021;51(4):447–454. doi:10.1080/00498254.2020.1867928
33. Wang W, Liu J, Zhao X, et al. Simultaneous determination of l-tetrahydropalmatine and its active metabolites in rat plasma by a sensitive ultra-high-performance liquid chromatography with tandem mass spectrometry method and its application in a pharmacokinetic study. Biomed Chromatogr. 2017;31(6):e3903. doi:10.1002/bmc.3903
34. El Maghraby GMM, Williams AC, Barry BW. Can drug-bearing liposomes penetrate intact skin? J Pharm Pharmacol. 2006;58(4):415–429. doi:10.1211/jpp.58.4.0001
35. Sinico C, Manconi M, Peppi M, Lai F, Valenti D, Fadda AM. Liposomes as carriers for dermal delivery of tretinoin: in vitro evaluation of drug permeation and vesicle–skin interaction. J Control Release. 2005;103(1):123–136. doi:10.1016/j.jconrel.2004.11.020
36. Li L, Zhan X, Li K, Yang X. Influence of light and heat on the stability of rotundine sulfate injection. J Pharm Sci. 2001;90(10):1497–1504. doi:10.1002/jps.1100
37. Duman G, Aslan 0, Yekta Özer A, Inanç 0, Taralp A. Liposome, gel and lipogelosome formulations containing sodium hyaluronate. J Liposome Res. 2014;24(4):259–269. doi:10.3109/08982104.2014.907305
38. Sainaga Jyothi VGS, Bulusu R, Venkata Krishna Rao B, et al. Stability characterization for pharmaceutical liposome product development with focus on regulatory considerations: an update. Int J Pharm. 2022;624:122022. doi:10.1016/j.ijpharm.2022.122022
 © 2023 The Author(s). This work is published and licensed by Dove Medical Press Limited. The full terms of this license are available at https://www.dovepress.com/terms.php and incorporate the Creative Commons Attribution - Non Commercial (unported, v3.0) License.
By accessing the work you hereby accept the Terms. Non-commercial uses of the work are permitted without any further permission from Dove Medical Press Limited, provided the work is properly attributed. For permission for commercial use of this work, please see paragraphs 4.2 and 5 of our Terms.
© 2023 The Author(s). This work is published and licensed by Dove Medical Press Limited. The full terms of this license are available at https://www.dovepress.com/terms.php and incorporate the Creative Commons Attribution - Non Commercial (unported, v3.0) License.
By accessing the work you hereby accept the Terms. Non-commercial uses of the work are permitted without any further permission from Dove Medical Press Limited, provided the work is properly attributed. For permission for commercial use of this work, please see paragraphs 4.2 and 5 of our Terms.