Back to Journals » International Journal of Nanomedicine » Volume 14
Preparation of sustained release apremilast-loaded PLGA nanoparticles: in vitro characterization and in vivo pharmacokinetic study in rats
Authors Anwer MK, Mohammad M, Ezzeldin E, Fatima F ![]() , Alalaiwe A
, Alalaiwe A ![]() , Iqbal M
, Iqbal M
Received 18 November 2018
Accepted for publication 29 January 2019
Published 1 March 2019 Volume 2019:14 Pages 1587—1595
DOI https://doi.org/10.2147/IJN.S195048
Checked for plagiarism Yes
Review by Single anonymous peer review
Peer reviewer comments 2
Editor who approved publication: Prof. Dr. Anderson Oliveira Lobo
Md Khalid Anwer,1 Muqtader Mohammad,1 Essam Ezzeldin,2,3 Farhat Fatima,1 Ahmed Alalaiwe,1 Muzaffar Iqbal2,3
1Department of Pharmaceutics, College of Pharmacy, Prince Sattam Bin Abdulaziz University, Al-Kharj 11942, Saudi Arabia; 2Department of Pharmaceutical Chemistry, College of Pharmacy, King Saud University, Riyadh 11451, Saudi Arabia; 3Bioavailability Laboratory, College of Pharmacy, King Saud University, Riyadh 11451, Saudi Arabia
Background: Apremilast (APM) is a novel, orally administered small molecule drug approved for treatment of psoriasis or psoriatic arthritis. Due to its low solubility and permeability, it is classified as a class IV drug according to BCS classification. Dose titration is recommended during APM treatment due to its tolerability and twice-daily dosing regimen issues.
Materials and Methods: In this study, three different APM-loaded PLGA nanoparticles (F1–F3) were prepared by single emulsion and evaporation method. Based on particle size, PDI, zeta potential (ZP), entrapment efficiency (%EE), drug loading (%DL), and spectral characterization, the nanoparticles (F3) were optimized. The F3 nanoparticles were further evaluated for in vitro release and in vivo pharmacokinetic studies in rats.
Results: The optimized nanoparticles (F3) had particles size 307.3±8.5 nm with a low PDI value 0.317, ZP of -43.4±2.6 mV, EE of 61.1±1.9% and DL of 1.9±0.1%. The in vitro release profile showed a sustained release pattern of F3 nanoparticles of APM. The pharmacokinetic results showed 2.25 times increase in bio-availability of F3 nanoparticles compared to normal APM suspension. Moreover, significant increase in half-life and mean residence time confirms long-term retention of F3 nanoparticles.
Conclusion: Bioavailability enhancement along-with long-term retention of the APM-loaded PLGA nanoparticles might be helpful for the once-daily regimen treatment.
Keywords: apremilast, Poly(D,L-lactide-coglycolide), nanoparticles, bioavailability, sustained release
Introduction
Psoriasis or psoriatic arthritis is a chronic immune-mediated inflammatory disorder affecting 2%–3% of worldwide population.1–4 Apremilast (APM) is a novel, orally administered, type 4 phosphodiesterase inhibitor approved for the treatment of psoriasis or psoriatic arthritis across the globe.3 Although the maintenance dose of APM is 30 mg twice daily, initial dose titration from 10 to 30 mg is recommended to reduce the risk of gastrointestinal adverse effects. APM has low solubility and low permeability and is therefore classified as a class IV type of drug according to the Biopharmaceutical Classification System.5 Due to its low solubility and permeability, its oral bioavailability is highly variable between different species (humans 73%, mice 20%–33%, rats 12%–63%, monkeys 78%, and rabbits ≤0.1%).6
Due to the chronic nature of the disease, a long-term treatment with APM is usually recommended. Conventional immediate release formulation of APM possess tolerability and dose regimen issues, which might impair patient compliance and, therefore, the efficacy of the treatment would be compromised.7,8 Therefore, an alternative drug-delivery system is urgently required to overcome the tolerability and the frequent daily dosing and to improve the bioavailability of APM. Recently, Tang et al (2016) developed an extended release formulation of APM to resolve the dosing and tolerability issue.9
Poly(D,L-lactide-coglycolide) (PLGA) is considered as a smart polymer, which is being used in order to sustain the release of drug and enhance the in vivo oral bioavailability and therapeutic efficacy of several poorly water-soluble drugs.10–12 The PLGA polymer also protects the drugs from premature degradation and hepatic pass metabolism. To extend the drug-release time, reduce the frequency of administration, and improve the efficiency of drug as well as patient compliance, various drugs are encapsulated in biodegradable PLGA nanoparticles (PLGA NPs).13–15 The sustained release time of PLGA NPs can be programmed by optimizing particle, size, morphology, and molecular weight of PLGA.16
A few drug-delivery systems such as topical preparation,17,18 extended release tablets,9 and nail lacquers19 with APM have been investigated in order to enhance its in vitro dissolution rate, efficacy, PK profile, and in vivo bioavailability. To the best knowledge of the authors, PLGA polymeric nanoparticles of APM have not yet been investigated in literature despite several favorable characteristics of the latter for nanoparticle preparation including poor water solubility, low bioavailability, and prominent adverse effects.
This study aims to develop APM-loaded PLGA NPs that could potentially sustain the release of the drug and that might reduce the dosing frequency and improve the efficacy of the drug.
Materials and methods
Materials
APM was obtained from Mesochem Technology (Beijing, China). PLGA lactide:glycolide (50:50), mol wt 4,000–15,000,000, and polyvinyl alcohol (PVA) were procured from Sigma-Aldrich, St Louis, MO, USA. All chemicals and solvents used in this study are of analytical/HPLC grade. Ultrapure water was collected from the Milli-Q water purifier unit and was used for aqueous solution preparation.
Preparation of APM-loaded PLGA NPs
The single emulsion and evaporation method was followed for the preparation of APM-loaded PLGA NPs (Table 1). Briefly, APM (10 mg) was dissolved in 5 mL of the prepared solution of PLGA (50–150 mg) in the dichloromethane solvent, and this organic phase was further emulsified to an aqueous phase (PVA, 0.5% w/v) through sonication in a probe sonicator (Ultrasonic Processor, gx-130, Berlin, Germany) for 3 minutes with 60% voltage efficiency at 25°C. The volatile organic solvent dichloromethane was evaporated under reduced pressure at 40°C. The APM-loaded PLGA NPs were separated from the bulk aqueous phase using high-speed centrifugation (16,000 rpm) for 20 minutes, followed by washing with cold distilled water thrice and freeze drying.
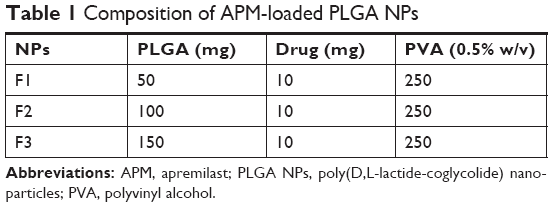 | Table 1 Composition of APM-loaded PLGA NPs |
Particle size, polydispersity index (PDI), and zeta potential (ZP)
The developed APM-loaded PLGA NPs were freeze dried followed by dispersing them in the Milli-Q water (20 μg/mL). The suspension was then characterized for particle size, polydispersity index (PDI), and zeta potential (ZP) using the dynamic light-scattering technique. The Malvern Particle Size Analyzer (Malvern Instruments Ltd, Holtsville, NY, USA) was used to measure the mean particle size and the PDI of different developed NPs (F1–F3). The NP samples were diluted to 200 times with deionized water and sonicated for 10 minutes in order to obtain clear aqueous dispersion. Each sample (3 mL) was transferred in transparent disposable plastic cuvettes and the mean particle size and PDI were measured. The same analyzer was utilized to measure the ZP of the NPs (F1–F3) but the measurements were done using glass electrode.
Determination of drug entrapment efficiency (%EE) and drug loading (%DL)
The indirect method for the determination of drug entrapment efficiency (%EE) and drug loading (%DL) of APM in PLGA NPs (F1–F3) was followed. The freshly prepared emulsion was centrifuged at 12,000 rpm for 10 minutes to obtain a transparent supernatant. The nonencapsulated drug in the supernatant was measured by UV spectroscopy at 229 nm.20 The %EE and %DL were calculated using the following equation:
|
|
FTIR studies
The FTIR spectra of pure APM and APM-loaded PLGA NPs (F1–F3) were recorded using the ALPHA-FTIR Spectrometer (OPTIK, Billerica, MA, USA). The disc of each sample was prepared using transparent potassium bromide (KBr) pellets and by applying suitable pressure. The spectra were recorded in the wavelength range of 4,000–400 cm−1 and interpreted with the help of IR software.
Differential scanning calorimetry (DSC)
The differential scanning calorimetry (DSC) curves of pure APM and their PLGA NPs (F1–F3) were obtained using the DSC Thermal Analyzer (DSC N-650; SINCO; Taipei, Taiwan)in the temperature range of 50°C–200°C at the heating rate of 10°C/minute. The flow rate of nitrogen was set at 20 mL/minute. Accurately weighed amounts of the samples (~5 mg) were taken and placed in a hermetically sealed aluminum pan.
Powder X-ray diffraction studies
Powder X-ray diffraction (XRD) patterns of pure APM and APM-loaded PLGA NPs (F1–F3) were recorded using X-ray diffractometer (Ultima-IV, Rigaku, Tokyo, Japan) in the range of 3°–90° (2θ) at a scan rate of 4°C/minute. The XRD curve of each sample was recorded at voltage and current 30 kV and 25 mA, respectively and the target/filter (monochromator) was copper.
Particle morphology by SEM
The electron beam from a scanning electron microscope was used to attain the morphological features of the optimized APM-loaded PLGA NPs (F3). Freeze-dried PLGA NPs were coated with a thin layer (2–20 nm) of metal(s) such as gold, palladium, or platinum using a sputter coater under vacuum. The pretreated specimen was then bombarded with an electron beam and the interaction resulted in the formation of secondary electrons called auger electrons. From this interaction between the electron beam and the specimen’s atoms, only the electrons scattered at ≥90° were selected and further processed based on Rutherford and Kramer’s Law for acquiring the images of surface topography.
Drug-release studies
An in vitro drug-release study was performed to identify the release pattern of the drug from APM-loaded PLGA NPs (F3). Briefly, pure APM and lyophilized NPs were dispersed in a dialysis bag (cutoff of 12 kDa) containing phosphate buffer (pH 6.8) and was put in a biological shaker (LBS-030S-Lab Tech, Korea) and shaken horizontally at 37°C at 100 rpm. The supernatant of the sample was withdrawn at different time intervals (1, 2, 3, 4, 5, 6, 12, 24, and 48 hours). The collected sample was centrifuged at 12,000 rpm for 5 minutes and analyzed for the drug content using UV spectroscopy at 229 nm.20 The data obtained from the release study were plotted and fitted in various kinetic models to obtain the release pattern of the drug from the polymeric matrix.
Bioanalytical methods
An ultraperformance liquid chromatography coupled with tandem mass spectrometry (MS/MS) was used for the quantification of APM in rat plasma samples. Our previously reported assay was modified for this purpose.21 To increase the sensitivity of the assay, the electrospray ionization was operated in positive mode and the calibration range was between 1 and 1,000 ng/mL with lower limit of quantification of 1 ng/mL in plasma samples. Due to change in the ionization mode, losartan was used as the internal standard (IS). The precursor to product ion transition of 461.16 >178.08 and 423.13 >207.12 was used for detection and quantification of analyte (APM) and the IS (losartan), respectively, in the multiple reaction monitoring (MRM) mode. The optimized MS/MS parameters of capillary voltage 4.00 kV, source temperature 150°C, desolvation temperature 350°C, and collision gas flow rate 0.17 mL/minute were used for sample ionization. A cone voltage of 26 V (both for analyte and IS) and collision energy of 28 and 20 eV were used for the analyte and the IS, respectively, as compound-specific parameters. Due to change in ionization mode and IS, the assay was partially validated in terms of precision and accuracy following the US Food and Drug Administration 2013 guideline for bioanalytical method validation. Both intra- and interday variation in precision and accuracy was found to be within the acceptable limits of ±15%.
Pharmacokinetic study in rats
Twelve male Wistar albino rats weighing 180–220 g were used for the comparative pharmacokinetic studies of APM in rats. Animals were obtained from Animal Care Unit, College of Pharmacy, Prince Sattam Bin Abdulaziz University. Prior to the test, the rats were kept in plastic enclosures under standard research center conditions, temperature 25°C±2°C and %RH 55%±5% with a 12 hours light/dim cycle, and the pellet diet was given with water ad libitum. The study was conducted according to International Standard Guidelines of the Animal Care and Use and the protocol was approved by the Institutional Animal Ethics Committee, College of Pharmacy, Prince Sattam Bin Abdulaziz University, Alkharj, Saudi Arabia. In a single-dose parallel study, animals were randomly divided into two groups (n=6), which served as APM suspension (0.5% hydroxy propylmethyl cellulose) and APM-loaded PLGA NPs (F3) treatment groups, respectively. APM (equivalent to 2 mg/kg, oral) was administered to the respective group after an overnight fasting and blood samples were withdrawn in heparinized tubes from the retro-orbital plexus of rats at different time intervals (predose, 0.5, 1, 1.5, 2, 3, 5, 8, 12, 24, 36, and 48 hours). The blood samples were centrifuged at 4,500×g for 8 minutes to collect plasma and were stored frozen at 80°C±10°C till further analysis.
Pharmacokinetic calculation and data analysis
The pharmacokinetic parameters were calculated using the WinNonlin software (Pharsight Co., Mountain View, CA, USA), and all values were expressed as mean ± SD. The noncompartmental pharmacokinetic model was used to calculate Cmax and the time to reach maximum concentration (Tmax), area under curve from 0 to t (AUC0–48) and 0–inf (AUC0–inf), elimination rate constant (kz), half-life (T½), and mean residence time (MRT).
Statistical analysis
Physicochemical parameters and in vitro drug-release data were evaluated with one-way ANOVA using Dunnett’s test. However, unpaired t-test was used for statistical evaluation of pharmacokinetic parameters. The GraphPad InStat software was used for statistical analysis and P<0.05 was considered significant.
Results and discussion
Particle size, PDI, and ZP
The size of the developed APM-loaded PLGA NPs (F1–F3) was found to be in the range of 281.9–307.3 nm, which was within the nanorange of ≤1,000 nm. This increase in particle size may be due to the increase in concentration of the PLGA polymer that leads to enhancement in the viscosity that resists the diffusion of the organic phase into aqueous phase and hence increases the size of the NPs.22 The PDI values of the NPs were in the range of 0.317–0.451, which is <0.7 that makes the dispersion suitable for differential light scanning analysis. The PDI value ≤1 indicates the relative distribution of monosized nanoparticles23 that could result with extended stability of the prepared APM-loaded PLGA NPs (Table 2). However, both the size and the PDI were in the acceptable desired range required for further studies.
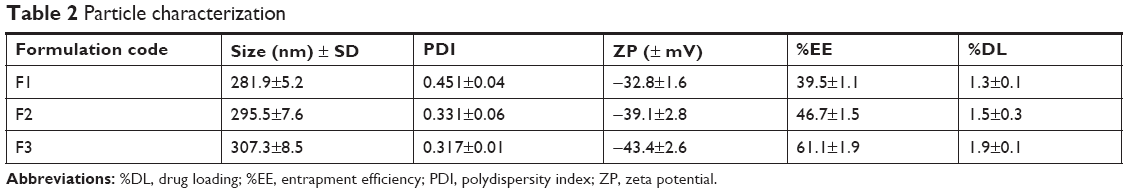 | Table 2 Particle characterization |
The ZP of the three batches (F1–F3) was significantly different; the highest ZP correlated with the maximum concentration of PLGA polymers used in the formulation. The ZP values were measured as −32.8, −39.1, and −43.4 mV for F1, F2, and F3, respectively (Table 2). The negative values of ZP of APM-loaded PLGA NPS could be attributed to ionic adsorption, functional group modification on the particle surface, or ionized reactive carboxylic functional group of the PLGA polymer.24 As per the DLVO electrostatic theory, nanoparticles could be stable due to Brownian motion and repulsive force. Concomitantly higher ZP of either the (−) anions or (+) the cations on the NPs makes them repel each other and stabilizes the system.25 The absolute PLGA exhibits ~±50 mV ZP, whereas the APM-loaded PLGA NPs (F3) graded with about −43.4 mV ZP show a decline in the potential of particles; this negativity could be due to the surface adsorption of NPs with PVA.
Determination of drug entrapment efficiency (%EE) and drug loading (%DL)
The amount of drug incorporated inside the polymer matrix was assessed as the drug encapsulation efficiency and %DL efficiency as documented in Table 2. The measurement of the %EE provides an estimate about the percentage of drug that is successfully entrapped. However, %DL deals with nanoparticles after their separation from the medium to know their content. The %EE and %DL of APM in the PLGA NPs (F1–F3) were measured in the range of 39.5%–61.1% and 1.3%–1.9%, respectively. It is evident from the result that increase in PLGA polymer concentration leads to an increase in entrapment of APM and particle size; this is probably due to increase in the viscosity of the polymer solution that resists the diffusion of the drug into an aqueous phase.23,26
Fourier-transform infrared spectroscopy (FTIR) studies
FTIR spectra were recorded for the APM and their developed PLGA polymeric NPs (F1–F3) to assess the interaction between the drug and the polymer. The absorption bands in the spectra were observed for APM and APM-loaded PLGA NPs in the region of 400–4,000 cm−1 (Figure 1). The major peaks assigned to pure APM confirmed the presence of different functional ketone carbonyl and amide groups (−C=O, −NH−COCH3) in the fingerprint region. The peaks at 1,682, 1,764, and 3,363 cm−1 could be seen in the spectra due to the stretching vibration of amide −C=O, ketone (−C=O), and amide (−N−H) groups of APM, respectively. There is no significant shifting of peaks, but reduction in the intensity of the peaks in the fingerprint region of the drug could be seen in the spectra of the developed NPs. This revealed the encapsulation of APM inside the PLGA polymer matrix in an amorphous state.
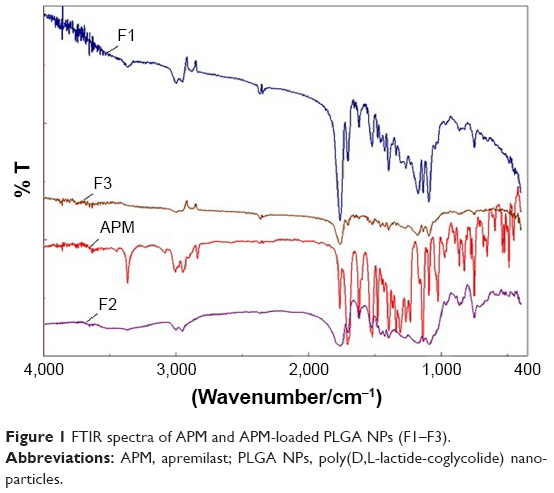 | Figure 1 FTIR spectra of APM and APM-loaded PLGA NPs (F1–F3). |
DSC studies
Thermal behavior study is a useful tool to assess whether drug particles have been encapsulated in polymeric matrices.13 The DSC curve of pure APM was compared with that of different developed APM-loaded PLGA NPs (F1–F3) as shown in Figure 2. A sharp endothermic peak corresponding to 159.4°C was obtained in the case of free APM, which was found to be much closer to that reported in the literature.27 An endothermic peak could be seen in PLGA NPs (F1 and F2) at 159.4°C with reduced intensity compared to that of pure APM. This comparison suggested that APM exists in a partially crystalline form and did not encapsulate the drug completely; this might be due to less amount of PLGA polymer used in F1 and F2 PLGA NPs. However, in the case of APM-loaded PLGA NPs (F3), the endothermic peak of the drug completely disappeared, confirming its complete encapsulation inside the polymer matrix.
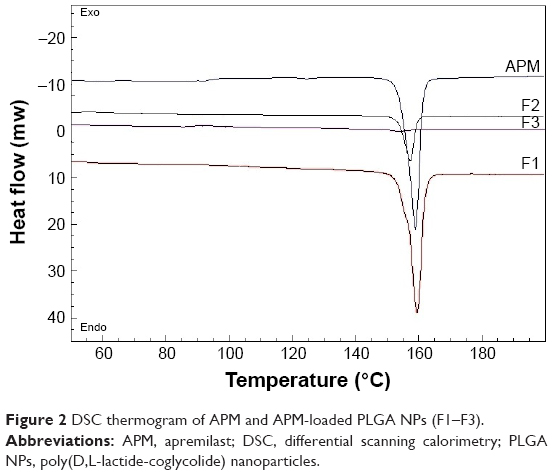 | Figure 2 DSC thermogram of APM and APM-loaded PLGA NPs (F1–F3). |
Powder XRD studies
A powder X-ray (XRD) study was performed to investigate the crystalline and amorphous structure of APM and PLGA-NPs. The diffraction patterns of the drug and their PLGA NPs are shown in Figure 3. The diffraction pattern of pure APM shows different peak intensities in comparison to APM-loaded PLGA NPs (F1–F3). The XRD pattern of pure APM showed several characteristic intense peaks at 10.08° 2θ, 12.38° 2θ, 13.48° 2θ, 20.82° 2θ, 22.50° 2θ, 24.10° 2θ, 24.66° 2θ, and 26.96° 2θ, which was found much closer to the values reported in the literature.27 However, these peaks were absent or were less peak intensity in the APM-loaded PLGA-NPs. This reduction in the crystallinity of the precipitated PLGA NPs clearly confirmed the encapsulation of APM in the PLGA polymer.
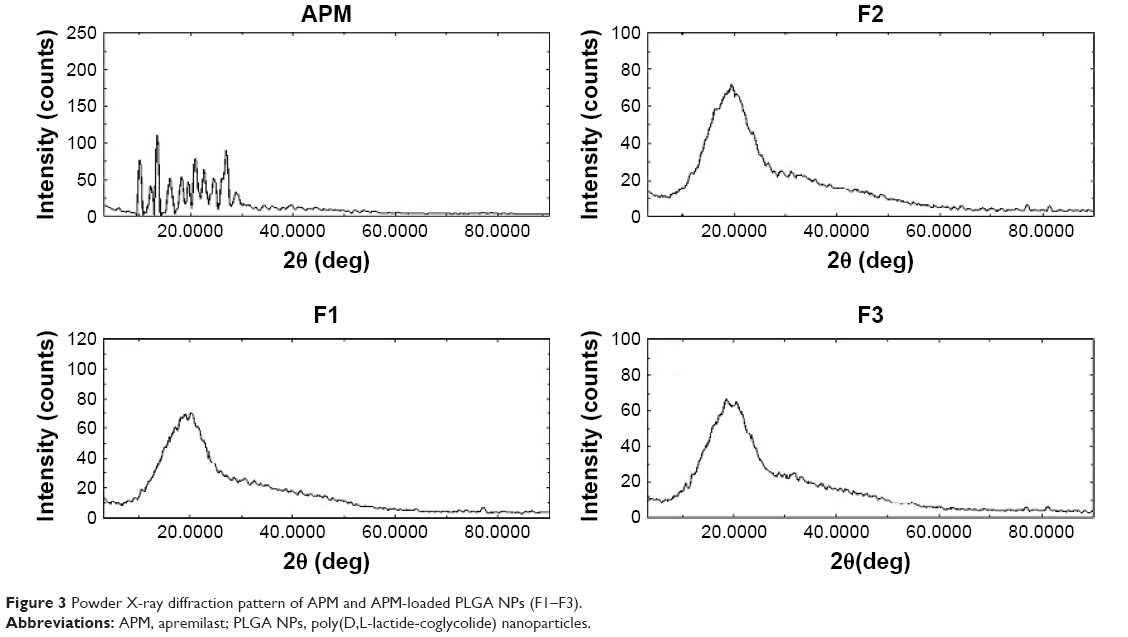 | Figure 3 Powder X-ray diffraction pattern of APM and APM-loaded PLGA NPs (F1–F3). |
Particle morphology by SEM
The morphology of the fabricated APM-loaded PLGA-NPs (F3) is provided in Figure 4. Most of the particles were discretely placed, and interparticle bridges were rare. The surface of the particles seemed smooth and fine. The presence of aggregation could be due to remnants of PVA even after two to three washes with deionized water. The alternate reason for agglomerates might be the freeze drying or specimen processing using metallic plating over the particles for SEM characterization. Another hypothesis of interparticle bond could be the high-energy centrifugal force used to isolate the particles from the dispersion; it could have enforced the particles to associate, therefore resulting in the formation of agglomerates. The fabricated APM-loaded PLGA NPs were found to be uniform, well defined, and spherical in shape with smooth surfaces.
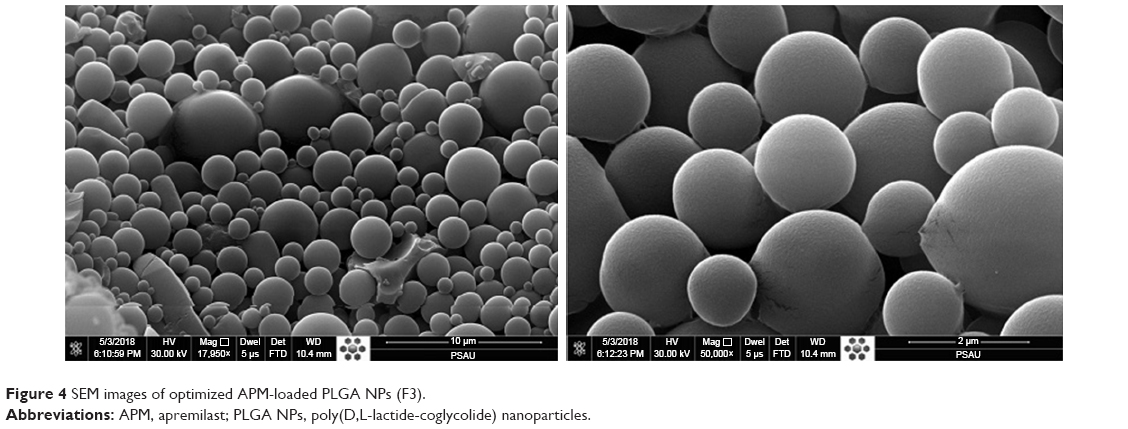 | Figure 4 SEM images of optimized APM-loaded PLGA NPs (F3). |
Drug-release studies
In vitro release studies are carried out to get an insight into the release behavior of the drug from the nanoparticles as well as details on the release mechanism and kinetics, enabling a rational and scientific approach to drug product development. The drug-release profile of pure APM and APM-loaded PLGA NPs (F3) is provided in Figure 5. A biphasic release pattern was noted in the study; an initial burst release was followed by a sustained release. The burst release of the drug found after the first 6 hours of the study from F3 nanoparticles was 67.8%, probably due to surface-adsorbed drug,28 and nanosized particles’ easy surface diffusion in the media due to larger surface area. Thereafter, the second phase that is the slow/sustained release was observed; this was probably due to the encapsulated drug inside the PLGA polymeric matrix being released by diffusion. The sustained release of drug might help in reducing the frequency of the drug’s oral administration.26 The APM-loaded PLGA NPs showed the cumulative release 74.2% of the drug in comparison to pure APM with 43.2% after 48 hours of the study’s commencement. To understand the mechanism of release of the drug from the PLGA polymer, the release data of F3 nanoparticles were fitted into different kinetic models. The release mechanism of the drug from F3 was consistently fitted into the Higuchi model with value of R2≥0.993 (Figure 6).
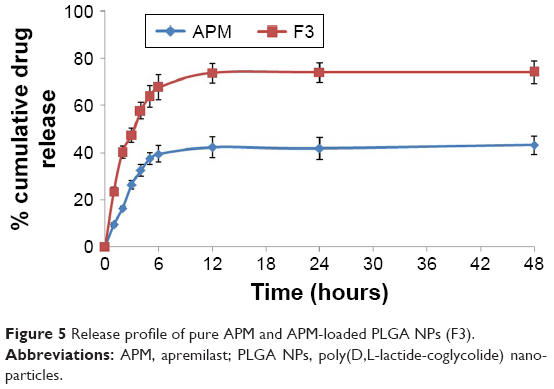 | Figure 5 Release profile of pure APM and APM-loaded PLGA NPs (F3). |
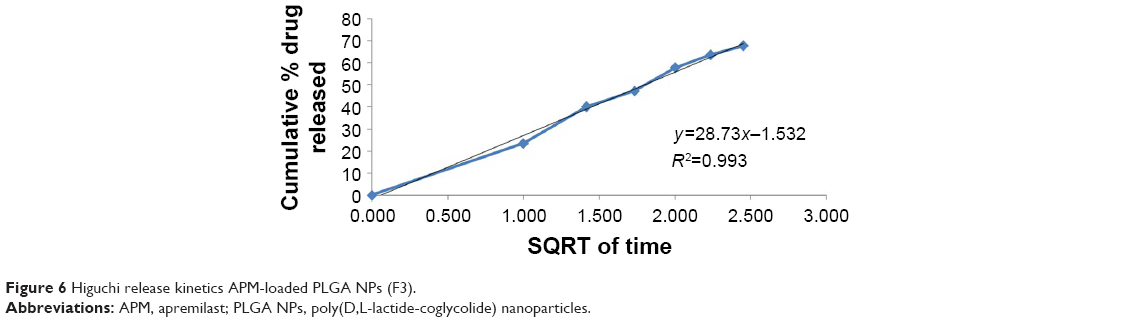 | Figure 6 Higuchi release kinetics APM-loaded PLGA NPs (F3). |
Pharmacokinetic studies
The concentration of APM in actual rat samples was determined against the plasma calibration curve (1–1,000 ng/mL) prepared in blank plasma. The pharmacokinetic parameter results obtained after the oral administration of 2 mg/kg of APM is presented in Table 3. As seen in the results, the extent of absorption (both AUC0–48 and AUC0–inf) of APM-loaded PLGA NPs (F3) was significantly (P<0.05) higher compared to pure APM suspension without significant change in rate of absorption (Cmax). This result confirmed that the bioavailability of APM-loaded PLGA NPs increased (2.25 times) compared to normal APM suspension without significant effects on peak exposure. Moreover, the rate of elimination (Kel) was markedly lower (P<0.01) for APM-loaded PLGA NPs followed by a highly significant increase in T1/2 (P<0.001) and MRT (P<0.01) values. This result indicates that nanoparticles (F3) not only increase the bioavailability of APM but also facilitate long-term retention, which might be helpful for once-daily regimen treatment. In this study, the rate and extent of absorption of APM were higher in comparison to those reported in our previous study. This might be due to gender-specific absorption of APM. The bioavailability of APM was found to be five times higher in female rats compared to male.6 The mean plasma concentration profile of APM after oral administration of 2 mg/kg (APM suspension and F3) in male rats is presented in Figure 7. The representative MRM chromatograms of APM and IS at 1 hour after oral administration of APM (2 mg/kg) is presented in Figure 8.
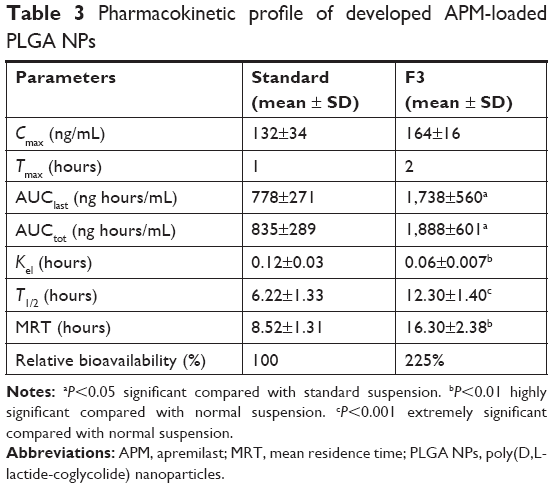 | Table 3 Pharmacokinetic profile of developed APM-loaded PLGA NPs |
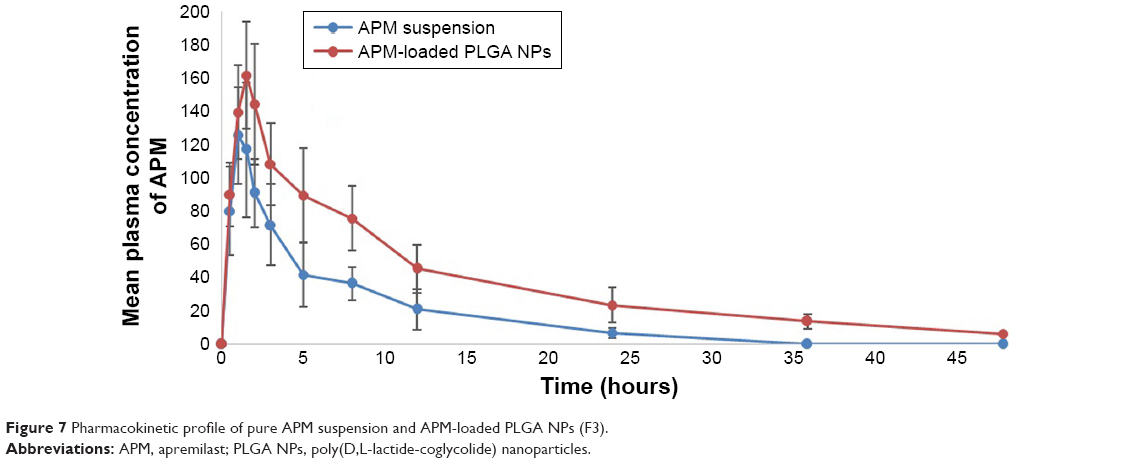 | Figure 7 Pharmacokinetic profile of pure APM suspension and APM-loaded PLGA NPs (F3). |
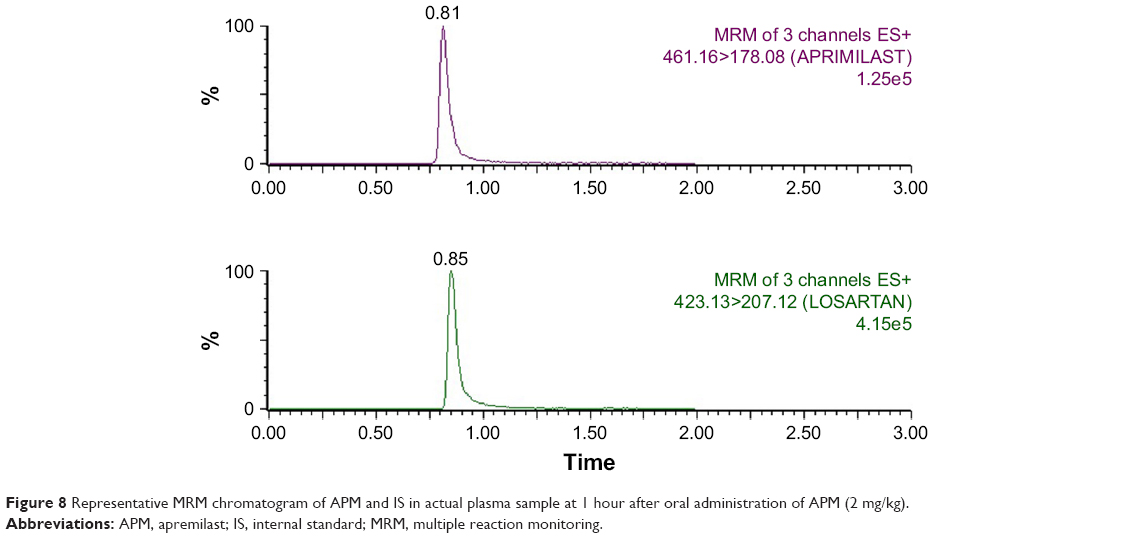 | Figure 8 Representative MRM chromatogram of APM and IS in actual plasma sample at 1 hour after oral administration of APM (2 mg/kg). |
Conclusion
This study aimed to develop APM-loaded PLGA NPs to increase the bioavailability and sustain the release of APM. Three formulations (F1–F3) were prepared by differing the PLGA concentration. The optimized NPs (F3) had a suitable size and %EE to delay the release of the drug, which was confirmed by in vitro release study and in vivo pharmacokinetic evaluation. Hence, it is concluded that the developed NPs benefits from the nanosize and promise better therapeutic efficacy. APM-loaded PLGA NPs can therefore be good replacement for the conventional formulation with benefits of decreased frequency of dose, increased bioavailability, and better patient compliance.
Acknowledgment
The authors extend their appreciation to the Deanship of Scientific Research at King Saud University for funding this work through the research group project no. RGP-203.
Disclosure
The authors report no conflicts of interest in this work.
References
Menter A, Gottlieb A, Feldman SR, et al. Guidelines of care for the management of psoriasis and psoriatic arthritis: section 1. Overview of psoriasis and guidelines of care for the treatment of psoriasis with biologics. J Am Acad Dermatol. 2008;58(5):826–850. | ||
Gottlieb A, Korman NJ, Gordon KB, et al. Guidelines of care for the management of psoriasis and psoriatic arthritis: section 2. Psoriatic arthritis: overview and guidelines of care for treatment with an emphasis on the biologics. J Am Acad Dermatol. 2008;58(5):851–864. | ||
Deeks ED. Apremilast: a review in psoriasis and psoriatic arthritis. Drugs. 2015;75(12):1393–1403. | ||
Hoffman MB, Hill D, Feldman SR. Current challenges and emerging drug delivery strategies for the treatment of psoriasis. Expert Opin Drug Deliv. 2016;13(10):1461–1473. | ||
Assessment report of Apremilast (Otezla). Committee for medicinal products for human use, European Medicines Agency. 2014. | ||
US Food and Drug Administration. Centre for Drug Evaluation and Research. Pharmacolocgical Overview of OTEZLA (apremilast) tablets. Available from https://www.accessdata.fda.gov/drugsatfda_docs/nda/2014/205437Orig1s000PharmR.pdf. Accessed October 1, 2018. | ||
Papp K, Cather JC, Rosoph L, et al. Efficacy of apremilast in the treatment of moderate to severe psoriasis: a randomised controlled trial. Lancet. 2012;380(9843):738–746. | ||
OTEZLA® (apremilast) tablets [Prescribing Information] 2017. Celgene Corporation Summit, New Jersay. Available from https://media.celgene.com/content/uploads/otezla-pi.pdf. Accessed October 1, 2018. | ||
Tang M, Hu P, Huang S, Zheng Q, Yu H, He Y. Development of an extended-release formulation for apremilast and a level A in vitro-in vivo correlation study in beagle dogs. Chem Pharm Bull. 2016;64(11):1607–1615. | ||
Zhang Y, Wischke C, Mittal S, Mitra A, Schwendeman SP. Design of controlled release PLGA microspheres for hydrophobic fenretinide. Mol Pharm. 2016;13(8):2622–2630. | ||
Cossé A, König C, Lamprecht A, Wagner KG. Hot melt extrusion for sustained protein release: matrix erosion and in vitro release of PLGA-based implants. AAPS PharmSciTech. 2017;18(1):15–26. | ||
Li L, Li C, Zhou J. Effective sustained release of 5-FU-loaded PLGA implant for improving therapeutic index of 5-FU in colon tumor. Int J Pharm. 2018;550(1–2):380–387. | ||
Anwer MK, Al-Mansoor MA, Jamil S, Al-Shdefat R, Ansari MN, Shakeel F. Development and evaluation of PLGA polymer based nanoparticles of quercetin. Int J Biol Macromol. 2016;92:213–219. | ||
Anwer MK, Jamil S, Ansari MJ, Iqbal M, Imam F, Shakeel F. Development and evaluation of olmesartan medoxomil loaded PLGA nanoparticles. Mater Res Innov. 2016;20(3):193–197. | ||
Padhi S, Kapoor R, Verma D, Panda AK, Iqbal Z. Formulation and optimization of topotecan nanoparticles: in vitro characterization, cytotoxicity, cellular uptake and pharmacokinetic outcomes. J Photochem Photobiol B. 2018;183:222–232. | ||
Anwer MK, Al-Shdefat R, Ezzeldin E, Alshahrani SM, Alshetaili AS, Iqbal M. Preparation, evaluation and bioavailability studies of eudragit coated PLGA nanoparticles for sustained release of eluxadoline for the treatment of irritable bowel syndrome. Front Pharmacol. 2017;8:844. | ||
Abraham J, Mishra V, Chaudhari K, Mittal V. Topical compositions of apremilast. Patent No. WO2017216738A1; 2017. | ||
Ganarajan G, Sharma DC, Tangri P, Kothiyal P. Design and characterization of apremilast loaded emulgel for topical treatment. IJPBS. 2018;8(3):552–562. | ||
Kushwaha AS, Repka MA, Narasimha Murthy S. A Novel Apremilast Nail Lacquer Formulation for the Treatment of Nail Psoriasis. AAPS PharmSciTech. 2017;18(8):2949–2956. | ||
Lonkar NA, Dole MN, Sawant SD. Development and validation of UV spectrophotometric method for the estimation of apremilast in bulk form by absorbance maxima method. World J Pharm Pharm Sci. 2017;6(7):758–766. | ||
Iqbal M, Ezzeldin E, Al-Rashood KA, Al-Shdefat R, Anwer MK. High throughput μ-SPE based elution coupled with UPLC-MS/MS for determination of eluxadoline in plasma sample: application in pharmacokinetic characterization of PLGA nanoparticle formulations in rats. J Pharm Biomed Anal. 2018;149:172–178. | ||
Jain AK, Das M, Swarnakar NK, Jain S. Engineered PLGA nanoparticles: an emerging delivery tool in cancer therapeutics. Crit Rev Ther Drug Carrier Syst. 2011;28(1):1–45. | ||
Obadalova I, Dammer O, Krejcik L, et al. A solid form of apremilast and a process for preparing the same. Patent No. WO2016169533A1; 2016. | ||
Budhian A, Siegel SJ, Winey KI. Haloperidol-loaded PLGA nanoparticles: systematic study of particle size and drug content. Int J Pharm. 2007;336(2):367–375. | ||
Soni A, Dandagi P, Gadad A, Mastiholimath V. Simvastatin-loaded PLGA nanoparticles for improved oral bioavailability and sustained release: effect of formulation variables. Asian J Pharm. 2011;5(2):57–64. | ||
Yeo Y, Park K. Control of encapsulation efficiency and initial burst in polymeric microparticle systems. Arch Pharm Res. 2004;27(1):1–12. | ||
Anzar N, Mirza MA, Anwer K, et al. Preparation, evaluation and pharmacokinetic studies of spray dried PLGA polymeric submicron particles of simvastatin for the effective treatment of breast cancer. J Mol Liq. 2018;249:609–616. | ||
Honary S, Zahir F. Effect of zeta potential on the properties of nano-drug delivery systems – a review (Part 1). Trop J Pharm Res. 2013;12:255–264. |
 © 2019 The Author(s). This work is published and licensed by Dove Medical Press Limited. The
full terms of this license are available at https://www.dovepress.com/terms
and incorporate the Creative Commons Attribution
- Non Commercial (unported, 3.0) License.
By accessing the work you hereby accept the Terms. Non-commercial uses of the work are permitted
without any further permission from Dove Medical Press Limited, provided the work is properly
attributed. For permission for commercial use of this work, please see paragraphs 4.2 and 5 of our Terms.
© 2019 The Author(s). This work is published and licensed by Dove Medical Press Limited. The
full terms of this license are available at https://www.dovepress.com/terms
and incorporate the Creative Commons Attribution
- Non Commercial (unported, 3.0) License.
By accessing the work you hereby accept the Terms. Non-commercial uses of the work are permitted
without any further permission from Dove Medical Press Limited, provided the work is properly
attributed. For permission for commercial use of this work, please see paragraphs 4.2 and 5 of our Terms.