Back to Journals » International Journal of Nanomedicine » Volume 12
Preparation of exenatide-loaded linear poly(ethylene glycol)-brush poly(L-lysine) block copolymer: potential implications on diabetic nephropathy
Authors Tong F ![]()
Received 10 March 2017
Accepted for publication 23 May 2017
Published 29 June 2017 Volume 2017:12 Pages 4663—4678
DOI https://doi.org/10.2147/IJN.S136646
Checked for plagiarism Yes
Review by Single anonymous peer review
Peer reviewer comments 2
Editor who approved publication: Dr Linlin Sun
Fei Tong
Department of Pathology and Pathophysiology, Provincial Key Discipline of Pharmacology, Jiaxing University Medical College, Jiaxing, Zhejiang, People’s Republic of China
Abstract: The poly(ethylene glycol)-b-brush poly(l-lysine) polymer (PEG-b-(PELG50-g-PLL3)) was synthesized and evaluated as a nanocarrier for prolonging delivery of exenatide through the abdominal subcutaneous injection route. The isoelectric point of exenatide was 4.86, and exenatide could combine with PEG-b-(PELG50-g-PLL3) polymers via electrostatic interactions at pH 7.4. This polymer was a good candidate for achieving prolonged drug delivery for exenatide, considering its high molecular weight. Besides the physicochemical characterization of the polymer, in vitro and in vivo applications were researched as a sustained exenatide delivery system. In the in vitro release research, 20.16%–76.88% of total exenatide was released from the PEG-b-(PELG50-g-PLL3) polymer within 7 days. The synthesized block-brush polymers and exenatide–block-brush polymers were analyzed by nuclear magnetic resonance spectroscopy, gel permeation chromatography, transmission electron microscopy, nanoparticle size instrument, and scanning electron microscopy. The best formulation was selected for in vivo experimentation to achieve blood glucose control in diabetic rat models using free exenatide as the control. The hypoglycemic action of the formulation following subcutaneous injection in diabetic rats lasted 7 days, and the results indicated that exenatide–block-brush polymers demonstrate enhanced long-acting hypoglycemic action. Besides the hypoglycemic action, exenatide–block-brush polymers significantly alleviated diabetic nephropathy via improving renal function, decreasing oxidative stress injury, decreasing urinary albumin excretion rate, mitigating albumin/creatinine ratio, reducing blood lipids, abating kidney index, weakening apoptosis, and downregulating expression of connective tissue growth factor. All of the results suggested that PEG-b-(PELG50-g-PLL3) polymers could be used as potential exenatide nanocarriers, with efficient encapsulation and sustained release.
Keywords: block copolymer, PELG50-g-PLL3, exenatide, hypoglycemic action, diabetic nephropathy
Introduction
Diabetic nephropathy (DN) is a life-threatening complication in patients with long-standing diabetes.1 Exenatide therapy is essential in the treatment of DN.2 However, exenatide therapy is limited due to its short plasma half-life of 2.4 h and, thus, dosing is very difficult and frequent injections are required, which are inconvenient for patients and result in low compliance.3 Considerable interest has been generated over the past few decades in the development of effective protein-delivery systems, such as hydrogels,4–9 polymeric nanoparticles,10–16 nano- or microcapsules,17–19 and liposomes for peptides and proteins. Many researchers in this field are striving to identify appropriate delivery systems to load peptides and proteins such as exenatide. However, there is still no commercially applicable delivery system that is available for efficient delivery of exenatide. Therefore, development of appropriate delivery systems for exenatide still faces challenges.
Exenatide administered by injection has activity that is sustained for a very short time due to faster degradation/consumption.3 Moreover, frequent exenatide injections are needed for sustained pharmacological action and, as a result, are painful for patients.3 To avoid frequent injections for patients, many investigators are developing potential exenatide delivery systems. Some reports in the literature showed that loading exenatide onto nanoparticles prolongs the plasma half-life of exenatide.20,21 In this study, we first introduce brush poly(L-lysine) (PLL)-based block-brush polymers as potential exenatide carriers. The synthesis of the block-brush poly(ethylene glycol)-b-brush poly(L-lysine) (PEG-b-(PELG50-g-PLL3)) polymers refers to our previous work.22 The negatively charged exenatide combines with positively charged PLL brush block through electrostatic interactions at pH 7.4 (structure shown in Figure 1). The loaded exenatide ensures sustained release, which can improve the protective effect and bioactivity of exenatide. The loading capacity of exenatide was decided via vitro release. In this in vivo research study, we continue to evaluate the sustained pharmacological effect of the exenatide-loaded block-brush polymer PEG-b-(PELG50-g-PLL3) in prolonging blood glucose control and significantly alleviating DN in comparison with free exenatide as the control.
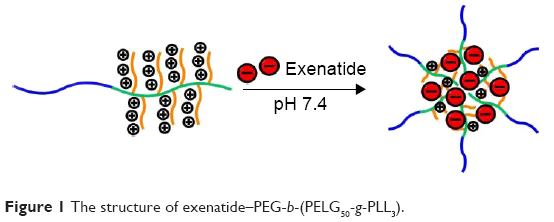 | Figure 1 The structure of exenatide–PEG-b-(PELG50-g-PLL3). |
Materials and methods
Materials
The FITC-PEG-NH2 (Mw=5 kDa), exenatide, streptozocin (STZ), and other reagents used in this research were from Sigma-Aldrich (St Louis, MO, USA). EC9706 cells were purchased from Shanghai Fu Xiang Biotechnology Co., Ltd., Shanghai, People’s Republic of China.
Synthesis and cytotoxicity of PEG-b-(PELG50-g-PLL3)
A detailed description of the synthesis and measurement of cytotoxicity (EC9706 cell was selected) of PEG-b-(PELG50-g-PLL3) is available in our previous work.22
Synthesis of FITC-PEG-b-(PELG50-g-PLL3)
The process for synthesizing FITC-PEG-b-(PELG50-g-PLL3) is consistent with the synthesis of PEG-b-(PELG50-g-PLL3).
Encapsulation of exenatide by PEG-b-(PELG50-g-PLL3) and FITC-PEG-b-(PELG50-g-PLL3)
To investigate the encapsulation of exenatide by PEG-b-(PELG50-g-PLL3) and FITC-PEG-b-(PELG50-g-PLL3), a given volume of exenatide (0.2 mg/mL) solution was mixed with PEG-b-(PELG50-g-PLL3) and FITC-PEG-b-(PELG50-g-PLL3) solutions for approximately 30 min; then, the mixed solution was dialyzed through dialysis tubing (molecular weight cut-off [MWCO] 100 kDa). The dialysis of free exenatide was also measured under the same conditions to serve as a control. When exenatide in the control experiment was completely dialyzed, the amount of exenatide in the outer dialysate of the polymer solution was measured using ELISA and then subtracted from the total amount of added exenatide.
Cytotoxicity of exenatide–PEG-b-(PELG50-g-PLL3)
For a detailed description of the measurement of cytotoxicity (EC9706 cell was selected) of exenatide–PEG-b-(PELG50-g-PLL3), refer to our previous work.22
In vitro release of exenatide from PEG-b-(PELG50-g-PLL3) and FITC-PEG-b-(PELG50-g-PLL3)
The release of exenatide from PEG-b-(PELG50-g-PLL3) and FITC-PEG-b-(PELG50-g-PLL3) was investigated using a dialysis method (MWCO, 100 kDa) at room temperature with PEG-b-(PELG50-g-PLL3)–exenatide and FITC-PEG-b-(PELG50-g-PLL3)–exenatide complex solution (5 mL) against a PB buffer (100 mL, pH 7.4, 0.1 mol/L). The PEG-b-(PELG50-g-PLL3)–exenatide and FITC-PEG-b-(PELG50-g-PLL3)–exenatide complex solutions were prepared as described in the encapsulation of exenatide by PEG-b-(PELG50-g-PLL3) and FITC-PEG-b-(PELG50-g-PLL3). At specific time intervals, a given volume of the release media was withdrawn and replenished with an equal volume of fresh release media. The amounts of exenatide released were determined by ELISA.
Animals
Sprague–Dawley male rats (weight 160–220 g) were supplied by the Jiaxing University Medical College, Jiaxing, People’s Republic of China. The procedures and care of animals was approved by the institutional ethics committee of Jiaxing University Medical College, Jiaxing, People’s Republic of China. The investigation conformed to the guide for the care and use of laboratory animals published by the US National Institutes of Health (NIH Publication updated in 2011).
Pharmacodynamic research of exenatide
The SD rats were randomly divided into two groups (n=5 per group). Exenatide group: exenatide 5 μg/kg was administered as a single subcutaneous injection; in the exenatide–PEG-b-(PELG50-g-PLL3) group, exenatide–PEG-b-(PELG50-g-PLL3) 5 μg/kg was given as a single subcutaneous injection. Blood samples were collected from the tail vein of rats at predetermined time points, and plasma exenatide concentration was assayed by ELISA.
Diabetic animal model
The SD rats were fed a high-fat diet (fat content 40%) for ten weeks and then STZ (dissolved in citrate buffer, pH 4.5) was administered at a dose of 35 mg/kg as a single intraperitoneal injection. A total of 72 h later, diabetes was confirmed by measuring blood glucose levels using the glucose oxidase–peroxidase (GOD-POD) methods.23 Animals which had blood glucose levels >16.7 mmol/L were used in the experiments.
Treatment with exenatide–PEG-b-(PELG50-g-PLL3) complex in diabetic animal model
Fifteen diabetic male rats were randomly assigned to one of three groups (n=5, per group): 1) control group; 2) exenatide group: 5 μg/kg as a single abdominal subcutaneous injection; and 3) exenatide–PEG-b-(PELG50-g-PLL3) group: 5 μg/kg as a single abdominal subcutaneous injection. At the predetermined time points, blood glucose levels were measured using the GOD-POD methods.23
Treatment with exenatide–PEG-b-(PELG50-g-PLL3) complex in DN
Ten normal SD rats and 30 diabetic male rats were assigned to four groups (n=10, per group): 1) sham group: normal SD rats were fed a standard diet; 2) DN group: saline buffer of equal quantities was subcutaneously administered for eight weeks in diabetic male rats; 3) exenatide group: 5 μg/kg as a single abdominal subcutaneous injection daily for eight weeks continuously in diabetic male rats; and 4) exenatide–PEG-b-(PELG50-g-PLL3) group: 5 μg/kg as a single abdominal subcutaneous injection every 7 days, continuously administered for eight weeks to diabetic rats. At the predetermined time points, blood samples and one of the kidneys were collected. Fasting blood glucose (FBG), body weight, serum lipid, fasting plasma insulin (FINS), homeostasis model insulin resistance index (HOMA-IR), insulin sensitivity index (ISI), blood urea nitrogen (BUN), serum creatinine (Scr), urinary albumin excretion rate (UAER), mitigating albumin/creatinine ratio (ACR), superoxide dismutase (SOD), malonyldialdehyde (MDA), apoptotic cell ratio, kidney weight/body weight, and expression of connective tissue growth factor (CTGF) were measured.
Statistical measurement
All of the data were analyzed by mean values ± standard deviation (SD). Between-group analyses were conducted by ANOVA. A value of less than 0.01 (P<0.01) was regarded as indicating statistical significance.
Results
Synthesis and characterization of PEG-b-(PELG50-g-PLL3)
The linear PEG-b-(PELG50-g-PLL3) copolymer comprises a linear PEG block and a brush-like PLL block (Figures S1 and S2).
Synthesis of FITC-PEG-b-(PELG50-g-PLL3)
The FITC-PEG-b-(PELG50-g-PLL3) was synthesized using the following method: FITC-PEG-b-PBLG was prepared by the ring-opening polymerization of BLG-N-carboxyanhydride (NCA), with FITC-PEG-NH2 as the macroinitiator, followed by aminolysis with ethanediamine to obtain FITC-PEG-b-PELG. FITC-PEG-b-PELG was used as the macroinitiator to initiate the ring-opening polymerization of ZLL-NCA to prepare FITC-PEG-b-(PELG-g-PZLL). The benzyl groups of poly(ε-benzyloxycarbonyl-L-lysine) were then deprotected in the presence of HBr to obtain the final product, FITC-PEG-b-(PELG50-g-PLL3), as depicted in Figure 2.
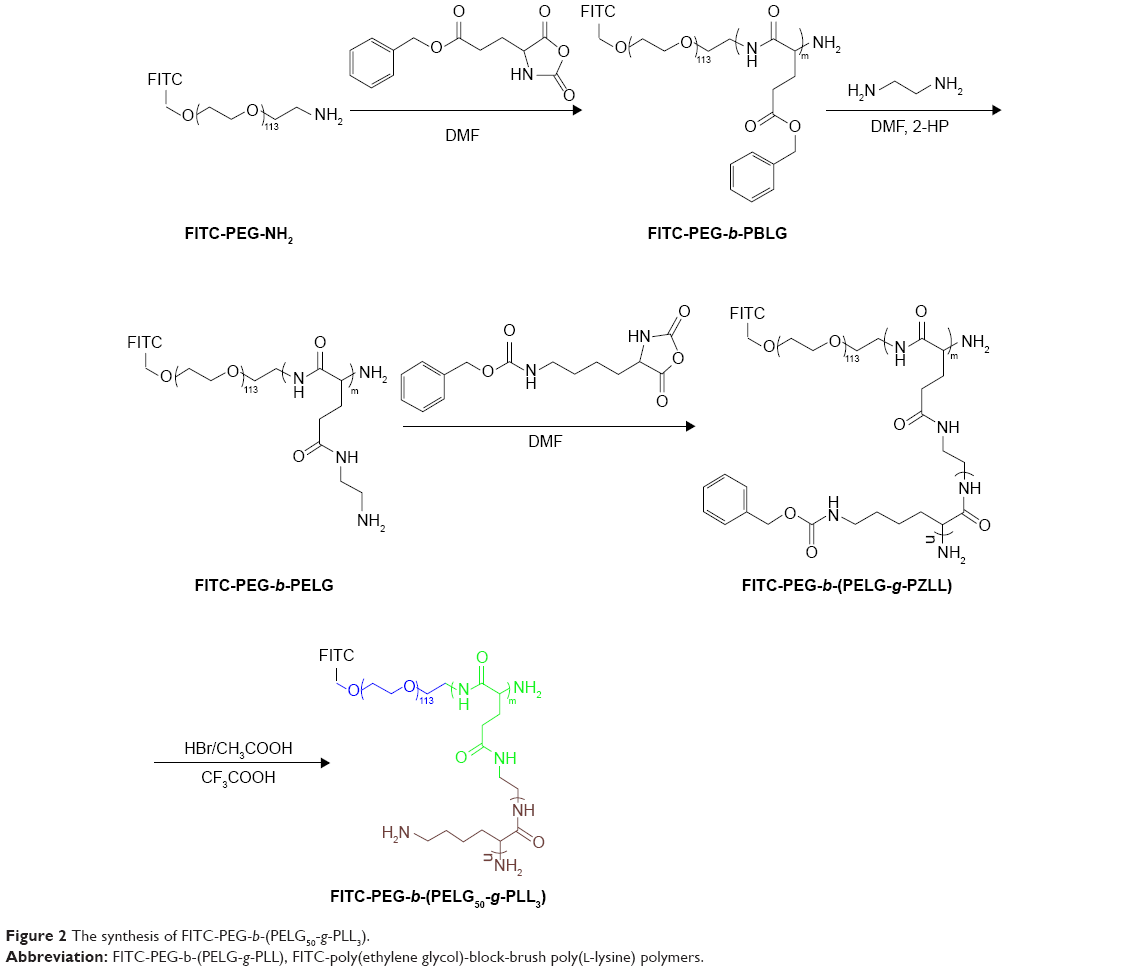 | Figure 2 The synthesis of FITC-PEG-b-(PELG50-g-PLL3). |
Cell viability
EC9706 cells were used to assess biomaterial cytotoxicity (Figure S2). The result was expressed via equation 1:
|
|
Morphological changes of exenatide–PEG-b-(PELG50-g-PLL3) and exenatide–FITC-PEG-b-(PELG50-g-PLL3) complexes in neutral conditions
According to the literature,24 the bright-field and fluorescent images of the exenatide–PEG-b-(PELG50-g-PLL3) and exenatide–FITC-PEG-b-(PELG50-g-PLL3) complexes were visualized with scanning electron microscopy (Figure 3). Figure 3B shows that FITC-labeled PEG-b-(PELG50-g-PLL3) was used as the outer sphere to render the shell fluorescent. The bright-field images of exenatide–PEG-b-(PELG50-g-PLL3) appearance are shown in Figure 3A. The exenatide–PEG-b-(PELG50-g-PLL3) and exenatide–PEG-b-(PELG50-g-PLL3) complexes are further characterized by a nanoparticle sizing instrument and transmission electron microscopy. The average particle size of PEG-b-(PELG50-g-PLL3) and the exenatide–PEG-b-(PELG50-g-PLL3) complex are approximately 11 and 24 nm, respectively, as measured via the nanoparticle sizing instrument (Figure 4A and B, and Table 1). The diameter of PEG-b-(PELG50-g-PLL3) and the exenatide–PEG-b-(PELG50-g-PLL3) complex are approximately 36 and 67 nm, respectively, via transmission electron microscopy (Figure S2 and Table 1).
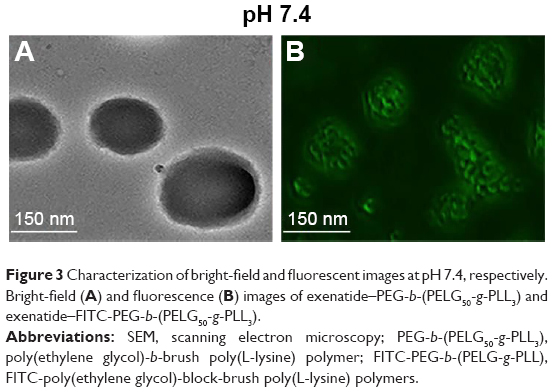 | Figure 3 Characterization of bright-field and fluorescent images at pH 7.4, respectively. Bright-field (A) and fluorescence (B) images of exenatide–PEG-b-(PELG50-g-PLL3) and exenatide–FITC-PEG-b-(PELG50-g-PLL3). |
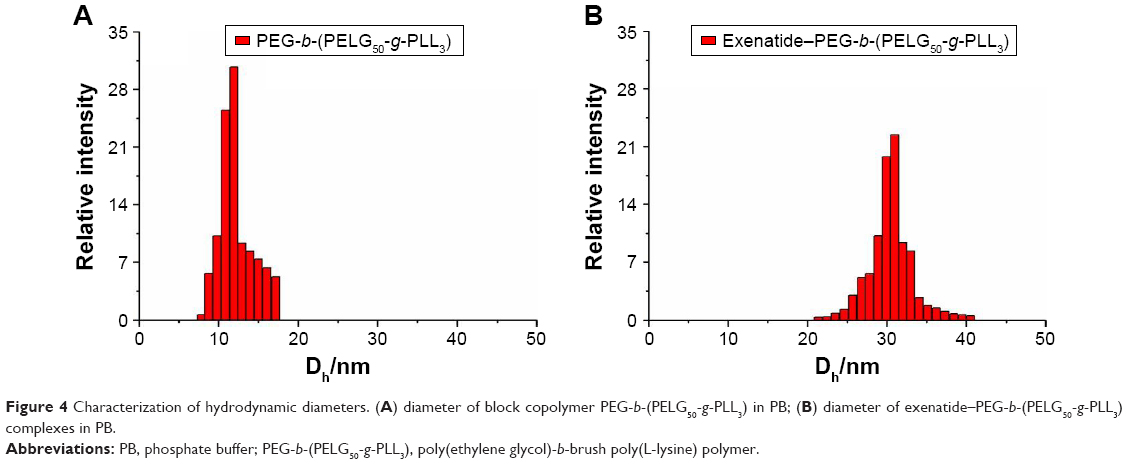 | Figure 4 Characterization of hydrodynamic diameters. (A) diameter of block copolymer PEG-b-(PELG50-g-PLL3) in PB; (B) diameter of exenatide–PEG-b-(PELG50-g-PLL3) complexes in PB. |
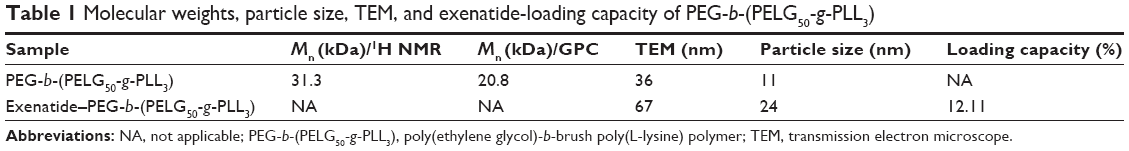 | Table 1 Molecular weights, particle size, TEM, and exenatide-loading capacity of PEG-b-(PELG50-g-PLL3) |
Loading capacity of exenatide in PEG-b-(PELG50-g-PLL3) and FITC-PEG-b-(PELG50-g-PLL3)
Exenatide can be efficiently loaded onto PEG-b-(PELG50-g-PLL3) and FITC-PEG-b-(PELG50-g-PLL3) at pH 7.4 through electrostatic interactions between the negatively charged exenatide and the positively charged PLL. Exenatide was mixed with PEG-b-(PELG50-g-PLL3) and FITC-PEG-b-(PELG50-g-PLL3) at 1:5 (mass ratio) and then dialyzed (MWCO, 100 kDa). The dialysis of free exenatide was also measured under the same conditions as a control. To determine the loading capacity of exenatide in PEG-b-(PELG50-g-PLL3) and FITC-PEG-b-(PELG50-g-PLL3), the amount of exenatide in the dialysate was checked using ELISA and then subtracted from the total amount of the added exenatide. The loading capacity of exenatide in both was determined to be 12.11% (Table 1).
Exenatide release in vitro
The release of exenatide from PEG-b-(PELG50-g-PLL3) and FITC-PEG-b-(PELG50-g-PLL3) was measured using a dialysis method (MWCO, 100 kDa) at normal temperature, with 5 mL of exenatide-loaded polymer. The cumulative release ratio of exenatide from exenatide–block-brush polymers is shown in Figure 5. After 2 h, approximately 22.89% of the exenatide is released from exenatide–block-brush copolymers, indicative of an initial burst release of exenatide. Approximately 55% of the exenatide is released after 3 days and approximately 76.88% after 7 days, indicative of biphase release profiles in the exenatide–block-brush polymers (Table S1).
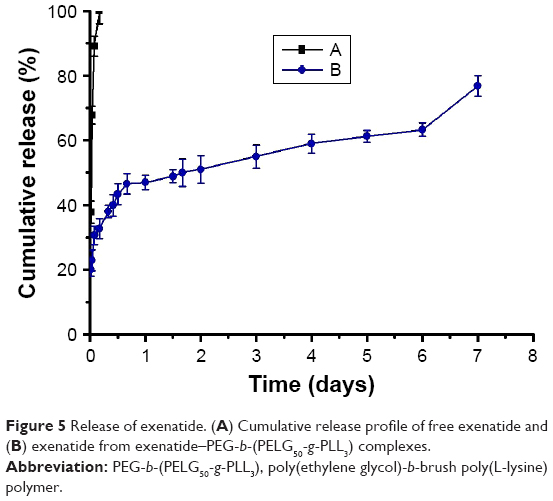 | Figure 5 Release of exenatide. (A) Cumulative release profile of free exenatide and (B) exenatide from exenatide–PEG-b-(PELG50-g-PLL3) complexes. |
Plasma exenatide concentration
Pharmacodynamic study confirms that, in rats treated with exenatide solution, plasma exenatide concentrations increase rapidly, reaching the peak within 2 h (678 ng/mL), followed by a remarkable decline after 24 h (0 ng/mL; Figure 6). In contrast, the concentration of the exenatide–PEG-b-(PELG50-g-PLL3) complex gradually peaks within 3 h (87.65 ng/mL) and remains at a comparatively low level by 7 days (2.14 ng/mL on day 7; Table S2).
 | Figure 6 Blood exenatide concentration of rats following subcutaneous administration of exenatide and exenatide–PEG-b-(PELG50-g-PLL3) complex (n=5; error bars represent the mean ± SD). |
Blood glucose levels
We measured the average blood glucose levels over time for rats administered exenatide solution and exenatide-loaded polymers and, compared with the Control group, we found that diabetic male rats injected with the exenatide solution maintained blood glucose levels within the normal range for approximately 3 h, after which glycemia slowly increases, with initial hyperglycemic values achieved within 4.5 h. In contrast, the exenatide–polymer complex reduces blood glucose levels to 5.8 mmol/L at 2 h after administration. Over the following 7 days, blood glucose concentrations increased to 5.1 mmol/L and are then maintained at approximately 4.2–6.1 mmol/L for 7 days. (Figure 7 and Table S3).
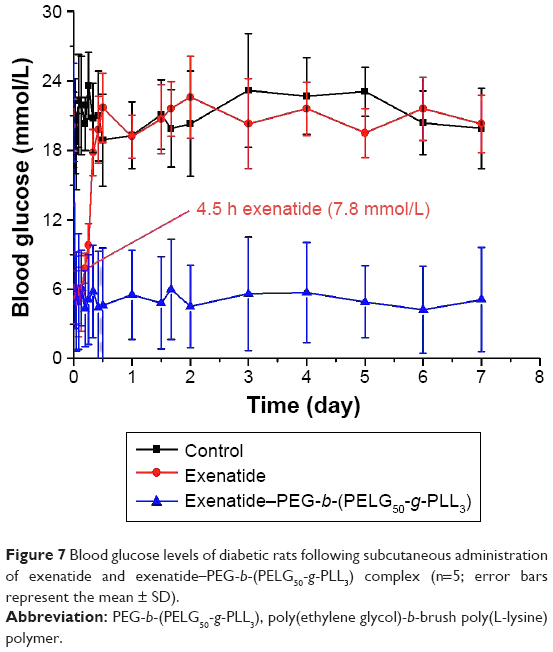 | Figure 7 Blood glucose levels of diabetic rats following subcutaneous administration of exenatide and exenatide–PEG-b-(PELG50-g-PLL3) complex (n=5; error bars represent the mean ± SD). |
Assessment of body weight, FBG, serum lipid, FINS, HOMA-IR, and ISI in DN
The body weights of rats were measured after eight weeks (Figure 8A), and were lower in the DN group than those in the sham group (P<0.01; body weight: sham group 519±1.24 g, DN group 437±15 g). Administration of exenatide resulted in a decrease in body weight (365±19 g), as compared with body weights of rats in the DN group (P<0.01). Administration of exenatide–PEG-b-(PELG50-g-PLL3) remarkably decreased body weight (329±14 g), which was markedly lower than that in the DN group (P<0.01).
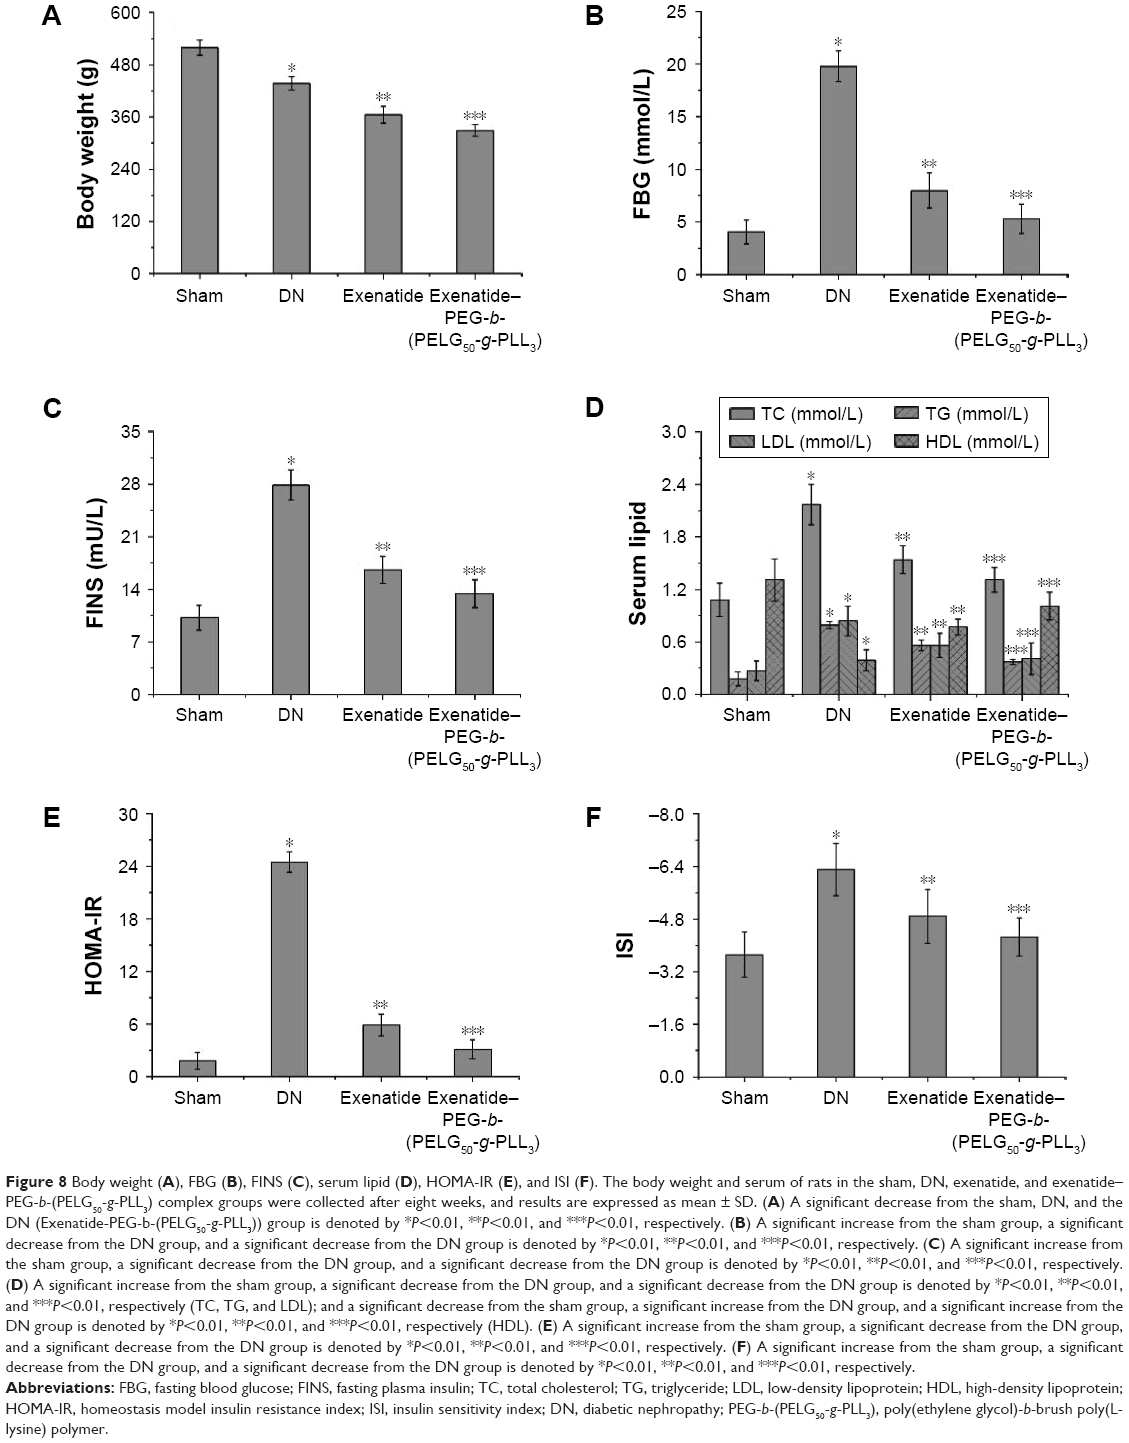 | Figure 8 Body weight (A), FBG (B), FINS (C), serum lipid (D), HOMA-IR (E), and ISI (F). The body weight and serum of rats in the sham, DN, exenatide, and exenatide–PEG-b-(PELG50-g-PLL3) complex groups were collected after eight weeks, and results are expressed as mean ± SD. (A) A significant decrease from the sham, DN, and the DN (Exenatide-PEG-b-(PELG50-g-PLL3)) group is denoted by *P<0.01, **P<0.01, and ***P<0.01, respectively. (B) A significant increase from the sham group, a significant decrease from the DN group, and a significant decrease from the DN group is denoted by *P<0.01, **P<0.01, and ***P<0.01, respectively. (C) A significant increase from the sham group, a significant decrease from the DN group, and a significant decrease from the DN group is denoted by *P<0.01, **P<0.01, and ***P<0.01, respectively. (D) A significant increase from the sham group, a significant decrease from the DN group, and a significant decrease from the DN group is denoted by *P<0.01, **P<0.01, and ***P<0.01, respectively (TC, TG, and LDL); and a significant decrease from the sham group, a significant increase from the DN group, and a significant increase from the DN group is denoted by *P<0.01, **P<0.01, and ***P<0.01, respectively (HDL). (E) A significant increase from the sham group, a significant decrease from the DN group, and a significant decrease from the DN group is denoted by *P<0.01, **P<0.01, and ***P<0.01, respectively. (F) A significant increase from the sham group, a significant decrease from the DN group, and a significant decrease from the DN group is denoted by *P<0.01, **P<0.01, and ***P<0.01, respectively. |
The FBG levels were measured via GOD-POD methods after eight weeks (Figure 8B), and were higher in the DN group than in the sham group (P<0.01; FBG: sham 4.05±1.13 mmol/L, DN 19.78±1.45 mmol/L). Administration of exenatide decreased FBG (7.98±1.67 mmol/L), in comparison with that in the DN group (P<0.01). Administration of exenatide–PEG-b-(PELG50-g-PLL3) remarkably decreased FBG (5.28±1.39 mmol/L), which was markedly lower than in the DN group (P<0.01).
Serum lipid levels in rats were measured after eight weeks (Figure 8C). Total cholesterol (TC), measured via the cholesterol oxidase peroxidase-4-aminoatipyrine (CHOD-PAP) method, was higher in rats in the DN group than in rats in the sham group (P<0.01). TC reached 1.08±0.19 mmol/L in the sham group, whereas TC in the DN group reached 2.17±0.23 mmol/L. Administration of exenatide decreased TC (1.54±0.16 mmol/L), as compared with TC in rats of the DN group (P<0.01). Administration of exenatide–PEG-b-(PELG50-g-PLL3) remarkably decreased TC (1.31±0.14 mmol/L), which was markedly lower than in the DN group (P<0.01); triglyceride (TG) levels measured via the lipoprotein lipase (LPL) enzymatic end point method in the DN group were higher than those in the sham group (P<0.01). TG reached 0.18±0.08 mmol/L in sham group, whereas it was 0.79±0.04 mmol/L in the DN group. Administration of exenatide decreased TG (0.56±0.06 mmol/L) in the sham group, as compared with TG in the DN group (P<0.01). Administration of exenatide–PEG-b-(PELG50-g-PLL3) remarkably decreased TG (0.37±0.03 mmol/L), which was markedly lower than in the DN group (P<0.01); low-density lipoprotein (LDL) assessed via direct method was higher in DN group rats than in sham group rats (P<0.01). LDL was 0.27±0.11 mmol/L in the sham group and 0.84±0.17 mmol/L in the DN group. Administration of exenatide decreased LDL (0.56±0.14 mmol/L), compared with LDL in rats of the DN group (P<0.01). Administration of exenatide–PEG-b-(PELG50-g-PLL3) remarkably decreased LDL (0.41±0.18 mmol/L), which was markedly lower than in the DN group (P<0.01); high-density lipoprotein (HDL) measured via direct method in DN group rats was lower than HDL in the sham group (P<0.01; HDL: sham group 1.31±0.24 mmol/L, DN group 0.39±0.12 mmol/L). Administration of exenatide increased HDL (0.77±0.09 mmol/L), compared with HDL in rats in the DN group (P<0.01). Administration of exenatide–PEG-b-(PELG50-g-PLL3) remarkably increased HDL (1.01±0.16 mmol/L), which was markedly higher than that in the DN group (P<0.01).
The FINS of rats was measured via magnetic particle separation enzyme-linked immunosorbent assay after eight weeks (Figure 8D). FINS in DN group rats were higher than in sham group rats (P<0.01; FINS: sham group 10.2±1.65 mU/L, DN group 27.9±2.01 mU/L). Administration of exenatide decreased FINS (16.6±1.78 mU/L), as compared with FINS in DN group rats (P<0.01). Administration of exenatide–PEG-b-(PELG50-g-PLL3) remarkably decreased FINS (13.4±1.85 mU/L), which was markedly lower than that in the DN group (P<0.01).
The HOMA-IR of rats was measured via (FBG × FINS)/22.5 after eight weeks (Figure 8E). HOMA-IR in the DN group was higher than in the sham group (P<0.01; HOMA-IR: sham group 1.8±0.98, DN group 24.5±1.17). Administration of exenatide decreased HOMA-IR (5.9±1.25), compared with HOMA-IR in the DN group (P<0.01). Administration of exenatide–PEG-b-(PELG50-g-PLL3) remarkably decreased HOMA-IR (3.1±1.09), which was markedly lower than in the DN group (P<0.01).
The ISI of rats was measured via Ln[1/(FBG × FINS)] after eight weeks (Figure 8F), and was lower in the DN group than in the sham group (P<0.01; ISI: sham group −3.72±0.68, DN group −6.31±0.79). Administration of exenatide increased ISI (−4.89±0.82), compared with ISI in the DN group (P<0.01). Administration of exenatide–PEG-b-(PELG50-g-PLL3) remarkably increased ISI (−4.26±0.58), which was markedly higher than that in the DN group (P<0.01).
Assessment of BUN and Scr in DN
Levels of BUN and Scr were examined with the o-phthalaldehyde and picric acid method.25,26 BUN was measured after eight weeks (Figure 9A), and was higher in the DN group than in the sham group (P<0.01; BUN: sham group 9.75±1.98 mmol/L, DN group 69.79±2.37 mmol/L). Administration of exenatide decreased BUN (45.12±2.06 mmol/L), compared with BUN in the DN group (P<0.01). Administration of exenatide–PEG-b-(PELG50-g-PLL3) remarkably decreased BUN (31.08±1.82), which was markedly lower than in the DN group (P<0.01). The Scr was measured after eight weeks (Figure 9B), and was higher in the DN group than in the sham group (P<0.01; Scr: sham group 67.13±3.45 μmol/L, DN group 303.25±9.85 μmol/L). Administration of exenatide decreased Scr (187.32±7.32 μmol/L), compared with Scr in the DN group (P<0.01). Administration of exenatide–PEG-b-(PELG50-g-PLL3) remarkably decreased Scr (127.69±6.79 μmol/L), which was markedly lower than that in the DN group (P<0.01).
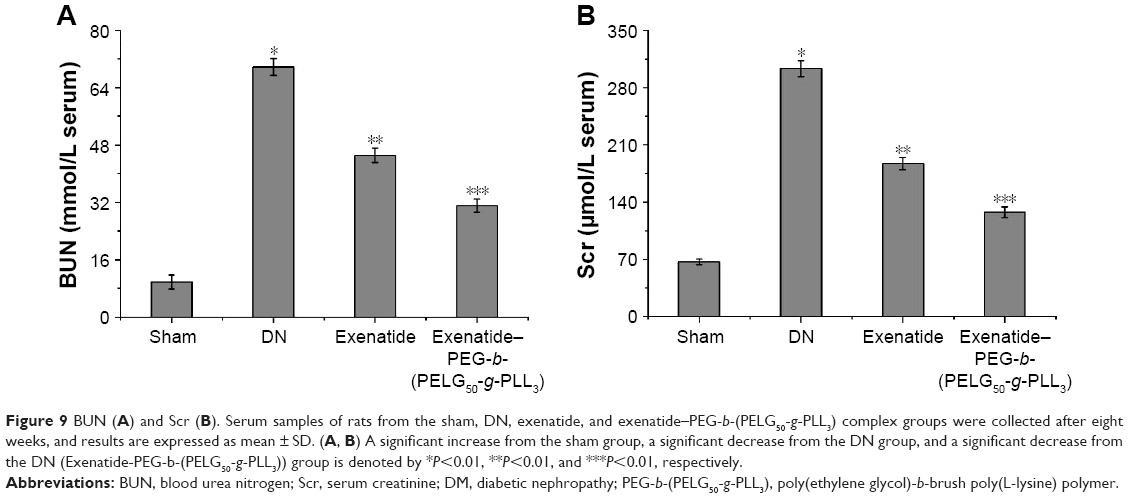 | Figure 9 BUN (A) and Scr (B). Serum samples of rats from the sham, DN, exenatide, and exenatide–PEG-b-(PELG50-g-PLL3) complex groups were collected after eight weeks, and results are expressed as mean ± SD. (A, B) A significant increase from the sham group, a significant decrease from the DN group, and a significant decrease from the DN (Exenatide-PEG-b-(PELG50-g-PLL3)) group is denoted by *P<0.01, **P<0.01, and ***P<0.01, respectively. |
Assessment of SOD activity and MDA level of renal tissues in DN
Both SOD activity and MDA level were examined with the xanthine oxidase and thiobarbituric acid method.25,26 SOD activity was measured after eight weeks (Figure 10A). SOD activity in the DN group was less than in the sham group (P<0.01; SOD activity: sham 76.32±2.39 U, DN group 31.25±1.45 U). Administration of exenatide increased SOD activity (48.69±1.19 U), compared with that in the DN group (P<0.01). Administration of exenatide–PEG-b-(PELG50-g-PLL3) remarkably increased SOD activity (61.27±2.08 U), which was markedly higher than in the DN group (P<0.01). The MDA level was measured after eight weeks (Figure 10B), and was higher in the DN group than in the sham group (P<0.01; MDA: sham group 0.19±0.08 nmol/L, DN group 0.98±0.06 nmol/L). Administration of exenatide decreased the MDA level (0.79±0.07 nmol/L), compared with that in the DN group (P<0.01). Administration of exenatide–PEG-b-(PELG50-g-PLL3) remarkably decreased MDA level (0.51±0.04 nmol/L), which was markedly lower than in the DN group (P<0.01).
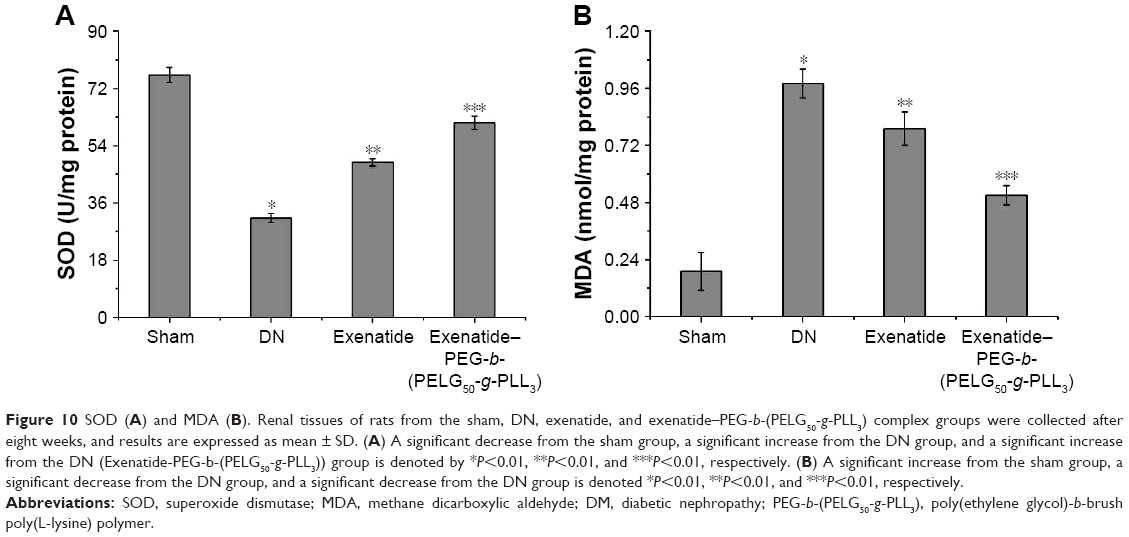 | Figure 10 SOD (A) and MDA (B). Renal tissues of rats from the sham, DN, exenatide, and exenatide–PEG-b-(PELG50-g-PLL3) complex groups were collected after eight weeks, and results are expressed as mean ± SD. (A) A significant decrease from the sham group, a significant increase from the DN group, and a significant increase from the DN (Exenatide-PEG-b-(PELG50-g-PLL3)) group is denoted by *P<0.01, **P<0.01, and ***P<0.01, respectively. (B) A significant increase from the sham group, a significant decrease from the DN group, and a significant decrease from the DN group is denoted *P<0.01, **P<0.01, and ***P<0.01, respectively. |
Assessment of kidney weight/body weight
The kidney weight/body weight was measured after eight weeks (Figure 11), and was lower in the DN group than in the sham group (P<0.01; kidney weight/body weight: sham group 4.71±0.69, DN group reached 14.27±0.86). Administration of exenatide decreased kidney weight/body weight (9.85±0.45), compared with that in the DN group (P<0.01). Administration of exenatide–PEG-b-(PELG50-g-PLL3) remarkably decreased kidney weight/body weight (7.36±0.58), which was markedly lower than that in the DN group (P<0.01).
 | Figure 11 Kidney weight/body weight. The kidney weight and body weight of rats from the sham, DN, exenatide, and exenatide–PEG-b-(PELG50-g-PLL3) complex groups were collected after eight weeks, and results were expressed as mean ± SD. A significant increase from the sham group, a significant decrease from the DN group, and a significant decrease from the DN (Exenatide-PEG-b-(PELG50-g-PLL3)) group is denoted by *P<0.01, **P<0.01, and ***P<0.01, respectively. |
Assessment of the UAER on DN
The UAER was measured after eight weeks (Figure 12), and was higher in the DN group than in the sham group (P<0.01; UAER: sham group 2.03±0.39 mg, DN group 56.75±1.13 mg). Administration of exenatide decreased UAER (30.56±3.29 mg), compared with that in the DN group (P<0.01). Administration of exenatide–PEG-b-(PELG50-g-PLL3) remarkably decreased UAER (17.19±1.85 mg), which was markedly lower than in the DN group (P<0.01).
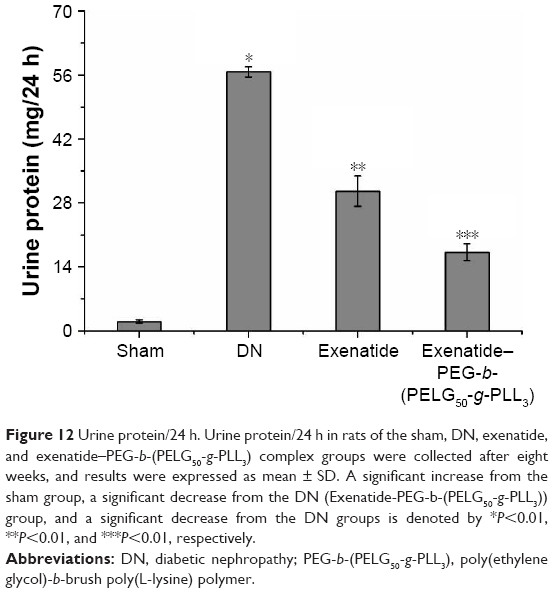 | Figure 12 Urine protein/24 h. Urine protein/24 h in rats of the sham, DN, exenatide, and exenatide–PEG-b-(PELG50-g-PLL3) complex groups were collected after eight weeks, and results were expressed as mean ± SD. A significant increase from the sham group, a significant decrease from the DN (Exenatide-PEG-b-(PELG50-g-PLL3)) group, and a significant decrease from the DN groups is denoted by *P<0.01, **P<0.01, and ***P<0.01, respectively. |
Assessment of mitigating ACR on DN
The mitigating ACR was measured after eight weeks (Figure 13), and was higher in the DN group than in the sham group (P<0.01; mitigating ACR: sham group 0.03±0.003 mg/μmol, DN group 0.19±0.003). Administration of exenatide decreased the mitigating ACR (0.16±0.007), compared with the mitigating ACR in the DN group (P<0.01). Administration of exenatide–PEG-b-(PELG50-g-PLL3) remarkably decreased the mitigating ACR (0.13±0.004), which was markedly lower than in the DN group (P<0.01).
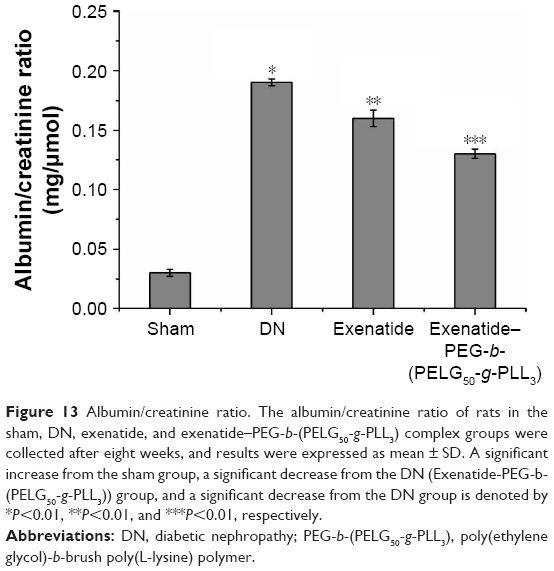 | Figure 13 Albumin/creatinine ratio. The albumin/creatinine ratio of rats in the sham, DN, exenatide, and exenatide–PEG-b-(PELG50-g-PLL3) complex groups were collected after eight weeks, and results were expressed as mean ± SD. A significant increase from the sham group, a significant decrease from the DN (Exenatide-PEG-b-(PELG50-g-PLL3)) group, and a significant decrease from the DN group is denoted by *P<0.01, **P<0.01, and ***P<0.01, respectively. |
Assessment of apoptotic cell ratio
The apoptotic cell ratio was detected using flow cytometry, using techniques that were previously reported,27 and was measured after eight weeks (Figure 14). The apoptotic cell ratio in the DN group was higher than in the sham group (P<0.01). Administration of exenatide decreased the apoptotic cell ratio, compared with that in the DN group (P<0.01). Administration of exenatide–PEG-b-(PELG50-g-PLL3) remarkably decreased the apoptotic cell ratio, which was markedly lower than in the DN group (P<0.01).
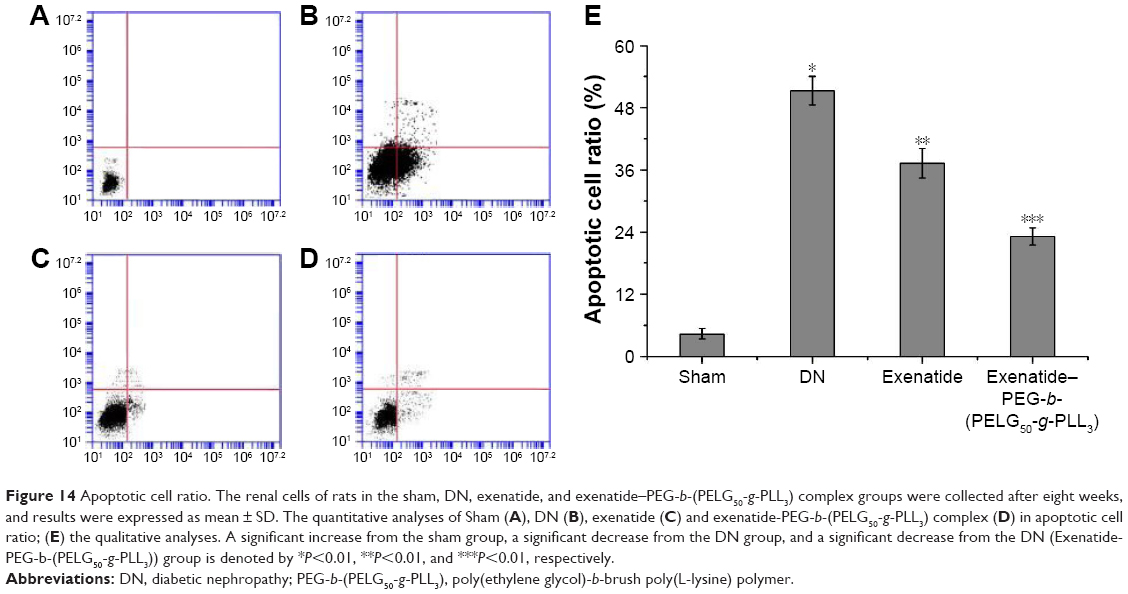 | Figure 14 Apoptotic cell ratio. The renal cells of rats in the sham, DN, exenatide, and exenatide–PEG-b-(PELG50-g-PLL3) complex groups were collected after eight weeks, and results were expressed as mean ± SD. The quantitative analyses of Sham (A), DN (B), exenatide (C) and exenatide-PEG-b-(PELG50-g-PLL3) complex (D) in apoptotic cell ratio; (E) the qualitative analyses. A significant increase from the sham group, a significant decrease from the DN group, and a significant decrease from the DN (Exenatide-PEG-b-(PELG50-g-PLL3)) group is denoted by *P<0.01, **P<0.01, and ***P<0.01, respectively. |
Measurement of CTGF expression
The methodology to evaluate CTGF expression has been described previously.28 Briefly, renal tissue was homogenized in protein lysate buffer and resolved on polyacrylamide SDS gels, and then electrophoretically transferred to a polyvinylidene difluoride membrane. The membrane was blocked with 3% BSA, incubated with primary antibodies against active CTGF and, subsequently, with alkaline phosphatase-conjugated secondary antibodies that were developed using 5-b-romo-4-chloro-3-indolyl phosphate/nitroblue tetrazolium. The blot was stained with anti-β-actin antibody, and the level of protein was normalized with respect to β-actin and density; CTGF expression was measured after eight weeks (Figure 15), and was higher in the DN group than in the sham group (P<0.01). Administration of exenatide decreased CTGF expression, compared with CTGF expression in the DN group (P<0.01). Administration of exenatide–PEG-b-(PELG50-g-PLL3) remarkably decreased CTGF expression, which was markedly lower than that in the DN group (P<0.01).
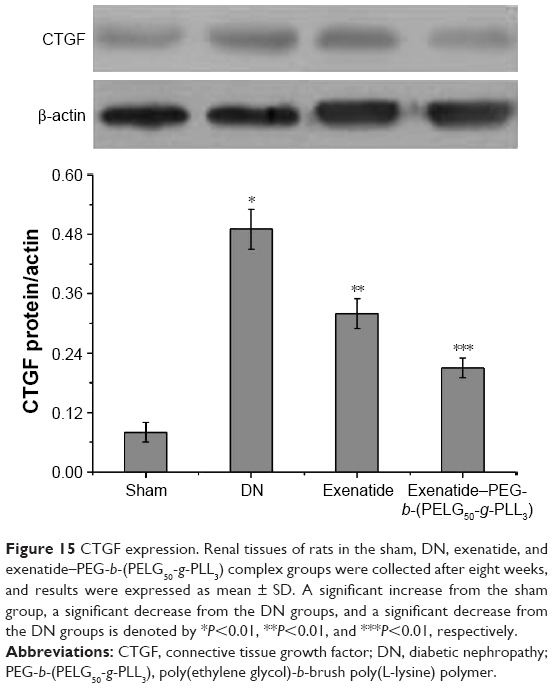 | Figure 15 CTGF expression. Renal tissues of rats in the sham, DN, exenatide, and exenatide–PEG-b-(PELG50-g-PLL3) complex groups were collected after eight weeks, and results were expressed as mean ± SD. A significant increase from the sham group, a significant decrease from the DN groups, and a significant decrease from the DN groups is denoted by *P<0.01, **P<0.01, and ***P<0.01, respectively. |
Discussion
We evaluated the role of exenatide and exenatide–PEG-b-(PELG50-g-PLL3) in the development and progression of DN. Exenatide and exenatide–PEG-b-(PELG50-g-PLL3) treatments heighten renal function and ameliorate metabolic anomalies, including reduction of body weight, FBG, FINS, TC, TG, LDL, HOMA-IR, ISI, and kidney weight/body weight, as well as increase HDL and UAER, and mitigate ACR. Exenatide and exenatide–PEG-b-(PELG50-g-PLL3) treatment, moreover, ameliorate oxidative stress injury and decrease renal cell apoptosis. Importantly, this research provides the first evidence that exenatide and exenatide–PEG-b-(PELG50-g-PLL3) treatments ameliorate the severity of DN with decreased CTGF expression.
This study reports a technique to increase both in vitro release and in vivo safety and efficacy of exenatide, administered as a subcutaneous abdominal injection, using encapsulation of a PEG-b-(PELG50-g-PLL3)–exenatide complex. In our previous work,22 we confirmed that PEG-b-(PELG50-g-PLL3) has been intensively used as a potential insulin nanocarrier, and the 1H-nuclear magnetic resonance (NMR) spectra and gel permeation chromatograms (GPCs) of PEG-b-(PELG50-g-PLL3) are shown in Figure S2, confirming that the synthesis proceeded in a controlled manner with successful synthesization. In addition, PEG-b-(PELG50-g-PLL3) and exenatide–PEG-b-(PELG50-g-PLL3) on EC9706 cells exhibited high cell viability at concentrations as high as 500 mg/L (Figure S2). In this regard, we choose PEG-b-(PELG50-g-PLL3) to load exenatide onto for sustained release of exenatide in order to maintain the effect of long-acting blood glucose suppression and alleviation of DN. Another PEG-b-(PELG50-g-PLL3) polymer acts as a nanocarrier and protects exenatide from quick degradation in rats; it can enhance efficacy as well as decrease dosage and frequency of injections. On the other hand, PEG-b-(PELG50-g-PLL3) can aggrandize the stability and bioactivity of exenatide in circulation.
Exenatide (a 39-amino acid polypeptide) is a natural dipeptidyl peptidase-IV resistant GLP-1 receptor agonist that shares 82% homology with human GLP-1 in the N-terminal segment.29,30 Many studies have shown that exenatide can lower hyperglycemia, suppress glucagon secretion, reduce energy intake and gastric motility, increase β-cell mass in type 2 diabetes, and alleviate DN.2,31–33 However, the plasma half-life of exenatide is very short and necessitates frequent injections that are a source of pain for patients.3 In this study, we found PEG-b-(PELG50-g-PLL3) to be a better sustained exenatide-release system.
Furthermore, CTGF is an important factor that modulates DN.34 CTGF is geared to the CCN protein family, which plays an important role in modulating synthesis of extracellular matrix.35,36 In patients with type 2 diabetes mellitus, a high serum CTGF content is closely correlated with mortality due to end-stage kidney disease secondary to DN.37 In addition, augmented CTGF expression on a biopsy specimen from patients at different stages of DN is associated with progression of DN.38 In this study, exenatide and exenatide–PEG-b-(PELG50-g-PLL3) treatment inhibit DN by decreasing CTGF expression.
To sum up, we find that PEG-b-(PELG50-g-PLL3) polymers can prolong the plasma concentration of exenatide in SD rats and enhance the plasma half-life of exenatide. In addition, PEG-b-(PELG50-g-PLL3) can sustain a comparatively low glucose level for up to 7 days, compared to free exenatide in type 2 diabetes, and significantly ameliorates DN.
Conclusion
We synthesized a PEG-b-(PELG50-g-PLL3) polymer that significantly enhances the bioactivity of exenatide. Administration of exenatide–PEG-b-(PELG50-g-PLL3) significantly promoted the plasma concentration of exenatide in SD rats, significantly prolonged blood glucose suppression, and alleviated DN.
Acknowledgments
The author appreciates the support from the Science and Technology Planning Project of Jiaxing (Fei Tong). The author greatly appreciates the editors and the three anonymous peer reviewers for their critical reading and insightful comments, which have improved this manuscript substantially. The sponsors of the study had no role in study design, data collection, data analysis, data interpretation, or manuscript writing.
Disclosure
The author reports no conflicts of interest in this work.
References
Abouzed TK, Munesue S, Harashima A, et al. Preventive effect of salicylate and pyridoxamine on diabetic nephropathy. J Diabetes Res. 2016;2016:1786789. | ||
Çavusoglu T, Erbas O, Karadeniz T, et al. Comparison of nephron-protective effects of enalapril and GLP analogues (exenatide) in diabetic nephropathy. Exp Clin Endocrinol Diabetes. 2014;122(6):327–333. | ||
Drucker DJ, Nauck MA. The incretin system: glucagon-like peptide-1 receptor agonists and dipeptidy1 peptidase-4 inhibitors in type 2 diabetes. Lancet. 2006;368(9548):1697–1705. | ||
Chaturvedi K, Ganguly K, Nadagouda MN, Aminabhavi TM. Polymeric hydrogels for oral insulin delivery. J Control Release. 2013;165(2):129–138. | ||
Wang J, Xu M, Cheng X, et al. Positive/negative surface charge of chitosan based nanogels and its potential influence on oral insulin delivery. Carbohydr Polym. 2016;136:867–874. | ||
Lee DY, Choe K, Jeong YJ, et al. Establishment of a controlled insulin delivery system using a glucose-responsive double-layered nanogel. RSC Adv. 2015;5:14482–14491. | ||
Mukhopadhyay P, Sarkar K, Bhattacharya S, Bhattacharyya A, Mishra R, Kundu PP. pH-sensitive N-succinyl chitosan grafted polyacrylamide hydrogel for oral insulin delivery. Carbohydr Polym. 2014;112: 627–637. | ||
Gao X, Cao Y, Song X, et al. Biodegradable, pH-responsive carboxymethyl cellulose/poly(acrylic acid) hydrogels for oral insulin delivery. Macromol Biosci. 2014;14(4):565–575. | ||
Gu Z, Dang TT, Ma M, et al. Glucose-responsive microgels integrated with enzyme nanocapsules for closed-loop insulin delivery. ACS Nano. 2013;7(8):6758–6766. | ||
Mukhopadhyay P, Mishra R, Rana D, Kundu PP. Strategies for effective oral insulin delivery with modified chitosan nanoparticles: a review. Prog Polym Sci. 2012;37(11):1457–1475. | ||
Lim HP, Tey BT, Chan ES. Particle designs for the stabilization and controlled-delivery of protein drugs by biopolymers: a case study on insulin. J Control Release. 2014;186:11–21. | ||
Liu L, Zhou C, Xia X, Liu Y. Self-assembled lecithin/chitosan nanoparticles for oral insulin delivery: preparation and functional evaluation. Int J Nanomedicine. 2016;11:761–769. | ||
Fonte P, Araújo F, Silva C, et al. Polymer-based nanoparticles for oral insulin delivery: revisited approaches. Biotechnol Adv. 2015;33(6 Pt 3):1342–1354. | ||
Shan W, Zhu X, Liu M, et al. Overcoming the diffusion barrier of mucus and absorption barrier of epithelium by self-assembled nanoparticles for oral delivery of insulin. ACS Nano. 2015;9(3):2345–2356. | ||
Zhang Y, Du X, Zhang Y, et al. Thiolated eudragit-based nanoparticles for oral insulin delivery: preparation, characterization, and evaluation using intestinal epithelial cells in vitro. Macromol Biosci. 2014;14(6):842–852. | ||
Li X, Guo S, Zhu C, et al. Intestinal mucosa permeability following oral insulin delivery using core shell corona nanolipoparticles. Biomaterials. 2013;34(37):9678–9687. | ||
Yoshida K, Hasebe Y, Takahashi S, Sato K, Anzai J. Layer-by-layer deposited nano- and micro-assemblies for insulin delivery: a review. Mater Sci Eng C Mater Biol Appl. 2014;34:384–392. | ||
Nan F, Wu J, Qi F, Fan Q, Ma G, Ngai T. Preparation of uniform-sized colloidosomes based on chitosan-coated alginate particles and its application for oral insulin delivery. J Mater Chem B. 2014;2:7403–7409. | ||
Kim BS, Oh JM, Hyun H, et al. Insulin-loaded microcapsules for in vivo delivery. Mol Pharm. 2009;6(2):353–365. | ||
Cai Y, Wei L, Ma L, et al. Long-acting preparations of exenatide. Drug Des Devel Ther. 2013;7:963–970. | ||
Wang Y, Sun T, Zhang Y, et al. Exenatide loaded PLGA microspheres for long-acting antidiabetic therapy: preparation, characterization, pharmacokinetics and pharmacodynamics. RSCsc Adv. 2016;6:37452–37462. | ||
Tong F, Tang X, Li X, Xia W, Liu D. The effect of insulin-loaded linear poly(ethylene glycol)-brush-like poly(l-lysine) block copolymer on renal ischemia/reperfusion-induced lung injury through downregulating hypoxia-inducible factor. Int J Nanomedicine. 2016;11:1717–1730. | ||
Ding Y, Vaziri ND, Coulson R, Kamanna VS, Roh DD. Effects of stimulated hyperglycemia, insulin, and glucagon on endothelial nitric oxide synthase expression. Am J Physiol Endocrinol Metab. 2000;279(1):E11–E17. | ||
Song L, Zhi ZL, Pickup JC. Nanolayer encapsulation of insulin-chitosan complexes improves efficiency of oral insulin delivery. Int J Nanomedicine. 2014;9:2127–2136. | ||
Hu B, Wu Y, Liu J, et al. GSK-3beta inhibitor induces expression of Nrf2/TrxR2 signaling pathway to protect against renal ischemia/reperfusion injury in diabetic rats. Kidney Blood Press Res. 2016;41(6):937–946. | ||
Tong F, Luo L, Liu D. Effect of intervention in mast cell function before reperfusion on renal ischemia-reperfusion injury in rats. Kidney Blood Press Res. 2016;41(3):335–344. | ||
Rubio-Navarro A, Guerrero-Hue M, Martín-Fernandez B, et al. Phenotypic characterization of macrophages from rat kidney by flow cytometry. J Vis Exp. 2016;(116):e54599. | ||
Li F, Li L, Cheng M, et al. SHIP, a novel factor to ameliorate extracellular matrix accumulation via suppressing PI3K/Akt/CTGF signaling in diabetic kidney disease. Biochem Biophys Res Commun. 2017;482(4):1477–1483. | ||
Meier JJ, Nauck MA. Glucagon-like peptide 1(GLP-1) in biology and pathology. Diabetes Metab Res Rev. 2005;21(2):91–117. | ||
Eng J, Kleinman WA, Singh L, Singh G, Raufman JP. Isolation and characterization of exendin-4, an exendin-3 analogue, from Heloderma suspectum venom. Further evidence for an exendin receptor on dispersed acini from guinea pig pancreas. J Biol Chem. 1992;267(11):7402–7405. | ||
Szayna M, Doyle ME, Betkey JA, et al. Exendin-4 decelerates food intake, weight gain, and fat deposition in Zucker rats. Endocrinology. 2000;141(6):1936–1941. | ||
Tourrel C, Bailbe D, Lacorne M, Meile MJ, Kergoat M, Portha B. Persistent improvement of type 2 diabetes in the Goto-Kakizaki rat model by expansion of the beta-cell mass during the prediabetic period with glucagon-like peptide-1 or exendin-4. Diabetes. 2002;51(5):1443–1452. | ||
Liang NC, Bello NT, Moran TH. Additive feeding inhibitory and aversive effects of naltrexone and exendin-4 combinations. Int J Obes (Lond). 2013;37(2):272–278. | ||
Zheng Z, Guan M, Jia Y, et al. The coordinated roles of miR-26a and miR-30c in regulating TGFβ1-induced epithelial-to-mesenchymal transition in diabetic nephropathy. Sci Rep. 2016;6:37492. | ||
Mason RM. Connective tissue growth factor(CCN2), a pathogenic factor in diabetic nephropathy. What does it do? How does it do it? J Cell Commun Signal. 2009;3(2):95–104. | ||
Duisters RF, Tijsen AJ, Schroen B, et al. miR-133 and miR-30 regulate connective tissue growth factor: implications for a role of microRNAs in myocardial matrix remodeling. Circ Res. 2009;104(2):170–178. | ||
Ali SM, Khalifa H, Mostafa DK, El Sharkawy A. Suppression of connective tissue growth factor mediates the renoprotective effect of Sitagliptin rather than Pioglitazone in type 2 diabetes mellitus. Life Sci. 2016;153:180–187. | ||
Wahab NA, Schaefer L, Weston BS, et al. Glomerular expression of thrombospondin-1, transforming growth factor beta and connective tissue growth factor at different stages of diabetic nephropathy and their interdependent roles in mesangial response to diabetic stimuli. Diabetologia. 2005;48(12):2650–2660. |
Supplementary materials
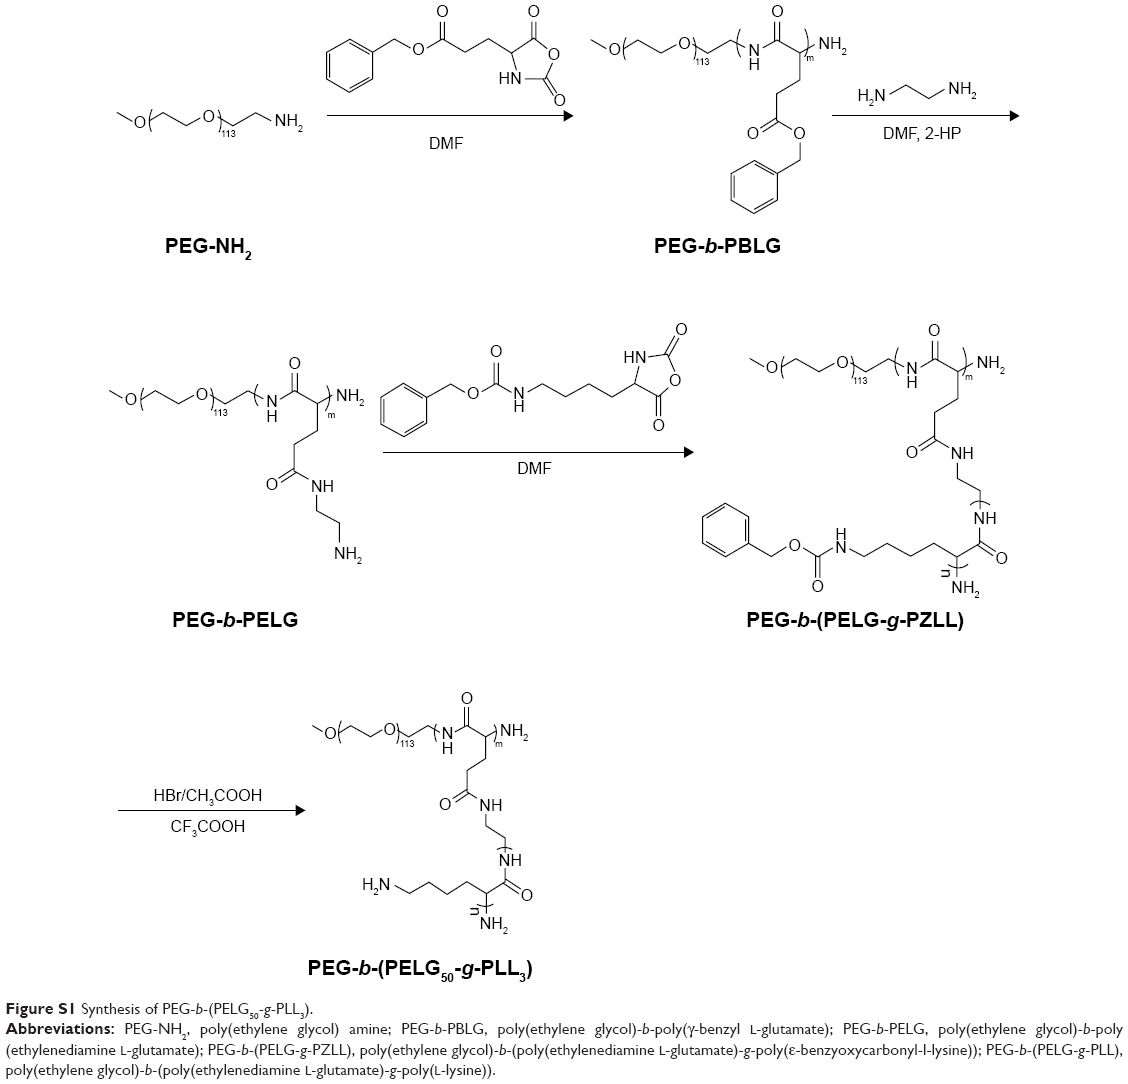 | Figure S1 Synthesis of PEG-b-(PELG50-g-PLL3). |
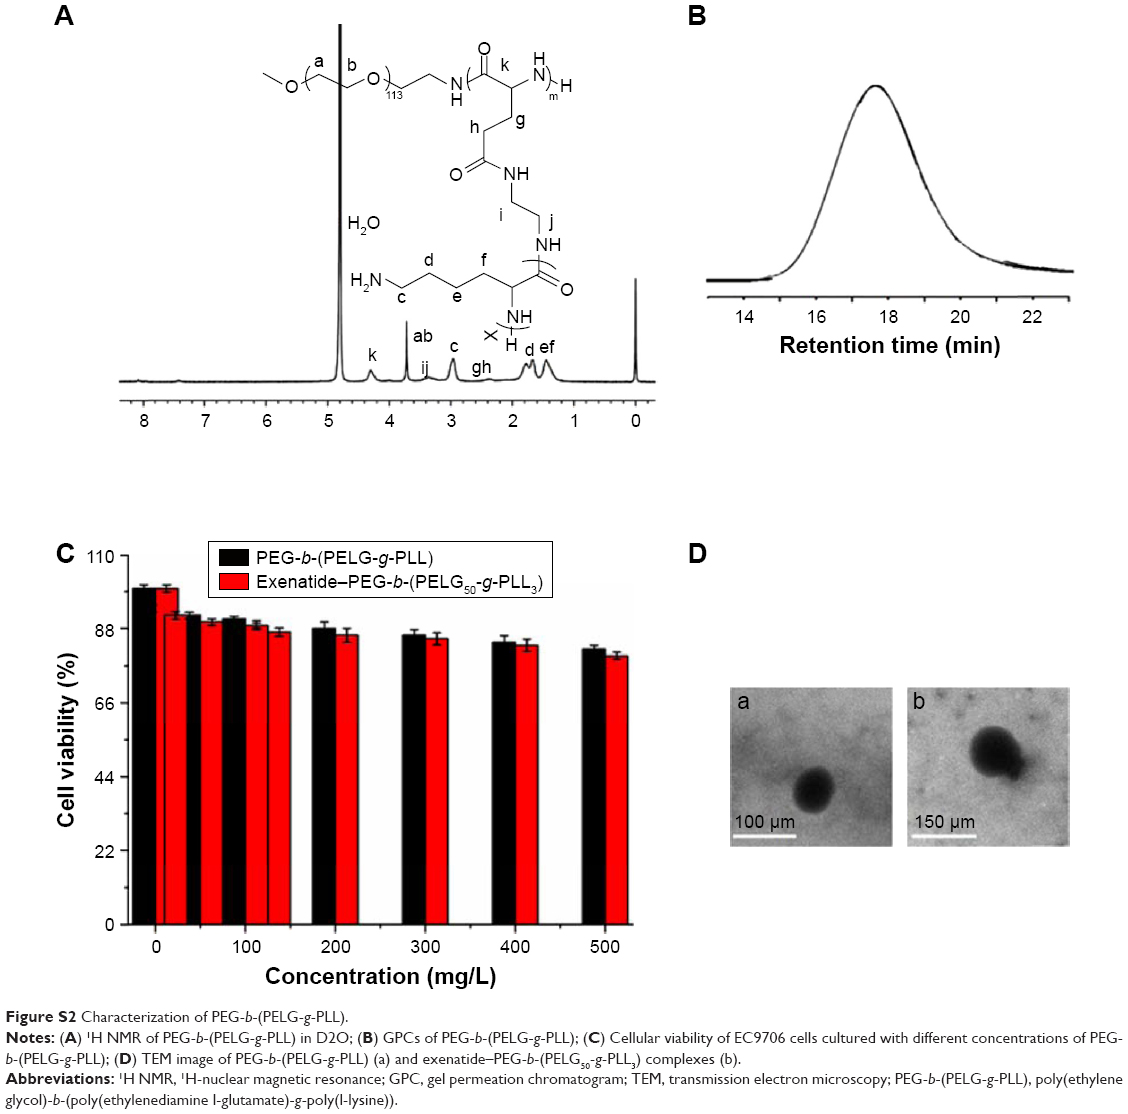 | Figure S2 Characterization of PEG-b-(PELG-g-PLL). |
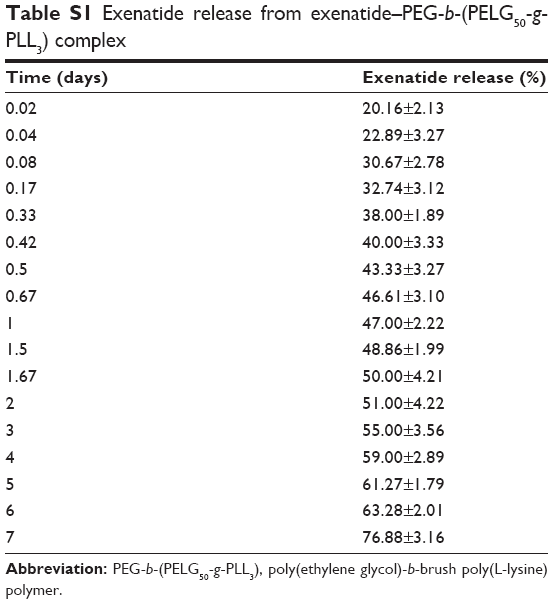 | Table S1 Exenatide release from exenatide–PEG-b-(PELG50-g-PLL3) complex |
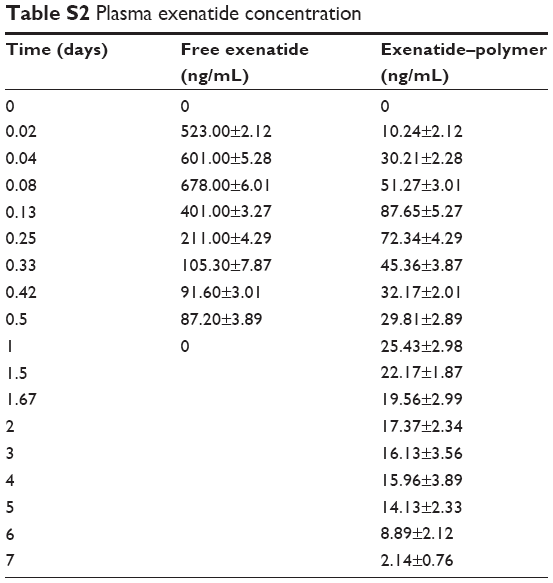 | Table S2 Plasma exenatide concentration |
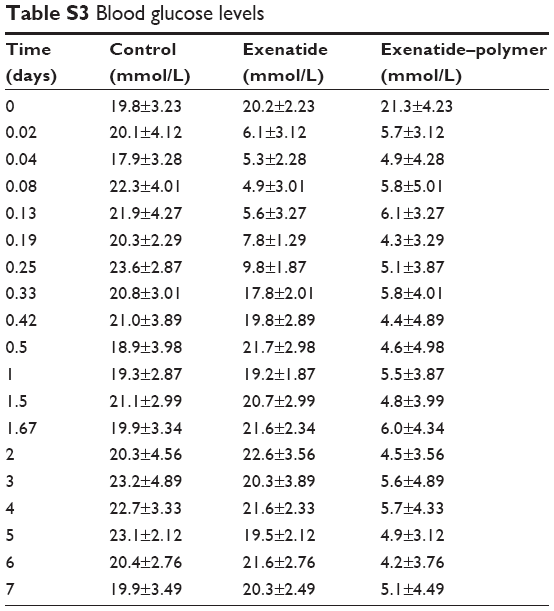 | Table S3 Blood glucose levels |
 © 2017 The Author(s). This work is published and licensed by Dove Medical Press Limited. The
full terms of this license are available at https://www.dovepress.com/terms
and incorporate the Creative Commons Attribution
- Non Commercial (unported, 3.0) License.
By accessing the work you hereby accept the Terms. Non-commercial uses of the work are permitted
without any further permission from Dove Medical Press Limited, provided the work is properly
attributed. For permission for commercial use of this work, please see paragraphs 4.2 and 5 of our Terms.
© 2017 The Author(s). This work is published and licensed by Dove Medical Press Limited. The
full terms of this license are available at https://www.dovepress.com/terms
and incorporate the Creative Commons Attribution
- Non Commercial (unported, 3.0) License.
By accessing the work you hereby accept the Terms. Non-commercial uses of the work are permitted
without any further permission from Dove Medical Press Limited, provided the work is properly
attributed. For permission for commercial use of this work, please see paragraphs 4.2 and 5 of our Terms.