Back to Journals » Drug Design, Development and Therapy » Volume 11
Preparation, characterization, and in vitro/vivo studies of oleanolic acid-loaded lactoferrin nanoparticles
Authors Xia X, Liu H, Lv H ![]() , Zhang J, Zhou JP, Zhao Z
, Zhang J, Zhou JP, Zhao Z
Received 5 February 2017
Accepted for publication 5 April 2017
Published 9 May 2017 Volume 2017:11 Pages 1417—1427
DOI https://doi.org/10.2147/DDDT.S133997
Checked for plagiarism Yes
Review by Single anonymous peer review
Peer reviewer comments 5
Editor who approved publication: Professor Jianbo Sun
Xiaojing Xia,1,2 Haowei Liu,1 Huixia Lv,1 Jing Zhang,1 Jianping Zhou,1 Zhiying Zhao3
1Department of Pharmaceutics, China Pharmaceutical University, Nanjing, 2Department of Pharmaceutics, ZheJiang Pharmaceutical College, Ningbo, 3Department of Traditional Chinese Medicine, China Pharmaceutical University, Nanjing, People’s Republic of China
Abstract: Oleanolic acid (OA), a pentacyclic triterpene, is used to safely and economically treat hepatopathy. However, OA, a Biopharmaceutics Classification System IV category drug, has low bioavailability owing to low solubility (<1 µg/mL) and biomembrane permeability. We developed a novel OA nanoparticle (OA-NP)-loaded lactoferrin (Lf) nanodelivery system with enhanced in vitro OA dissolution and improved oral absorption and bioavailability. The OA-NPs were prepared using NP albumin-bound technology and characterized using dynamic light scattering, scanning electron microscopy, X-ray powder diffraction, differential scanning calorimetry, and in vitro dissolution test. The in vivo pharmacokinetics was investigated in Sprague Dawley rats using liquid chromatography-tandem mass spectrometry. OA-NPs (OA:Lf =1:6, w/w%) exhibited spherical morphology, 202.2±8.3 nm particle size, +(27.1±0.32) mV ζ potential, 92.59%±3.24% encapsulation efficiency, and desirable in vitro release profiles. An effective in vivo bioavailability (340.59%) was achieved compared to the free drug following oral administration to rats. The Lf novel nanodelivery vehicle enhanced the dissolution rate, intestinal absorption, and bioavailability of OA. These results demonstrate that Lf NPs are a new strategy for improving oral absorption and bioavailability of poorly soluble and poorly absorbed drugs.
Keywords: oleanolic acid, nanoparticle, lactoferrin nanodelivery system, drug absorption, bioavailability
Introduction
Oleanolic acid (3β-hydroxyolean-12-en-28-oic acid; OA; Figure 1), a pentacyclic multifunctional triterpenoid, is widely distributed in the plant kingdom and frequently isolated as the free acid or aglycone of triterpenoid saponins.1,2 OA has promising pharmacologic activities including hepatoprotective,3 antioxidant,4 anti-inflammatory,5 antiviral, and antitumor effects.6,7 In particular, OA is known in the treatment of liver diseases with different etiologies.6 However, the clinical use of OA formulations is partly restricted by its poor solubility. According to the Biopharmaceutics Classification System (BCS),8 OA belongs to the BCS IV category owing to its low aqueous solubility (<1 μg/mL) and biomembrane permeability (Papp =1.1–1.3×10⁻⁶ cm/s).9,10 BCS IV category drugs are not well absorbed through the intestinal mucosa and are inclined to show wide intra- and intersubject modifiability.11 Therefore, the most popular marketed oral formulations of OA have low oral absorption and bioavailability.
 | Figure 1 Structure of oleanolic acid. |
Recently, numerous drug delivery enhancing methods have been investigated, including solid dispersion,12,13 hydroxypropyl-β-cyclodextrin and γ-cyclodextrin inclusion compound,14,15 liposomes,16 self-microemulsion,17 nanosuspensions,18 solid lipid nanoparticles, and nanoemulsions.19,20 Furthermore, additional studies on novel drug delivery systems for OA are still in progress.
Lactoferrin (Lf, isoelectric point =8.7) is a globular protein classified as an iron-binding member of the transferrin (Tf) family, which plays a driving role in iron absorption in the bowel, as well as in immune responses.21,22 In addition, it possesses antitumor, antioxidant, antiviral, and anti-inflammatory activities and regulates cellular growth.21,22 In particular, studies over the past decade have commonly reported that Lf acts as a ligand that modifies nanocarriers and crosses the blood–brain barrier via Lf receptor-mediated transcytosis.23,24 Furthermore, numerous studies have proven that Lf is a promising target for the treatment of brain diseases,25 as well as liver and lung tumors.26,27 In addition, Lf has numerous receptors and is relatively stable in the gastrointestinal tract.28 Furthermore, as a glycoprotein rich in cysteine, Lf also has a great propensity to form nanoparticles (NPs) using the NP albumin-bound technology (NAB).29 In previous studies, Tf was reported to have been successfully used for the oral delivery of insulin,30 doxorubicin, and paclitaxel.31,32 Lf has shown superior biocompatibility to Tf and has been investigated as a potential oral delivery vehicle because of its ability to enhance saturation solubility and intestinal absorption.29,33,34
Based on the observations mentioned above, we used Lf to design a new protein drug delivery system for oral administration of OA in the present study. The OA-Lf NPs (OA-NPs) were prepared using NAB technology and characterized by determining their particle size, polydispersity index (PDI), zeta potential (ZP), drug loading (DL) capacity, and entrapment efficiency (EE). Furthermore, scanning electron microscopy (SEM), X-ray powder diffraction (XRD), differential scanning calorimetry (DSC), and in vitro dissolution tests were carried out to evaluate the performance of the OA-NPs. Moreover, the in vivo pharmacokinetics was also investigated, and the potential underlying mechanism is illustrated in Figure 2.
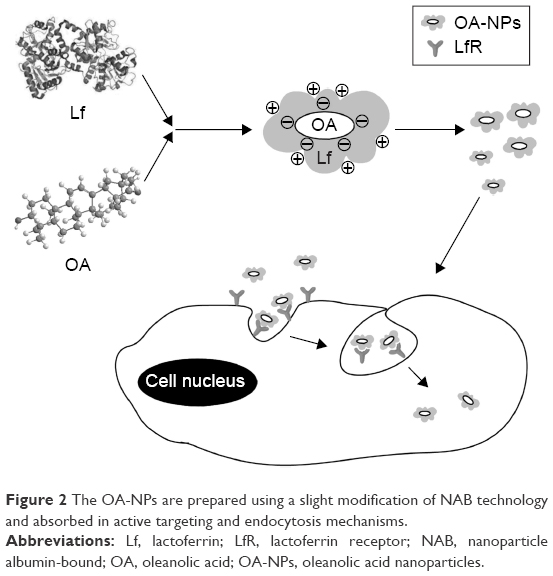 | Figure 2 The OA-NPs are prepared using a slight modification of NAB technology and absorbed in active targeting and endocytosis mechanisms. |
Materials and methods
Preparation of OA-NPs
The Lf NPs loaded into the OA (Zelang Co. Ltd, Nanjing, People’s Republic of China) were prepared using a slight modification of the NAB technology.29,35,36 Briefly, OA (0.2 g) was dissolved in 20 mL of a 7:3 solution of methylene dichloride and absolute ethyl alcohol at 60°C. Lf (Tianchun Technology Co. Ltd, Nanjing, People’s Republic of China) (0.2, 0.6, 1.2, and 1.8 g) was suspended in the required amount of water to obtain a concentration of 0.8% w/w and sonicated for 30 min for homogenous dissolution. The pH of the Lf solution was adjusted to 4.0 using a 10% citric acid (Qingxi Chemical Technology Co. Ltd, Shanghai, People’s Republic of China) solution. The OA solution was cooled to 25°C and then slowly added to the Lf solution. The mixture was slowly stirred at 200 rpm for 5 min to form a crude emulsion, which was obtained using AH110D high-pressure homogenizer (ATS Engineering Inc., Shanghai, People’s Republic of China) with three cycles at 50 MPa. The dispersion was transferred to a round-bottomed flask, and the ethyl alcohol was rapidly removed at 45°C under reduced pressure using R206D rotary evaporator (SENCO Technology Co. Ltd, Shanghai, People’s Republic of China). The obtained dispersion was filtered through a 0.45 μm pore size Millipore membrane and subsequently lyophilized in FD-2 freeze-drying system (Labconco, Kansas City, MO, USA) for 48 h without adding any cryoprotectant.
Characterization of OA-NPs
Particle size and ZP analysis
The mean particle size, PDI, and ZP of the OA-NPs were determined after lyophilization using dynamic light scattering with ZS90 Zetasizer Nano system (Malvern Instruments, Malvern, UK). The freeze-dried samples were suspended in deionized water and sonicated for 3 min before measurements, which were performed in triplicate.
OA-loading capacity and EE
An OA-NP sample was dissolved in water completely; the solution was filtered through a 0.22 μm pore size Millipore membrane, and the OA concentration was measured using high-performance liquid chromatography (HPLC). The percentage DL and EE were calculated using the following equations:
|
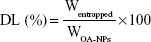
|
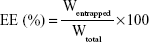
where Wentrapped is the weight of OA entrapped in the OA-NPs, while WOA-NPs and Wtotal are the weight of OA-NPs and the total OA entrapped in the NPs initially, respectively.
Considering the extremely low solubility of free OA, the amount of free OA in the NP solution was not taken into account.
The supernatant concentrations of OA were analyzed using Agilent 1200 HPLC system (Agilent Technologies, Santa Clara, CA, USA) with a variable wavelength detector absorbance detector and a Gemini C18 column (250×4.6 mm, 5 μm; Phenomenex, Torrance, CA, USA) operated at 25°C. The mobile phase contained a mixture of methanol, water, and phosphoric acid at a ratio of 95:5:0.01 (v/v/v) and a flow rate of 1.0 mL/min. The detection wavelength was 210 nm.12 The analysis was performed by injecting 20 μL samples, and the standard curve was linear over a concentration range of 10–60 mg/L (correlation coefficient, R2>0.9999). The coefficients of variation (relative standard deviation) for the intra- and interday variation were <2% (n=5).
SEM analysis
After gold coating the OA-NP samples using JFC-1600 auto fine coater (JEOL, Tokyo, Japan) for 3 min under vacuum, their surface morphology was characterized using JSM-5900 scanning electron microscope (JEOL) at 18–300,000× magnification for imaging.
XRD analysis
The elemental surface compositions of selected OA samples were determined using a D8 Advance X-ray diffractometer system (Bruker, Karlsruhe, Germany) with a Cu anode (λ=1.5406°A). The 2θ range scanned was 3°–40° and the step size was 0.02. All the spectra were recorded over a range of binding energy of 0–1,400 eV, while the source tube was run at 40 kV and 40 mA.
DSC analysis
Thermal analysis of pure OA, Lf, the physical mixture of OA and Lf, and the OA-NPs was performed using the NETZSCH DSC 204 system (NETZSCH Geraetebau GmbH, Bavaria, Germany). Accurately weighed samples (3.0–4.0 mg) were placed in pin-holed aluminum pans, which were sealed and heated from 40°C to 350°C at a heating rate of 10°C/min under a nitrogen purge.
In vitro dissolution of OA-NPs
The powder dissolution study was performed using RC8MD paddle dissolution apparatus (Tianjin University Co., Ltd, Tianjin, People’s Republic of China). Samples containing equivalent amounts (20 mg) of OA were each added to 900 mL water with 0.5% (w/v) sodium dodecyl sulfate at 37.0°C±0.5°C and the paddle rotating speed was set to 100 rpm.35 At appropriate time intervals (5, 10, 20, 30, 45, 60, and 120 min), 5 mL samples of the dissolution medium were withdrawn and replaced with equals volume of fresh medium. The dissolution medium OA content was determined using HPLC as described in the preceding section, after filtration using a 0.45 μm membrane.
In vivo pharmacokinetic study of OA-NPs
Male Sprague Dawley rats weighing 200–220 g were purchased from Slack Shanghai Laboratory Animal Co. Ltd (Shanghai, People’s Republic of China). All animal experimental procedures were approved by the Institutional Animal Care and Use Committee of Chinese Nanjing Bioscikin Co. Ltd, which followed The Guide for the Care and Use of Laboratory Animals published by the National Academies Press of United States. Male Sprague Dawley rats were housed under standard laboratory conditions, granted free access to standard rodent diet and water, and fasted 12 h prior to drug dosing. The rats were randomized into two groups of six rats each. After fasting, free OA and the OA-NPs formulations (OA:Lf, 1:6) were administered to groups 1 and 2, respectively, at an OA equivalent dose of 10.0 mg/kg by gastric gavage.
Then, blood samples (0.4 mL) were withdrawn at 0.17, 0.33, 0.5, 0.75, 1, 2, 4, 6, 8, 10, and 24 h post-dosing, immediately transferred to heparinized Eppendorf tubes, centrifuged at 4,000 rpm for 5 min, and the plasma was collected. Then, the separated blood samples were stored at −20°C until the pharmacokinetic analysis.
Plasma OA concentrations were determined using liquid chromatography-tandem mass spectrometry, as previously described.35 The pharmacokinetic parameters of all the rats were analyzed using the WinNonlin 5.2 software (Pharsight Corporation, Sunnyvale, CA, USA) according to the standard noncompartmental modal.
Statistical analysis
All parameters were expressed as the mean ± standard deviation (SD). The statistical comparisons between groups were performed using the Student’s t-test. P-values <0.05 were considered significant.
Results
Preparation of OA-NPs
The final prepared OA-NPs freeze-dried particle samples were plate shaped, loose, and not collapsing. The results of the average particle size, PDI, and ZP determination of the NPs after resuspension are summarized in Table 1. The effects of other factors, including the pH value of the Lf solution as well as the duration and power used for the high-pressure homogenization, are shown in Figure 3, while the optimized results are shown in Figure 4. As seen in Table 1, an increase in the proportion of Lf produced samples with particle sizes that were very similar and almost invariable (about 200 nm), with a narrow size distribution range (PDI ~0.150). Furthermore, the ZP value increased gradually, but tended to stabilize eventually. When the ratio of OA and Lf was 1:6, the mean particle size showed a minimum value, the ZP was most stable with the highest point value, the EE attained a maximum value, and the DL value was very close to that of the theoretical standard. As seen in Figure 3, the ZP value was mainly influenced by the pH of the Lf solution. When the pH was ≤4.0, the ZP was >25 mV, indicating that this condition benefited and stabilized the NP system. The duration and power of the high-pressure homogenization can have obvious effects on the mean particle size, and our results indicate that the particle size was ~200 nm and hardly changed when the duration and power were >3 cycles and 50 MPa, respectively.
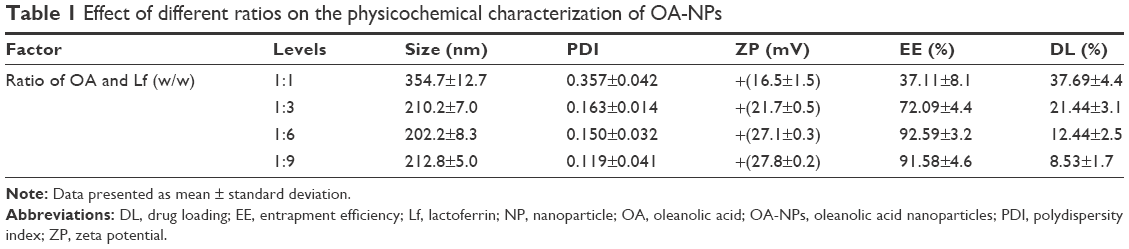 | Table 1 Effect of different ratios on the physicochemical characterization of OA-NPs |
 | Figure 3 Parameters of homogenization affect physicochemical characterization of OA-NPs. |
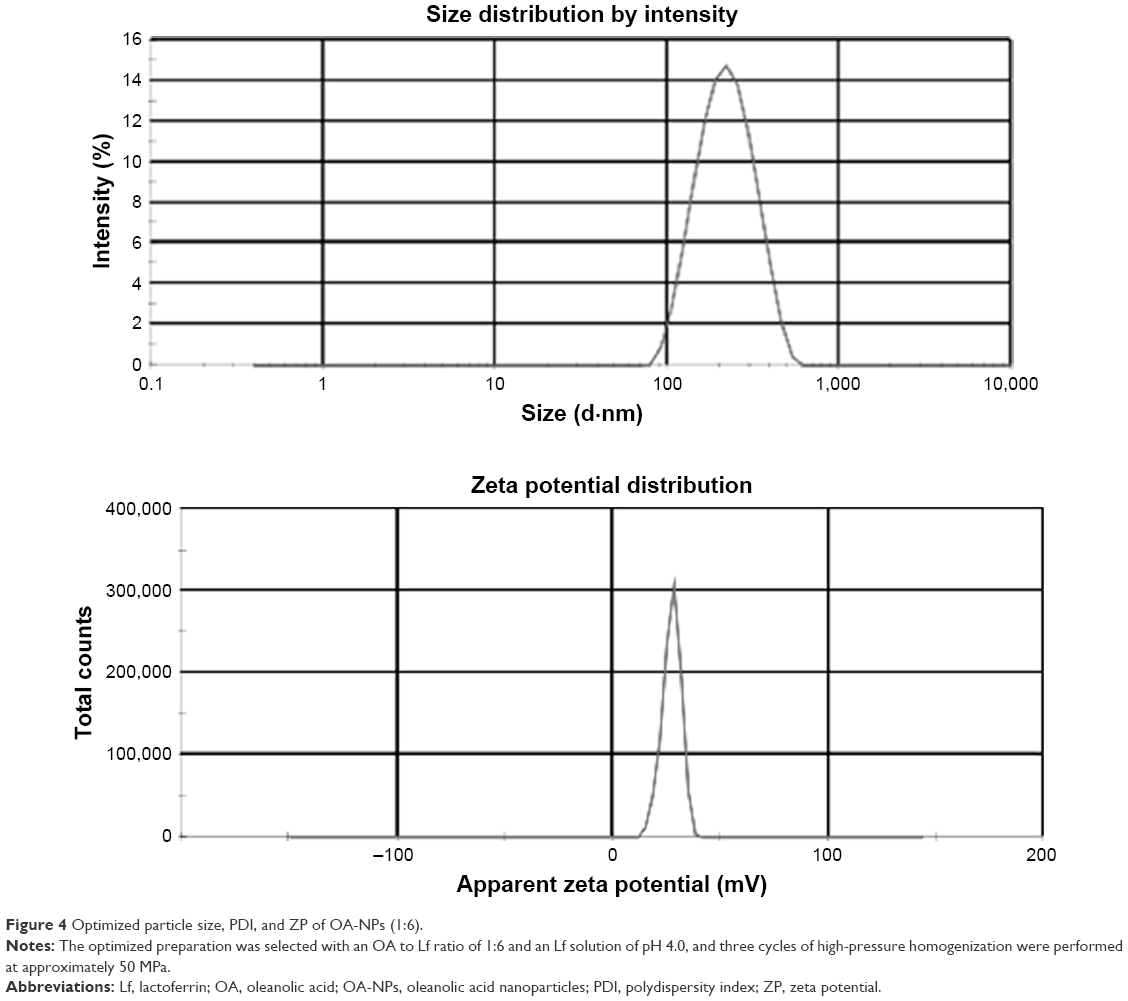 | Figure 4 Optimized particle size, PDI, and ZP of OA-NPs (1:6). |
The optimized preparation (Figure 4) was ultimately selected with an OA to Lf ratio of 1:6, Lf solution of pH 4.0, and three cycles of high-pressure homogenization performed at ~50 MPa. These conditions produced an NP formulation with a minimum mean particle size of 202.2±8.3 nm and a stable performance with an ZP value of +(27.1±0.32) mV, as well as the highest percentage EE and DL (92.59%±3.24% and 12.44%±2.52%, respectively).
SEM analysis
The images of the SEM analysis are shown in Figure 5. The images in Figure 5A1 and A2 show the particles present in the original OA, which had a rod-like crystal structure and clustered agglomerates, while the macromolecular Lf exhibited a layered structure (Figure 5B1 and B2). When the ratio of OA to Lf was 1:1 (Figure 5C2), some changes were observed, including in the structure of the OA-NPs, which gradually transformed from the rod-like crystals to a spherical morphology. Increasing the content of Lf created spherical OA NPs, which were more uniformly distributed in the Lf layers. Furthermore, at an OA to Lf ratio higher than 1:6, the OA-NPs were continuously coated with much thicker Lf layers. The nanospheres were completely embedded in the Lf layers and encapsulated by the Lf membrane.
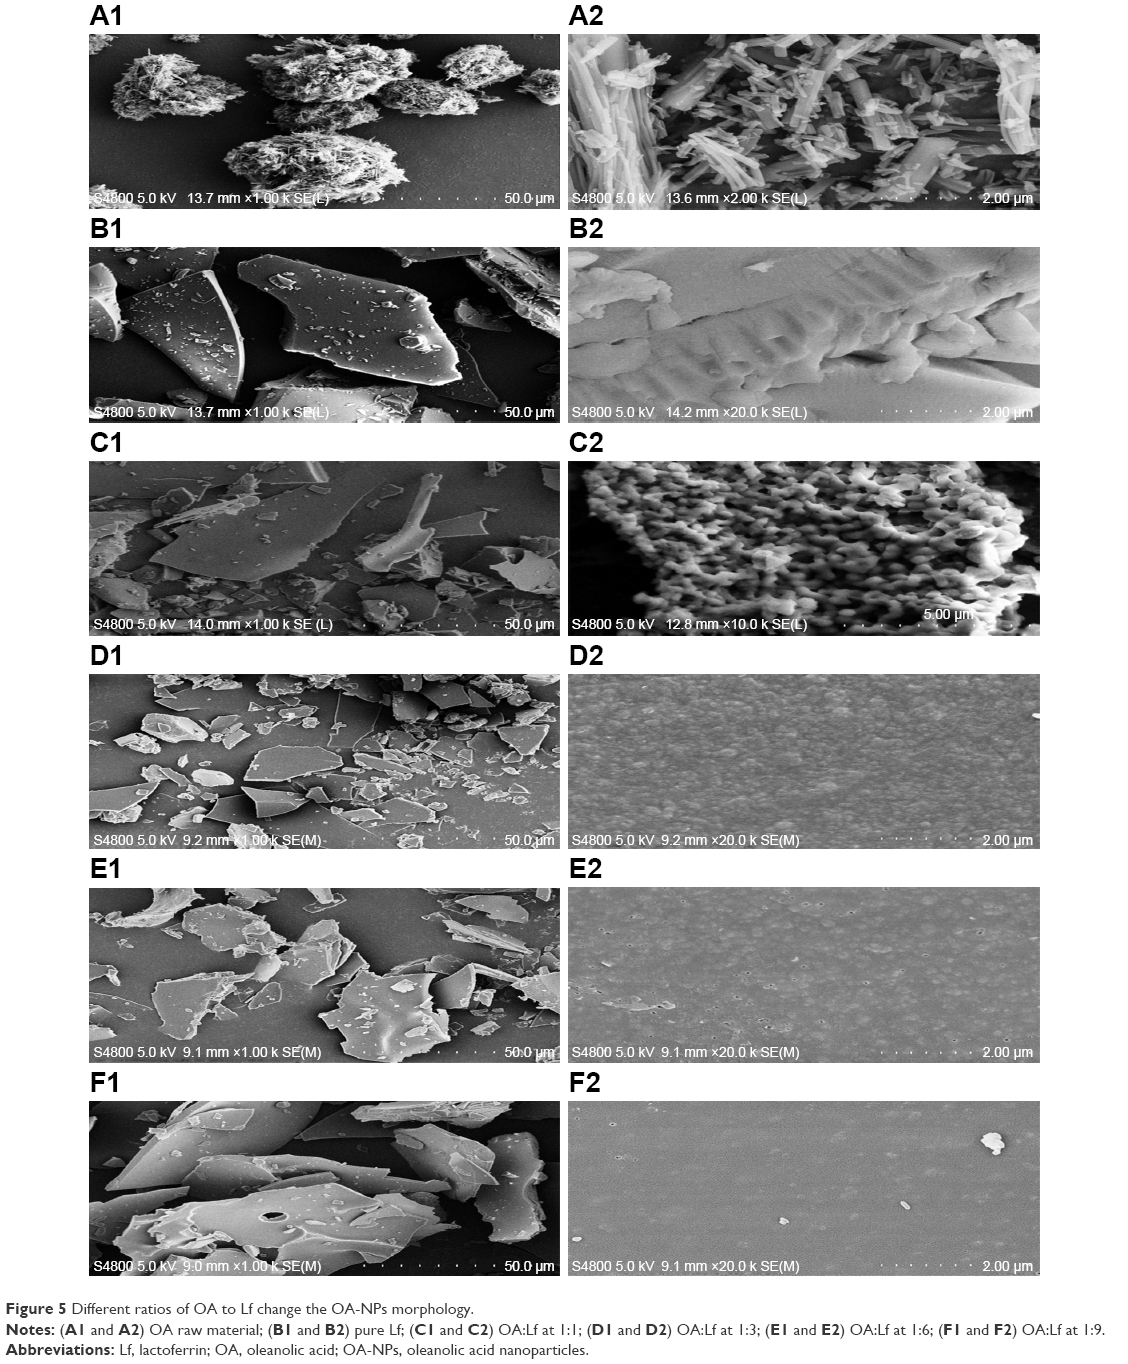 | Figure 5 Different ratios of OA to Lf change the OA-NPs morphology. |
XRD analysis
The XRD powder diffractograms are shown in Figure 6, and the OA (Figure 6A) displayed several intensive diffraction peaks, which reflected its characteristic crystalline structure. The Lf sample revealed no characteristic diffraction peaks due to its amorphous state. The XRD powder diffractograms also revealed the weak peak of OA:Lf at 1:1 and 1:3 (Figure 6B and C), which might indicate that the OA was not fully shielded by the protein. The intensive characteristic diffraction peaks decreased with an increasing Lf ratio. However, when the ratio of OA to Lf was ≥1:6 (Figure 6D and E), the characteristic peaks of the crystalline OA completely faded. This result provided evidence supporting the notion that the OA was thoroughly dispersed in the NP formulations in a molecular or amorphous state.
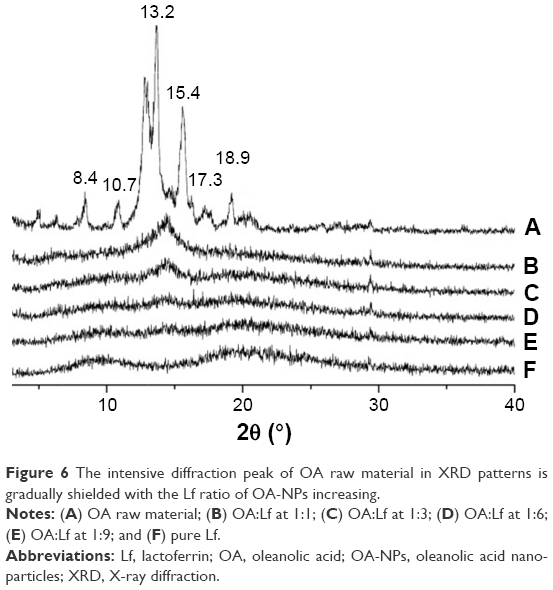 | Figure 6 The intensive diffraction peak of OA raw material in XRD patterns is gradually shielded with the Lf ratio of OA-NPs increasing. |
DSC analysis
Thermal analysis has been reported to be a powerful analytical tool for characterizing crystallinity. For instance, Figure 7A reveals an exothermic peak at 192.3°C and a sharp endothermic peak at 309.9°C in the DSC profile, which denoted a crystal peak and the melting point of pure OA, respectively. However, a comparison of the images of samples with OA:Lf ratios at 1:1 and 1:3 (Figure 7B and C) revealed that the intensity of the melting and crystal peaks decreased gradually with an increasing proportion of Lf. In addition, the endothermic peaks of the melting point of the OA-NPs (1:1 and 1:3) were distinctly shifted to 291.6°C and 285.4°C, respectively, which may be attributed to a close interaction between OA and Lf. Furthermore, the thermograms of the OA-NPs at ratios of 1:6 and 1:9 (Figure 7D and E), revealed that the DSC curves were similar in shape to that of the pure Lf. The crystal and melting peaks were absent, suggesting that OA was in a disordered crystalline form in NPs. The DSC analysis was consistent with the XRD.
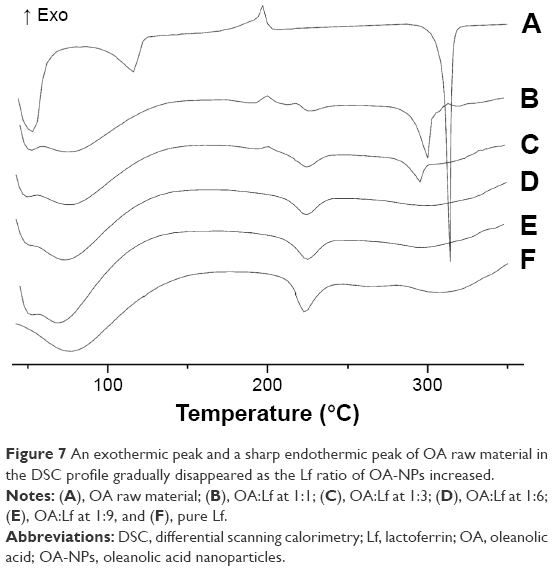 | Figure 7 An exothermic peak and a sharp endothermic peak of OA raw material in the DSC profile gradually disappeared as the Lf ratio of OA-NPs increased. |
In vitro dissolution study
The in vitro dissolution profiles of the different samples are illustrated in Figure 8. The free OA exhibited a low release behavior. The percentage of OA that dissolved was <30% in first 10 min, and this reached ~40% at 20 min. The release profiles of the OA-NPs (1:1) were slightly higher than those of OA in the initial 10 and 20 min and attained 65% and 80% release, respectively. The release of the OA-NPs with a 1:6 ratio was significantly faster than that of the other formulations, with >90% of OA being released from the NPs within 10 min while the maximum (97.31%±2.04%) was achieved after 20 min.
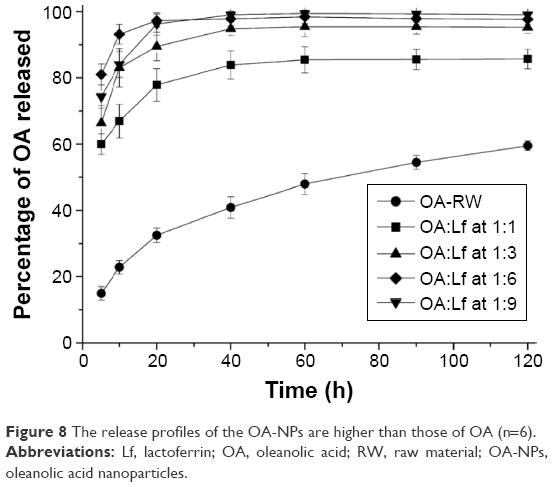 | Figure 8 The release profiles of the OA-NPs are higher than those of OA (n=6). |
In vivo pharmacokinetic study
The oral absorption of the OA-NPs (1:6) was evaluated and compared with that of the standard unformulated OA. Figure 9 shows the plasma concentration–time profiles of the OA-NP formulations assessed in this study, while the related pharmacokinetic parameters are summarized in Table 2.
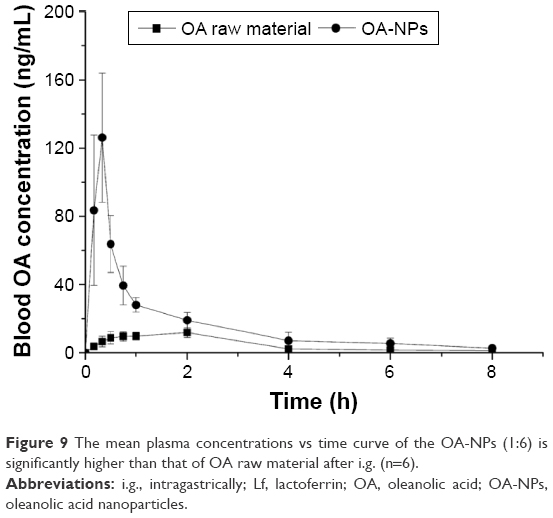 | Figure 9 The mean plasma concentrations vs time curve of the OA-NPs (1:6) is significantly higher than that of OA raw material after i.g. (n=6). |
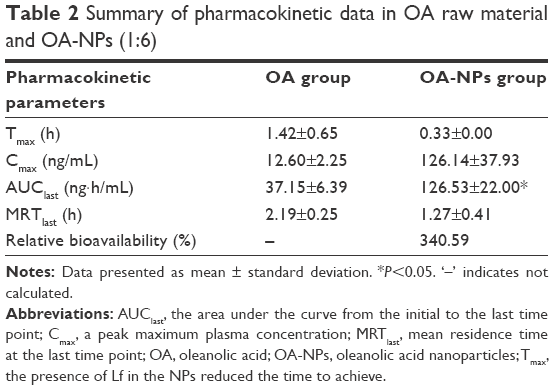 | Table 2 Summary of pharmacokinetic data in OA raw material and OA-NPs (1:6) |
As shown in Figure 9, the mean plasma concentrations of the OA-NPs at various time points were considerably higher than those of the standard OA were. A comparison of the plasma concentration–time profiles of the OA-NPs revealed that the addition of Lf effectively induced an initial boost of the OA concentration in the plasma, with a peak maximum plasma concentration (Cmax) of 126.14±37.93 ng/mL within 0.33 h. Furthermore, the area under the curve from the initial to the last time point (AUClast) was extended from 37.15 to 126.53 ng·h/mL. Finally, the effective bioavailability of OA-NPs (1:6) was improved by 340.59% (Table 2).
Discussion
This study of the developed OA-loaded Lf NPs mainly focused on three aspects, which were the physical characterization and analysis of the drug dissolution properties as well as the in vivo pharmacokinetic parameters.
Preparation and characterization of OA-NPs
The NAB technique has enabled expansion of the clinical use of numerous chemotherapeutics. NAB-paclitaxel (Abraxane®; Celgene Corp., Davis, CA, USA) was approved by the US Food and Drug Administration in 2005 and has been clinically used for the treatment of metastatic breast cancer.37,38 Furthermore, techniques used to produce nanoscale particles can be categorized into top-down and bottom-up methods. Compared to traditional methods such as milling, high-pressure homogenization is relatively simple and easily generates a product with a particle size that is sufficiently uniformly distributed within the required range. Furthermore, the top-down method has a better chance of avoiding the problems of residual solvent and particle growth to microcrystals associated with the bottom-up methods.39–42 In principle, the mean diameter and PDI are usually the most accepted defining characteristics of NP-based medicines because the particle size dramatically affects the in vitro release, in vivo bioavailability, and safety of drugs.43 Based on the factors mentioned above, the OA-NPs with Lf as the delivery system were prepared for oral administration using NAB technology with high-pressure homogenization method.
As indicated in Table 1 and Figure 3, the ratio of OA to Lf had a considerable effect on the mean particle size, ZP, EE, and DL. The ZP, which indicated the stability of the nanosystem, was particularly influenced by the pH of the Lf solution. Furthermore, the duration and power of homogenization were also considered as possible factors affecting the stability of the system. In summary, the results of the preparation and characterization of the OA-NPs revealed that the optimum formulation showing a suitable particle size, acceptable PDI, and stable ZP, as well as the highest EE and DL was achieved using a 1:6 ratio of OA to Lf, pH of 4.0, and homogenization performed thrice at a pressure of ~7,500 psi. The SEM images showed that OA-NPs were successfully prepared with regular and smooth spherical particle morphology. The results of the DSC and XRD analysis showed that OA was present in a highly dispersed molecular or amorphous state in the NP formulations.
Moreover, the SEM results of the standard OA samples prepared using the same method were also considered and compared with those of the test formulation. The images showed that the OA still possessed a rod-like crystal structure (data not shown). This strongly suggested that Lf altered the structures of the drug in the formulation or there was an interaction between OA and Lf, which may not be attributable to the preparation method.
Drug dissolution properties
The in vitro dissolution study revealed that the NPs with the same content of OA showed a rapid drug release with an increase in the proportion of Lf. Approximately >90% of OA in the NP formulations (1:6) dissolved in 10 min and ~100% dissolution was attained in 20 min. These results could be attributed to the presence of Lf, which is a highly dispersed material with an enormous surface area. Moreover, the high degree of dispersity of OA and the interaction between OA and Lf decreased the drug surface tension, thereby producing NPs with good wettability. This property further improved the water solubility of the poorly soluble drug.
Notably, within 5–20 min, the dissolution rate of OA-NP formulations at a ratio of 1:6 was ~10% higher than that of the formulation at a ratio of 1:9. This observation could be attributable to the hydrophobicity and interfacial tension of the intrinsic characteristics of excess Lf. These characteristics encouraged the formation of an elastic membrane at the oil–water interface that subsequently impeded the initial release of the drug.
In vivo pharmacokinetic study
The in vivo pharmacokinetic data obviously verified the oral absorption-enhancing effect of Lf. Oral administration of the OA-NPs resulted in an extremely rapid absorption of OA. As seen from Table 2, the presence of Lf in the NPs reduced the time to achieve (Tmax), mean residence time at the last time point (MRTlast), and increased the AUClast by 77, 42, and 71%, respectively, compared with the standard OA. Ultimately, OA-NPs rapidly dissolved and were readily absorbed in the gastrointestinal tract with an observed bioavailability of 340.59%. This suggests that the use of the Lf in this formulation not only considerably enhanced the dissolution rate of the NPs, but also provided an additional advantage of improving the bioavailability. This phenomenon may be attributed to the fact that Lf has a degree of antiproteolytic action in the gastrointestinal tract, and a large number of Lf receptors are present in the small intestine, which may further improve the function to promote the oral absorption of many hydrophobic drugs.28,44
The overall evaluation of the new formulation indicated that the use of Lf as a carrier had a positive impact on the absorption of this hydrophobic drug and rapidly enhanced the absorption of the drug in tandem with its own and, therefore, contributed to improving the in vivo bioavailability.
Conclusion
Based on the results of this study, a new type of OA-loaded Lf nanodelivery system has been successfully synthesized and characterized. The NPs (OA:Lf, 1:6) showed a spherical morphology, appropriate particle size, and stable ZP. Furthermore, OA was highly loaded in the Lf in an amorphous or molecular state. The OA-NPs were relatively stable and provided more flexibility in modulating the in vitro release. The results of the pharmacokinetic study confirmed that Lf performed adequately by enhancing the oral absorption and drug levels in the plasma. Therefore, this study demonstrated the feasibility of applying Lf as a potential nanocarrier to enhance the oral absorption and bioavailability of hydrophobic drugs.
Acknowledgments
This work was supported by the National Natural Science Foundation of China (No 81202929, 81673830) and the Ningbo Municipal Natural Science Foundation (No 2014A610203).
Authors’ contributions
Xiaojing Xia, Jianping Zhou, and Zhiying Zhao conceived the idea and designed the oleanolic acid-loaded lactoferrin nanoparticles. Xiajing Xia, Haowei Liu, and Jing Zhang prepared and characterized the oleanolic acid nanoparticles. Xiaojing Xia, Haowei Liu, Huixia Lv, and Jing Zhang performed the experiments in vitro and in vivo. Xiaojing Xia and Haowei Liu wrote the paper and all the authors commented on the manuscript. Xiaojing Xia, Jianping Zhou, and Zhiying Zhao supervised all the studies described in this article. All authors contributed toward data analysis, drafting and revising the paper and agreed to be accountable for all aspects of the work.
Disclosure
The authors report no conflicts of interest in this work.
References
Vasconcelos MA, Royo VA, Ferreira DS, et al. In vivo analgesic and anti-inflammatory activities of ursolic acid and oleanoic acid from Miconia albicans (Melastomataceae). Z Naturforsch C. 2006;61(7–8):477–482. | ||
Fukushima EO, Seki H, Ohyama K, et al. CYP716A subfamily members are multifunctional oxidases in triterpenoid biosynthesis. Plant Cell Physiol. 2011;52(12):2050–2061. | ||
Garcia-Risco MR, Vázquez E, Sheldon J, et al. Supercritical fluid extraction of heather (Calluna vulgaris) and evaluation of anti-hepatitis C virus activity of the extracts. Virus Res. 2015;198:9–14. | ||
Senthil S, Chandramohan G, Pugalendi KV. Isomers (oleanolic and ursolic acids) differ in their protective effect against isoproterenol-induced myocardial ischemia in rats. Int J Cardiol. 2011;119(1):131–133. | ||
Patel JJ, Acharya SR, Acharya NS. Clerodendrum serratum (L.) Moon. -a review on traditional uses, phytochemistry and pharmacological activities. J Ethnopharmacol. 2014;154(2):268–285. | ||
Zhao CH, Xu J, Zhang YQ, Zhao LX, Feng B. Inhibition of human enterovirus 71 replication by pentacyclic triterpenes and their novel synthetic derivatives. Chem Pharm Bull (Tokyo). 2014;62(8):764–771. | ||
Parikh NR, Mandal A, Bhatia D, Siveen KS, Sethi G, Bishayee A. Oleanane triterpenoids in the prevention and therapy of breast cancer: current evidence and future perspectives. Phytochem Rev. 2014;13(4):793–810. | ||
United States Food and Drug Administration (FDA). Guidance for Industry: Waiver of in vivo Bioavailability and Bioequivalence Studies for Immediate-Release Solid Oral Dosage Forms Based on a Biopharmaceutics Classification System. Rockville, MD: Food and Drug Administration, United States; 2000. | ||
Tong HH, Wu HB, Zheng Y, Xi J, Chow AH, Chan CK. Physical characterization of oleanolic acid nonsolvate and solvates prepared by solvent recrystallization. Int J Pharm. 2008;355(1–2):195–202. | ||
Jeong DW, Kim YH, Kim HH, et al. Dose-linear pharmacokinetics of oleanolic acid after intravenous and oral administration in rats. Biopharm Drug Dispos. 2007;28(2):51–57. | ||
De Sousa I, Bernkop-Schnürch A. Pre-systemic metabolism of orally administered drugs and strategies to overcome it. J Control Release. 2014;192(7):301–309. | ||
Liu L, Wang X. Improved dissolution of oleanolic acid with ternary solid dispersions. AAPS PharmSciTech. 2007;8(4):267–271. | ||
Li Y, Liu H, Guo B, et al. Enhancement of dissolution rate and oral bioavailability in beagle dogs of oleanolic acid by adsorbing onto porous silica using supercritical carbon dioxide. J Drug Deliv Sci Tec. 2014;24(4):380–385. | ||
Quan P, Liu D, Li R, et al. The effects of water-soluble polymers on hydroxypropyl-β-cyclodextrin solubilization of oleanolic acid and ursolic acid. J Incl Phenom Macrocycl Chem. 2009;63(1):181–188. | ||
Fontanay S, Kedzierewica F, Duval RE, Clarot I. Physicochemical and thermodynamic characterization of hydroxy pentacyclic triterpenoic acid/c-cyclodextrin inclusion complexes. J Incl Phenom Macrocycl Chem. 2012;73(1):341–347. | ||
Gao D, Tang S, Tong Q. Oleanolic acid liposomes with polyethylene glycol modification: promising antitumor drug delivery. Int J Nanomed. 2012;7:3517–3526. | ||
Yang R, Huang X, Dou J, Zhai G, Su L. Self-microemulsifying drug delivery system for improved oral bioavailability of oleanolic acid: design and evaluation. Int J Nanomed. 2013;8:2917–2926. | ||
Li W, Das S, Ng KY, Heng PW. Formulation, biological and pharmacokinetic studies of sucrose ester-stabilized nanosuspensions of oleanolic acid. Pharm Res. 2011;28(8):2020–2033. | ||
Wang JW, Tang HF, Shen M, Wan L, Fang KQ. Preparation and quality evaluation of oleanolic acid-loaded solid lipid nanoparticles. J Fourth Mil Med Univ. 2007;28(5):472–474. | ||
Alvarado HL, Abrego G, Souto EB, et al. Nanoemulsions for dermal controlled release of oleanolic and ursolic acids: in vitro, ex vivo and in vivo characterization. Colloids Surf B Biointerfaces. 2015;130:40–47. | ||
Iafisco M, Di Foggia M, Bonora S, Prat M, Roveri N. Adsorption and spectroscopic characterization of lactoferrin on hydroxyapatite nanocrystals. Dalton Trans. 2011;40(4):820–827. | ||
Wu QX, Zhang QL, Lin DQ, Yao SJ. Characterization of novel lactoferrin loaded capsules prepared with polyelectrolyte complexes. Int J Pharm. 2013;455(1–2):124–131. | ||
Livney YD. Milk proteins as vehicles for bioactives. Curr Opin Colloid Interface Sci. 2010;15(1–2):73–83. | ||
Rempe R, Cramer S, Qiao R, Galla HJ. Strategies to overcome the barrier: use of nanoparticles as carriers and modulators of barrier properties. Cell Tissue Res. 2014;355(3):717–726. | ||
De Luca MA, Lai F, Corrias F, et al. Lactoferrin- and antitransferrin-modified liposomes for brain targeting of the NK3 receptor agonist senktide: preparation and in vivo evaluation. Int J Pharm. 2015;479(1):129–137. | ||
Wei M, Guo X, Tu L, et al. Lactoferrin-modified PEGylated liposomes loaded with doxorubicin for targeting delivery to hepatocellular carcinoma. Int J Nanomed. 2015;10:5123–5137. | ||
Pandey V, Gajbhiye KR, Soni V. Lactoferrin-appended solid lipid nanoparticles of paclitaxel for effective management of bronchogenic carcinoma. Drug Deliv. 2015;22(2):199–205. | ||
Brines RD, Brock JH. The effect of trypsin and chymotrypsin on the in vitro antimicrobial and iron-binding properties of lactoferrin in human milk and bovine colostrum. Unusual resistance of human apolactoferrin to proteolytic digestion. Biochim Biophys Acta. 1983;759(3):229–235. | ||
Zhang ZH, Wang XP, Ayman WY, Munyendo WL, Lv HX, Zhou JP. Studies on lactoferrin nanoparticles of gambogic acid for oral delivery. Drug Deliv. 2013;20(2):86–93. | ||
Shofner JP, Phillips MA, Peppas NA. Cellular evaluation of synthesized insulin/transferrin bioconjugates for oral insulin delivery using intelligent complexation hydrogels. Macromol Biosci. 2010;10(3):299–306. | ||
Golla K, Reddy PS, Bhaskar C, Kondapi AK. Biocompatibility, absorption and safety of protein nanoparticle-based delivery of doxorubicin through oral administration in rats. Drug Deliv. 2013;20(3–4):156–167. | ||
Lu Y, Wang ZH, Li T, McNally H, Park K, Sturek M. Development and evaluation of transferrin-stabilized paclitaxel nanocrystal formulation. J Control Release. 2014;176(3):76–85. | ||
Fulgione A, Nocerino N, Iannaccone M, et al. Lactoferrin adsorbed onto biomimetic hydroxyapatite nanocrystals controlling – in vivo-the helicobacter pylori infection. PLoS One. 2016;11(7):e0158646. | ||
Kumar P, Lakshmi YS, Kondapi AK. Triple drug combination of zidovudine, efavirenz and lamivudine loaded lactoferrin nanoparticles: an effective nano first-line regimen for HIV therapy. Pharm Res. 2017;34(2):257–268. | ||
Xi J, Chang Q, Chan CK, et al. Formulation development and bioavailability evaluation of a self-nanoemulsified drug delivery system of oleanolic acid. AAPS PharmSciTech. 2009;10(1):172–182. | ||
Kim TH, Jiang HH, Youn YS, et al. Preparation and characterization of water-soluble albumin-bound curcumin nanoparticles with improved antitumor activity. Int J Pharm. 2011;403(1–2):285–291. | ||
Desai N, Trieu V, Yao Z, et al. Increased antitumor activity, intratumor paclitaxel concentrations, and endothelial cell transport of cremophor-free, albumin-bound paclitaxel, ABI-007, compared with cremophor-based paclitaxel. Clin Cancer Res. 2006;12(4):1317–1324. | ||
Morenoaspitia A, Perez EA. Nanoparticle albumin-bound paclitaxel (ABI-007): a newer taxane alternative in breast cancer. Future Oncol. 2005;1(6):755–762. | ||
Winkelmann M, Schuchmann HP. Precipitation of metal oxide nanoparticles using a miniemulsion technique. Particuology. 2011;9(5):502–505. | ||
Wacker M. Nanocarriers for intravenous injection – The long hard road to the market. Int J Pharm. 2013;457(1):50–62. | ||
Paredes AJ, Llabot JM, Sánchez Bruni S, et al. Self-dispersible nanocrystals of albendazole produced by high pressure homogenization and spray-drying. Drug Dev Ind Pharm. 2016;42(10):1564–1570. | ||
Keck CM, Müller RH. Drug nanocrystals of poorly soluble drugs produced by high pressure homogenization. Eur J Pharm Biopharm. 2006;62(1):3–16. | ||
Wei Y, Li L, Xi Y, Qian S, Gao Y, Zhang J. Sustained release and enhanced bioavailability of injectable scutellarin-loaded bovine serum albumin nanoparticles. Int J Pharm. 2014;476(1–2):142–148. | ||
Jiang R, Du X, Lönnerdal B. Comparison of bioactivities of talactoferrin and lactoferrins from human and bovine milk. J Pediatr Gastroenterol Nutr. 2014;59(5):642–652. |
 © 2017 The Author(s). This work is published and licensed by Dove Medical Press Limited. The
full terms of this license are available at https://www.dovepress.com/terms
and incorporate the Creative Commons Attribution
- Non Commercial (unported, 3.0) License.
By accessing the work you hereby accept the Terms. Non-commercial uses of the work are permitted
without any further permission from Dove Medical Press Limited, provided the work is properly
attributed. For permission for commercial use of this work, please see paragraphs 4.2 and 5 of our Terms.
© 2017 The Author(s). This work is published and licensed by Dove Medical Press Limited. The
full terms of this license are available at https://www.dovepress.com/terms
and incorporate the Creative Commons Attribution
- Non Commercial (unported, 3.0) License.
By accessing the work you hereby accept the Terms. Non-commercial uses of the work are permitted
without any further permission from Dove Medical Press Limited, provided the work is properly
attributed. For permission for commercial use of this work, please see paragraphs 4.2 and 5 of our Terms.