Back to Journals » Drug Design, Development and Therapy » Volume 10
Preparation and physicochemical characterization of spray-dried and jet-milled microparticles containing bosentan hydrate for dry powder inhalation aerosols
Authors Lee H, Kang J ![]() , Lee H
, Lee H ![]() , Kim D, Rhee Y, Kim J, Park E, Park C
, Kim D, Rhee Y, Kim J, Park E, Park C ![]()
Received 22 August 2016
Accepted for publication 8 November 2016
Published 13 December 2016 Volume 2016:10 Pages 4017—4030
DOI https://doi.org/10.2147/DDDT.S120356
Checked for plagiarism Yes
Review by Single anonymous peer review
Peer reviewer comments 3
Editor who approved publication: Professor Manfred Ogris
Hyo-Jung Lee,1 Ji-Hyun Kang,1 Hong-Goo Lee,1 Dong-Wook Kim,2 Yun-Seok Rhee,3 Ju-Young Kim,4 Eun-Seok Park,5 Chun-Woong Park1
1College of Pharmacy, Chungbuk National University, 2Department of Pharmaceutical Engineering, Cheongju University, Cheongju, 3College of Pharmacy and Research Institute of Pharmaceutical Sciences, Gyeongsang National University, Jinju, 4College of Pharmacy, Woosuk University, Wanju-gun, 5School of Pharmacy, Sungkyunkwan University, Suwon, Republic of Korea
Abstract: The objectives of this study were to prepare bosentan hydrate (BST) microparticles as dry powder inhalations (DPIs) via spray drying and jet milling under various parameters, to comprehensively characterize the physicochemical properties of the BST hydrate microparticles, and to evaluate the aerosol dispersion performance and dissolution behavior as DPIs. The BST microparticles were successfully prepared for DPIs by spray drying from feeding solution concentrations of 1%, 3%, and 5% (w/v) and by jet milling at grinding pressures of 2, 3, and 4 MPa. The physicochemical properties of the spray-dried (SD) and jet-milled (JM) microparticles were determined via scanning electron microscopy, atomic force microscopy, dynamic light scattering particle size analysis, Karl Fischer titration, surface analysis, pycnometry, differential scanning calorimetry, powder X-ray diffraction, and Fourier transform infrared spectroscopy. The in vitro aerosol dispersion performance and drug dissolution behavior were evaluated using an Anderson cascade impactor and a Franz diffusion cell, respectively. The JM microparticles exhibited an irregular corrugated surface and a crystalline solid state, while the SD microparticles were spherical with a smooth surface and an amorphous solid state. Thus, the in vitro aerosol dispersion performance and dissolution behavior as DPIs were considerably different due to the differences in the physicochemical properties of the SD and JM microparticles. In particular, the highest grinding pressures under jet milling exhibited excellent aerosol dispersion performance with statistically higher values of 56.8%±2.0% of respirable fraction and 33.8%±2.3% of fine particle fraction and lower mass median aerodynamic diameter of 5.0±0.3 µm than the others (P<0.05, analysis of variance/Tukey). The drug dissolution mechanism was also affected by the physicochemical properties that determine the dissolution kinetics of the SD and JM microparticles, which were well fitted into the Higuchi and zero-order models, respectively.
Keywords: bosentan, dry powder inhalations, pulmonary arterial hypertension, respiratory drug delivery, spray drying, jet milling
Introduction
Bosentan hydrate (BST) (Figure 1) is a competitive dual endothelin receptor antagonist that is nonselective for both endothelin A and endothelin B receptors. It decreases both pulmonary vascular resistance and systemic vascular resistance and hence increases cardiac output without increasing the heart rate.1,2 BST hydrate was approved by the US Food and Drug Administration (FDA) in 2001 under the brand name of Tracleer® (Bosentan), which is orally administered to alleviate the symptoms of pulmonary arterial hypertension (PAH).3
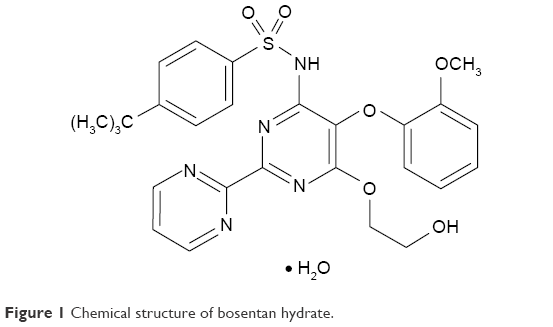 | Figure 1 Chemical structure of bosentan hydrate. |
Since PAH is a disease of pulmonary circulation and not of the whole circulatory system, the oral dosage of BST hydrate that is currently marketed has several limitations and produces side effects associated with its systemic circulation. The side effects of the systemic circulation include systemic hypotension, deterioration in the right ventricular performance, reduction in the right coronary blood flow, increase in the shunt function, and reduced oxygenation.4,5 Furthermore, orally administered BST hydrate also exhibits hepatotoxicity via the first-pass hepatic metabolism.6,7 Thus, there is an unmet clinical need to explore the possibilities of delivering anti-PAH drugs right into the diseased pulmonary circulation and also to develop a drug delivery system that is capable of releasing medication only in the vicinity of the diseased part of the pulmonary circulation.6
Targeted pulmonary delivery of BST hydrate has several advantages, including avoidance of the hepatic first-pass metabolism, a higher therapeutic concentration locally in the pulmonary system and, thus, a reduction in the systemic side effects. The targeted pulmonary delivery through inhalation is an effective noninvasive method for local therapeutic delivery of active pharmaceutical ingredients.8,9 Currently, iloprost inhalation solution (Ventavis®) and treprostinil inhalation solution (Tyvaso®) have been approved to treat PAH.
Of the various types of targeted pulmonary delivery formulations and devices, dry powders for inhalation are attractive since these offer several advantages, including a high stability in the dry state, easy handling, and portability.10,11 Actually, dry powder inhalations (DPIs) significantly decrease the daily treatment burden compared to a liquid formulation due to the absence of cleaning and disinfection requirements.12
The efficiency of DPIs is typically determined by the aerosol performance of particles and is also significantly influenced by the physicochemical properties of the formulation, including the particle size distribution, density, surface morphology, shape, interparticulate forces, and solid state.11,13,14 In general, the aerosolization efficiency of DPIs is represented by the particles’ aerodynamic diameter, with diameters of 5–10 μm for airways and 1–5 μm for deep lung delivery considered to be respirable.15,16
Respirable-sized particle is mostly engineered using both top-down and bottom-up processes, depending on the starting materials.17 Spray drying and jet milling are traditional bottom-up and top-down processes, respectively, and have been well established and validated to prepare DPIs.18 Spray drying is a one-step process that converts the drug solution into dry particles with a narrow size distribution, and the physicochemical properties of the dry particles can be tailored by adjusting the spray-drying parameters for the feeding solution conditions (ie, solvent type, concentration, and feeding rate) and drying gas conditions (ie, gas type, inlet and outlet temperatures, and flow rate).9,11 Jet milling is a size reduction process by particle–particle and particle–wall collisions under high-velocity jets of compressed gases, and this allows for micronizing without contamination as well as the milling of heat-sensitive materials. The mechanical parameters for milling, namely the jet pressure and particle nature, strongly affect the particulate and physicochemical properties of the particles.18–20
The objectives of this study were to prepare BST microparticles as DPIs using different spray-drying and jet-milling processes under various parameters, to comprehensively characterize the particulate and physicochemical properties and to indirectly evaluate their suitability as DPIs by determining the aerosol dispersion performance and drug dissolution behavior of the BST microparticles.
Materials and methods
Materials
BST hydrate (molecular weight: 569.63 g/mol) was obtained from Hanmi Pharmaceutical Co. Ltd. (Seoul, Korea). High-performance liquid chromatography (HPLC)-grade ethanol and acetonitrile were used (Honeywell Burdick & Jackson®, Muskegon, MI, USA), and all other reagents were either analytical grade or HPLC grade.
Preparation of BST microparticles
Spray-drying method
BST was accurately weighed and completely dissolved in ethanol using ultrasonication for 20 min to obtain 1%, 3%, and 5% (w/v) drug concentration solutions for spray drying. As listed in Table 1, the different formulations for spray drying were designated as spray-dried (SD) 1%, SD 3%, and SD 5%, respectively. The BST formulations were spray dried using a laboratory scale spray dryer (EYELA SD-1000, Rikakikai Co. Ltd., Tokyo, Japan) with the following parameters: inlet temperature of 110°C, outlet temperature of 65°C–75°C, nozzle size of 0.4 mm, feed rate of 10 mL/min, atomization air pressure of 200 kPa, and drying air flow rate of 0.30 m3/min. The spray-dried BST microparticles (SD-BSTs) were kept in a glass vial containing silica gel at −20°C until used.
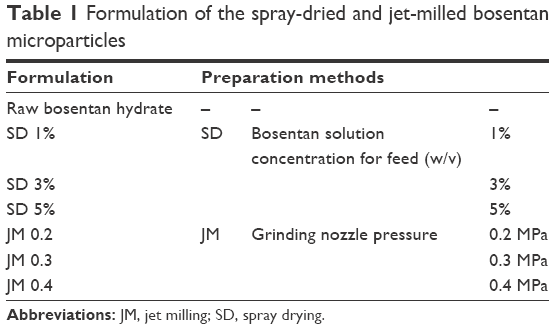 | Table 1 Formulation of the spray-dried and jet-milled bosentan microparticles |
Jet-milling method
The jet-milled BSTs microparticles (JM-BSTs) were prepared using an air jet mill (A-O JET MILL; JS Tech Co. Ltd., Sacheon, Korea). As listed in Table 1, JM-BSTs were prepared under three different grinding air pressures of 0.2, 0.3, and 0.4 MPa, designated as JM 0.2, JM 0.3, and JM 0.4, respectively. In all cases, the other jet-milling parameters were set as follows: feeding rate of 250%, feeding vibration of 40 Hz and pushing air pressure of 0.5 MPa. Nitrogen air was used for milling, and the JM-BSTs were then kept in a glass vial containing silica gel at −20°C until used.
HPLC analysis
The BST contents in the SD and JM microparticle formulations were analyzed using a validated HPLC (Ultimate 3000 series HPLC system; Thermo Fisher Scientific, Waltham, MA, USA) consisting of a pump, an autosampler, a column compartment, and a diode array detector operating at ultraviolet 220 nm with a Luna L11 250 ×4.60 mm, 5 μm column (Phenomenex, Torrance, CA, USA). The mobile phase consisting of acetonitrile and buffer (0.1% triethylamine solution, pH 2.5) at a ratio of 45:55 (v/v) was eluted at a flow rate of 1.5 mL/min. The column temperature was maintained at 35°C, and the volume of each injected sample was 10 μL.
Physicochemical characterization of BST microparticles
Scanning electron microscope (SEM)
The BST microparticles were visually imaged via SEM (ZEISS-GEMINI LEO 1530; Carl Zeiss AG, Oberkochen, Germany). The samples were placed onto carbon tape and were then coated with platinum using a Hummer VI sputtering device, reaching 200 Å coating thick. A voltage of 3 kV and magnifications of 5,000× and 20,000× were used.
Atomic force microscope (AFM)
AFM (Dimension Icon, Bruker, Germany) was used to achieve the surface topography and roughness of the BST microparticles. The BST microparticles were placed onto carbon tape and were scanned on the top of each primary particle in the tapping mode, by using pyramidal cantilevers with silicon probes at a scan rate of 0.1 Hz. The roughness was expressed as the root-mean-square (RMS).
Particle size distribution and surface charge
The particle size distribution and surface charge of the BST microparticles were determined using a dynamic light scattering technique (Zetasizer Nano ZS; Malvern Instruments, Malvern, UK, measurement range of 0.3 nm–10.0 μm). Three milligrams of the samples were added to 10 mL of distilled water, and the suspensions were vortexed for 20 s and allowed to equilibrate for 1 h. The mean particle size and size distribution that were measured are expressed as the Z-average and polydispersity index, while the surface charge was expressed as the zeta potential (ZP).
Water content
The water content of the BST microparticles was quantified via Karl Fischer titration (736 GP Titrino; Metrohm, Herisau, Switzerland). A known amount of sample was dissolved in methanol and titrated with Hydranal®-Composite as a reagent. Karl Fischer titration was standardized using water before quantifying the water content of the samples.
True density
A pycnometer (AccuPyc 1330; Micromeritics Instrument Corporation, Norcross, GA, USA) was used to determine true density of the BST microparticles under helium gas. The temperature was maintained at 27°C, and each sample was run 10 times.
Surface area
The surface areas of the BST microparticles were measured using an accelerated surface area and porosimetry analyzer (ASAP 2000; Micromeritics Instrument Corporation). The samples were degassed at 90°C for 90 min under nitrogen prior to analysis, and the surface area was calculated according to the Brunauer–Emmet–Teller (BET) equation.
Differential scanning calorimeter (DSC)
The thermal behavior and phase transition of the BST microparticles were measured using a DSC (DSC 2910; TA Instruments, New Castle, DE, USA). Each sample was placed in DSC aluminum sample pans that were then sealed and heated from 30°C to 180°C at a heating scan rate of 10°C/min.
Powder X-ray diffraction (PXRD)
The PXRD patterns of the BST microparticles were measured using an X-ray diffractometer (XDS 2000; Scintag, Cupertino, CA, USA). The scanning range of 2θ was from 5° to 60° with a step size of 0.009°/2θ at ambient temperature with a Cu radiation source (40 kV, 40 mA).
Fourier transform infrared (FT-IR) spectroscopy
The infrared spectra were recorded using the FT-IR spectroscopy (IFS 66v/S; Bruker Optics, Ettlingen, Germany) by following the potassium bromide technique, and the spectroscopic wavelength range from 2,400 to 4,000 cm−1 was investigated.
In vitro aerosol dispersion performance by Andersen cascade impactor (ACI)
The in vitro aerosol dispersion performance of the BST microparticles as DPIs was determined using an eight-stage nonviable ACI (TE-20-800; Tisch Environmental, Cleves, OH, USA). A hydroxypropyl methylcellulose hard capsule (size 4) was loaded with 30 mg of the sample and was placed in a commercially approved DPI device (Handihaler®; Boehringer Ingelheim, Ingelheim am Rhein, Germany) and tightly inserted into the mouthpiece adapted on the induction port. The ACI was actuated at a controlled flow rate of 90 L/min, at which time the particles were drawn into the impactor for 10 s. The flow rate of 90 L/min for 10 s, a hard condition for the evaluation of in vitro aerosol dispersion performance of DPIs, was used in this study to starkly compare the aerosolization performance of BST microparticles by the processes of spray drying and jet milling. To prevent particle bounce, glass fiber filters (GF/A glass fiber filter, 1.6 μm, 80 mm; HYUNDAI Micro, Korea) were placed on the collection plates of the stages from −1 to the final.21,22 The glass fiber filter is widely used with ACI because it offers fine particle retention, high flow rate, as well as good loading capacity to conveniently evaluate the aerosol performance. The quantity of particles remaining in the capsule and deposited at each stage was analytically determined using modified HPLC methods. For the ACI flow rate of 90 L/min, the cutoff diameters were determined for the modified impactor through experimental techniques and were stated as 8.0, 6.5, 5.2, 3.5, 2.6, 1.7, 1.0, and 0.43 μm for stages −2, −1, −0, 1, 2, 3, 4, and 5 stages, respectively. The emitted dose (ED), fine particle fraction (FPF), and respirable fraction (RF) of the BST microparticles as DPIs were determined using the following equations:
|
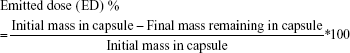
|
|
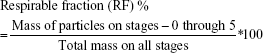
The ED indicates the ability of dry powder to be emitted from the capsule. The FPF and RF were considered as fractions of ED and administrated dose, respectively, that is able to reach the respirable region with aerodynamic size ~≤5.0 μm (ie, the dose collected on the −0 to 5 stages).11,23 The mass median aerodynamic diameter (MMAD) and the geometric standard deviation (GSD) were determined using the web-based tool (www.mmadcalculator.com/andersen-impactor-mmad.html). All experiments were performed in triplicate (n=3).
In vitro dissolution study via Franz diffusion cell
The in vitro dissolution profile of the BST microparticles as DPIs was investigated using a Franz diffusion cell system (FCDS-900C; Labfine Instruments, Anyang, Korea). The medium reservoir of the Franz cell was filled with phosphate-buffered saline buffer pH 7.4 containing Tween 80 (5%, w/w) and maintained at 37°C±1°C. The medium was continuously stirred to ensure the homogeneity. A cellulose membrane filter (pore size: 0.45 μm; Advantec®, Tokyo, Japan) was then used as a barrier and was placed into the membrane holder to allow contact with the medium. Approximately 5 mg of precisely weighted samples was uniformly spread on the surface of the membrane at the air–liquid interface. At the defined time, 200 μL of samples was removed and the same volume of fresh buffer was refilled to maintain a constant medium volume. The removed samples were centrifuged for 10 min at 1,000 rpm to obtain the supernatant, and the samples were quantified in terms of their BST content using the modified HPLC method. All experiments were done with n=4.
To calculate the statistical significance of the dissolution data equivalence, the authors performed using similarity factor (f2) according to the FDA guidance. The similarity factor (f2) is a measurement of the similarity in the dissolution percentage between the two curves and is a logarithmic reciprocal square root transformation of the sum of squared error using the following equation.24
Similarity factor:
|
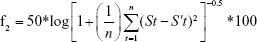
n is the number of time points and St and S′t are the dissolution values of the samples at time t. In order to consider the similar dissolution profiles, the f2 values should be close to 100. In general, the values >50 (50–100) show the similarity of the dissolution profiles.
The drug kinetics were also investigated to evaluate the drug release mechanism. The results of the in vitro drug dissolution study were fitted to zero-order, Higuchi, and Korsmeyer–Peppas kinetic models using the following equations.
Zero-order kinetic model:
|

Qt is the amount of drug dissolved at time t, Q0 is the initial amount of drug in medium, and K0 is the zero-order constant.
Higuchi kinetic model:
|

Q is the amount of drug dissolved in time t per unit area and KH is the Higuchi constant.
Korsmeyer–Peppas kinetic model:
|

Mt/M∞ is the fraction of the drug dissolved at time t, K is the dissolution rate constant, and n is the exponent. The value of the exponent (n) indicates the drug dissolution mechanism.
Statistics
Statistically significant differences in the physicochemical properties, in vitro aerosol dispersion performance, and in vitro drug dissolution behavior were evaluated using a one-way analysis of variance (ANOVA) and Tukey’s post hoc test (version 22.0; SPSS Inc., Chicago, IL, USA). A P-value of <0.05 was considered to be statistically significant.
Results
Particle and surface morphology of SD- and JM-BST microparticles
SEM
Images were obtained using an SEM, as shown in Figure 2, to obtain the qualitative information of the shape and surface morphology of the BST microparticles. The raw BST had irregular nonspherical morphology, polydisperse size range, and crystalline particle state. In the case of SD 1%, the surface morphology had changed substantially in that the particles were quite spherical, smooth, and regular. Changes in crystallinity and in the morphology for JM 0.4 were not observed, but the particles appeared to be smaller and narrower in size than the raw BST. In addition, the quite small particles of JM 0.4 showed a tendency for aggregation. The drug solution concentrations of the SD-BSTs and the grinding air pressure of the JM-BSTs did not significantly influence the morphologic properties.
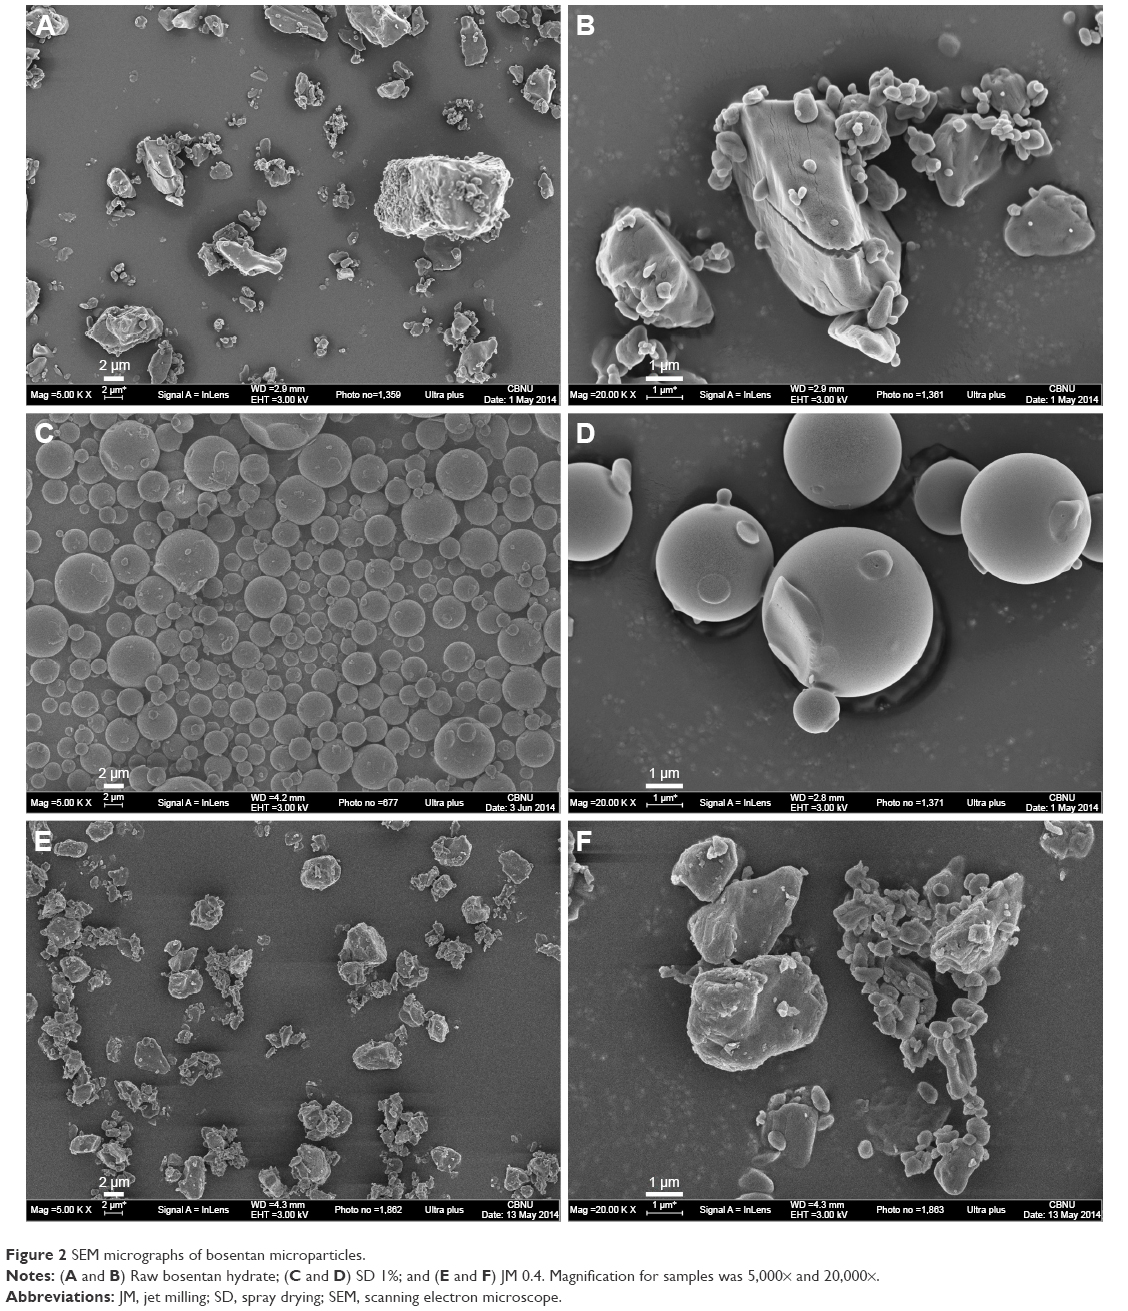 | Figure 2 SEM micrographs of bosentan microparticles. |
AFM
The surface topography of the BST microparticles was analyzed using an AFM, and representative images of each sample are shown in Figure 3. The RMS was calculated to quantify the statistical differences in the surface roughness of the particles. The raw BST, SD 1%, and JM 0.4 had RMS values of 323, 19.7, and 173 nm, respectively. As was expected from the SEM image, the SD-BSTs had the lowest RMS value and exhibited a smooth surface topography, while the JM-BSTs exhibited a relatively irregular topography and higher RMS values than the SD-BSTs. The RMS value and the topographical AFM image were consistent with the results from the SEM, which showed morphological and topographic changes when spray dried and a size reduction when jet milled.
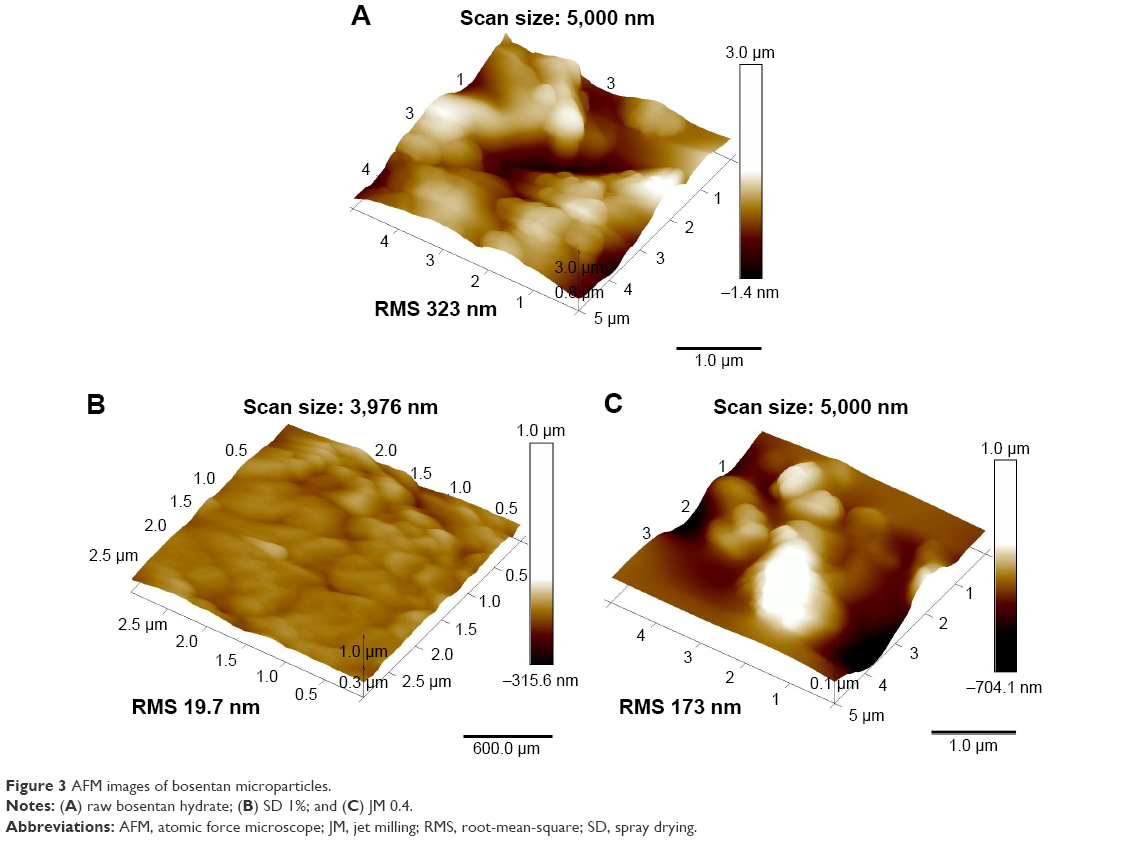 | Figure 3 AFM images of bosentan microparticles. |
Physicochemical properties of SD- and JM-BST microparticles
Particle size distribution
Table 2 shows data pertaining to particle size and size distribution, suggesting that the Z-average of the SD-BSTs ranged from 2.2 to 2.7 μm. The JM-BSTs showed a Z-average within the range from 1.7 to 2.8 μm. In particular, the JM 0.4 exhibited a considerable reduction in particle size. The particle size distribution of the formulated samples decreased and became monodispersed relative to the raw BST after spray-drying or jet-milling processes, and these measurements were in good agreement with the observations from the SEM images.
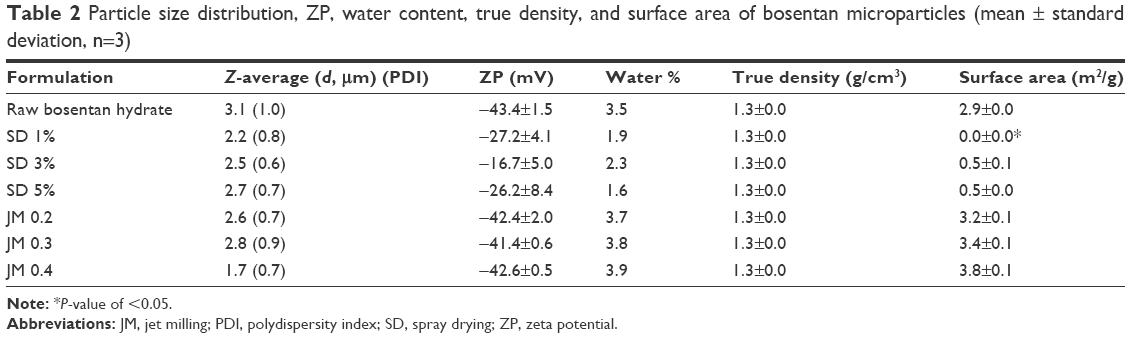 | Table 2 Particle size distribution, ZP, water content, true density, and surface area of bosentan microparticles (mean ± standard deviation, n=3) |
Surface charge
Table 2 also presents the ZP describing the surface charge. The ZP was from −16.7±5.0 to −27.2±4.1 mV for the SD-BSTs and −41.4±0.6 to −42.6±0.5 mV for JM-BSTs, which varies significantly according to the different preparation methods used (P<0.05, ANOVA/Tukey). The JM-BSTs exhibited a more unipolar nature than the SD-BSTs, and the SD 3% sample showed the most bipolar surface charge.
Water content
The water content of all prepared BST microparticles was analytically quantified via Karl Fischer titration, and the results are listed in Table 2. The water content of the SD-BSTs was 1.6%–2.3% with no trends corresponding to the drug solution concentration under the spray-drying process. These values for the SD-BSTs were significantly lower than those for raw BST, indicating that water had been removed during the spray-drying process. The water content of the JM-BSTs was from 3.7% to 3.8%, which indicates that this method kept the raw BST water content.
True density
The true density of the BST microparticles was measured using a pycnometer, and the results are listed in Table 2. All BST microparticles showed a density of 1.3 g/cm3 that is equal to the true density of raw BST. The true density was not affected by the preparation methods and formulation since the particles were composed of a single material.
Surface area
The surface area was measured using the nitrogen adsorption BET method, and Table 2 shows the surface area of the BST microparticles, in which the data are seen to be consistent with the observations from the SEM images (Figure 2), AFM measurements (Figure 3), and particle size data (Table 2). Significant differences can be seen in the surface area after the spray-drying process and jet-milling process. The surface area of the SD-BSTs ranged <0.6 m2/g, which was considerably low due to the spherical and smooth morphology despite a comparable particle size of the other BST microparticles. In contrast, the surface area of the JM-BSTs was 3.2±0.1–3.8±0.1 m2/g. The values of the JM-BSTs were 10 times larger than those of the SD-BSTs because jet milling resulted in small, rough, and irregular particles. In practice, the surface area is seriously affected by the degree of roughness and the size of the particles.25
Crystallinity characterization of SD- and JM-BST microparticles
DSC
Figure 4 shows the DSC thermograms that were used to characterize the thermal behavior of the BST microparticles. The raw BST exhibits two endotherm peaks at 113.6°C and 125.9°C, which is consistent with the results previously reported in the literature.26 The first peak represents the water elimination of hydrate, and the second sharp peak is the melting point of drug, which indicates that a high crystalline solid state is achieved. However, the drug in the solid state was severely transformed by spray drying. The SD-BSTs exhibited a significantly broad endothermic peak at ~127°C and a baseline shift at ~65°C–72°C, representing a glass transition that indicates the change in the solid state to amorphous as a result of spray drying. In contrast, the JM-BSTs did not show a significant influence in the thermal behavior, with a sharp endothermic peak at ~125°C representing the melting point.
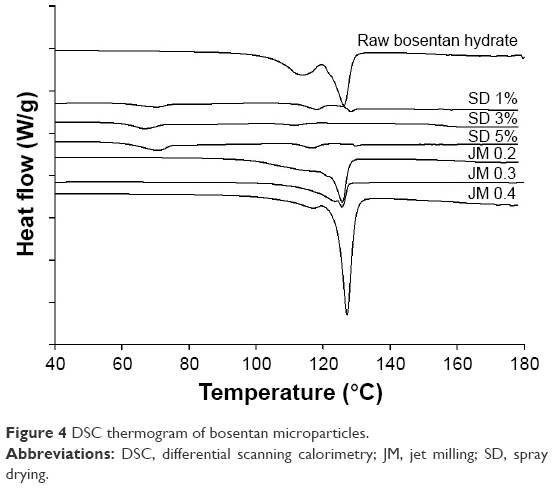 | Figure 4 DSC thermogram of bosentan microparticles. |
PXRD
The PXRD patterns of the BST microparticles are shown in Figure 5. The diffractograms of the SD-BSTs had no specific diffraction peaks due to complete phase transforming to an amorphous solid state, whereas the raw BST and JM-BSTs had approximately identical diffractograms with sharp and strong diffraction peaks at the main angles (2θ) of 9.28, 15.55, 16.69, and 18.64°, indicating that both had a high crystallinity and that jet milling did not influence the solid state of the drug.
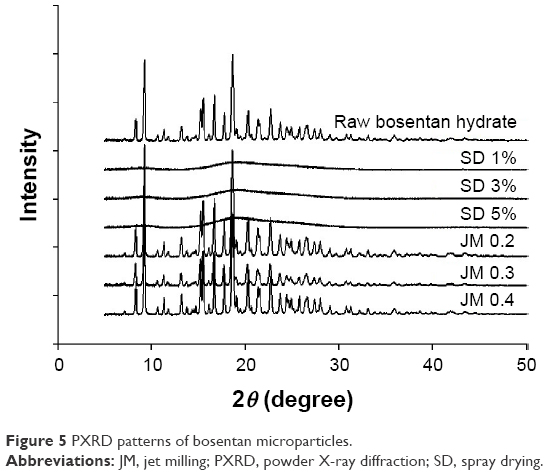 | Figure 5 PXRD patterns of bosentan microparticles. |
FT-IR spectroscopy
The results of the FT-IR for the BST microparticles are depicted in Figure 6 to determine the functional groups that are present in the BST microparticles’ structure. The raw BST spectra were in agreement with that from a previous study.26 In comparison to the raw BST, the FT-IR spectra of the SD-BSTs showed a disappearance in the peaks at ~3,650–3,600, ~3,400–3,500, and ~3,000–3,100 cm−1. These peaks may respectively correspond to the O–H stretching, N–H stretching, and C–H stretching in the particle structure. As expected from the DSC and PXRD, the FT-IR spectra of the JM-BSTs showed no appearance or disappearance of any of the characteristic peaks, which confirmed the absence of chemical changes in the structure resulting from the jet-milling process.
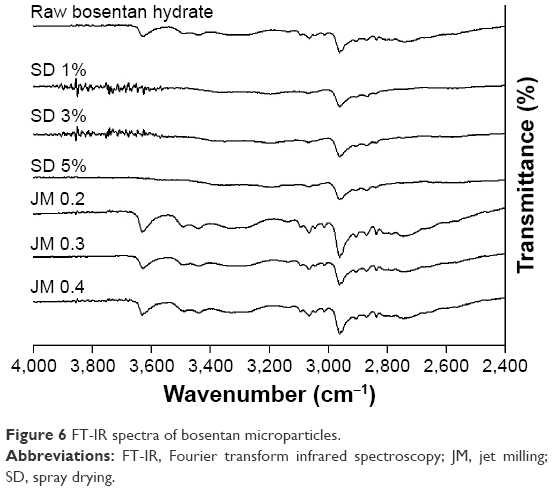 | Figure 6 FT-IR spectra of bosentan microparticles. |
In vitro aerosol dispersion performance
The aerosol performance characteristics of the BST microparticles as DPIs were evaluated using an ACI coupled with a Handihaler® DPI device. The distribution is presented in Figure 7 as the percentage deposition for each ACI stage, and the aerosol performance parameters are tabulated in Table 3. The ED values for all BST microparticles were high, in the range from 90.9% to 98.7%, and this corresponds to minimal retention in the capsule. The SD-BSTs exhibited FPF from 14.0% to 19.3%, RF from 22.4% to 27.6%, MMAD from 7.1 to 7.3 μm, and a GSD value of 1.2, with no trends corresponding to the drug solution concentration under the spray-drying process. The JM-BSTs showed FPF within a range from 23.0% to 33.8%, RF from 45.3% to 56.8%, MMAD from 5.0 to 6.7 μm, and GSD values of 1.2–5.6. Differences in the particle diameter can be observed in the MMAD found in the results of ACI compared to Z-average found in the dynamic light scattering method. The reason for this phenomenon is that MMAD is an airborne diameter statistically derived figure for aerosolization effected by density, shape, and size of particles and not by a geometric diameter.27 In general, the increase in FPF and RF and the decrease in MMAD and GSD values are associated with an increase in the drug dispersion. In particular, the JM 0.4 samples showed significant enhancement in the FPF, RF, and MMAD values in contrast to other BST microparticles (P<0.05, ANOVA/Tukey). However, JM 0.4 had a relatively higher GSD value than others due to an aggregation tendency of fine particles as expected from SEM images (Figure 2).28 These quantified results indicate that the aerosol dispersion performance was influenced by the preparation method used. The JM-BSTs exhibited a higher percentage deposition on ACI stages from −0 to 5 compared to the SD-BSTs, and in particular, the high grinding air pressures under the jet milling may result in enhanced deposition in the deep lung region for pulmonary delivery.
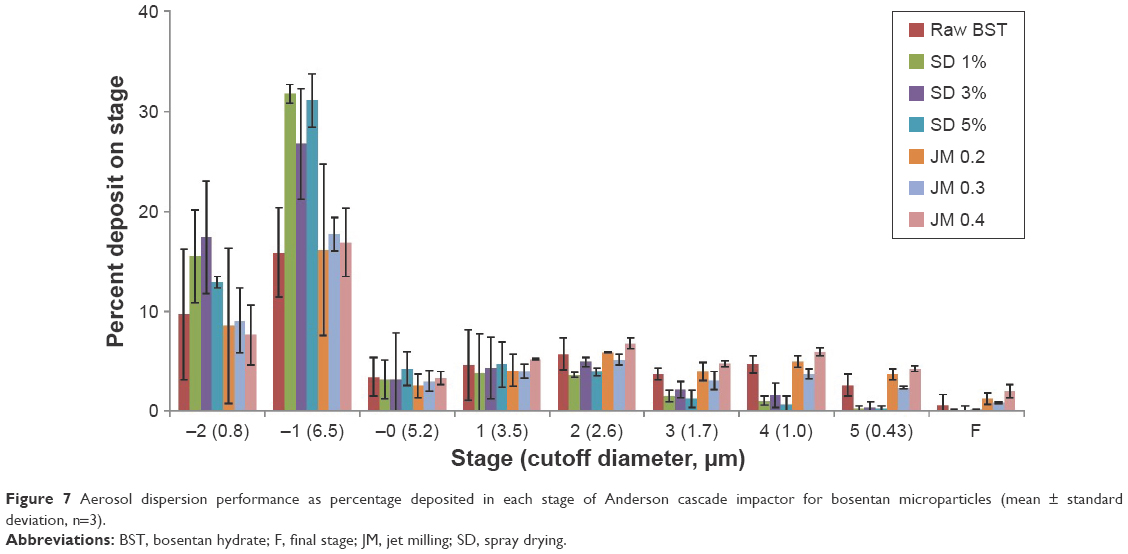 | Figure 7 Aerosol dispersion performance as percentage deposited in each stage of Anderson cascade impactor for bosentan microparticles (mean ± standard deviation, n=3). |
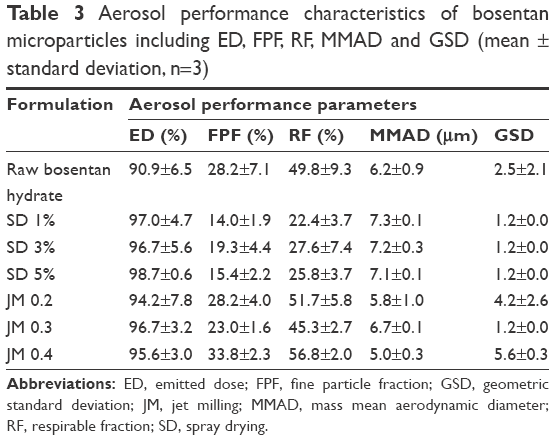 | Table 3 Aerosol performance characteristics of bosentan microparticles including ED, FPF, RF, MMAD and GSD (mean ± standard deviation, n=3) |
In vitro drug dissolution study
The dissolution profiles of the BST microparticles obtained via a Franz diffusion cell are shown in Figure 8. The drug concentrations were measured, and the data are plotted as the cumulative percentage of drug dissolved over 9 h. The Franz diffusion cell was used to wet the BST microparticles deposited on the membrane and then to dissolve and diffuse them into the surrounding media. It mimicked the diffusion-controlled air–liquid interface of the lung after administration of the inhaled drug.29 The SD-BSTs had an initial burst during 1 h after starting the dissolution test. Hence, the cumulative percentage of the drug dissolution at 1 h, the SD-BSTs showed significantly higher values than the JM-BSTs (P<0.05, ANOVA/Tukey). In addition, the drug dissolution rate of the SD-BSTs slightly increased as the drug concentration decreased in the spray-drying process, but this was not significant during the 9 h period (P>0.05, ANOVA), so each of the dissolution curves of SD-BSTs had similarity factor (f2) >50, which indicates similarity in the dissolution profiles.24 The JM-BSTs showed a relatively constant drug dissolution rate during the 9 h period, and these results were not influenced by the grinding nozzle pressure of the jet milling (P>0.05, ANOVA). The significant difference of dissolution curves between SD-BSTs and JM-BSTs was confirmed by similarity factor (f2) <50. However, for all BST microparticles, the cumulative percentage of the drug dissolution at 9 h ranged from 28.8% to 39.9% and did not vary significantly according to the preparation methods (P>0.05, ANOVA).
 | Figure 8 Dissolution profiles of bosentan microparticles in Franz diffusion cell (mean ± standard deviation, n=4). |
The dissolution kinetic fitting parameters of the BST microparticles were calculated according to the zero-order, Higuchi, and Korsmeyer–Peppas models. The correlation coefficients (r2), dissolution constants (K), and dissolution exponent (n) are listed in Table 4. As listed in Table 4, the release profiles of SD-BSTs fit well into the Higuchi model (r2 range of 0.89–0.94), in which the release rates showed similar dissolution constants regardless of the feeding solution concentrations (KH range of 11.21–12.06). The JM-BSTs were properly applied to both zero-order (r2 range of 0.96–0.99) and Higuchi kinetics (r2 range of 0.99) with constant dissolution rates as grinding pressure (KH range of 10.49–11.89 and K0 range of 3.11–3.44). The exponent n at the Korsmeyer–Peppas kinetic model characterizes the dissolution mechanisms of the drug of diffusion, mass transfer, and relaxation, namely, 0.5=n corresponds to a Fickian diffusion, 0.5<n<1 to non-Fickian (anomalous) transport, n=1 to case II transport, and n>1 to super case II transport. In particular, the case II transport shows the t1 of dissolution rate as a function of time (ie, zero-order kinetics) and the super case II transport exhibits tn–1. As listed in Table 4, the SD-BSTs had n values close to 0.5, indicating an anomalous transport mechanism. In contrast, the JM-BSTs usually had n values close to 1, which is indicative of case II transport for which the drug dissolution rate is independent of time and hence corresponds to the zero-order kinetics.
 | Table 4 Dissolution kinetics of bosentan microparticles in a Franz diffusion cell |
Discussion
The SD-BSTs had spherical (Figure 2) and smooth (Figure 3) morphology in an amorphous solid state (Figures 2, 4–6) when compared with raw BST and JM-BSTs. The formation of the spherical and amorphous particles can be explained by considering the mass transport of the component radial direction during the drying process.30 During spray drying, it can be a result of the sufficiently rapid evaporation of the solvent (eg, high inlet air temperature and solvents with high solubility and low boiling points), which would not allow enough time for crystallization.9,31 As a consensus, the SD-BSTs had a spherical shape and amorphous solid state with low surface area, low water content, and low absolute value of ZP (Table 2).
In comparison to the SD-BSTs, the JM-BSTs had an irregular (Figure 2), rough (Figure 3), and crystal solid state (Figures 2, 5, and 6) with a relatively high water content, high absolute value of ZP, and large surface area (Table 2), showing that the physicochemical properties of raw BST had been maintained, except for the particle size distribution. If excessively high energy had been input during jet-milling process, the raw particles damaged the crystal surface and created local hot spots that result in the formation of undesirable solid-state or morphological changes in the particles, especially at the surface.13,32,33 This indicates that the JM-BSTs underwent an appropriate milling shear, because the JM-BSTs maintained the crystallinity of raw BST evidenced by the unconverted melting peak ~125°C of thermodynamic behavior for DSC, the identical diffractograms for PXRD, and the absence of structural changes for FT-IR (Figures 4–6).
Depending on the target delivery region of the DPIs, the particles should exhibit desirable particle size distribution with ideal aerodynamic diameters of 5–10 μm for airways and 1–5 μm for deep lung delivery.15,16 The aerodynamic diameter, a diameter of a sphere of unit density, generally depends on the airflow (eg, particle Reynolds [Re] number) as well as on the particulate properties (eg, geometric size, shape, and density), and a smaller aerodynamic diameter can, therefore, be obtained for particles with small volume-equivalent diameter, low density, and nonspherical shapes.13,34
As shown in Figures 2 and 3, the nonspherical and irregular shape of JM-BSTs influenced to decreasing the aerodynamic diameter and, consequently, showed better aerosol dispersion performance of ED, FPF, RF, and MMAD than those of spherical SD-BSTs, regardless of similar Z-average of geometric size as tabulated in Tables 2 and 3. In particular, the JM 0.4 having considerably small Z-average generated a synergy effect to the aerosol dispersion performance.
In addition, the dispersion property of the particles in the airflow is defined by the balance of the aerodynamic stress and the aggregate strength.13 Particles with a nonspherical and irregular morphology, stable surface charge, and suitable water content have smaller aggregation strength than the spherical and smooth particles with a unstable surface charge due to the reduced contact area and reduced interparticulate forces.18
Irregular and rough particles can exhibit a significant reduction in the true area of the contact between particles, and thus, aggregation decreases due to the decrease in point-to-point contact that would in turn reduce the influence of the van der Waals interactions by increasing the average distance between particles.34 Therefore, JM-BSTs were showed generally better aerosol performance than SD-BSTs due to its irregular and rough shape (Figures 2 and 3).
The surface charge of the particles is also related to the degree of aggregation.35 When the particles have a lower absolute value of ZPs of bipolar charge, collisions between the particles occur more rapidly; namely, the unipolar particles that correspond to the high absolute value of ZPs show an even stable surface charge and smaller collision rate due to the increasing electrostatic repulsion force between similarly charged particles.36 As listed in Table 2, the JM-BSTs had a significantly higher absolute value of ZPs than SD-BSTs and, consequently, could reduce the aggregation tendency of particles. However, considerably fine particle size of JM 0.4 dominantly effected to aggregation between particles in spite of high absolute value of ZP (Figure 2).
In terms of the moisture content of the particle as DPIs, a low water content is required to efficiently disperse and deliver the particles since a high water content can significantly decrease the dispersion properties in the airflow due to the interparticular capillary forces acting at the solid–solid interface between the particles.37 However, the presence of a minimum water content in the particles may be necessary to reduce the powder aggregation due to the triboelectric charges.35 In case of SD-BSTs, the water content was relatively lower, which can be considered as a reason for the negative effect of interaction between the particles, while the relatively higher water content of JM-BSTs was rather appropriate for the aerosolization of BST microparticles (Tables 2 and 3).
After considering all the factors to dispersion properties of DPIs, spherical and smooth shape, relatively low absolute value of ZP, and water content of SD-BSTs influenced to increasing the aerodynamic diameter and aggregation strength. Meanwhile, the JM-BSTs having irregular shape, relatively high absolute ZP, and proper water content showed the enhanced dispersion properties, including ED, FPF, RF, and MMAD, in the consequence of reducing the aerodynamic diameter and aggregation tendency of microparticles. In particular, JM 0.4 showed the highest FPF and RF values and the smallest MMAD value in spite of the highest GSD value due to the significantly fine particle size. The fine particle size of JM 0.4 was likely to aggregate, but this fine size dominantly performed to decrease the aerodynamic diameter, so that JM 0.4 showed the most effective aerosol performance in BST microparticles.
After administration by aerosolization of dry powders, the inhaled drug that delivered to the target pulmonary region undergoes dissolution in the fluids, and the dissolved fraction of the dose will be available for diffusion and absorption across the alveolar membrane.38 The efficacy of inhaled drugs is understood to be influenced by aerosolized dose delivered to lung as well as by dissolution behavior in the lung fluids. In this study, the in vitro dissolution test of BST microparticles was conducted to estimate the dissolution behavior in vivo after inhaled administration.29 The drug dissolution rate and dissolution mechanism are also affected by the physicochemical properties, including the polymorphism, particle size, and water solubility.11,39 Mathematical fitting models including the zero-order, Higuchi, and Korsmeyer–Peppas kinetic models can explain the drug dissolution from the DPIs.
The dissolution profiles of SD-BSTs showed initial burst during 1 h and well fitted into Higuchi model, while the JM-BSTs showed constant dissolution profile and properly applied to zero-order kinetics as shown in Figure 8 and Table 4. The reason for the difference of dissolution mechanisms between SD-BSTs and JM-BSTs was that each aqueous solubility was controlled by the affinity between the solid particles and the medium,29,40 while the dissolution behavior was not affected by the aerosol properties of the BST microparticles. In particular, the zero-order kinetics is an ideal drug delivery model wherein the blood level of the drugs remains constant,41 which is particularly important to control the blood pressure during PAH. In conclusion, the zero-order kinetics of JM-BSTs was a desirable profile to apply the BST as DPIs for constant drug delivery to pulmonary for PAH treatment.
Many physicochemical factors can influence the in vitro aerosol dispersion performance and drug dissolution of the DPIs, including the morphology, particle size, density, surface energy, and solid state. The qualitative and quantitative results of this study show that the different physicochemical properties depend on the processing methods that were used. In this study, the JM-BSTs had the potential to effectively deliver and dissolve the drug in the respiratory tract for PAH therapy due to their ideal physicochemical properties (nonspherical shape, irregular, rough, crystal solid state, suitable water content, high absolute value of ZP, and large surface area). In particular, the JM 0.4 sample showed a significant improvement in the aerosol dispersion performance and zero-order dissolution kinetics when compared to other BST microparticles.
Conclusion
There were significant differences in the physicochemical properties of the BST microparticles depending on the preparation methods that were used. The SD-BSTs were quite spherical and smooth with an amorphous solid state, while the JM-BSTs were irregular and rough with a crystal solid state. These properties directly influenced the aerosol dispersion and the dissolution behavior of the SD-BSTs and JM-BSTs as DPIs. In conclusion, the JM-BSTs are ideal DPIs, and high grinding air pressures with jet milling may produce an improved deposition in the deep lung region for pulmonary delivery due to the smaller aerodynamic diameter and aggregate strength owing to their physicochemical properties. The DPIs in the JM 0.4 sample exhibited suitable properties for clinical delivery and have the possibility to deliver a higher drug concentration locally in the lung and thus reduce the systemic side effects and improve the therapeutic effect for PAH treatment. Further studies are needed to explore the BST microparticles delivering to lung target region and therapeutic effects for PAH in animals.
Acknowledgments
This study was supported by Basic Science Research Program through the National Research Foundation of Korea (NRF) funded by the Ministry of Science, ICT & Future Planning (No MRC-2008-0062275, 2016130652, NRF-2015R1C1A1A02036702) and the research grant of the Chungbuk National University in 2012.
Disclosure
The authors report no conflicts of interest in this work.
References
Rubin LJ, Badesch DB, Barst RJ, et al. Bosentan therapy for pulmonary arterial hypertension. N Engl J Med. 2002;346(12):896–903. | ||
Farber HW, Loscalzo J. Pulmonary arterial hypertension. N Engl J Med. 2004;351(16):1655–1665. | ||
Motte S, McEntee K, Naeije R. Endothelin receptor antagonists. Pharmacol Ther. 2006;110(3):386–414. | ||
Gupta V, Gupta N, Shaik IH, et al. Inhaled PLGA particles of prostaglandin E1 ameliorate symptoms and progression of pulmonary hypertension at a reduced dosing frequency. Mol Pharm. 2013;10(5):1655–1667. | ||
Gupta V, Ahsan F. Inhalational therapy for pulmonary arterial hypertension: current status and future prospects. Crit Rev Ther Drug Carrier Syst. 2010;27(4):313–370. | ||
Vaidya B, Gupta V. Novel therapeutic approaches for pulmonary arterial hypertension: unique molecular targets to site-specific drug delivery. J Control Release. 2015;211:118–133. | ||
Hoeper M, Halank M, Marx C, et al. Bosentan therapy for portopulmonary hypertension. Eur Respir J. 2005;25(3):502–508. | ||
Gradon L, Sosnowski TR. Formation of particles for dry powder inhalers. Adv Powder Technol. 2014;25(1):43–55. | ||
Chen L, Okuda T, Lu X-Y, Chan H-K. Amorphous powders for inhalation drug delivery. Adv Drug Deliv Rev. 2016;100:102–115. | ||
Cuvelier B, Eloy P, Loira-Pastoriza C, et al. Minimal amounts of dipalmitoylphosphatidylcholine improve aerosol performance of spray-dried temocillin powders for inhalation. Int J Pharm. 2015;495(2):981–990. | ||
Park C-W, Li X, Vogt FG, et al. Advanced spray-dried design, physicochemical characterization, and aerosol dispersion performance of vancomycin and clarithromycin multifunctional controlled release particles for targeted respiratory delivery as dry powder inhalation aerosols. Int J Pharm. 2013;455(1):374–392. | ||
Weers J. Inhaled antimicrobial therapy–barriers to effective treatment. Adv Drug Deliv Rev. 2015;85:24–43. | ||
Chow AH, Tong HH, Chattopadhyay P, Shekunov BY. Particle engineering for pulmonary drug delivery. Pharm Res. 2007;24(3):411–437. | ||
Pilcer G, Amighi K. Formulation strategy and use of excipients in pulmonary drug delivery. Int J Pharm. 2010;392(1):1–19. | ||
Heyder J, Gebhart J, Rudolf G, Schiller CF, Stahlhofen W. Deposition of particles in the human respiratory tract in the size range 0.005–15 μm. J Aerosol Sci. 1986;17(5):811–825. | ||
Sou T, Meeusen EN, De Veer M, Morton DA, Kaminskas LM, McIntosh MP. New developments in dry powder pulmonary vaccine delivery. Trends Biotechnol. 2011;29(4):191–198. | ||
Zhang J, Wu L, Chan H-K, Watanabe W. Formation, characterization, and fate of inhaled drug nanoparticles. Adv Drug Deliv Rev. 2011;63(6):441–455. | ||
Djokić M, Kachrimanis K, Solomun L, Djuriš J, Vasiljević D, Ibrić S. A study of jet-milling and spray-drying process for the physicochemical and aerodynamic dispersion properties of amiloride HCl. Powder Technol. 2014;262:170–176. | ||
Palaniandy S, Azizli KAM, Hussin H, Hashim SFS. Effect of operational parameters on the breakage mechanism of silica in a jet mill. Miner Eng. 2008;21(5):380–388. | ||
Midoux N, Hošek P, Pailleres L, Authelin J. Micronization of pharmaceutical substances in a spiral jet mill. Powder Technol. 1999;104(2):113–120. | ||
Fiegel J, Garcia-Contreras L, Thomas M, et al. Preparation and in vivo evaluation of a dry powder for inhalation of capreomycin. Pharm Res. 2008;25(4):805–811. | ||
Yang Y, Tsifansky MD, Wu C-J, Yang HI, Schmidt G, Yeo Y. Inhalable antibiotic delivery using a dry powder co-delivering recombinant deoxyribonuclease and ciprofloxacin for treatment of cystic fibrosis. Pharm Res. 2010;27(1):151–160. | ||
Meenach SA, Anderson KW, Hilt JZ, McGarry RC, Mansour HM. Characterization and aerosol dispersion performance of advanced spray-dried chemotherapeutic PEGylated phospholipid particles for dry powder inhalation delivery in lung cancer. Eur J Pharm Sci. 2013;49(4):699–711. | ||
Moore JW, Flanner HH. Mathematical comparison of dissolution profiles. Pharm Technol. 1996;20(6):64–74. | ||
De Boer A, Hagedoorn P, Gjaltema D, Goede J, Kussendrager K, Frijlink H. Air classifier technology (ACT) in dry powder inhalation part 2. The effect of lactose carrier surface properties on the drug-to-carrier interaction in adhesive mixtures for inhalation. Int J Pharm. 2003;260(2):201–216. | ||
Mannam R, Yallamalli IM. Formulation and evaluation of matrix membrane moderated transdermal patches of bosentan monohydrate. Int J Sci Eng Res. 2015;6(10):746–755. | ||
Wiggins NA. The development of a mathematical approximation technique to determine the mass median aerodynamic diameter (MMAD) and geometric standard deviation (GSD) of drug particles in an inhalation aerosol sprat. Drug Dev Ind Pharm. 1991;17(14):1971–1986. | ||
Shekunov BY, Chattopadhyay P, Tong HH, Chow AH. Particle size analysis in pharmaceutics: principles, methods and applications. Pharm Res. 2007;24(2):203–227. | ||
May S, Jensen B, Wolkenhauer M, Schneider M, Lehr CM. Dissolution techniques for in vitro testing of dry powders for inhalation. Pharm Res. 2012;29(8):2157–2166. | ||
Kawakami K, Sumitani C, Yoshihashi Y, Yonemochi E, Terada K. Investigation of the dynamic process during spray-drying to improve aerodynamic performance of inhalation particles. Int J Pharm. 2010;390(2):250–259. | ||
Tawfeek HM, Evans AR, Iftikhar A, et al. Dry powder inhalation of macromolecules using novel PEG-co-polyester microparticle carriers. Int J Pharm. 2013;441(1):611–619. | ||
Moura C, Neves F, Costa E. Impact of jet-milling and wet-polishing size reduction technologies on inhalation API particle properties. Powder Technol. 2016;298:90–98. | ||
Kubavat HA, Shur J, Ruecroft G, Hipkiss D, Price R. Influence of primary crystallisation conditions on the mechanical and interfacial properties of micronised budesonide for dry powder inhalation. Int J Pharm. 2012;430(1):26–33. | ||
Chew NY, Chan H-K. Use of solid corrugated particles to enhance powder aerosol performance. Pharm Res. 2001;18(11):1570–1577. | ||
Philip VA, Mehta RC, Mazumder MK, DeLuca PP. Effect of surface treatment on the respirable fractions of PLGA microspheres formulated for dry powder inhalers. Int J Pharm. 1997;151(2):165–174. | ||
Task Group on Lung Dynamics. Deposition and retention models for internal dosimetry of the human respiratory tract. Health Phys. 1966;12(2):173–207. | ||
Hickey AJ, Mansour HM, Telko MJ, et al. Physical characterization of component particles included in dry powder inhalers. I. Strategy review and static characteristics. J Pharm Sci. 2007;96(5):1282–1301. | ||
Dolovich MB, Jordana M, Newhouse MT. Methodologic considerations in mucociliary clearance and lung epithelial absorption measurements. Eur J Nucl Med. 1987;13(1):S45–S52. | ||
Ei-Arini SK, Leuenberger H. Modelling of drug release from polymer matrices: effect of drug loading. Int J Pharm. 1995;121(2):141–148. | ||
Davies NM, Feddah MR. A novel method for assessing dissolution of aerosol inhaler products. Int J Pharm. 2003;255(1):175–187. | ||
Singhvi G, Singh M. Review: in-vitro drug release characterization models. Int J Pharm Stud Res. 2011;2(1):77–84. |
 © 2016 The Author(s). This work is published and licensed by Dove Medical Press Limited. The
full terms of this license are available at https://www.dovepress.com/terms
and incorporate the Creative Commons Attribution
- Non Commercial (unported, 3.0) License.
By accessing the work you hereby accept the Terms. Non-commercial uses of the work are permitted
without any further permission from Dove Medical Press Limited, provided the work is properly
attributed. For permission for commercial use of this work, please see paragraphs 4.2 and 5 of our Terms.
© 2016 The Author(s). This work is published and licensed by Dove Medical Press Limited. The
full terms of this license are available at https://www.dovepress.com/terms
and incorporate the Creative Commons Attribution
- Non Commercial (unported, 3.0) License.
By accessing the work you hereby accept the Terms. Non-commercial uses of the work are permitted
without any further permission from Dove Medical Press Limited, provided the work is properly
attributed. For permission for commercial use of this work, please see paragraphs 4.2 and 5 of our Terms.