Back to Journals » Drug Design, Development and Therapy » Volume 10
Preparation and characterization of silymarin synchronized-release microporous osmotic pump tablets
Authors Zeng Q, Liu Z, Huang A, Zhang J, Song H
Received 1 July 2015
Accepted for publication 23 October 2015
Published 29 January 2016 Volume 2016:10 Pages 519—531
DOI https://doi.org/10.2147/DDDT.S91571
Checked for plagiarism Yes
Review by Single anonymous peer review
Peer reviewer comments 2
Editor who approved publication: Prof. Dr. Wei Duan
Qi-ping Zeng,* Zhi-hong Liu,* Ai-wen Huang, Jing Zhang, Hong-tao Song
Department of Pharmacy, Fuzhou General Hospital of Nanjing Command PLA, Fuzhou, People’s Republic of China
*These authors contributed equally to this work
Abstract: The pharmacological activity of herbal medicine is an overall action of each component in accordance with their original proportion. An efficient, sustained, and controlled-release drug delivery system of herbal medicine should ensure the synchronized drug release of each active component during the entire release procedure. In this study, silymarin (SM), a poorly soluble herbal medicine, was selected as a model drug to develop a synchronized-release drug delivery system: an SM microporous osmotic pump (MPOP) tablet. The SM was conjugated with phospholipid (SM phytosome complex, SM-PC) to improve the solubility, and the difference in the apparent octanol–water partition coefficient between the two components was significantly reduced. The dissolution rate of SM-PC was significantly higher than SM active pharmaceutical ingredients and was the same as that of the commercial SM capsule. The SM-PC was used to generate the MPOP tablet. SM was mixed with poly(ethylene) oxide and sodium chloride (an osmotic agent) to form the MPOP core, followed by coating with cellulose acetate and poly(ethylene) oxide to generate the SM MPOP. The results demonstrated that SM MPOP could synchronically and sustainably release the five active components within 12 hours (the similar coefficient f2 between two components was >65), and the average cumulative release rate was 85%. Fitting of the drug-release curve showed a zero-order release profile for SM MPOP. Our study showed that the phytosome complex technique combined with the MPOP system will achieve synchronized release of the various active components of herbal medicine and have potential applications in developing sustained release preparations in herbal medicine.
Keywords: silymarin, synchronized release, sustained release, phytosome complex, microporous osmotic pump tablets, dissolution test
Introduction
Herbal medicines are an important part of traditional Chinese medicine. In general, there are several active components in a single herbal medicine. In vivo, it is crucial that each active component be released synchronically in accordance with the original proportion in the herbal medicine to maintain the pharmacological activity of the herbal medicine;1,2 otherwise, its therapeutic efficacy will be greatly reduced. It is more difficult to design an effective herbal medicine with a sustained and controlled-release drug delivery system as compared with single component chemical drugs.3
Silymarin (SM), an extract from the fruit of Silybum marianum (L.) Gaertn, has been shown to have effects against free radicals, lipid peroxidation, oxygenase, and glutathione emptying and to reduce the level of blood lipids.4 Clinically, SM is used as a supporting treatment for toxic liver damage and chronic hepatitis.5,6 SM has also been proved to possess significant anti-cancerous properties toward liver and prostate cancers.7 SM is mainly composed of five active components, including taxifolin (TF), silychristin (SC), silydianin (SD), silybin (SB), and isosilybin (ISB).8 Currently, there are commercially available SM-loaded products such as Legalon®9 and Silipide®10 capsules. These capsules are a rapid-release dosage form, which needs to be taken three times a day for a long period of time.11,12 Therefore, these capsules have the shortcomings of easily missed doses and low medication compliance, especially for patients with chronic hepatitis who need long-term treatment with SM. It is important to develop a new controlled-release dosage form of SM to reduce the frequency of administration and the incidence of adverse effects. However, the traditional sustained-release dosage forms for chemical drugs are not applicable for herbal medicines such as SM. One important property of the sustained-release dosage forms for herbal medicines is the synchronized release of all active components in their original proportion in the herbal medicine.1
There have been studies focusing on the development of synchronized and sustained-release dosage forms of SM. Lu et al used SM, polyethylene glycol 6000 (PEG 6000), and poloxamer188 (PXM l88) to prepare the solid dispersion.1 They used glycerin monostearate as a framework to develop a cylindrical sustained-release drug delivery system. The similarity factor f2 for all five components was higher than 50, which means that their dose form achieved synchronous release. However, their system has the following defects: easy aging of the solid dispersion, excessive amounts of pharmaceutical aids (the drug-to-carrier ratio is 1:9), and incomplete release. In addition, their system has not been developed to a final dosage form.
In 2013, Xie et al used SM and polyvinylpyrrolidone K30 (PVP K30, a solubilizer) to prepare a solid dispersion, which was then mixed with poly(ethylene) oxide (PEO) and sodium chloride (an osmotic agent) to form the core tablet, followed by coating with cellulose acetate (CA) and PEO to generate the SM monolithic osmotic tablet. This dosage form can provide the synchronized release of the five active components of SM.13 However, there are still limitations in their monolithic osmotic tablet. First, as a poorly water-soluble drug, SM requires solubilizers to increase its dissolution and solubility and to ensure its complete release. PVP K30 was used as a solubilizer, but the amount was high, which makes the final drug load small. A 630-mg monolithic osmotic pump tablet contains only 10 mg SM. Second, the releasing pore of the monolithic osmotic tablet was created by laser drilling, which is a relatively expensive and complex process. Their dosage form is difficult to mass produce; therefore, an optimized synchronized-release dosage form of SM still remains to be developed.
The aim of this study was to develop an optimized synchronized-release dosage form of SM. We used a phytosome complex method to increase the solubility of SM. The SM phytosome complex (SM-PC) was then used to develop a new SM synchronized-release, microporous osmotic pump (MPOP) tablet. An in vitro release study demonstrated that the SM-PC MPOP could synchronically and sustainably release the five active components within 12 hours. The fitting of the drug-release curve showed a zero-order release profile for the SM MPOP.
Materials and methods
Materials
SM consists of 1.9% TF, 10.2% SC, 2.4% SD, 27.5% SB, and 5.0% ISB (Panjin Huacheng Pharmacy Co., Ltd, Panjin, People’s Republic of China). TF, SC, SD, SB, and ISB were purchased from Tauto Biotech Co., Ltd, Shanghai, People’s Republic of China. The following were purchased from the manufacturers indicated: soybean lecithin (Maxim Biotech Inc, San Francisco, CA, USA); sodium chloride, lactose, and mannitol (Chinasun Specialty Products Co., Ltd, Shanghai, People’s Republic of China); CA, dibutyl phthalate (DBP), magnesium stearate, and aerosol (Sinopharm Chemical Reagent Co., Ltd, Shanghai, People’s Republic of China); PEO (molecular weight [MW] 100 kDa, MW 300 kDa, MW 600 kDa), PEG 400, PEG 1500, PEG 4000, PVP K30 (Aladdin Industrial Corporation, Shanghai, People’s Republic of China); hydroxypropyl methylcellulose (HPMC K4M; Colorcon Coating Technology Limited, Shanghai, People’s Republic of China); SM capsules (Madaus GmbH, Germany); chromatographically pure methyl alcohol (Kefeng Chemical Reagent Co., Ltd, Shanghai, People’s Republic of China); SDS (sodium dodecyl sulfate) (Er-kang Pharmaceutical Co., Ltd, Changsha, People’s Republic of China); and n-caprylic alcohol (Kemiou Chemical Reagent Co., Ltd, Tianjin, People’s Republic of China).
The SM phytosome complex
Preparation methods
To prepare SM-PC, 4 g of SM was dissolved in 500 mL of acetone solution, followed by adding 7.2 g of soybean lecithin and then continually stirring in a 56°C water bath for 2 hours. The mixed liquid was then dried in a DZF-6051 vacuum oven (Shanghai Yiheng Scientific Instruments Co., Ltd, Shanghai, People’s Republic of China) dissolved in chloroform, and filtered by filter paper (Φ=7 cm, Hangzhou Special Paper Co., Ltd, Hangzhou, People’s Republic of China). The filtered solution was vacuum concentrated to approximately 50 mL, placed in a stainless steel disk, and vacuum dried at 45°C for 24 hours. The light yellow phytosome complex was obtained and sieved through a mesh size of 0.180 mm. The powder was stored at room temperature and kept in the dark until further usage.
The determination of the conjugate ratio of SM-PC
The conjugate ratio was calculated based on the following characteristics: the SM active pharmaceutical ingredients (SM APIs) are insoluble in chloroform, while both SM-PC and phospholipid are easily soluble in chloroform. The prepared SM-PC was dissolved in chloroform and filtered with a 0.45 μm microfiltration membrane. The precipitate was collected, dried, and weighed. To calculate the conjugate ratio, the formula shown below was used, where W represents the initial reagent quantity of SM and W1 represents the quantity of precipitate.
Conjugate ratio (%) = (W − W1)/W ×100% |
Determination of the five active components of SM by high-performance liquid chromatography
The levels of the five active components of SM were determined by an Agilent 1200 high-performance liquid chromatography (HPLC) (DAD detector, Agilent Technologies, Santa Clara, CA, USA)8 with a Kromasil 100-5C18 column (250 mm ×4.6 mm, 5 μm; AkzoNobel, Bohus, Sweden) and a detection wavelength of 288 nm at a flow rate of 1 mL min−1 at 40°C. The mobile phase is a gradient elution of methanol (solvent A) and 0.05% phosphoric acid (solvent B). The gradient ratio of the mobile phase is as follows: 0–4 minutes, 35% A, 65% B; 4–16 minutes, 40% A, 60% B; 16–23 minutes, 45% A, 55% B; 23–40 minutes, 50% A, 50% B. The recovery rate of the five components is 98.6%–103.0%, and the within-day and between-day relative standard deviations are 0.17%–1.86%, respectively.
The determination of solubility of SM-PC
Excessive amounts of SM API powder and SM-PC were used to generate the supersaturated solutions and were then shaken (5.5× g) in a DK-S24 Water Bath Orbital Shaker (Precision Testing Equipment Co., Ltd, Shanghai, People’s Republic of China) at 37°C for 24 hours. Then, the solutions were filtered through a 0.45 μm microfiltration membrane and subjected to HPLC analysis to determine the content of each active component of SM. Each sample was analyzed three times to calculate the solubility.
The determination of the apparent octanol–water partition coefficient of SM-PC
Five milliliters of SM/octanol (50 μg/mL) or SM-PC/octanol (200 μg/mL) solution were placed in a conical flask and then mixed with 45 mL of hydrochloric acid (0.1 M, pH 1.2), distilled water (pH 5.6), or an octanol-saturated phosphate buffer with a pH value of 4.5, 6.8, 7.5, or 8.0. The prepared sample was shaken in a DK-S24 Water Bath Orbital Shaker at 37°C, 5.5× g for 24 hours to achieve mutual saturation and equilibrium. The sample was then centrifuged at 1,500× g for 10 minutes to obtain an octanol and aqueous phase. One milliliter of the octanol phase, containing the SM/octanol or SM-PC/octanol solution, was taken and diluted with 9 mL of 60% methanol, followed by a determination of the drug concentration using HPLC analysis. The apparent octanol–water partition coefficient (log P) was calculated according to the following formula:
Cw = (Co − C) Vo/VW |
log P = Co/Cw |
where Co and C represent the drug concentration (μg/mL) in the aqueous phase before and after equilibrium, respectively, and Cw represents the drug concentration in the octanol phase after equilibrium. Vo and VW represent the volume (mL) of octanol and aqueous phase in the equilibrated solution, respectively.
Characterization of the SM-PC
X-ray powder diffraction
The SM, soybean lecithin, physical mixture, and phytosome complex were subjected to X-ray powder diffraction analysis (X’pert PRO MPD, Philips Analytical, Almelo, the Netherlands) using CuKα radiation, graphite monochromator diffraction monochromatization, a tube voltage of 50 kV, and a tube current of 200 mA.
Differential scanning calorimetry
Differential scanning calorimetry (DSC) analyses for SM, soybean lecithin, the physical mixture, and the phytosome complex were measured by an STA449C DSC instrument (NETZSCH, Selb, Germany) with a scanning speed of 5°C min−1 and a scanning range of 25°C–250°C.
Infrared spectroscopic analysis
The appropriate amounts of SM, soybean lecithin, and the physical mixture or phytosome complex were pressed in potassium bromide powder to form a pellet for the infrared spectrometer (Nicolet Avatar 330, Thermo Electron Corp., Madison, WI, USA) to obtain the infrared spectrum.
The preparation of MPOP release tablets of SM-PC
PEO and sodium chloride (an osmotic agent) were sieved through a mesh size of 0.180 mm. The SM-PC and the pharmaceutical aids were gradually and evenly mixed, followed by pressing the tablet with a 12 mm die (with a drug dose of 30 mg/tablet, a hardness of 40 N) to generate the core of the MPOP tablets. CA and PEO were dissolved in acetone–isopropyl alcohol (90:10, V/V) solvent to prepare the coating solution. The core tablets were coated in the coating pan at 45°C with a constant flow rate of 1.5 mL min−1 and a pressure of 0.5 MPa until the coating membrane formed (approximately 2 hours). The coated MPOP tablets were then dried at 40°C for 12 hours. Each tablet weighed 640 mg and contained approximately 30 mg of SM.
In vitro dissolution test
The in vitro dissolution test was based on the Pharmacopoeia of the People’s Republic of China 200014 with a rotation speed of 5.5× g in the paddle at 37°C. A total of 900 mL of phosphate buffer solution (pH 7.5, including 0.5% SDS) was used as the dissolution solution. Ten-milliliter samples were collected and filtered with a 0.45 μm microfiltration membrane for HPLC analysis at different time points.
The similarity factor f2 from the following equation was used to evaluate the synchronization of release between the active components in the SM.15,16
|
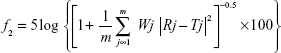
Rj and Tj are the cumulative dissolution rates of the referenced sample and the tested sample at time j, respectively; m is the total sampling times; Wj is the weight coefficient. The f2 value calculated is between 0 and 100. When the f2 value is higher than 50, it can be concluded that the dissolution behavior of the two components is similar.
Drug-release curve fitting
Currently, the commonly used model equations for the drug-release curve of sustained and controlled release preparations include zero-order model (Mt/M∞=kt), first-order models (Mt/M∞=1-e−kt), Higuchi model (Mt/M∞=kt1/2) and Ritger-Peppas model (Mt/M∞=ktn). Mt is the amount of drug released at time t; M∞ is the maximum amount of drug released; and k is the drug-release rate constant. By using the SPSS 16.0 software (IBM, Armonk, NY, USA), the cumulative dissolution rate (Q) of the five active components of SM MPOP tablets within 12 hours and the dissolution time (t) were set as the Y- and X-axes, respectively. The plots were fitted into the aforementioned models to evaluate the release characteristics. A higher r value indicates a stronger correlation between the drug release and the fitting model.
The effect of osmotic pressure of the dissolution medium on the drug release
The dissolution behavior of SM MPOP tablets in different dissolution mediums, including distilled water (pH 5.6) and different concentrations of sodium chloride solution (0.15, 0.30, 0.55, and 0.70 mol L−1), was assessed by measuring the osmotic pressure molar concentration by using an osmotic molar concentration detector (SMC-30C, Apparatus of Tianhe Analytical Instrument Co., Ltd, Tianjin, People’s Republic of China).
Statistical analysis
The percentages of the release profiles of the drug groups were compared with the Mann–Whitney U test. The statistical significance level for all tests was set at a P-value <0.05.
Results and discussion
Preparation of SM-PC
SM is a poorly water-soluble drug. To improve its solubility, SM was conjugated with phospholipid to form an SM-PC. Two different sources of phospholipid were used for conjugation, and we found that there is no significant difference regarding the conjugate ratio between the soy lecithin and the egg yolk lecithin as a source of the phospholipid (data not shown). We chose soy lecithin because the phospholipid complex prepared from the egg yolk lecithin was too viscous, which is disadvantageous to the preparation of MPOP tablets.
Through a central, composite, design-response surface optimization test (data not shown), the optimal procedure to prepare SM-PC was determined. The proportion of SM and soybean lecithin was 1:1.8; the reaction temperature was 56°C; and the concentration of SM API was 8.0 mg mL−1. Under this condition, the conjugate ratio of SM-PC was 95.15%.
Characterization of SM-PC
X-ray powder diffraction
X-ray powder diffraction was used to characterize the physical characteristics of SM and SM-PC. As shown in Figure 1, SM API possessed continuous diffraction peaks at 18°C–32°C (Figure 1A), whereas the soybean lecithin (phospholipid) had no diffraction peak (Figure 1B). These peaks still could be observed in the physical mixture of SM and soybean lecithin (Figure 1C), whereas they disappeared from the SM-PC data (Figure 1D). The data indicated that SM was bonded with the polar end of the phospholipid after electron transfer, leading the SM and phospholipid into a highly dispersed state, which made the crystal property of SM inconspicuous. Due to its amorphous status, SM-PC had a higher free energy, molecular momentum, and dissolution ability than SM.
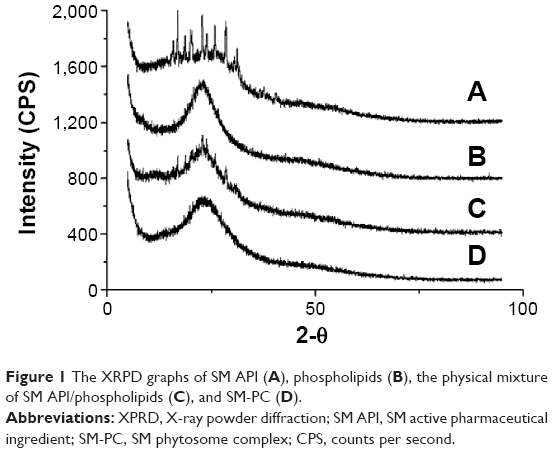 | Figure 1 The XRPD graphs of SM API (A), phospholipids (B), the physical mixture of SM API/phospholipids (C), and SM-PC (D). |
Differential scanning calorimetry
Next, we further used DSC to characterize the physical property of SM and SM-PC. As shown in Figure 2, SM API had endothermic peaks at 106.7°C, 138.5°C, and 223.5°C, which were not prominent because SM is a multicomponent mixture (Figure 2A). Phospholipids had three endothermic peaks at 104.3°C, 163.9°C, and 202.5°C (Figure 2B). In the thermogram of SM-PC, the peaks of SM and phospholipid all disappeared (Figure 2D). It is presumable that after SM bonding with the polar end of PC, SM-PC is in an amorphous status.
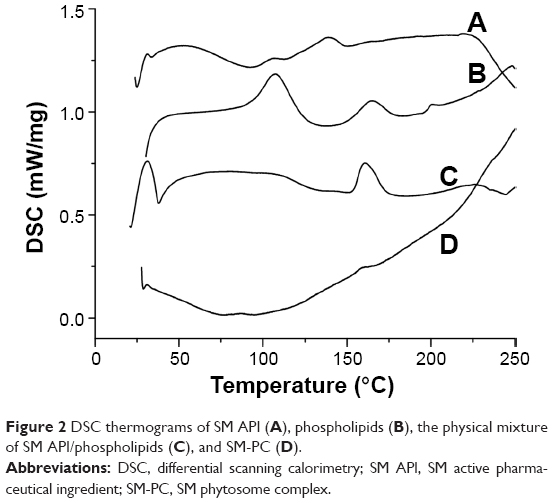 | Figure 2 DSC thermograms of SM API (A), phospholipids (B), the physical mixture of SM API/phospholipids (C), and SM-PC (D). |
Infrared spectroscopy
To further confirm whether a new compound was generated from the combination of SM and soybean lecithin, infrared spectroscopy was employed. As shown in Figure 3, the spectrum of the physical mixture (Figure 3C) was substantially the superimposition of the major peaks of the SM API (Figure 3A) and phospholipid (Figure 3B). All the peaks in the spectrum of SM-PC could correspond to the absorption peaks in the SM API and phospholipid (Figure 3D), which had no significant difference as compared with the physical mixture. The data indicated that the SM-PC did not generate new chemical bonds. From the perspective of structure, the positive charge of the phospholipids quaternary ammonium and negative charge of the SM phenolic hydroxyl oxygen and carbonyl oxygen could generate dipole–dipole forces to make two molecules bind to form the SM-PC.
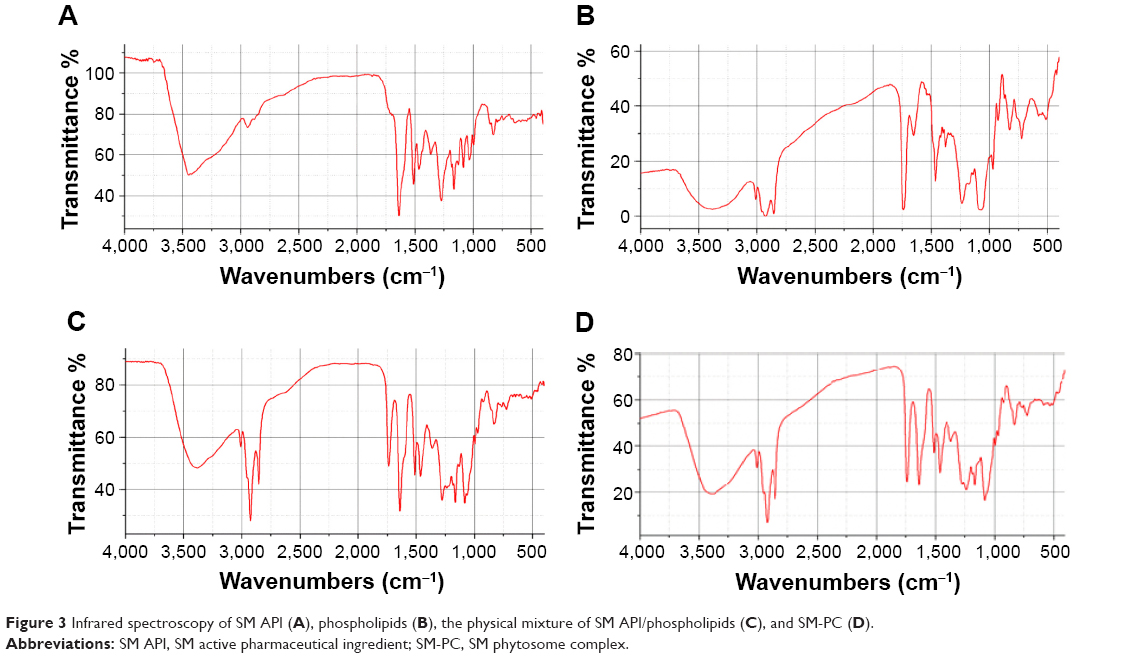 | Figure 3 Infrared spectroscopy of SM API (A), phospholipids (B), the physical mixture of SM API/phospholipids (C), and SM-PC (D). |
The determination of the solubility of SM-PC
To see if the solubility of SM was improved by phytosome complex, the solubility of SM API and SM-PC was determined. Table 1 shows that the solubility increased as the pH value increased, and the addition of surfactant (SDS) also significantly increased its solubility, which provided the basis for the selection of the dissolution medium. Except for the TF, the solubility of the other four active components (SC, SD, SB, and ISB) of SM-PC was significantly improved as compared with SM. In addition, the smaller their original solubility, the greater the improvement in solubility of the complex. Therefore, the use of phytosome complex technology not only improved the solubility of poorly water-soluble drugs, but also largely reduced the solubility differences between each component in SM. This improvement may be related to the amorphous characteristics of the complex and the solubilization from the phospholipid micelle formed in aqueous solution.
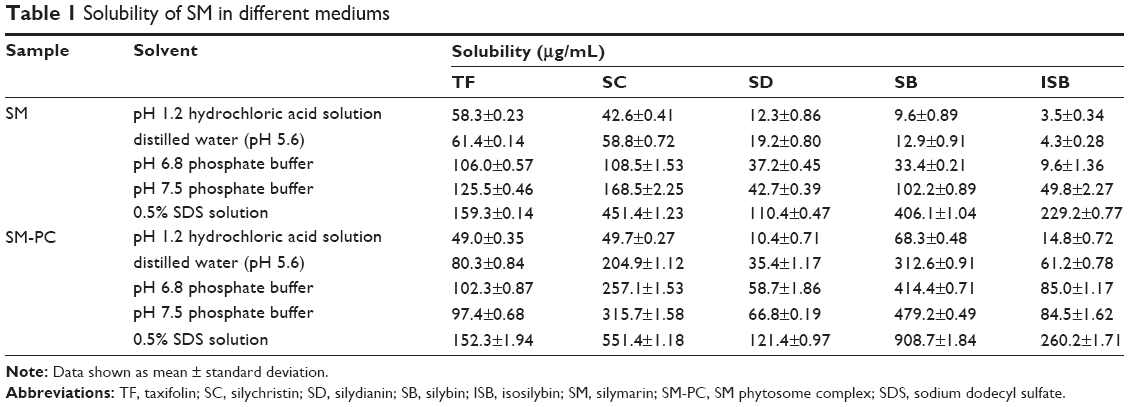 | Table 1 Solubility of SM in different mediums |
The determination of the apparent octanol–water partition coefficient of SM-PC
Generally speaking, the drugs with appropriate lipid-soluble and water-soluble characteristics would easily pass through the lipid bilayer of the cell membrane to exert their therapeutic effects. The apparent octanol–water partition coefficient, log P, is an indicator for evaluating the absorbability of drugs. A study showed that the drugs with a log P between 1 and 2 are easily absorbed.17 As shown in Table 2, the log P of the five active components of SM was less than 1 in the phosphate buffers with different pH values, suggesting their poor permeability and absorbability throughout the gastrointestinal tract. Compared with SM, the log P values of the five components of SM-PC all increased by approximately three to five times in various buffers. This improvement may be due to the polar groups of the drug and phospholipid interacting and inhibiting the free rotation of the bond in the drug molecule. However, the two long fatty chains of phospholipids did not participate in the complex reaction and were freely rotatable, wrapping the polar part of the phospholipids formed a lipophilic surface, which gives the SM-PC a strong, fat-soluble characteristic. This is conducive to drug retention in the lipid membrane of cells, thereby enhancing the absorbability of the drug.
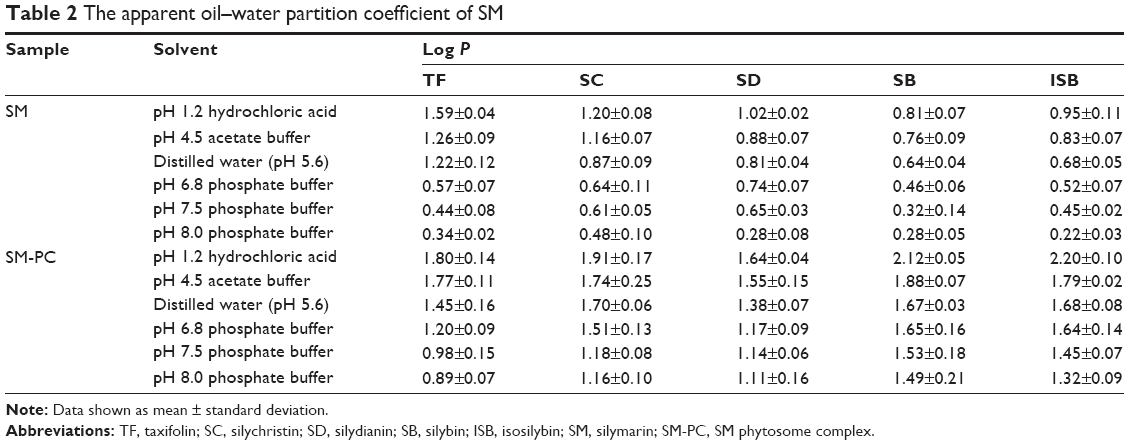 | Table 2 The apparent oil–water partition coefficient of SM |
In vitro dissolution test for SM-PC
Since the solubility of SM-PC was significantly improved, we further conducted the in vitro dissolution test to see if the dissolution ability was indeed improved in SM-PC. As shown in Table 1, the solubility of the five components of SM or SM-PC has been more improved in phosphate buffer pH 7.5 and 0.5% SDS solution than in pH 1.2. Therefore, we chose the phosphate buffer pH 7.5 with 0.5% SDS as a solution for the in vitro dissolution test. The data showed that the five active components of SM API had lower dissolutions (30%–60% at 60 minutes, Figure 4A), while for SM-PC, the five active components had nearly 90% dissolution at 60 minutes (Figure 4B). The dissolution rates of the five components of SM-PC (Figure 4C) were all significantly higher than those of SM API at every time point (P<0.05, Table S1), indicating that the phytosome complex significantly improved the dissolution of SM.
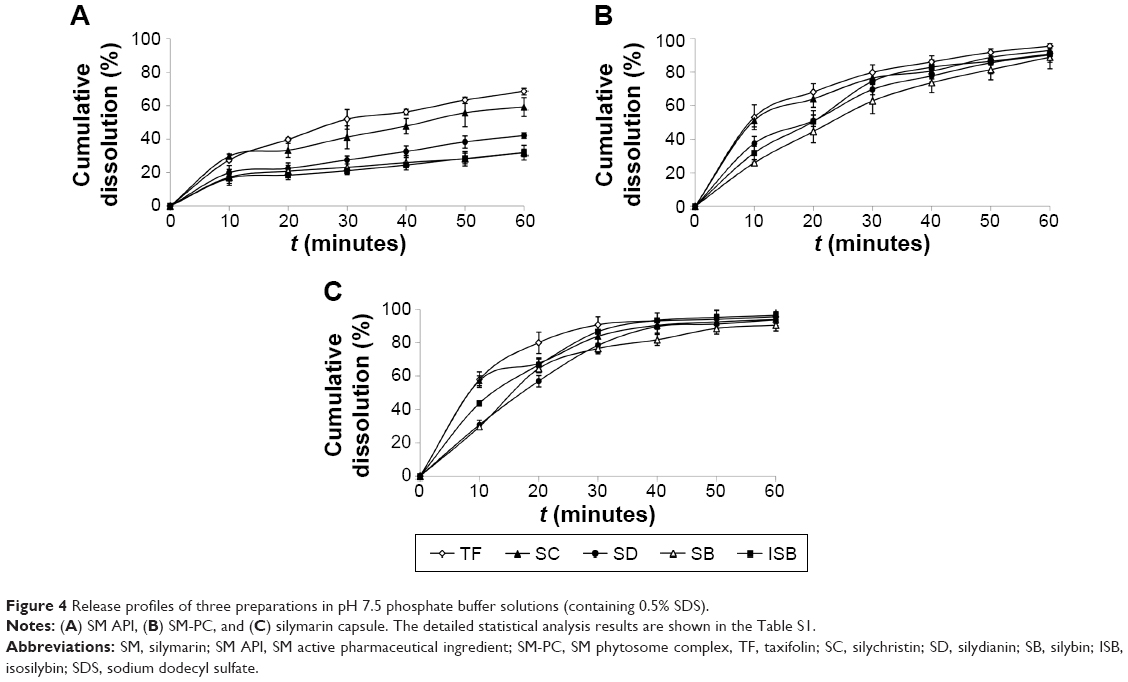 | Figure 4 Release profiles of three preparations in pH 7.5 phosphate buffer solutions (containing 0.5% SDS). |
Optimization of the SM MPOP tablet composition
Next, we utilized the SM-PC to generate the SM MPOP tablet. The design and drug-release process are shown in Figure 5. The key concept for synchronized release of this system is that when the water enters the MPOP tablet core through the semipermeable membrane, the drugs in the tablet core are gradually dissolved, which causes a higher osmotic pressure. The osmotic pressure becomes a force to trigger the release of drugs from the tablet core. The releasing force (the osmotic pressure) is consistent for all active components; therefore, the release rate of all components should also be consistent.
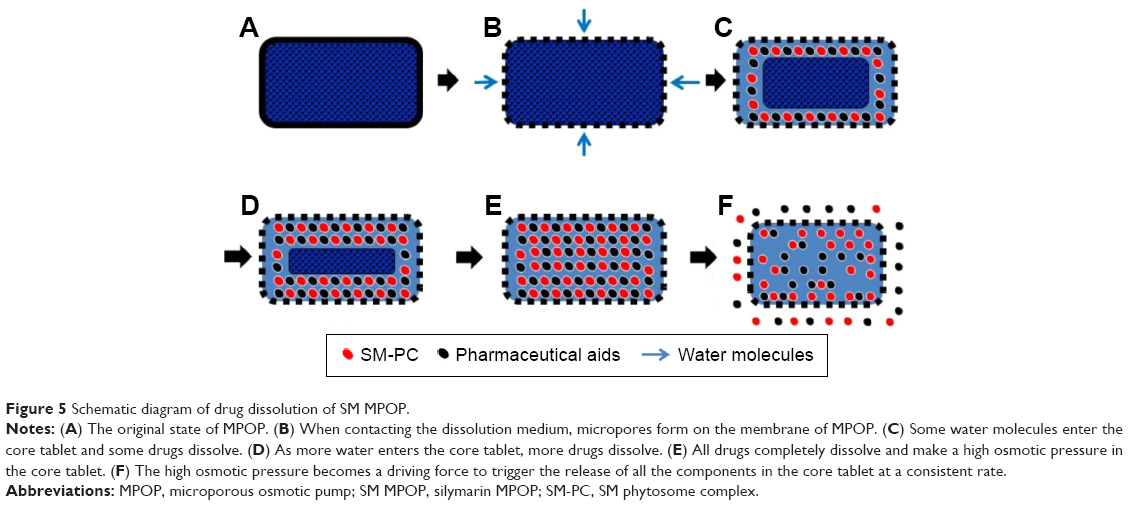 | Figure 5 Schematic diagram of drug dissolution of SM MPOP. |
To optimize the composition of the SM MPOP tablet, we conducted a series of single factor investigations. Using the dissolution ability and f2 value as evaluation indicators, single factor investigations were conducted on the type and amount of the suspending agent (PEO); type and amount of osmotic agent (sodium chloride, lactose, and mannitol); amount of binder (PVP); amount of plasticizer for coating (DBP); type and amount of porogen (PEG); and the tablet coating thickness (CA). According to the results of single factor investigations (Zeng, unpublished data, 2014), we chose the following factors which had greater effects on drug dissolution: the amount of PEG 1500 (A), the amount of sodium chloride (B), and coat weight gain (C) to design an L9(34) orthogonal experiment analysis for the composition of the SM MPOP tablet (Table 3). To better reflect the zero-order release characteristics of SM MPOP and to ensure a more complete release at 12 hours, the following two conditions were used in the orthogonal experiment analysis: 1) 90% was used as a standard for the drug-release rate within 12 hours, F12 and; 2) 1.00 was used as a standard for the correlation coefficient, r, from the linear regression of drug dissolution rate at 0–12 hours and the release curve at time t. The weight coefficient of the dissolution rate within 12 hours was set to 1, and the weight coefficient of the correlation coefficient r was set to 2. The composite score L was calculated by the following formula:
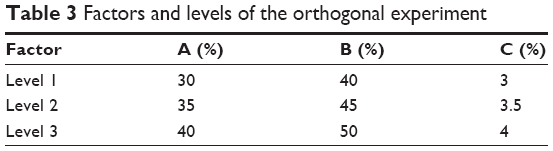 | Table 3 Factors and levels of the orthogonal experiment |
L = |F12 −90%| ×100×1+ |r −1| ×100×2 |
A smaller L indicates the drug has a better dissolution rate and is closer to a zero-order release profile. In addition, SB was used as an indicator component to optimize the manufacturing process of SM MPOP since it is the main component and has the highest levels among the five active components in SM.
The orthogonal experiment results are shown in Table 4. K1, K2, and K3 represented the average scores of L values corresponding to level 1, level 2, and level 3. The smaller the K value is, the closer the drug release would be to the expected value. R represented the range of K values in the corresponding factor. A larger R value indicated a greater impact factor. Thus, the order of each impact factor was C>A>B. The results of the variance analysis are shown in Table 5. A larger F value indicates a more significant difference. The data showed that factor C had a significant effect on drug dissolution. The optimal composition for SM MPOP was A3B3C2, ie, 40% PEG 1500, 50% sodium chloride, 3.5% coating weight gain.
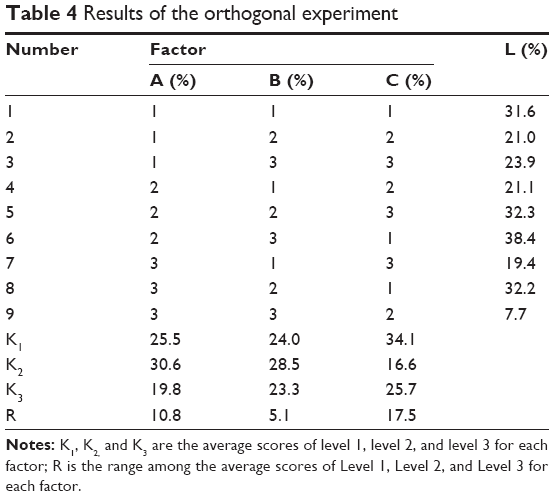 | Table 4 Results of the orthogonal experiment |
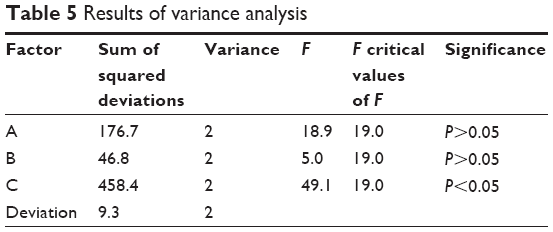 | Table 5 Results of variance analysis |
The verification test for SM MPOP tablets
The optimized composition was then used to produce three batches of SM MPOP tablet samples (Batch numbers: 130702, 130703, and 130704). The in vitro dissolution test was conducted to evaluate the quality of the produced SM MPOP. As shown in Table 6, the f2 values of all five active components among the three batches of samples were all greater than 50, indicating a good reproducibility of the manufacturing process.
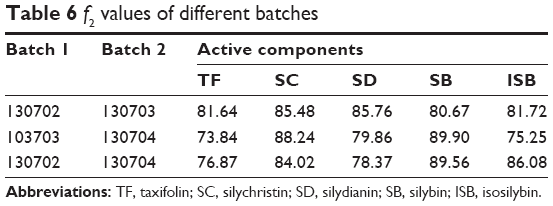 | Table 6 f2 values of different batches |
Curve fitting for drug dissolution of SM MPOP
To address the drug dissolution pattern, we performed a curve fitting for drug dissolution of SM MPOP. As shown in Table 7, the release of the five active components in SM-PC MPOP was closer to a zero-order release equation, followed by the first-order equation and the Higuchi equation. The data indicated that the release pattern of the five components in SM-PC MPOP tablets all belong to zero-order release, which could stabilize the blood drug level, improve the efficacy, and reduce the adverse effects of the drug.
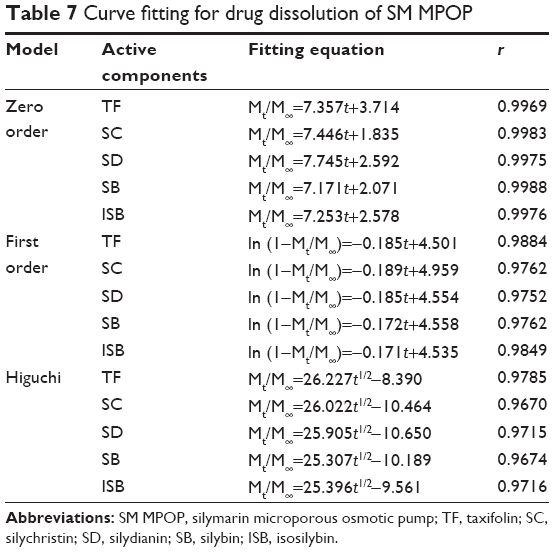 | Table 7 Curve fitting for drug dissolution of SM MPOP |
Effect of the osmotic pressure of the release medium on drug release
Next, we addressed whether the osmotic pressure played a crucial role in the drug release of the active components in SM-PC MPOP. In Table 8, as the NaCl concentration increased, ie, as the osmotic pressure of the dissolution medium increased, the drug dissolution rate decreased. Taking the main component SB, for example, the values of the osmotic pressure difference between the inner/outer membrane (Δπ) and the dissolution rate (K) were used for a linear regression analysis to obtain the regression equation:
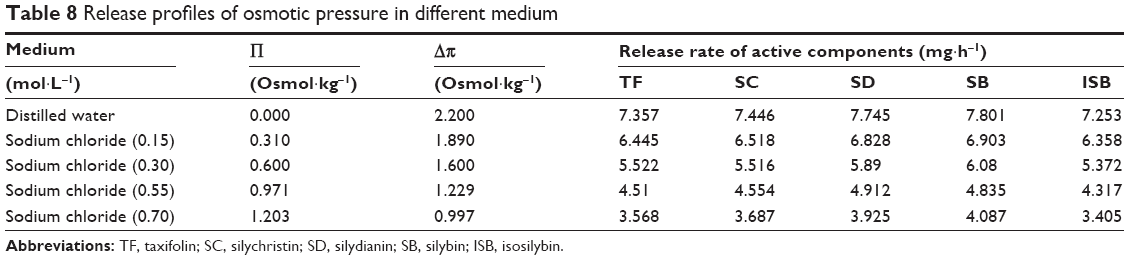 | Table 8 Release profiles of osmotic pressure in different medium |
K =3.0837× (Δπ) +1.0776 (r=0.9986) |
when Δπ = 0 (ignoring the drug dissolution through the osmotic pressure mechanism), the K release rate (K=1.0776) of the main component SB would be approximately 13.8% of that in water (K=7.801). This means that the drug dissolution via non-osmotic pressure mechanisms, such as diffusion, accounts for 13.8% of the total dissolution, while the dissolution via osmotic pressure mechanisms accounts for 86.2%, indicating that the osmotic pressure mechanism was dominant in the dissolution mechanism.
Comparison of the characteristics of three SM delivery systems in vitro
To further investigate the synchronized-release control of the five components in SM MPOP tablets, three dosage forms were designed to evaluate their release behavior: 1) MPOP tablets of SM-PC; 2) MPOP tablets of SM API (the preparation methods and other pharmaceutical aids were the same as for 1); and 3) the SM-PC was used to make the hydrophilic matrix tablet with HPMC K4M as a framework (SM-PC HPMC tablets). Each tablet weighing 600 mg contained approximately 30 mg of SM.
The results are shown in Figure 6 and Table 9. Dose form A (SM-PC MPOP tablet) possessed a higher dissolution rate and synchronized release of each component. Dose form B (SM API MPOP) displayed synchronized release of the five components, but had a lower dissolution rate (approximately 50%). After comparing these two dose forms, it was found that the poorly soluble drug SM should be prepared after solubilization to further enhance its bioavailability. The five components of both dose forms exhibited good synchronization in the release medium (f2>50), which indicated that the dose form of drug had no effect on the property of synchronization release in the developed MPOP system. This is according to the primary osmotic pump formula by Theeuwes: dm/dt = A LP (σΔπ + ΔP) CS/h. In this formula, dm/dt is the drug-release rate; A is the membrane area; LP is the mechanical penetration coefficient; σ is the reflection coefficient of membrane for substance; ΔP and Δπ are the difference in the osmotic pressure and hydrostatic pressure between the inner and the outer membrane, respectively; and CS is the solution concentration of drug forming in the core tablet.18 Therefore, in the osmotic pump drug delivery system, when the release medium passed through the semipermeable membrane, the SM components received the same driving force from the osmotic pressure (ΔP), which is generated when the drug becomes a saturated solution in the tablet core. Thus, each component could maintain a consistent release rate. Dose form C was a hydrophilic matrix tablet of SM-PC, with a high release rate of each component, but in a lower synchronous release pattern. Compared with dose form A, the release mechanism of the SM-PC HPMC tablet is mainly bulk erosion and diffusion, which was different from the osmotic mechanism of SM-PC MPOP. There were great differences between the solubilities of the five components; therefore, their synchronized release could not be achieved. The data indicated that the SM-MPOP could possess both high dissolution rates and synchronized release, which provides a good dose form for SM.
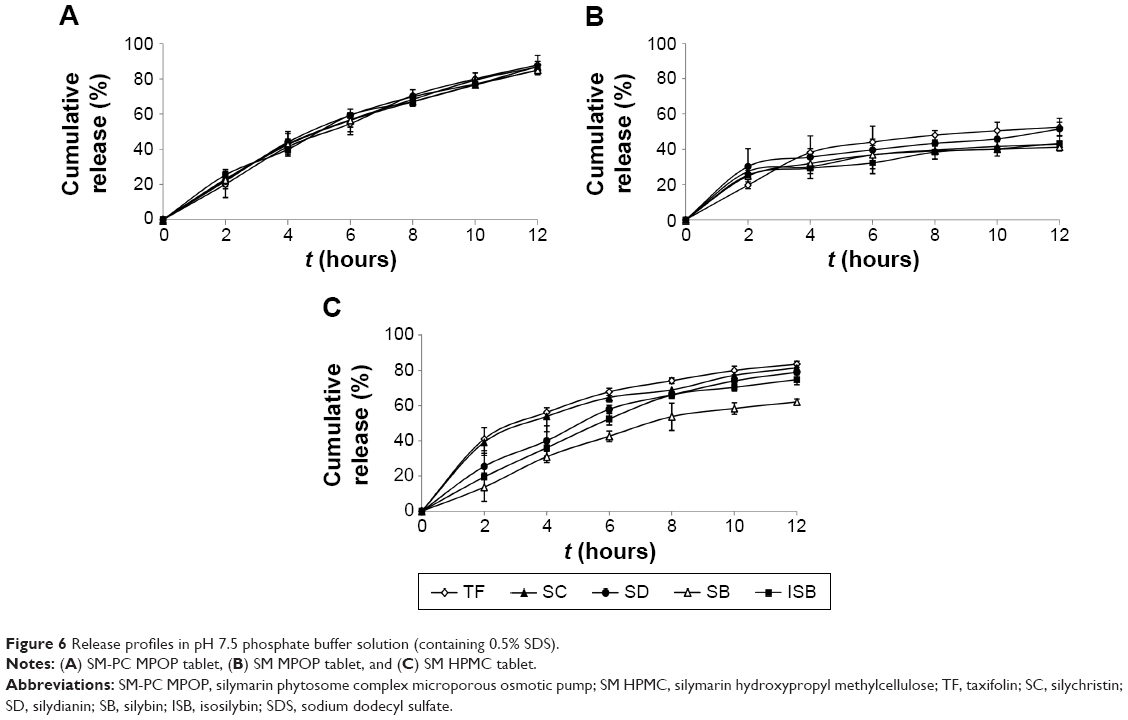 | Figure 6 Release profiles in pH 7.5 phosphate buffer solution (containing 0.5% SDS). |
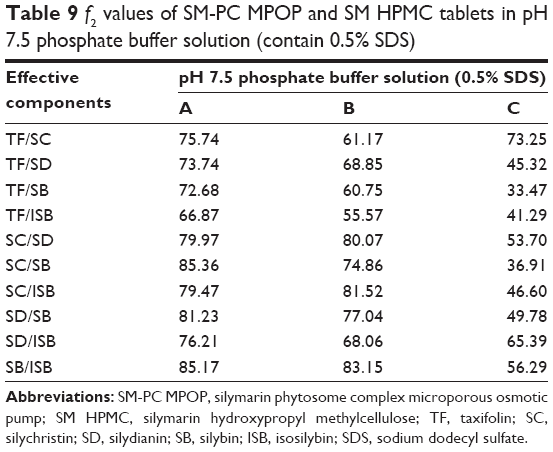 | Table 9 f2 values of SM-PC MPOP and SM HPMC tablets in pH 7.5 phosphate buffer solution (contain 0.5% SDS) |
Conclusion
SM is a typical, poorly water-soluble drug, and new manufacturing technologies are needed for solubilization to increase the dissolution rate and bioavailability. At present, the solubilization technologies of SM mainly include the solid dispersion technology,19 self-microemulsion technology, and phytosome complex technology.20,21 Among them, the drug-loading dose of both the solid dispersion and the self-microemulsion is too small, which cannot meet the preparation requirements of high-dose drugs. The phytosome complex not only has a low drug-to-carrier ratio (usually 1:1–1:2), but also makes the drug molecules easily pass through a biomembrane and be absorbed.22 Therefore, it has obvious advantages in the solubilization of sustained-release preparations of poorly water-soluble drugs. This study found that after conjugation with PC, the solubility and apparent octanol–water partition coefficient of the five active components in SM were all improved, which was consistent with the commercially available Legalon (Figure 5). Furthermore, the difference in solubility of the five components was significantly reduced, that is, the solubilization effect of the components with smaller solubility was more obvious.
The SM-PC was used to generate an MPOP tablet. Our results suggested that the combination of the phytosome complex and MPOP technology could achieve the synchronized release of the five active components in SM. It also indicates that the synchronized release of multiple components in herbal medicines could be achieved by the MPOP system with the assistance of solubilization. In future, we will conduct in vivo pharmacokinetic tests in Beagle dogs for the SM-PC MPOP tablet used in this study to further investigate the in vivo pharmacokinetics of each active component, as well as to perform an in vitro–in vivo correlation analysis.
Acknowledgments
This study was supported by the National Natural Science Foundation of China (No 81073064) and Natural Science Foundation of Fujian Province of China (No 2015J01491).
Author contributions
All authors made substantial contributions to conception and design, Dr Qi-ping Zeng and Zhi-hong Liu performed research and acquired data. Dr Ai-wen Huang and Dr Jing Zhang undertook analysis and interpretation of data. All authors took part in either drafting the article or revising it critically for important intellectual content. All authors gave final approval of the version to be published, and agree to be accountable for all aspects of the work.
Disclosure
The authors report no conflicts of interest in this work.
References
Lu C, Lu Y, Chen J, Zhang W, Wu W. Synchronized and sustained release of multiple components in silymarin from erodible glyceryl monostearate matrix system. Eur J Pharm Biopharm. 2007;66:210–219. | ||
Williamson EM. Synergy and other interactions in phytomedicines. Phytomedicine. 2001;8:401–409. | ||
Devi VK, Jain N, Valli KS. Importance of novel drug delivery systems in herbal medicines. Pharmacogn Rev. 2010;4:27–31. | ||
Altaei T. Protective effect of silymarin during coronary artery bypass grafting surgery. Exp Clin Cardiol. 2012;17:34–38. | ||
Stickel F, Schuppan D. Herbal medicine in the treatment of liver diseases. Dig Liver Dis. 2007;39:293–304. | ||
Ha HL, Shin HJ, Feitelson MA, Yu DY. Oxidative stress and antioxidants in hepatic pathogenesis. World J Gastroenterol. 2010;16:6035–6043. | ||
Snima KS, Arunkumar P, Jayakumar R, Lakshmanan VK. Silymarin encapsulated poly(D,L-lactic-co-glycolic acid) nanoparticles: a prospective candidate for prostate cancer therapy. J Biomed Nanotechnol. 2014;10:559–570. | ||
Ding T, Tian S, Zhang Z, et al. Determination of active component in silymarin by RP-LC and LC/MS. J Pharm Biomed Anal. 2001;26:155–161. | ||
Cordero-Pérez P, Torres-González L, Aguirre-Garza M, et al. Hepatoprotective effect of commercial herbal extracts on carbon tetrachloride-induced liver damage in Wistar rats. Pharmacogn Res. 2013;5:150–156. | ||
Bares JM, Berger J, Nelson JE, et al. Silybin treatment is associated with reduction in serum ferritin in patients with chronic hepatitis C. J Clin Gastroenterol. 2008;42:937–944. | ||
Dixit N, Baboota S, Kohli K, Ahmad S, Ali J. Silymarin: a review of pharmacological aspects and bioavailability enhancement approaches. Indian J Pharmacol. 2007;39:172. | ||
Hoh C, Boocock D, Marczylo T, et al. Pilot study of oral silibinin, a putative chemopreventive agent, in colorectal cancer patients: silibinin levels in plasma, colorectum, and liver and their pharmacodynamic consequences. Clin Cancer Res. 2006;12:2944–2950. | ||
Xie Y, Lu Y, Qi J, et al. Synchronized and controlled release of multiple components in silymarin achieved by the osmotic release strategy. Int J Pharm. 2013;441:111–120. | ||
State Pharmacopoeia Commission of the People’s Republic of China. Pharmacopoeia of the People’s Republic of China. Volume I. Beijing: Chemical Industry Press, China; 2000. | ||
Shah VP, Tsong Y, Sathe P, Liu JP. In vitro dissolution profile comparison – statistics and analysis of the similarity factor, f2. Pharm Res. 1998;15:889–896. | ||
Polli JE, Rekhi GS, Augsburger LL, Shah VP. Methods to compare dissolution profiles and a rationale for wide dissolution specifications for metoprolol tartrate tablets. J Pharm Sci. 1997;86:690–700. | ||
Lin JH, Lu AY. Role of pharmacokinetics and metabolism in drug discovery and development. Pharmacol Rev. 1997;49:403–449. | ||
Herrlich S, Spieth S, Messner S, Zengerle R. Osmotic micropumps for drug delivery. Adv Drug Deliv Rev. 2012;64:1617–1627. | ||
Sun N, Zhang X, Lu Y, Wu W. In vitro evaluation and pharmacokinetics in dogs of solid dispersion pellets containing Silybum marianum extract prepared by fluid-bed coating. Planta Med. 2008;74:126–132. | ||
Yan-yu X, Yun-mei S, Zhi-peng C, Qi-neng P. Preparation of silymarin proliposome: a new way to increase oral bioavailability of silymarin in beagle dogs. Int J Pharm. 2006;319:162–168. | ||
Kidd P, Head K. A review of the bioavailability and clinical efficacy of milk thistle phytosome: a silybin-phosphatidylcholine complex (Siliphos). Altern Med Rev. 2005;10:193–203. | ||
Pawar HA, Bhangale BD. Phytosome as a novel biomedicine: a microencapsulated drug delivery system. J Bioanal Biomed. 2015;7:006–012. |
Supplementary material
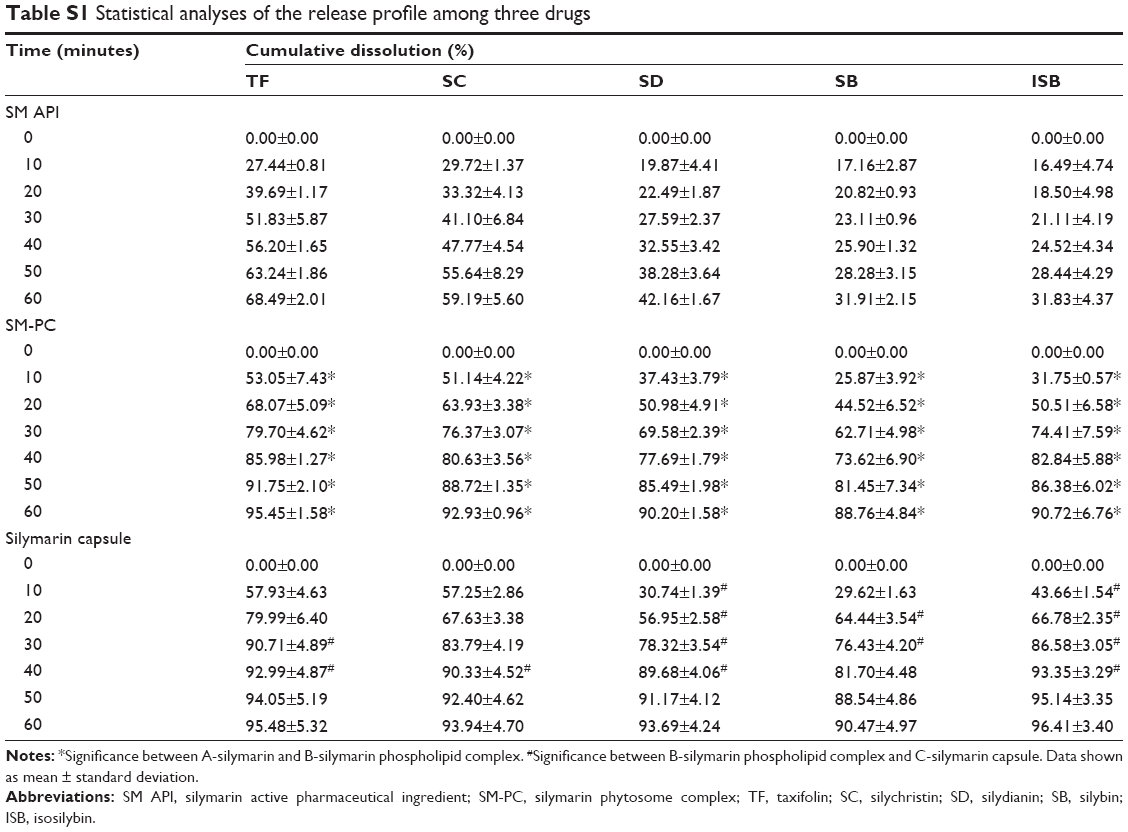 | Table S1 Statistical analyses of the release profile among three drugs |
 © 2016 The Author(s). This work is published and licensed by Dove Medical Press Limited. The
full terms of this license are available at https://www.dovepress.com/terms
and incorporate the Creative Commons Attribution
- Non Commercial (unported, 3.0) License.
By accessing the work you hereby accept the Terms. Non-commercial uses of the work are permitted
without any further permission from Dove Medical Press Limited, provided the work is properly
attributed. For permission for commercial use of this work, please see paragraphs 4.2 and 5 of our Terms.
© 2016 The Author(s). This work is published and licensed by Dove Medical Press Limited. The
full terms of this license are available at https://www.dovepress.com/terms
and incorporate the Creative Commons Attribution
- Non Commercial (unported, 3.0) License.
By accessing the work you hereby accept the Terms. Non-commercial uses of the work are permitted
without any further permission from Dove Medical Press Limited, provided the work is properly
attributed. For permission for commercial use of this work, please see paragraphs 4.2 and 5 of our Terms.