Back to Journals » Clinical Ophthalmology » Volume 11
Preoperative measurement vs intraoperative aberrometry for the selection of intraocular lens sphere power in normal eyes
Authors Davison JA, Potvin R ![]()
Received 26 February 2017
Accepted for publication 19 April 2017
Published 17 May 2017 Volume 2017:11 Pages 923—929
DOI https://doi.org/10.2147/OPTH.S135659
Checked for plagiarism Yes
Review by Single anonymous peer review
Peer reviewer comments 2
Editor who approved publication: Dr Scott Fraser
James A Davison,1 Richard Potvin2
1Wolfe Eye Clinic, Marshalltown, IA, 2Science in Vision, Akron, NY, USA
Purpose: This study aimed to assess the value of intraoperative aberrometry (IA) in determining the intraocular lens (IOL) sphere power in eyes with no previous ocular surgery.
Patients and methods: We conducted a retrospective review of patients who underwent uncomplicated cataract surgery where standard preoperative (Preop) measurements and IA were performed. Calculated IOL sphere powers and postoperative refractions, both actual and theoretical, were compared based on the measurement method and lens type; lens types included multifocal, toric and aspheric single-vision non-toric IOLs.
Results: A total of 160 eyes of 112 patients were analyzed. The Preop lens power calculated was the same as the IA lens power 46% of the time, though this percentage was lower for multifocal IOLs. Across all lens types, there was a statistically significant bias (chi-square test, P<0.01) toward the IA method suggesting a lower powered lens. Actual postoperative refractive errors were not statistically significantly different when categorized by measurement method. Calculated errors by measurement method showed no statistically significant differences in expected outcomes. There were 63 cases where the Preop calculation and the intraoperative aberrometer calculation differed by 0.5 D. In 56% (35/63) of these cases, the IA result was a better option, and in 44% (28/63) of cases, the Preop calculation was better; this was not statistically significantly different from random expectation (50/50, P=0.53). In the three cases where calculated powers differed by 1.5 D, there appeared to be a positive effect of adjusting the Preop power toward the IA power.
Conclusion: The use of IA for the determination of sphere power in eyes with no previous ocular surgery does not appear to improve overall expected clinical outcomes, but it may be helpful in cases where the difference between IA and Preop calculations is high.
Keywords: ORA, refraction, prediction error, IOL power calculation
Introduction
One of the primary challenges in preoperative (Preop) planning for intraocular lens (IOL) implantation is acquiring accurate biometric data. One of the major sources of error is an imprecise corneal power measurement; this is especially true if the patient suffers from corneal irregularity due to an ocular disease or previous corneal surgery. Another challenge is that most corneal measurement devices do not measure the posterior corneal astigmatism, and this can result in poor outcomes, especially after toric lens implantation.1,2 Additionally, a dense cataract may inhibit some biometers and keratometers from acquiring accurate data. As such, a measurement method that does not rely on the corneal power or the optical limitations set by the density of the cataract would be expected to improve results. A technique designed to overcome such barriers is intraoperative aberrometry (IA). An intraoperative aberrometer uses wavefront measurement technology to measure the biometry of the eye during cataract surgery; the measurement is made after the crystalline lens has been removed. The device then suggests an IOL power based on the aberrations of the aphakic eye.
One of the most studied intraoperative aberrometers is the ORA™ System (Alcon Laboratories, Inc., Fort Worth, TX, USA). It is based on the technique of Talbot–Moiré interferometry. Studies suggest that taking the aberrometry measurements from the ORA system into account before finalizing toric IOL power can improve outcomes.3–5 Using ORA was shown to be a valuable resource, providing good outcomes for patients who had previous corneal refractive surgery, especially when historic data were not available.6,7 One such study looked specifically at patients implanted with a toric lens in cases with previous keratorefractive surgery and noted promising results when using ORA.8
There are several potential issues with the use of IA. The fact that measurements taken during surgery do not reflect the postoperative state of the eye can introduce inaccuracies in power calculation.9 In addition, the biometry of the eye can be affected at the time of surgery. Potential causes of this include patient factors (such as eyelid squeezing, eye motion, healing), surgical equipment or devices (such as the eyelid speculum or use of certain ophthalmic viscosurgical devices) and/or intraoperative manipulation (such as stromal hydration); these factors can change intraocular pressure and axial length, corneal thickness and the refractive index of the anterior chamber.9–11 Studies suggest that these operative variables may be adequately controlled, especially with increased surgeon experience using IA.3,4 A more fundamental concern is the lack of measurement of the expected lens position (ELP), which is a significant factor affecting the power of an IOL. In addition, determining IOL power requires an aphakic IOL formula, built into the aberrometer. The accuracy of the formula will again influence the results.
To the best of our knowledge, there is only one study in the literature that evaluated IA for the determination of sphere power in normal eyes, and this was related to a device incorporating Hartmann–Shack technology. Results from that study suggest that variability in measurement is a concern when using those devices.10
The purpose of this study was to provide an objective assessment of the value of IA based on Talbot–Moiré interferometry in the determination of IOL sphere power in eyes with no previous ocular surgery.
Patients and methods
A retrospective chart review was proposed and approved by the Wolfe Eye Clinic Institutional Review Board (IRB). The IRB waived the requirement for informed consent because no protected health information was included in the data extracted from the patient records.
Operative records from February 2016 to October 2016 were examined to identify eyes with no previous refractive surgery and no significant corneal pathology. Included eyes must have had uncomplicated cataract surgery that was successfully completed where IA was used at the time of surgery.
A “Duovisc” strategy was employed for phacoemulsification in all cases. After a temporal 2.4 mm clear corneal and accessory paracentesis incisions were created, the anterior chamber was filled with approximately one third Viscoat then two thirds Provisc (both Alcon Laboratories, Inc., Fort Worth, TX, USA). Capsulorhexis was accomplished with a cystitome with a target diameter of 5.0 mm for all IOLs except for the multifocals. Those cases were operated using the LenSx femtosecond laser (Alcon Laboratories, Inc.) to create a 5.0 mm diameter capsulorhexis, nuclear chop pattern, and transverse arcuate keratotomies as needed. A modified “divide and conquer” technique was employed followed by aspiration of cortex and then capsule vacuuming with a silicone irrigation/aspiration tip. The eye was then filled with Provisc to obtain a pressure of at least 21 mmHg as measured with a surgical applanation tonometer (Terry-Kratz modified Barraquer tonometer; Ocular Instruments, Bellevue, WA, USA). The IOL type and sphere powers suggested by the aberrometer and the preoperative calculations were recorded, along with the IOL type and sphere power of the lens actually used.
Manifest refractions were required to be completed at least 2 weeks after surgery. Records included the Preop measurements from the IOL Master 700 (Carl Zeiss Meditec AG, Jena, Germany) and the Pentacam HR rotating Scheimpflug camera (OCULUS Optikgeräte GmbH, Wetzlar, Germany). Pentacam Total Corneal Refractive Power was used for calculating the cylinder magnitude and orientation of toric IOLs but was not used for sphere power determination. IOL Master biometric data were used for the calculation of sphere power using the Haigis and the Sanders, Retzlaff and Kraff/theoretical (SRK/T) formulas. Long eye adjustments were made for eyes longer than 27.99 mm.12 The Haigis and Hoffer Q formulas were used in similar fashion for eyes <22.00 mm in axial length. IOL power was determined by selecting the formula with refractive residuals that were close to plano for one formula and slightly myopic with the other formula. IA was used for each eye to determine the recommended sphere power of the IOL to be implanted with a similar slight preference for minimal residual myopia. The Preop and IA targets for the multifocal IOL were slightly more myopic than those for the toric and spherical lenses, at about −0.2 D sphere.
As one part of the analysis, all eyes were assigned to one of four groups based on the method of IOL sphere power determination of the implanted lens. The first group (“Same”) included those eyes where the lens implanted was the same as that suggested by both the Preop IOL calculations and the intraoperative aberrometer. The second group included those eyes where IA suggested a different IOL power, but the Preop IOL power (“Preop”) was implanted. The third group was the reverse of the second, where the two calculated powers were different and the power from the intraoperative aberrometer was used (“IA”). The fourth group included all eyes that were not assigned to one of the first three groups (“Mixed”); this group was composed of eyes where the power of the implanted IOL was between the powers suggested by the intraoperative aberrometer and the Preop calculations.
These data provided the Preop IOL sphere power recommendation, the IA IOL sphere power recommendation and the implanted IOL sphere power. The expected residual refraction from each of these power recommendations was determined using standard back-vertex techniques. The difference between the expected residual refraction and the actual postoperative refraction (both in spherical equivalent) was the error associated with each IOL power.
The postoperative refractive error was calculated as the difference between the postoperative spherical equivalent refraction and the target refraction for each eye. The expected residual refractive error was calculated for both the Preop and IA results. This was based on the calculated residual refractive errors from the Preop calculation and the intraoperative aberrometer, adjusted for any difference between the implanted lens and the lens calculated by each method.
The measured and calculated data were tabulated in an Excel spreadsheet and then imported into an MS Access database for data checking and preliminary analyses (both Microsoft, Redmond, WA, USA). Detailed statistical analysis was performed using the Dell Statistica data analysis software system, version 13 (Dell, Inc., Round Rock, TX, USA). Categorical comparisons were made using a chi-square test, and parametric data were evaluated using an analysis of variance (ANOVA). The level of statistical significance was set at P<0.05.
Results
This retrospective chart review identified 163 eyes that met the inclusion criteria. Two eyes were excluded because best-corrected postoperative vision was worse than 20/60; it was felt that the postoperative refraction in these cases would not be reliable. One of these eyes had a substantial macular epiretinal membrane, and the other eye had a membrane with a macular pseudohole. One additional eye was excluded because the patient elected to have a distance correction implanted on the day of surgery when all IOL planning had been completed for a monovision residual refraction. That left 160 eyes of 112 patients for detailed analysis. There were 70 female patients and 42 males. Average age was 65.5±9.6 years, with a range from 23 to 85 years. Lenses implanted included 14 aspheric non-toric IOLs (SN60WF), 124 aspheric toric IOLs (SN6ATx) and 22 multifocal IOLs (SV25T0), all from Alcon Laboratories, Inc.
Table 1 shows a breakdown of the IOLs by calculation group. Note that while just under half the aberrometer measurements were in the Same group, the percentage was significantly lower for the SV25T0 lens.
 | Table 1 IOL characteristics by calculation group |
Table 2 shows the percentage of eyes with postoperative refractions within given ranges of the target by the four different categories described in the “Patients and methods” section. The Same category is shown separately but is also reflected in both the IA and Preop data. There was no statistically significant difference in the percentages at each range by category (chi-square test, P>0.05).
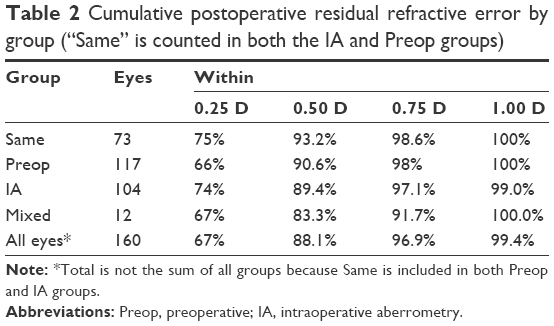 | Table 2 Cumulative postoperative residual refractive error by group (“Same” is counted in both the IA and Preop groups) |
A two-way ANOVA of the postoperative refractive error by group and IOL type showed no statistically significant difference by group (P=0.44) or IOL type (P=0.34) and no group/type interaction. This indicates that one method does not appear superior to any other method for any IOL type. A Brown–Forsyth test of the data showed no statistically significant differences in the variances by group (P=0.76) or IOL type (P=0.69). This indicates that no method appears to have “tightened” the results by reducing variability for any IOL type.
A second part of the analysis was devoted to the question of which calculation (Preop or IA) predicted a result closest to the postoperative refractive error. In 155 of the eyes analyzed, the lens model (toric, non-toric and multifocal) suggested by the Preop calculation and the intraoperative aberrometer did not change; only the sphere power changed. That made it possible to determine which of the two methods best predicted the residual refractive error.
Table 3 shows the difference between the calculated sphere power for the IA system relative to the Preop calculation by IOL type. IOL power calculation results from IA and the Preop calculation were similar in nearly half of cases (47%, 73/155). While there is no apparent pattern in the SN60WF group, primarily a function of the few eyes included, there is an obvious bias toward the IA, suggesting a lower powered lens in the SN6ATx and SV25T0 groups. The overall bias toward lower powered lenses was statistically significant (chi-square test, P<0.01).
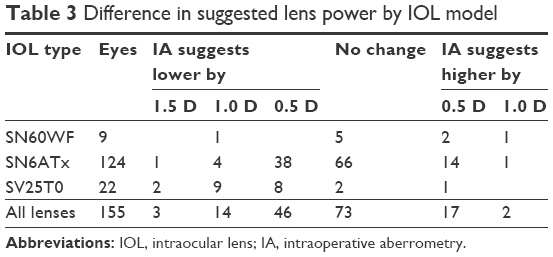 | Table 3 Difference in suggested lens power by IOL model |
The differences between the postoperative spherical equivalent refractions and the predicted values were the prediction errors for each device. Figure 1 shows the distribution of the prediction errors by calculation method for the SN6ATx lens group – the largest, with 124 eyes. As can be seen, there are only nominal differences in the error calculations, though the IA results had slightly more hyperopic residuals than the Preop calculation results. This error difference is statistically significant (−0.06 D vs −0.18 D, P<0.01), but the clinical significance of such a difference is nominal given the 0.5 D step size in sphere power of the majority of IOLs. More importantly, the Brown–Forsyth test of variance shows that the variances in the two sets of results are not statistically significantly different (P=0.55). Looking at the extreme values in the figure (prediction errors >0.5 D or <−1.0 D), there are two eyes from the Preop group and four eyes from the IA group in that outlier range. The percentage of eyes with a prediction error of 0.50 D or less was not statistically significantly different between the two measurement methods (111/124 in the IA group, 101/124 in the Preop group, chi-square test, P=0.07).
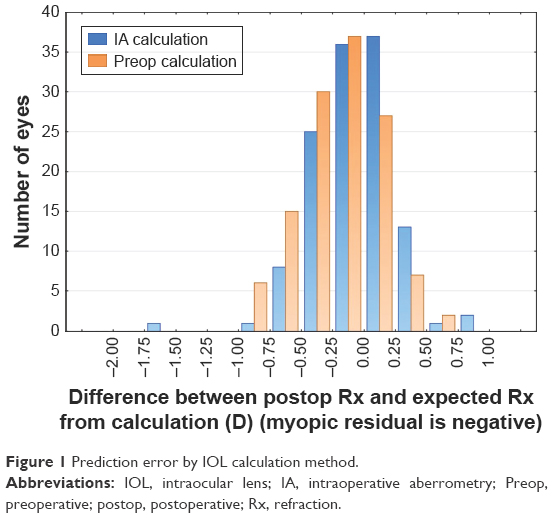 | Figure 1 Prediction error by IOL calculation method. |
From Table 3, it can be seen that there were 19 cases where the Preop IOL power calculation and IA results differed by 1.0 D or more, more than half (57%, 11/19) of which were related to the SV25T0 lens. Table 4 summarizes the results in these 19 cases by IOL model, indicating for each result (based on the data in the table) whether the IA had or would have had an apparent positive effect (potentially reducing residual refractive error) or a negative effect. The percentage that these cases represented of the IOL model groups is also indicated; almost half of the SV25T0 lenses showed a difference between the IA and Preop calculations, with much smaller percentages for the SN60WF and SN6ATx lenses. The likelihood that the positive and negative counts are different from random is also shown. There were only three instances where the Preop and IA calculations differed by 1.5 D; in all three instances, an adjustment of the Preop lens power by 0.5 D toward the IA calculation showed a positive effect.
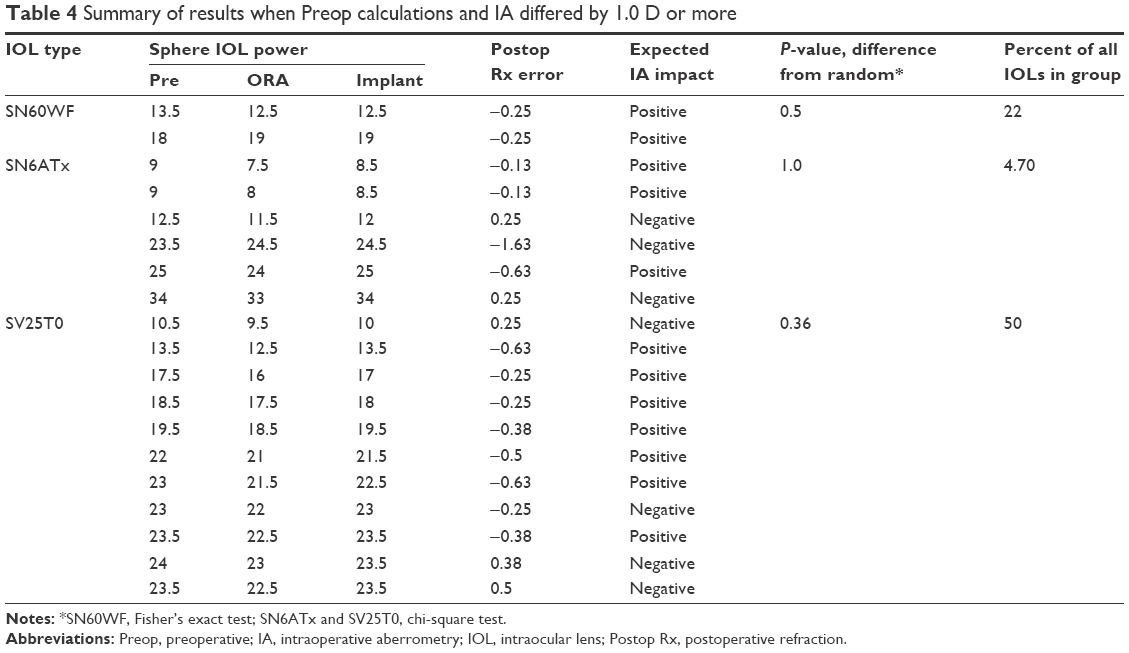 | Table 4 Summary of results when Preop calculations and IA differed by 1.0 D or more |
Note that not all implanted lenses in Table 4 were based on the Preop or IA calculations. The positive (or negative) effect of the IA calculation in some cases depended on the “averaging” of Preop and IA results; use of the full IA calculation in some of these cases had the potential to change a result from positive to negative and vice versa. There was no apparent correlation between IOL power and the likelihood of the IA calculation being better. Nor was there any correlation between the date of surgery and the IA error.
There were 63 eyes where the Preop calculation and the intraoperative aberrometer calculation differed by 0.5 D, plus or minus. In these cases, one or the other lens calculation was chosen for implantation. The “best” lens was considered to be the lens that resulted in a residual refractive error between −0.25 D and 0.05 D. When the residual refractive error was more myopic than −0.25 D, the lower powered lens was considered best, and when the residual refractive error was higher than 0.05 D, the higher powered lens was considered best. Table 5 summarizes the choices the surgeon made for implantation and the best lens as determined here. As can be seen, in 35% (22/63) of cases, the surgeon chose (for non-specific reasons) the non-optimal method. More importantly, these results show that in 56% (35/63) of cases, the IA result was a better option, and in 44% (28/63) of cases, the Preop calculation was better. That distribution is not statistically significantly different from random expectation (50/50, chi-square test, P=0.53).
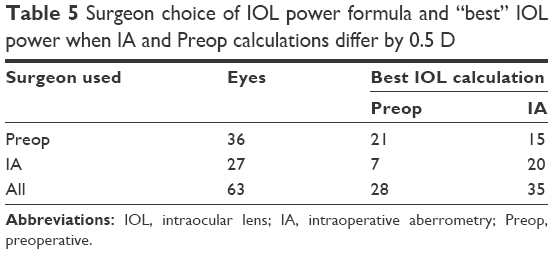 | Table 5 Surgeon choice of IOL power formula and “best” IOL power when IA and Preop calculations differ by 0.5 D |
Discussion
This study suggests that there is no significant improvement in clinical outcomes in eyes with no previous ocular surgery when calculating IOL sphere power using IA compared to standard Preop planning methods, except in the rare case when the two methods suggested substantially different sphere powers. In contrast to these results with Talbot–Moiré interferometry, Huelle et al10 found that Hartmann–Shack IA was less reliable than Preop measurements, noting difficulty in obtaining reliable measurements and high variability in readings. The number of unsuccessful attempts to incorporate IA into the cataract surgery procedure was not recorded in this study.
The likelihood that the two measurement techniques (Preop and IA) would yield the same lens power differed based on the model of IOL (multifocal, monofocal or toric). With the multifocal IOL, there was only one case out of 22 (5%) where the Preop and IA methods predicted the same sphere power. This is in contrast to the results for the two other lens types, where in about half the cases, the Preop and IA calculations predicted the same lens power. These differences by lens type may be related to the a-constants and the formulas used in the IA device, which are not disclosed to users. It is notable that the higher percentage of different calculations between Preop and IA observed with the multifocal lenses did not correspond to better expected outcomes with the IA method. While not specifically investigated, it is worth noting that cataract surgery with the multifocal IOLs was performed using a femtosecond laser for capsulorhexis, nuclear chop pattern, and transverse arcuate keratotomies as needed. This may be a contributing factor to the noted variability, as the cornea may be affected in a slightly different way by the laser interface applanation process.
The difference between the desired target refraction and the postoperative refraction was comparable by measurement method and all four IOL models. The variance by measurement method was not statistically significantly different for any of the groups. This suggests that the IA measurements are not successful in identifying and compensating for “outlier” cases using any IOL model. It may be that effective lens position (a measurement not possible with IA) is a key determinant in cases of refractive surprise; this has not been well studied. These results were independent of the power of the IOL, suggesting that axial length was not a factor. They were also independent of the surgery date, indicating that there was no apparent learning effect that might have skewed results.
The results in Table 5 are perhaps the major concern with possible over-reliance on IA technology vs Preop calculations in “normal” eye cases. In the instances where the calculated powers for the Preop and IA methods differed by 0.5 D, the selection of the IOL sphere power using IA would have improved 56% (35/63) of the cases but would have had a negative effect on 44% (28/63) of cases; this did not correlate with axial length. As evidenced by the surgeon’s empirical choice at the time during surgery, there appears no clear way to determine when the IA measurement might be better. If there was some method to improve the number of times the surgeon picked the “best” IOL calculation, (ie, the preoperative calculation when it was best and the IA calculation when it was best), then the application of IA technology to IOL power calculation would have demonstrated more benefit; in the current data set, as seen in Table 5, the ratio is (21 + 20)/63, or about 2/3.
In the 2% of eyes (3/155) where the IA and Preop calculations showed a 1.5 D difference in sphere power, adjusting the Preop sphere power toward the IA sphere power had a positive and thus useful effect on refractive outcome. Outside of this, relative effects of using the IA or Preop calculations appeared not significantly different from random. Further, the Preop and IA power calculations provided similar results in 46% of eyes. It then becomes a question of practicality – whether the additional time, effort and expense to incorporate IA into the cataract procedure provides sufficient benefit (seen in 2% of cases) to justify its use in IOL sphere power calculation for normal eyes.
The choice of ophthalmic viscosurgical device can be important in I/A. Discovisc (Alcon Laboratories, Inc.) contains chondroitin sulfate in addition to sodium hyaluronate; it has a different refractive index than Provisc and balanced salt solution (BSS), which are similar. This difference has been shown to affect the sphere value recommended during the I/A process - a one-half diopter residual hyperopic result can occur if Discovisc is used instead of BSS or Provisc.11 In our study we used a Duovisc strategy which coats the corneal endothelium with a protective layer of Viscoat throughout the cataract removal process. Viscoat also contains chondroitin sulfate and there is always a variable amount of this chemical layer which remains adherent to the corneal endothelium after cataract removal. This layer mixes with Provisc as that viscoelastic is injected into the anterior chamber prior to I/A. This could theoretically affect the refractive index of the total viscoelastic mix and could contribute to some variability, including a hyperopic trend, in recommended sphere results. However, the effect would be expected to be small because of the relatively large amount of Provisc injected into the eye, compared to the remaining small amount of Viscoat, prior to intraoperative aberrometry.
There are limitations to the conclusions of this study. Table 2 suggests that case selection may have improved overall outcomes (88% of all eyes had residual refractive error within 0.5 D), perhaps because of the high preponderance of healthy well-measurable eyes and healthy patients who elected to receive toric or multifocal IOLs. It is also possible that the technology and Preop calculation strategy used in this study may have contributed to a higher predictive value than is commonly cited in the literature. Behndig et al reported results for a Swedish outcomes registry containing >15,000 eyes: 71% of eyes were within 0.50 D of the target refraction.13 It may be that for practices with less advanced Preop biometric technology and a less effective Preop planning strategy, there may be a benefit to incorporating IA during cataract surgery on otherwise normal eyes.
Conclusion
The use of IA for the calculation of IOL sphere power in normal eyes does not appear to provide any significant benefit relative to standard Preop measurement and planning except perhaps in the rare case where the two methods show a sphere calculation difference of 1.5 D or more. More data are required to corroborate this observation.
Acknowledgment
Sarah Y Makari, OD, a consultant to Science in Vision, received compensation for providing writing assistance to the authors in preparation of the manuscript.
Disclosure
The authors report no conflicts of interest in this work.
References
Zheng T, Chen Z, Lu Y. Influence factors of estimation errors for total corneal astigmatism using keratometric astigmatism in patients before cataract surgery. J Cataract Refract Surg. 2016;42(1):84–94. | ||
Koch DD, Jenkins RB, Weikert MP, Yeu E, Wang L. Correcting astigmatism with toric intraocular lenses: effect of posterior corneal astigmatism. J Cataract Refract Surg. 2013;39(12):1803–1809. | ||
Woodcock MG, Lehmann R, Cionni RJ, Breen M, Scott MC. Intraoperative aberrometry versus standard preoperative biometry and a toric IOL calculator for bilateral toric IOL implantation with a femtosecond laser: one-month results. J Cataract Refract Surg. 2016;42(6):817–825. | ||
Hatch KM, Woodcock EC, Talamo JH. Intraocular lens power selection and positioning with and without intraoperative aberrometry. J Refract Surg. 2015;31(4):237–242. | ||
Epitropoulos AT. Visual and refractive outcomes of a toric presbyopia-correcting intraocular lens. J Ophthalmol. 2016;2016:7458210. | ||
Ianchulev T, Hoffer KJ, Yoo SH, et al. Intraoperative refractive biometry for predicting intraocular lens power calculation after prior myopic refractive surgery. Ophthalmology. 2014;121(1):56–60. | ||
Fram NR, Masket S, Wang L. Comparison of intraoperative aberrometry, OCT-based IOL formula, Haigis-L, and Masket formulae for IOL power calculation after laser vision correction. Ophthalmology. 2015;122(6):1096–1101. | ||
Yesilirmak N, Palioura S, Culbertson W, Yoo SH, Donaldson K. Intraoperative wavefront aberrometry for toric intraocular lens placement in eyes with a history of refractive surgery. J Refract Surg. 2016;32(1):69–70. | ||
Stringham J, Pettey J, Olson RJ. Evaluation of variables affecting intraoperative aberrometry. J Cataract Refract Surg. 2012;38(3):470–474. | ||
Huelle JO, Druchkiv V, Habib NE, Richard G, Katz T, Linke SJ. Intraoperative aberrometry-based aphakia refraction in patients with cataract: status and options. Br J Ophthalmol. 2017;101(2):97–102. | ||
Masket S, Fram NR, Holladay JT. Influence of ophthalmic viscosurgical devices on intraoperative aberrometry. J Cataract Refract Surg. 2016;42(7):990–994. | ||
Wang L, Shirayama M, Ma XJ, Kohnen T, Koch DD. Optimizing intraocular lens power calculations in eyes with axial lengths above 25.0 mm. J Cataract Refract Surg. 2011;37(11):2018–2027. | ||
Behndig A, Montan P, Stenevi U, Kugelberg M, Zetterström C, Lundström M. Aiming for emmetropia after cataract surgery: Swedish National Cataract Register study. J Cataract Refract Surg. 2012;38(7):1181–1186. |
 © 2017 The Author(s). This work is published and licensed by Dove Medical Press Limited. The
full terms of this license are available at https://www.dovepress.com/terms
and incorporate the Creative Commons Attribution
- Non Commercial (unported, 3.0) License.
By accessing the work you hereby accept the Terms. Non-commercial uses of the work are permitted
without any further permission from Dove Medical Press Limited, provided the work is properly
attributed. For permission for commercial use of this work, please see paragraphs 4.2 and 5 of our Terms.
© 2017 The Author(s). This work is published and licensed by Dove Medical Press Limited. The
full terms of this license are available at https://www.dovepress.com/terms
and incorporate the Creative Commons Attribution
- Non Commercial (unported, 3.0) License.
By accessing the work you hereby accept the Terms. Non-commercial uses of the work are permitted
without any further permission from Dove Medical Press Limited, provided the work is properly
attributed. For permission for commercial use of this work, please see paragraphs 4.2 and 5 of our Terms.