Back to Journals » ClinicoEconomics and Outcomes Research » Volume 13
Preliminary Cost-Effectiveness and Cost-Utility Analysis of Cemiplimab in Patients with Advanced Cutaneous Squamous Cell Carcinoma in Italy
Authors Ghetti G ![]() , D'Avella MC, Pradelli L
, D'Avella MC, Pradelli L ![]()
Received 3 December 2020
Accepted for publication 23 January 2021
Published 10 February 2021 Volume 2021:13 Pages 121—133
DOI https://doi.org/10.2147/CEOR.S295605
Checked for plagiarism Yes
Review by Single anonymous peer review
Peer reviewer comments 2
Editor who approved publication: Prof. Dr. Dean Smith
Gianni Ghetti,1 Maria Claudia D’Avella,2 Lorenzo Pradelli1
1Department of Health Economics and Outcome Research, AdRes, Turin, Italy; 2Department of Market Access, Sanofi, Milan, Italy
Correspondence: Gianni Ghetti
Department of Health Economics and Outcome Research, AdRes, Via Vittorio Alfieri 17, Turin, 10121, Italy
Tel +39 011 765 1239
Email [email protected]
Purpose: Cutaneous squamous cell carcinoma (CSCC) is a common cancer that in most cases is curable with surgery. About 3– 5% of patients develop advanced CSCC (aCSCC) and are no longer responsive to surgery or radiation therapy. The aim of this study was to assess the cost-effectiveness and cost-utility of cemiplimab, the first systemic therapy approved in Italy for patients with aCSCC, vs platinum-based chemotherapy from the Italian National Health Service (SSN) perspective.
Methods: A partitioned survival model, which included three mutually exclusive health states, was developed to estimate costs and outcomes for patients with aCSCC, over a 30-year time horizon (lifetime). No direct evidence of the comparative efficacy and safety of cemiplimab versus other therapies currently exists. Therefore, a simulated treatment comparison (STC) was conducted to estimate the comparative efficacy of cemiplimab versus chemotherapy. Individual patient data for cemiplimab were collected from the EMPOWER-CSCC 1 trial whereas chemotherapy data were derived from a retrospective study. In the STC a regression model was used to predict outcomes for cemiplimab in the population observed in the comparator study. Costs of drug acquisition/administration and management of adverse events were included. Costs and outcomes were discounted at 3% per year. Incremental cost-effectiveness ratio (ICER) and incremental cost-utility ratio (ICUR) were calculated; sensitivity and scenario analyses were performed to assess the robustness of results.
Results: In the base-case, treatment with cemiplimab was associated with a gain of 4.89 LYs and 3.99 QALYs, compared with a platinum-based chemotherapy regimen, resulting in an estimated ICER of 27,821 €/LY gained and an ICUR of 34,110 €/QALY gained. Both ICER and ICUR were below the commonly used Italian SSN willingness to pay thresholds.
Conclusion: The use of cemiplimab, compared with a platinum-based chemotherapy regimen, can be considered a cost-effective option for the treatment of aCSCC patients in Italy.
Keywords: Italian National Health Service, ICER, partitioned survival model, non-melanoma skin cancers
Introduction
Cutaneous squamous cell carcinoma (CSCC) represents about 20–25% of non-melanoma skin cancer.1,2 Although the incidence of CSCC is not well documented, some evidence has shown a rise in incidence by 3% to 7% per year in most countries.3,4 The incidence in Italy is not well defined due to the lack of updated national data1,5,6 and the last available data from the Italian Cancer Registry estimated about 11,000 new CSCC cases in 2018.7–9
The main risk factors for CSCC are exposure to ultraviolet radiation, fair skin, advanced age, and immunosuppression.1 In 90% of cases, lesions form on the sun-exposed parts of the body, such as the face, ears, neck, lips, and extremities.1,5,6 The current standard of care for localized CSCC is surgical resection after which the prognosis is highly favorable with a cure rate of more than 90% after 5 years.1,5,6 However, a small proportion of patients (3–5%) with localized CSCC develop advanced CSCC (aCSCC), which includes metastatic (mCSCC) and locally advanced disease (laCSCC) that can no longer be cured with surgery or radiotherapy.1,5,6,10
In a recent retrospective analysis of healthcare administrative data of more than 7 million Italian inhabitants, Ronconi et al11 reported a prevalence for aCSCC of 5.8 per 1 million inhabitants which increases with age, reaching 38.6 per million among patients aged 75–79 years. Advanced CSCC is associated with significant mortality and the prognosis worsens as patients progress, particularly toward distant metastasis.12–14 Furthermore, aCSCC may result in severe disfigurement, mainly in exposed areas, which can negatively impact patients’ daily functioning and quality of life.15,16
Advanced CSCC is also associated with a high cost of illness, as reported in the study of Marcellusi et al17. This analysis, which aimed at assessing the total annual direct costs associated with the management of CSCC overall and in aCSCC patients in Italy, estimated an annual expenditure of about € 24.6 million, of which about € 2 million were attributed to patients with aCSCC. This means that about 3–5% of patients contribute to more than 8% of the total cost. Furthermore, the average annual cost per patient was higher in those with aCSCC compared to resectable CSCC (€ 3,319 vs € 2,237, respectively).
Historically, there were no approved systemic therapies for patients with aCSCC who are not eligible for curative surgery or curative radiation. Published survival data with chemotherapy and best supportive care report a median survival of 15.118 and 4.7 months,14 respectively. To date, current Italian guidelines report platinum-based chemotherapy as a first treatment option as well as the integration of early palliative care.1
Recently, cemiplimab, a monoclonal antibody that binds to the programmed cell death-1 (PD-1) receptor, became the first systemic therapy approved by both the Food and Drug Administration (FDA) and European Medicines Agency (EMA) for the treatment of adult patients with mCSCC or laCSCC who are not candidates for curative surgery or curative radiation therapy, based on the results of the EMPOWER-CSCC 1 study.19 This Phase 2, non-randomized, 3-group, multicenter study19 enrolled 193 patients with mCSCC (n=59 in group 1 and n=56 in group 3) or laCSCC (n=78 in group 2) who were not candidates for curative surgery or curative radiation. Patients received cemiplimab (groups 1 and 2: 3 mg/kg IV every 2 weeks, group 3: 350-mg IV fixed dose every 3 weeks) until progression of disease, unacceptable toxicity or completion of planned treatment (groups 1 and 2: up to 96 weeks, group 3: up to 54 weeks). Median progression-free survival (PFS) and overall survival (OS) had not been reached for all groups at the time of analysis. The 12-month event-free probability for PFS was 52.9% (95% CI: 39.1–65.2), 58.1% (95% CI: 43.7–70.0), and 47.4% (95% CI: 26.5–61.3) in group 1, 2, and 3, respectively. The probability of OS from baseline through 12 months was 81.3% (95% CI: 68.7–89.2), 93.2% (95% CI: 84.4–97.1), and 76.1% (95% CI: 56.9–87.6) in group 1, 2, and 3, respectively.
In the light of these clinical outcomes, the use of cemiplimab, which was also recently approved by the Italian Medicines Agency (AIFA)20 appears as a promising strategy for the treatment of aCSCC patients. The aim of this study was to assess the economic implication associated with cemiplimab by evaluating the cost-effectiveness and cost-utility compared with a platinum-based chemotherapy regimen in patients with aCSCC in Italy.
Materials and Methods
A partitioned survival model was developed to estimate cost-effectiveness and cost-utility of cemiplimab (350 mg administered intravenously every 3 weeks)19 vs chemotherapy from the Italian National Health Service (SSN) perspective. The target population of EMPOWER-CSCC 1 Phase II clinical trial19 was considered in the model, namely, adult patients with locally advanced CSCC (laCSCC), who are not candidates for surgery or radiotherapy, and those with distant and/or regional metastases (mCSCC).
Model Structure
The model included three mutually exclusive (ie patients can only be in one state at a time) and collectively exhaustive (ie all patients must be captured in a state) health states: pre-progression, post-progression and death (Figure 1). At the beginning of the simulation, patients are in the pre-progression health state, where they receive either cemiplimab or a platinum-based chemotherapy regimen. Over time, patients transitioned directly to the death state or the post-progression health state where they received post-progression care before moving to the death state. The partitioned survival model directly estimates proportions of patients in each health state at each time point according to the treatment-specific PFS and OS, avoiding the need to estimate transition probabilities.21,22 PFS and OS times were obtained by calculating the area under their respective curves while the time in post-progression was calculated as the difference of areas under the two curves. This approach is widely used in the modeling of advanced carcinoma treatments.21–23
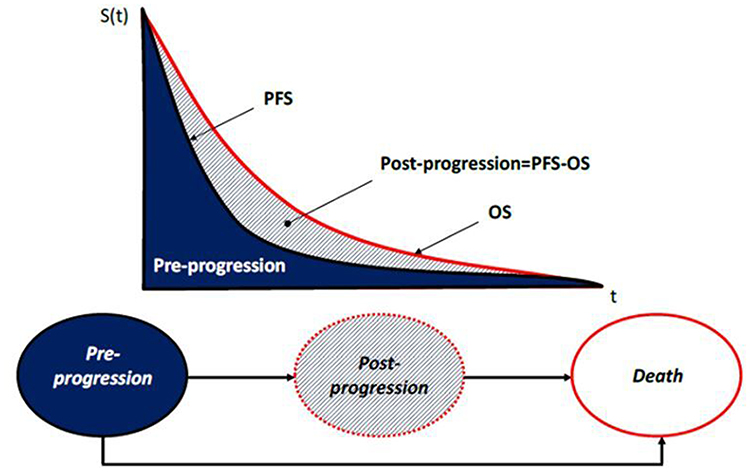 |
Figure 1 Structure of the partitioned survival model. Abbreviations: OS, overall survival; PFS, progression-free survival. |
A one-month model cycle was chosen (ie 30.4 days per month; 365 days/12 month), given that the Kaplan–Meier curves were divided into monthly cycles to generate the discrete hazards for PFS and OS, and half-cycle correction was applied in the model. The ISPOR/SMDM Modeling Good Research Practice guidelines state that the time horizon of a model should be long enough to capture relevant differences in outcomes across strategies;24 therefore, all outcomes were estimated over a 30-year time horizon (lifetime), deemed long enough to capture all health effects and costs of the treatment of aCSCC patients. Furthermore, no patient is expected to be still alive at the end of the follow-up period, given the mean age of the modeled population (71 years).19 Both effects and costs were discounted at 3% per year, in line with the Italian guidelines.25
The incremental cost-effectiveness ratio (ICER) and the incremental cost-utility ratio (ICUR) for cemiplimab versus chemotherapy were calculated and expressed as cost per LY gained and QALY gained, respectively.
Microsoft Excel 2010® was used for the development of the model (Redmond, WA, USA).
Clinical Inputs
PFS and OS
A systematic literature review was performed to identify studies that investigated the efficacy and safety of treatments among patients with aCSCC. Relevant studies were identified through searches of Embase, MEDLINE, and Cochrane Central Register of Controlled Trials, as well as hand searches of relevant conference proceedings and online resources such as clinicaltrials.gov. The best available evidence for cemiplimab was the EMPOWER-CSCC 1 study whose results in the three groups were pooled for the purposes of this analysis.19 For the chemotherapy comparator arm, a study by Jarkowski et al was identified.18 This retrospective study reported PFS and OS Kaplan–Meier curves for aCSCC patients receiving platinum-based chemotherapy, a population that would be comparable to those patients that would be eligible for treatment with cemiplimab.
Since the efficacy and safety of cemiplimab in aCSCC have not been directly compared against other interventions or against placebo within a randomized clinical trial, the comparative efficacy of treatments was estimated via an indirect treatment comparison (ITC).26 Network meta-analysis (NMA) is the most standard form of ITC, however, since the only trial available on cemiplimab is the single-arm EMPOWER-CSCC 1 study, performing a traditional NMA was not feasible.27 Therefore, individual patient data (IPD) from the EMPOWER-CSCC 1 study were used to perform a simulated treatment comparison (STC).27 This approach reflects a population-adjusted indirect comparison as recommended by NICE,28 which involves creating a model for cemiplimab that was then used to predict PFS and OS curves that aligned with the study-specific patient characteristics as observed in the study that informed the efficacy for chemotherapy. To reliably predict outcomes, the STC must adjust for all prognostic factors and effect modifiers. The STC was performed using a Cox model to predict cemiplimab PFS or OS for the target population from Jarkowski et al18. Initially, models that described PFS or OS with cemiplimab as a function of relevant patient characteristics based on IPD were identified. Prognostic factors included in the core model for the analysis were identified based on a targeted literature review and validated by clinical experts. Of these, only age, disease stage and tumor site were also reported in the comparator study and therefore could be adjusted for in the analyses. These prognostic factors were also validated by oncologists. Additional covariates included in an extended model were those that were not found to be significant or those that had not been studied in CSCC but had been found to be significant in other tumor types: gender, ECOG performance score, prior systemic therapy, and prior radiotherapy. The fit of the two alternative models were compared using the Akaike information criterion (AIC). The core model was used in the comparison as it was found to better fit the data. Subsequently, the absolute treatment effect with cemiplimab for the population as in Jarkowski et al27 was estimated using the selected model.
Alternative parametric models were fit to the PFS and OS of each comparator. We used multiple selection criteria, including the plausibility of alternative parametric distribution based on visual inspection of curves and extrapolation trend, and goodness of fit based on deviance information criteria (DIC), to select the best-fitting distribution. In particular, clinical plausibility was assessed based on long-term trend and curves that declined over time were preferred over curves that plateaued in order to be conservative. For cemiplimab the best-fitting distribution that declined over time for both PFS and OS was log-normal. For chemotherapy, the best-fitting distributions that declined over time for PFS and OS were Weibull and Gompertz, respectively.
Given the lifetime time horizon, extrapolation of PFS and OS hazard functions was required, as the clinical trials did not consistently report PFS and OS for lifetime duration. Given the ongoing maturity of the cemiplimab evidence, the continuation of the cemiplimab effect beyond the maximum treatment duration is currently uncertain. Therefore, in the base, it was assumed that the cemiplimab hazard will gradually deteriorate (waning effect) between 24 and 48 months before it is then set to be equal to the comparator arm’s hazard. In other words, in the absence of long-term data, it was assumed that the effect of cemiplimab over time fades away uniformly. The impact of this assumption was tested in a scenario analysis.
Utility Values
The EORTC QLQ-C30 data collected from EMPOWER-CSCC 1 were mapped to the preference-based EQ-5D instrument to derive a utility for the pre- and post-progression health states. Base-case utilities were estimated using the Longworth et al29 algorithm, selected based on its predictivity ability for populations encompassing multiple cancer types, using the Italian tariffs described in Scalone et al30 (Table 1). From the ratio between the utility values in the pre-progression and post-progression health states (Table 1) and the basic utility of the Italian population31 (0.926), with the same age and gender distribution of patients enrolled in the EMPOWER-CSCC 1 trials, a specific multiplier for each health state (pre-progression = 0.939, post-progression = 0.914) was obtained. These multipliers were applied to the age-specific utility of the Italian population31 to account for diminishing utilities.
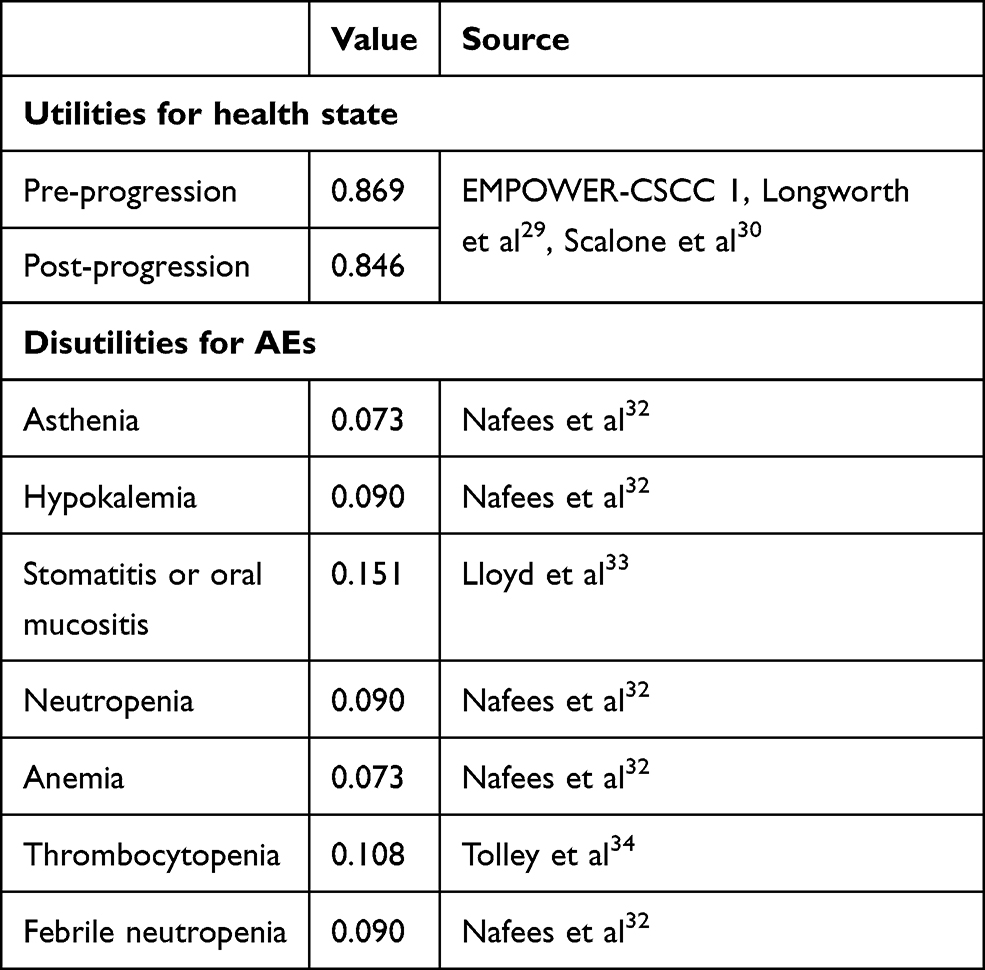 |
Table 1 Utilities and Disutilities Incorporated in the Model |
The model also incorporated disutility associated with the AEs in the pre-progression health state (Table 1). The loss of QALYs per AE was calculated assuming AEs last for 30 days.
Cost Inputs
The analysis was conducted from the perspective of the Italian National Health Service (SSN), therefore, only direct health costs (drug acquisition and administration, disease monitoring, and costs of adverse events) were considered (Tables 2–4).
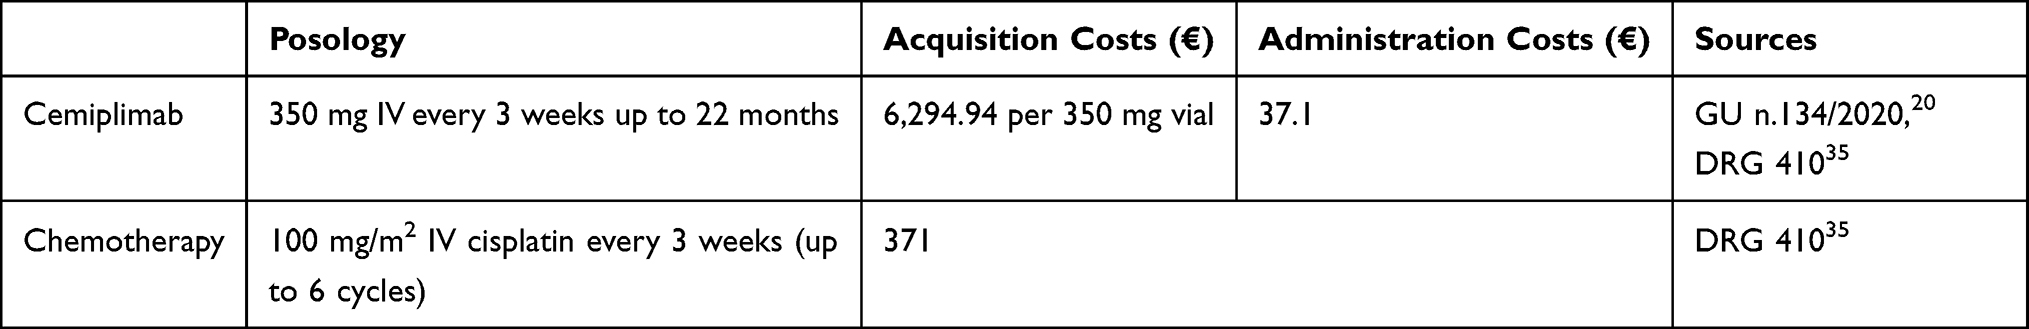 |
Table 2 Drug Costs Considered in the Model |
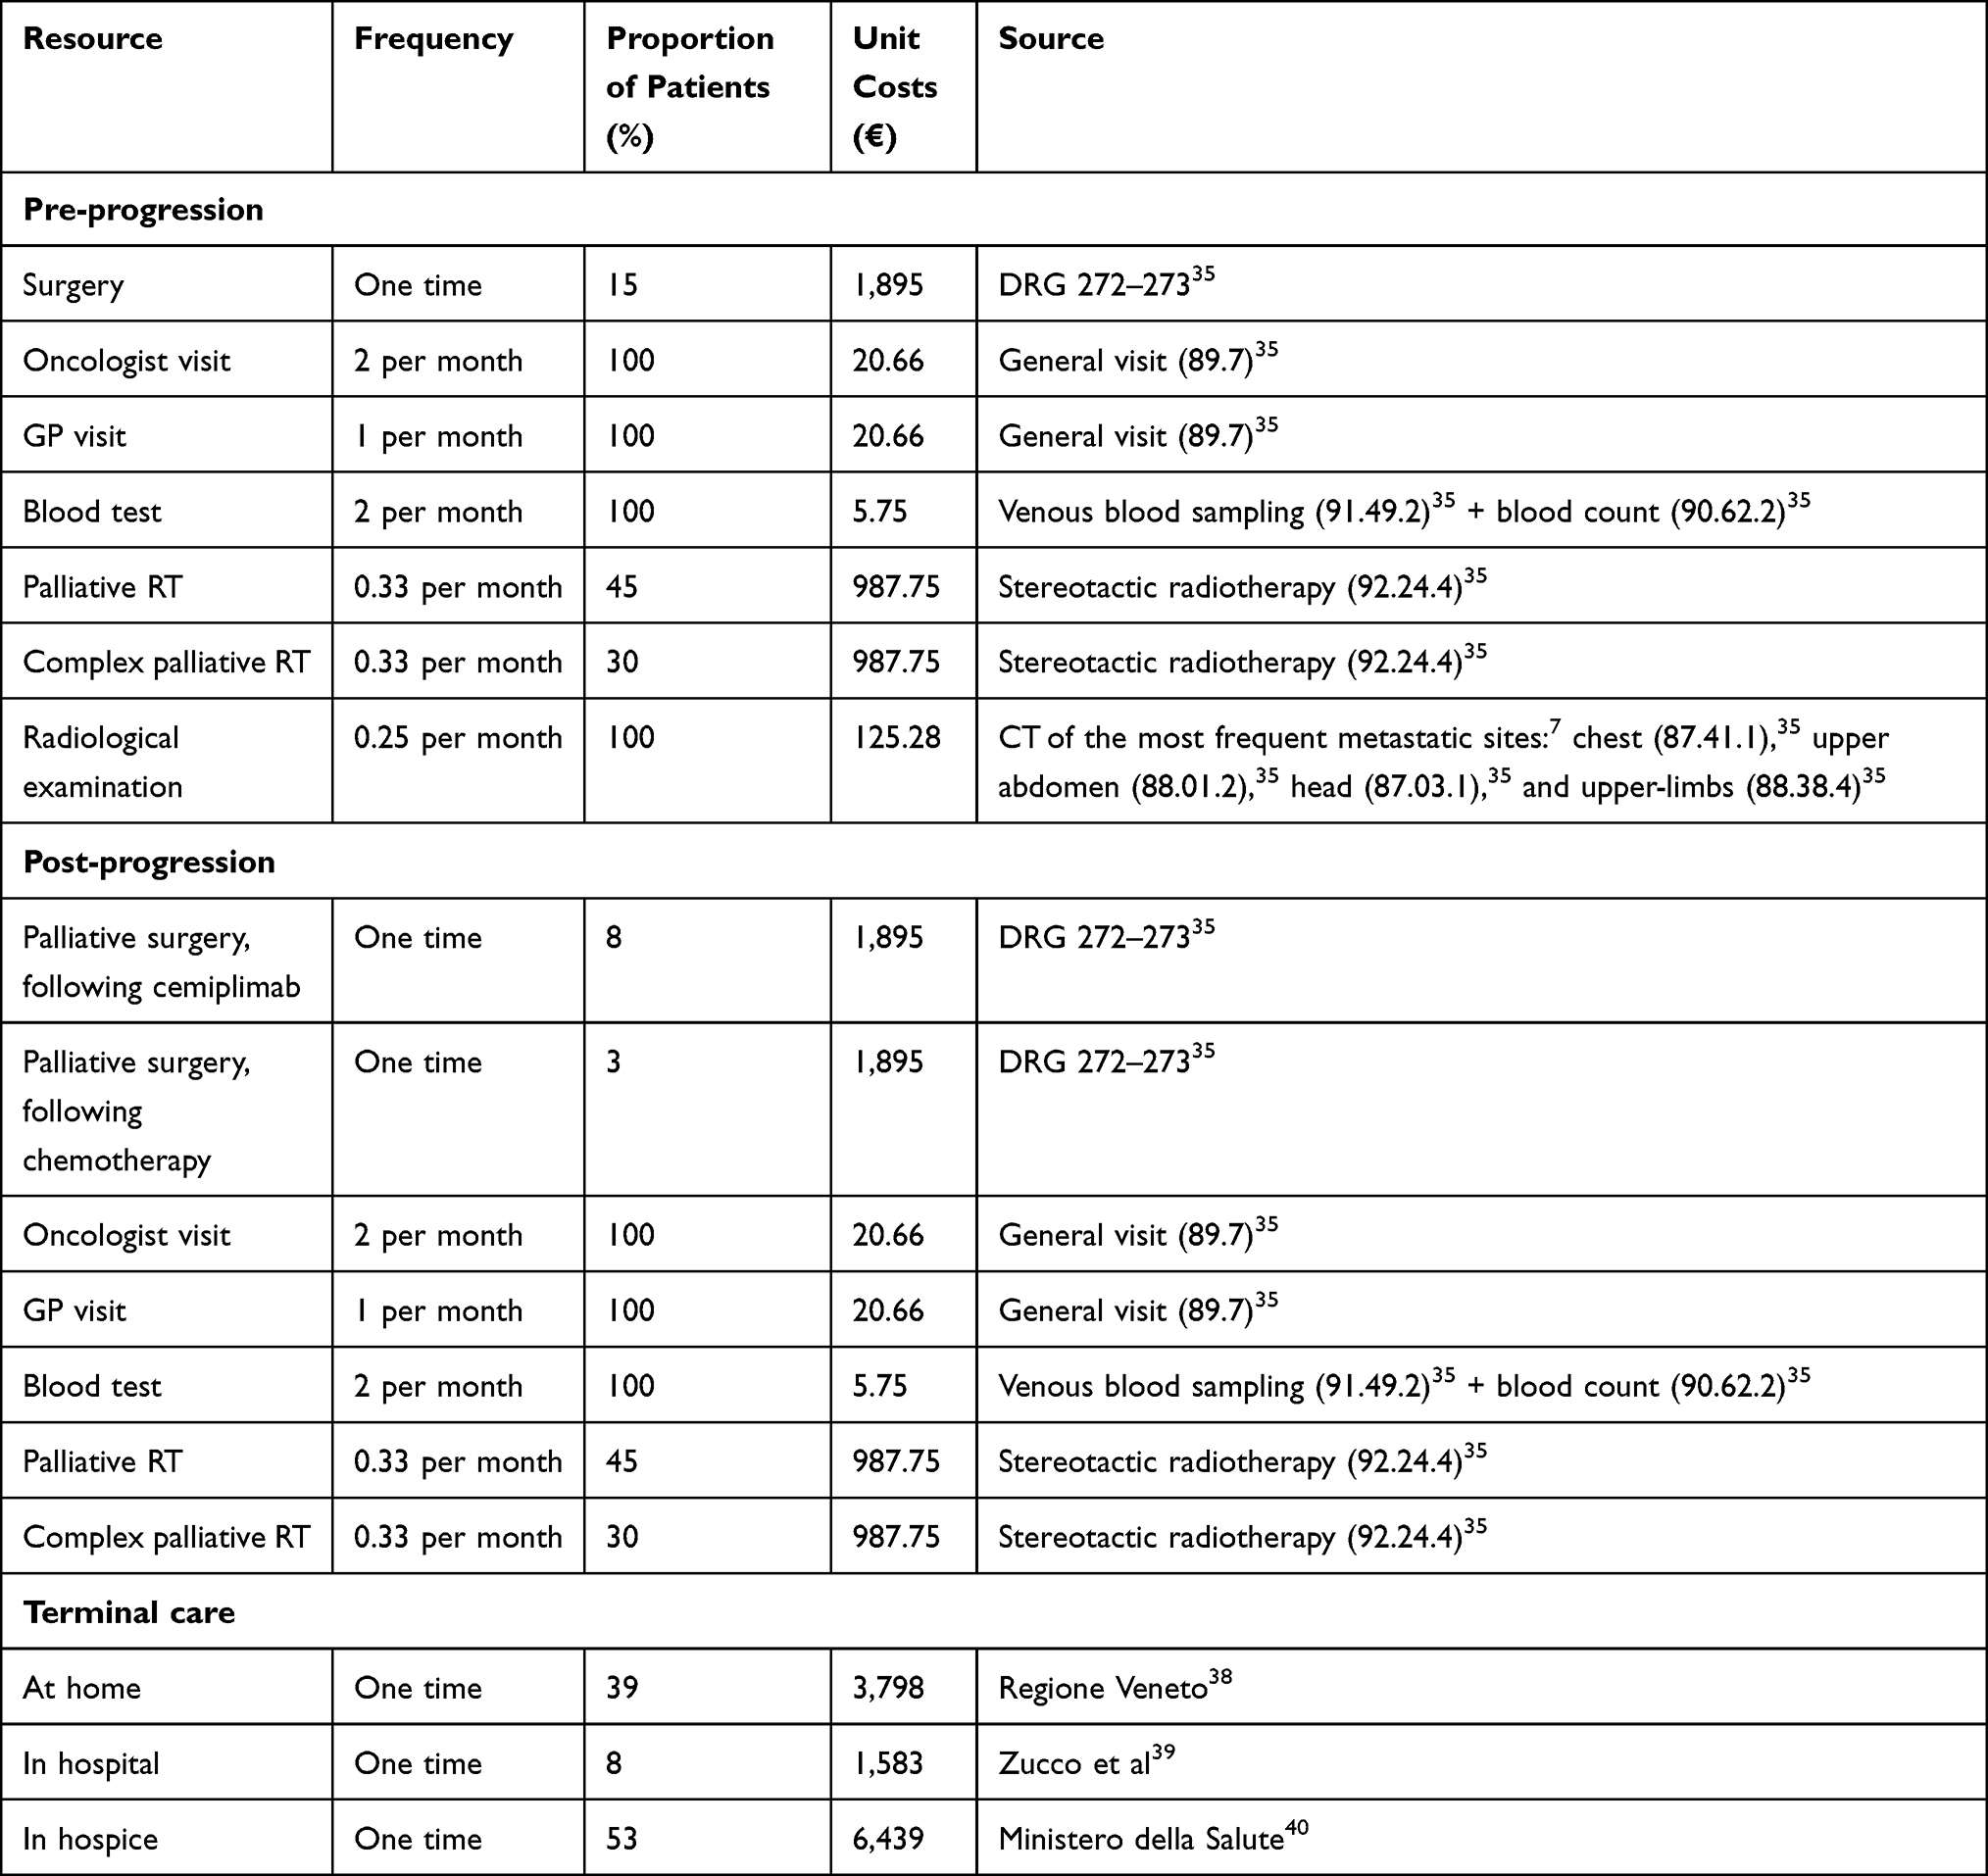 |
Table 3 Resource Use and Unit Costs in Pre-Progression, Post-Progression and End-of-Life Health States |
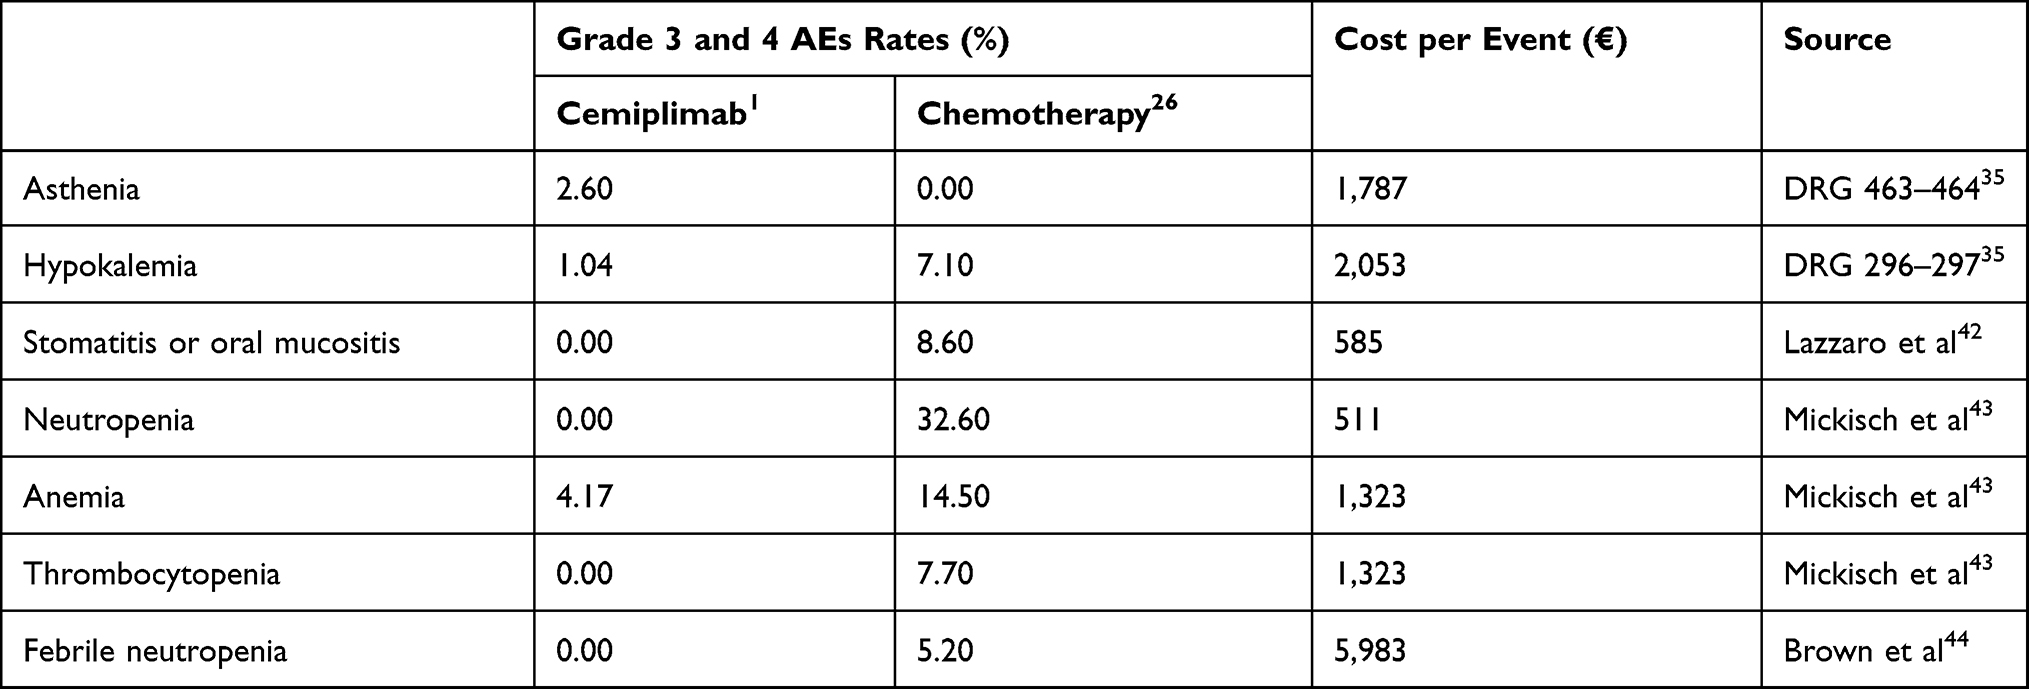 |
Table 4 AEs Rates and Costs for Cemiplimab and Chemotherapy |
Drug Costs
Drug costs considered in the model include only drug acquisition and administration in the pre-progression health state, whereas costs related to post-progression included drug costs that were related to routine care. Treatment cost for cemiplimab included the acquisition cost (ex-factory price net of mandatory discounts)20 and the cost of administration per cycle of treatment (DRG 410 in outpatient care,35 reduced by 90%). The discount on the DRG tariff is a measure to adapt the tariff to hospitalization aimed at treating neoplasms with innovative and high-cost cancer drugs. The administration tariff includes ancillary therapies, any laboratory and instrumental diagnostic tests, oncological visit and supervision of medical personnel during the infusion phase.36 The cost of each cycle of chemotherapy, including both acquisition and administration costs, was proxied with the DRG 410 tariff in outpatient care35 (Table 2).
As mentioned, the EMPOWER-CSCC 1 protocol implemented a stopping rule whereby patients in groups 1 and 2 of the trial did not receive therapy beyond 96 weeks. In the model, we applied a maximum treatment duration with cemiplimab at 22 months to correspond with the trial protocol. This assumption affected only the drug acquisition cost of cemiplimab, rather than the outcomes. For chemotherapy, a maximum of 6 cycles of 21 days was assumed.
Monitoring and Terminal Care Costs
Disease management costs and resource use data are shown in Table 3. The frequency of resource use and the proportion of patients who use resources in pre- and post-progression health states were sourced from an oncologist advisory board conducted by Sanofi in the UK (Data on file). Unit costs were derived from the Italian reimbursement tariffs for outpatient specialist care services.35 A una tantum cost regarding terminal care was also applied for all patients. As no end of life data specific to patients with CSCC is available, we used data from Scaccabarozzi et al37 to estimate the proportion of patients who receive terminal care at home, in hospital or in hospice.
Adverse Events Costs
The model considered resources used for the management of grade 3 or 4 AEs. For the cemiplimab arm, rates of grade 3 and 4 AEs were based on all treatment emergent AEs from EMPOWER-CSCC 1 study. The proportions of patients with each AE were pooled between the groups using an inverse weighted variance.
Since there was no connected network of RCTs available to estimate the relative effects (ie odds ratios), grade 3 or 4 AE estimates for the chemotherapy comparator were based on the unadjusted estimates of AEs from a relevant clinical trial. In the case of chemotherapy, since no AEs were reported in Jarkowski et al18, or any other trials investigating platinum-based chemotherapy in CSCC patients, the rate of AEs was sourced from the control arm of the Vermorken et al41, 2013 trial, that enrolled patients with recurrent or metastatic head and neck squamous cell carcinoma. The study was identified through a targeted literature review and was considered the most appropriate due to the similarity in severity with CSCC as corroborated by experts, as well as being the trial with the largest sample size, therefore providing the most power to results.
Where available, unit costs per AE were sourced from literature; otherwise, specific DRG tariffs, coded through the specific diagnosis code, were applied (Table 4).
Sensitivity Analysis
A probabilistic sensitivity analysis (PSA) was conducted to assess the impact of uncertainties of input parameters. The PSA was performed by simultaneously and randomly varying (through 1,000 replications) the values of all parameters according to appropriate probability distributions (gamma for costs, beta for utilities and probabilities, normal for parameters of the PFS and OS distributions). The PSA result is presented as an incremental cost-effectiveness plane and cost-effectiveness acceptability curve.
Scenario Analysis
A range of scenario analyses were carried out to test the robustness of base-case results. Specifically, a variation of the following parameters was tested: time horizon (10 and 20 years), annual discount rate (0% and 5%), maximum duration of therapy (until progression), and decrease in utility values (subtract the difference between general population and health states utilities).
A scenario analysis was also performed where, after 22 months, hazards of cemiplimab were assumed to be equal to the hazards of chemotherapy (Figure 2). This was considered an unrealistic and pessimistic scenario as it is assumed that the clinical benefit of cemiplimab ceases when treatment ends.
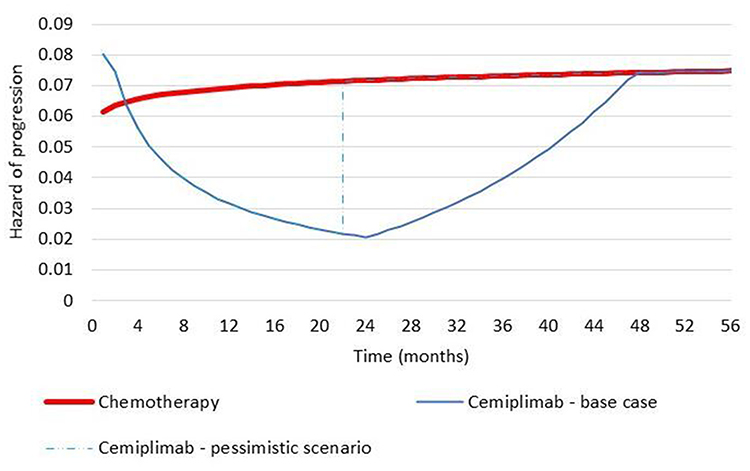 |
Figure 2 Hazard of progression: comparison between base case and pessimistic scenario. |
An additional scenario was investigated with a naïve unanchored comparison between cemiplimab and chemotherapy. In particular, a naïve analysis was performed where parametric models were fit independently to each intervention based on the observed data from the relevant studies: PFS and OS for cemiplimab were extrapolated from the Kaplan-Meier curves built on the data from the last available cut-off (October 2018) of the EMPOWER-CSCC 1 study,19 through the use of parametric distributions. The best-fitting distribution was log-normal for both PFS and OS.
Results
Base-Case
Compared with a platinum-based chemotherapy regimen, cemiplimab was associated with a gain of LYs (+4.89) and QALYs (+3.99) for aCSCC patients, and an increase in the total costs of disease management, except for those related to AEs (Table 5), resulting in estimated ICER and ICUR of 27,821 €/LY gained and 34,110 €/QALY gained, respectively. The estimated ICER was below the Italian SSN willingness to pay thresholds (WTP) of 60,000 €/LY gained45 and the estimated ICUR was below the reference value of € 63,358/QALY gained, calculated by applying the basic utility of the Italian population31 to the WTP thresholds of 60,000 €/LY gained.45
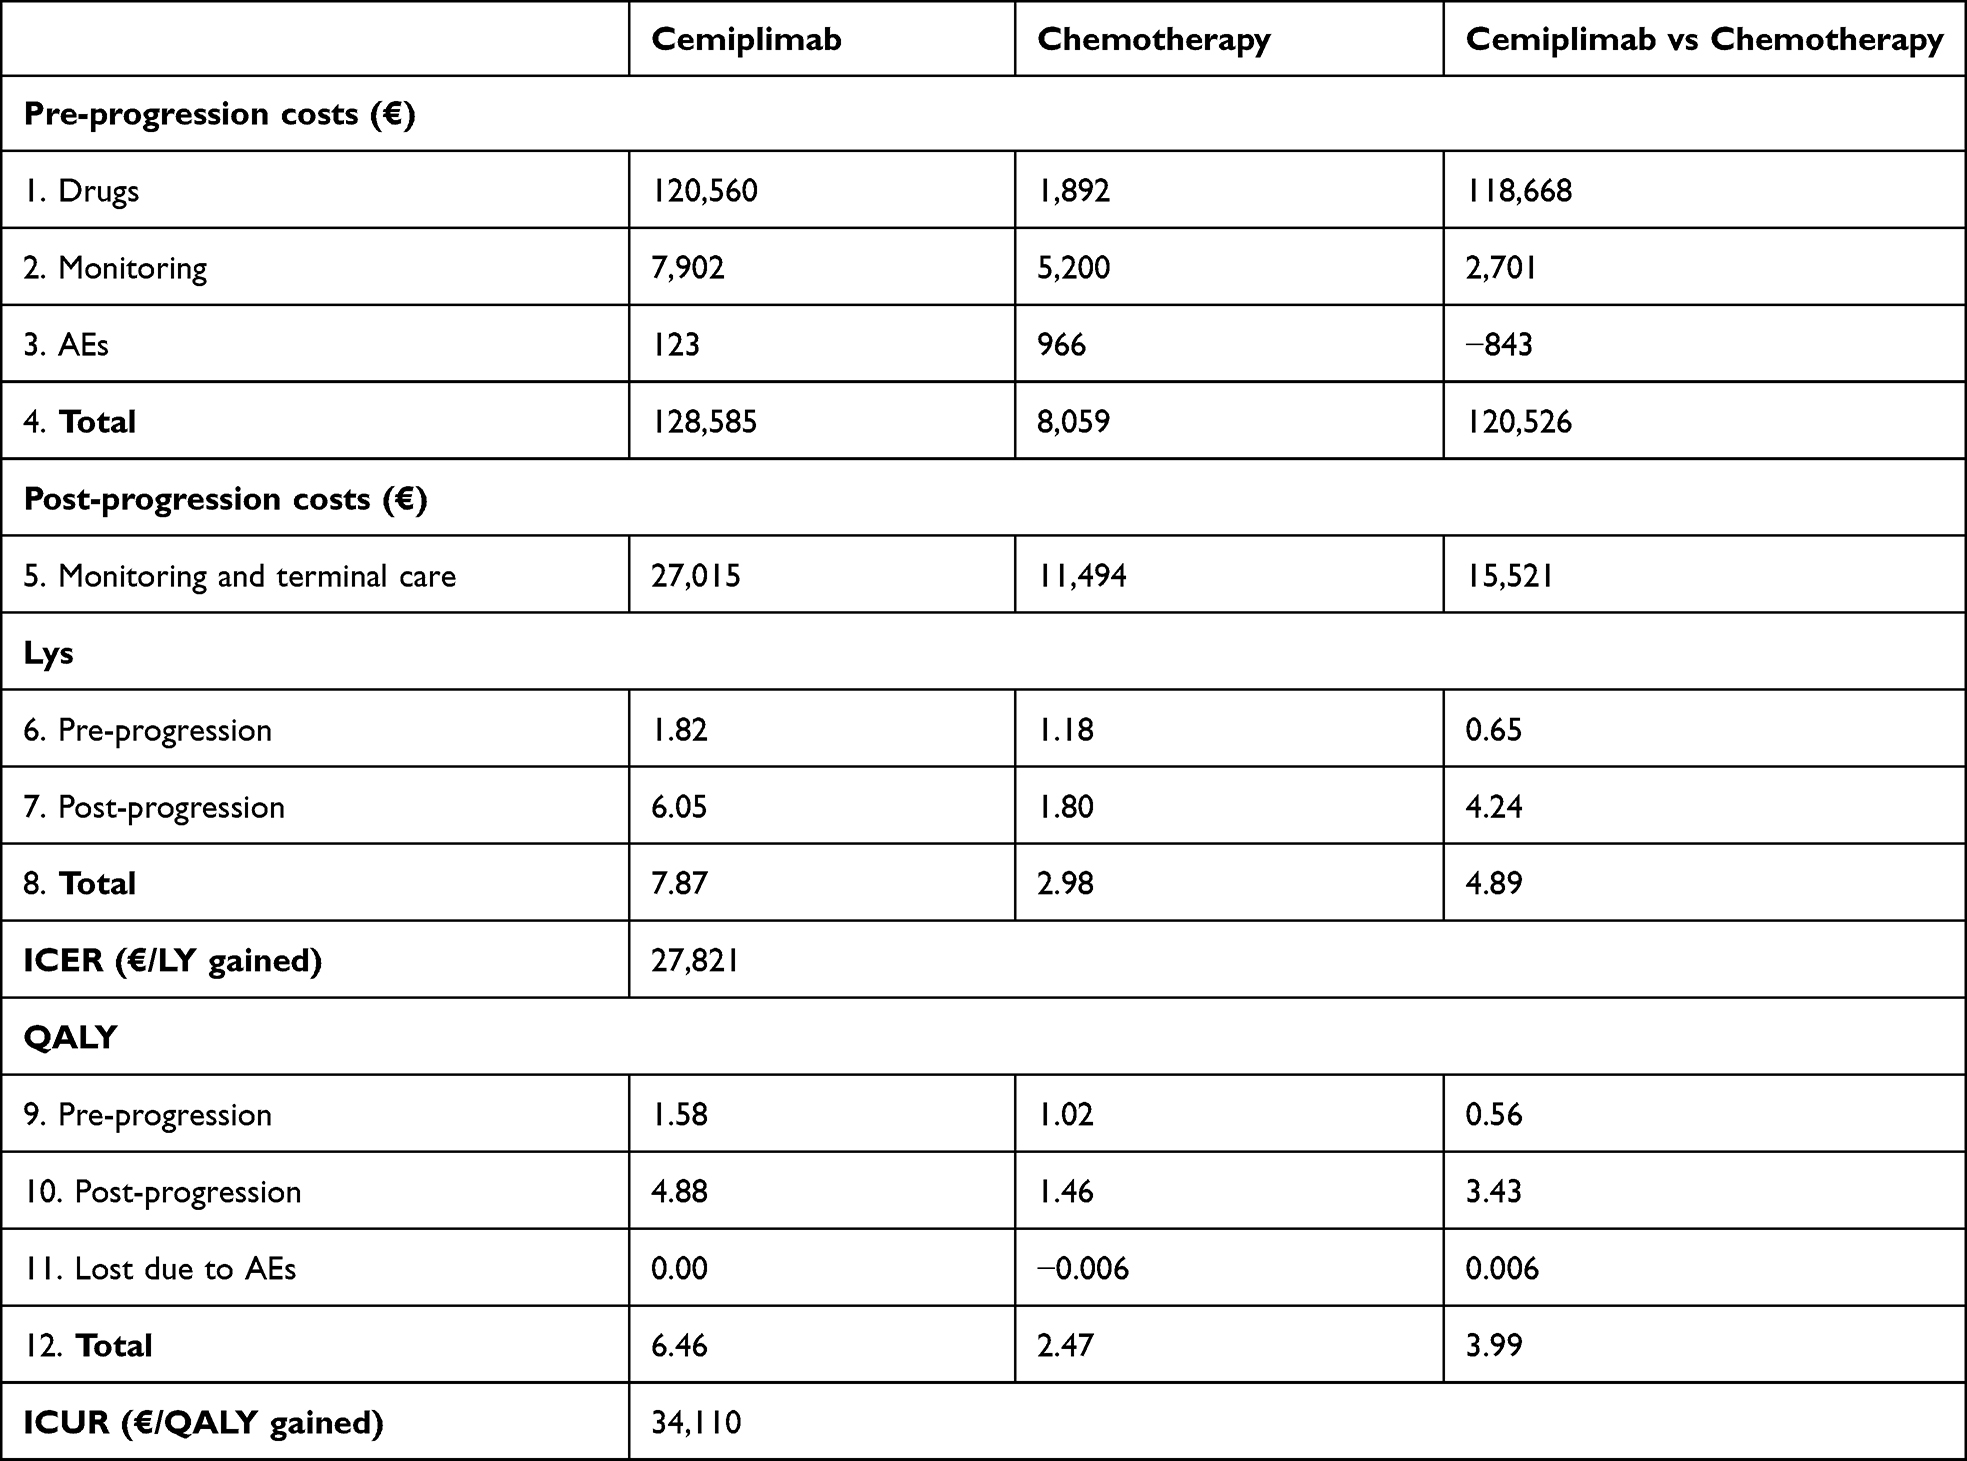 |
Table 5 Base-Case Results |
Sensitivity Analysis
The cost-effectiveness acceptability curve shows the probability that cemiplimab is cost-effective at various willingness-to-pay thresholds, taking into account the uncertainty surrounding input parameters in a simultaneous manner. Figure 3 shows that at the Italian SSN currently used WTP thresholds of 63,358 €/QALY gained, cemiplimab is expected to be cost-effective in >90% of probabilistic iterations. Furthermore, cemiplimab is expected to be cost-effective in >60% of iterations when the WTP threshold of 40,000 €/QALY gained identified by the Italian Health Economics Association (AIES)46 is considered.
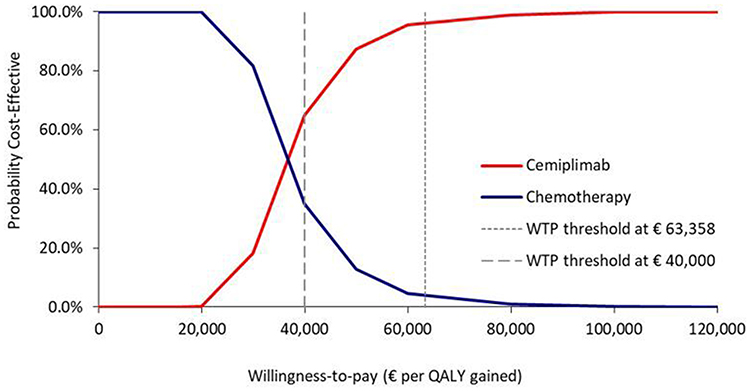 |
Figure 3 Cost-effectiveness acceptability curve. |
The cost-effectiveness plane plots each iteration of the probabilistic sensitivity analysis in order to illustrate the variation in incremental costs and effects when parameters are varied simultaneously within their specified uncertainty boundaries. Figure 4 confirms the robustness of the model with the iterations that are symmetrically distributed around the deterministic value.
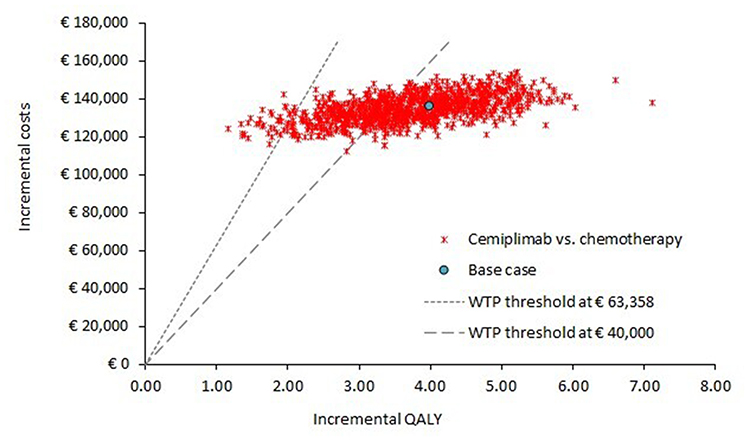 |
Figure 4 Cost-effectiveness plane. |
Scenario Analysis
Table 6 reports the result of the scenario analyses carried out to test the robustness of the base-case.
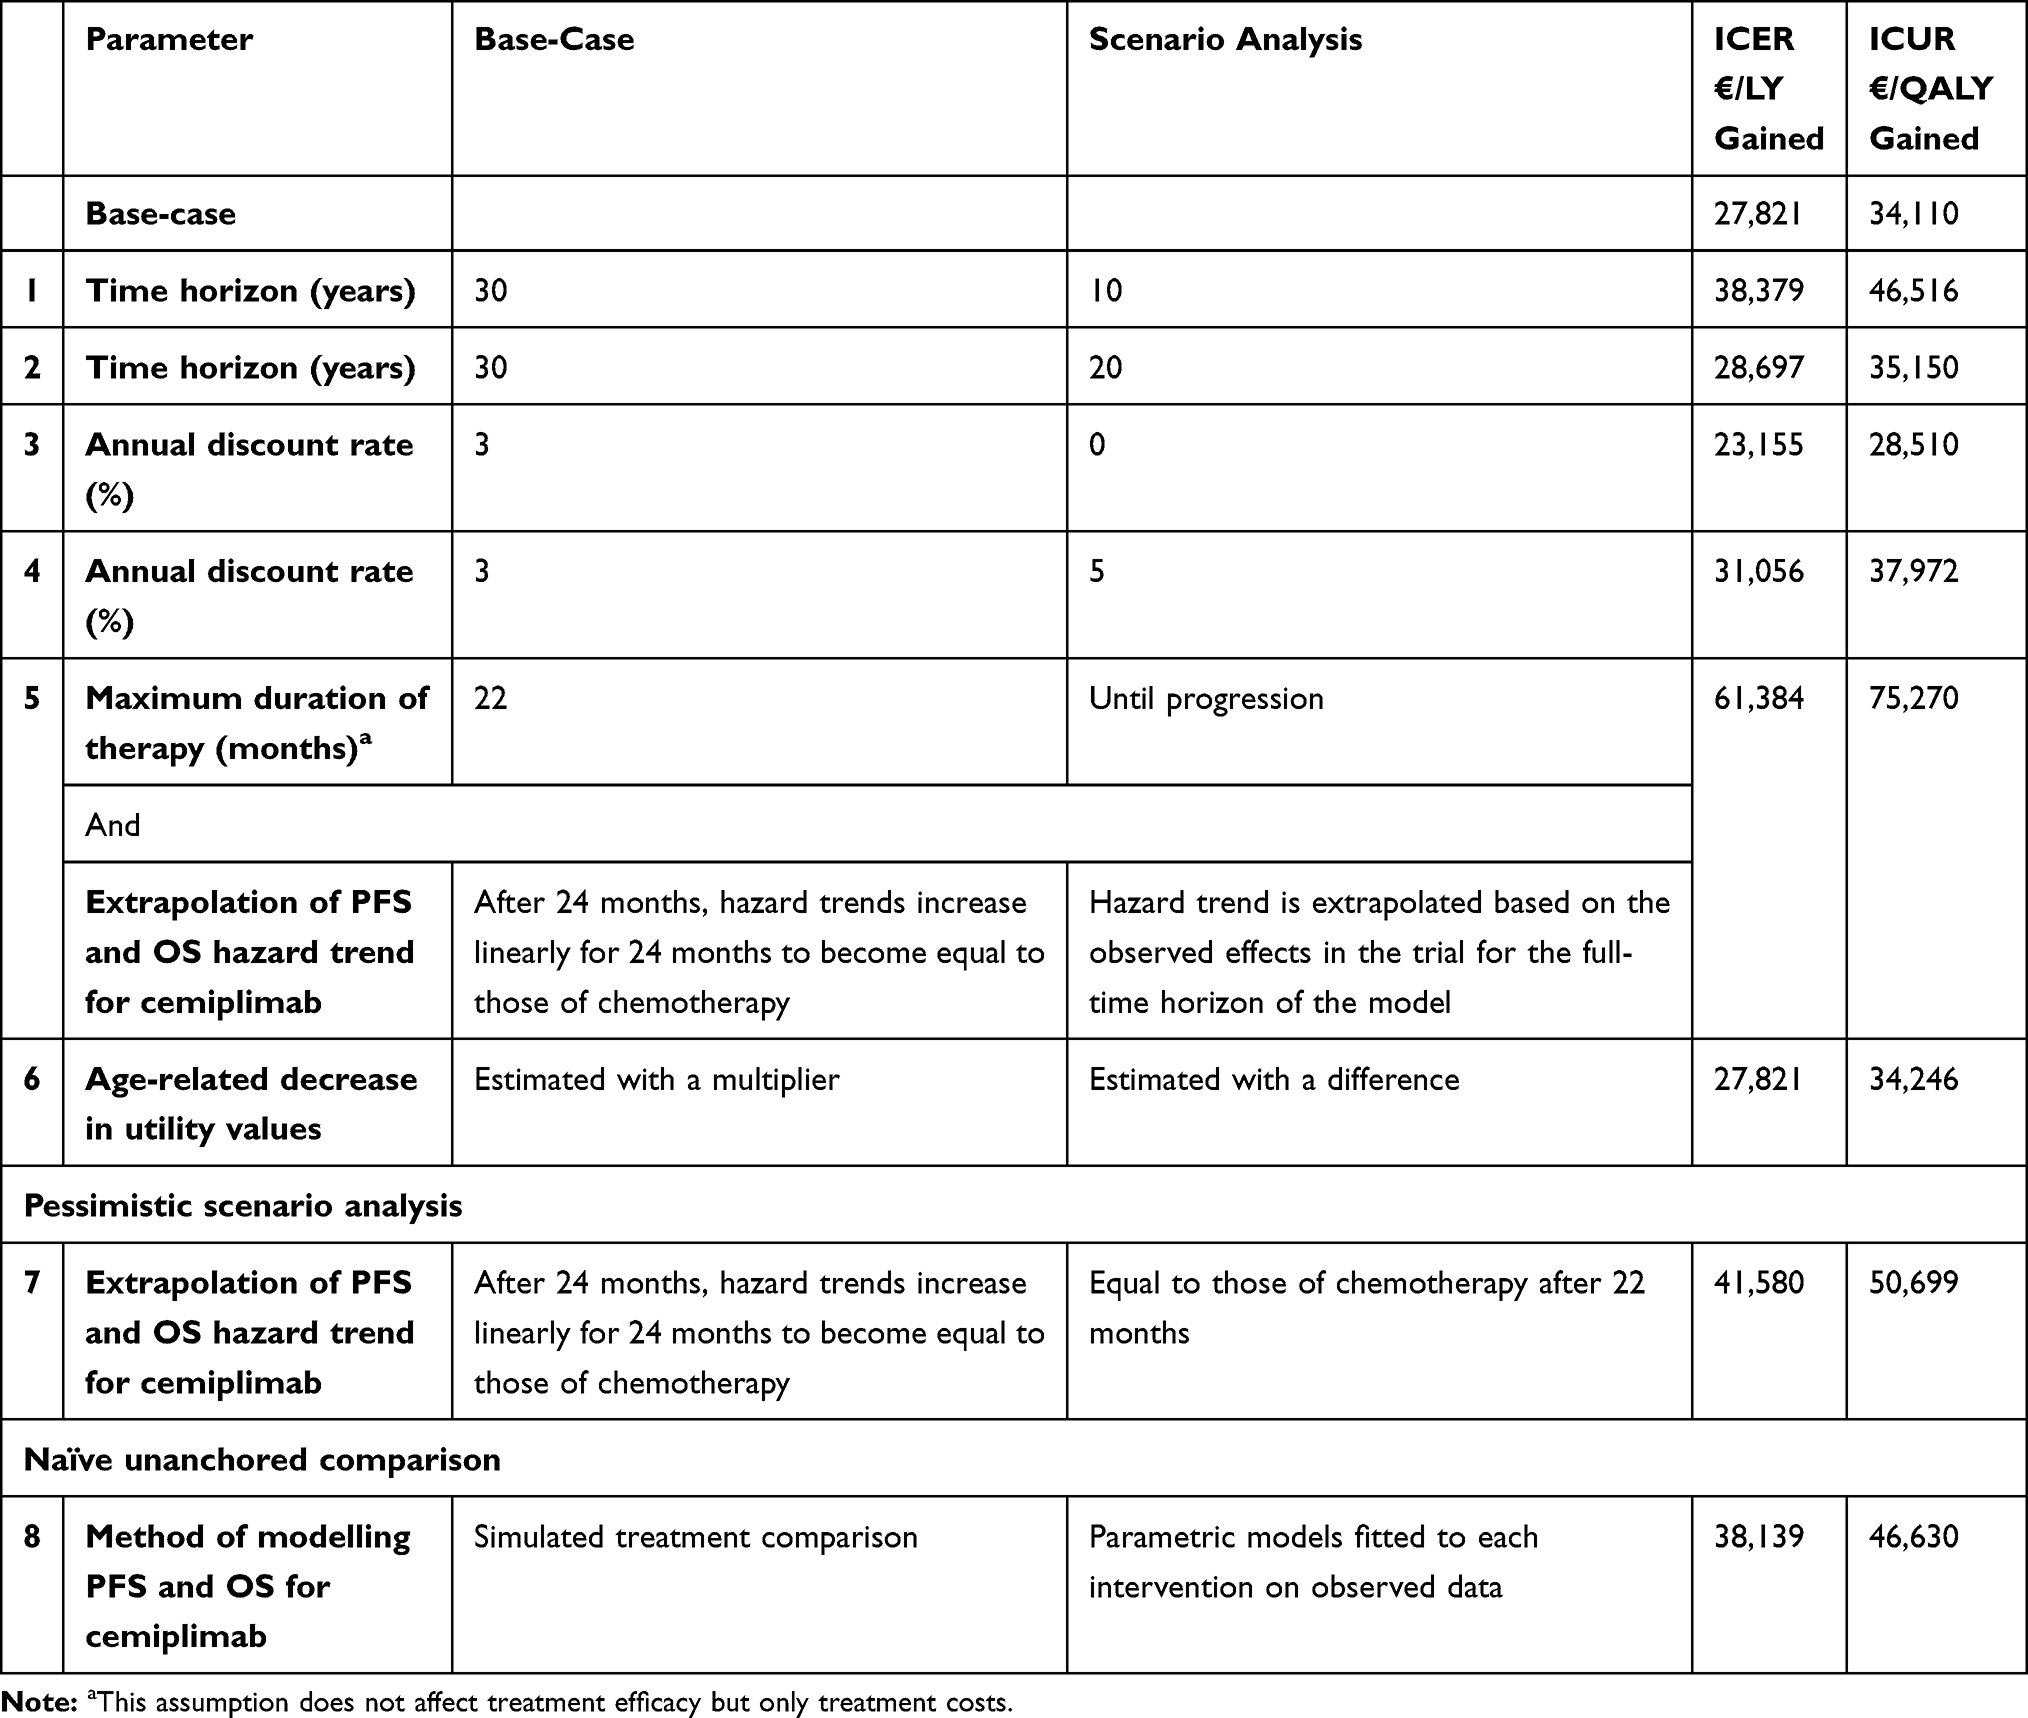 |
Table 6 Scenario Analysis Results |
Discussion
The present study assessed the cost-effectiveness and cost-utility of cemiplimab vs platinum-based chemotherapy for the treatment of aCSCC patients in Italy. The analysis, based on a partitioned survival model, mainly populated with clinical data from the EMPOWER-CSCC 1 trial,19 showed that from the Italian SSN perspective over a 30-year time horizon, cemiplimab was associated with a significant improvement in LYs and QALYs both in pre- and post-progression health state as compared to chemotherapy.
Even though CSCC is the second most common non-melanoma skin cancer, progression to advanced disease is rare. It is well acknowledged that drugs developed to treat rare diseases may have high drug acquisition costs due to large investment in research and development activities and therefore they are not cost-effective when measured by the standard of care, considering the common WTP thresholds.47,48 In our analysis, the estimated ICER (27,821 €/LY gained) and ICUR (34,110 €/QALY gained) were widely below the WTP thresholds for rare diseases of 60,000 €/LY gained and 63,358 €/QALY gained, respectively.45 Furthermore, the ICUR was also below the WTP threshold of € 40,000/QALY gained identified by the Italian Health Economics Association (AIES)46 for the evaluation of health interventions in Italy. In addition, in the scenario analyses, ICERs and ICURs were below the WTP threshold for rare diseases in all tested scenarios but one. Indeed, results were most influenced by removing the 22-month treatment cap for cemiplimab, thus assuming treatment with cemiplimab until progression, and at the same time assuming continuation of hazard trends for cemiplimab, which substantially increased the total cemiplimab drug cost and resulted in a much less favorable ICUR versus chemotherapy of 75,270 €/QALY gained. Although it remains uncertain how cemiplimab will be used in the real-world context, the EMPOWER-CSCC 1 protocol included a stopping rule at 96 weeks in those patients receiving a weight-based dose of cemiplimab. Given that the modelled maximum treatment duration of cemiplimab was 22 months and as data to support the efficacy of cemiplimab beyond 22 months is limited, there may be uncertainty around the long-term treatment effect of cemiplimab and the prognosis of patients who stop treatment at 22 months. To account for this, the base case assumed the long-term treatment effect would be limited to 2 years, and beyond this time point, the hazards will gradually deteriorate before becoming equal to those of the comparator.
Finally, even under the unrealistic pessimistic assumption in which at 22 months the hazards of cemiplimab were assumed to be equal to the hazards of chemotherapy, cemiplimab can still be considered a cost-effective option (ICER = 41,580 €/LY gained and ICUR = 50,699 €/QALY gained).
In this analysis, we use a three-state partitioned survival model structure, which has the main advantage to align with the endpoints as observed in clinical trial, allowing time-dependency in the risk of events over time to be captured since survival is modelled as a function of time since model entry. This implies a closer fit to the actual PFS and OS data as observed in the clinical trials for the relevant interventions. Although data for cemiplimab are immature, using an approach that aligns with the available data was important given that anti-PD-1s are expected to differ from traditional chemotherapies with respect to the mechanism of action, and as a result, the partitioned survival approach seems sufficiently flexible to account for these differences.
The main limitation of the CEA was that the efficacy estimates for PFS and OS were dependent on a single-arm clinical trial evaluating cemiplimab, rather than an RCT comparing cemiplimab to chemotherapy. Similarly, the PFS and OS estimates for the chemotherapy arm were based on a non-comparative, single-arm study. Single-arm trials on their own do not allow for between-trial comparisons of treatment effects among competing interventions, as their treatment effects cannot be disentangled from their study effects. In an attempt to adjust for between-study differences, an STC was performed to explore the impact of adjusting for patient characteristics, which reflects a population-adjusted indirect comparison as recommended by the NICE.28 An alternative scenario was also explored where estimated PFS and OS were based on the observed data for cemiplimab and chemotherapy.
The present study had other limitations due to data availability and assumptions made during the analysis. First, given the ongoing maturity of the cemiplimab data, there is still some uncertainty on the long-term effect. In the base-case, the partitioned survival approach allowed to extrapolate PFS and OS hazard trend over 24 months; as already mentioned, this assumption was tested in the scenario analysis and confirmed the base-case results.
The results presented in the present article are based on preliminary data; therefore, the analyses conducted should be repeated when stronger data become available.
Conclusion
Cemiplimab, a human monoclonal antibody, is the first systemic therapy that has been approved by EMA for the treatment of mCSCC and laCSCC patients. The present analysis suggests that the use of cemiplimab, compared with a platinum-based chemotherapy regimen, which, in the absence of a standard of care, can be assumed to be the current treatment of choice, is likely to extend life expectancy, in pre- and post-progression health state, and to increase the quality of life of patients. When considering its costs to the Italian health care system, it can be considered a cost-effective option for the treatment of aCSCC patients in Italy.
Acknowledgments
The model was originally developed by Precision Xtract and funded by Regeneron. A budget impact analysis on the same drug and target population (ie cemiplimab in Italian patients with advanced cutaneous squamous cell carcinoma) was presented at the Virtual ISPOR Europe 2020 as a poster presentation. The poster’s abstract was published in Volume 23, Supplement 2 on Value in Health: https://www.valueinhealthjournal.com/article/S1098-3015(20)32493-1/abstract.
Disclosure
Ghetti G is an employee of AdRes, which has received project funding from Sanofi for the development of this research. D’Avella MC is an employee of Sanofi. Pradelli L is a partner and employee of AdRes, which has received project funding from Sanofi for the development of this research. The authors report no other conflicts of interest in this work.
References
1. AIOM. Tumori cutanei non melanoma. Carcinoma squamocellulare cutaneo. Edizione; 2019. Available from: https://www.aiom.it/wp-content/uploads/2019/10/2019_LG_AIOM_CSquamocellulare.pdf.
2. AIRTUM. Analisi epidemiologica e caratterizzazione morfologica di pazienti affetti da tumore della cute non melanoma da registro nazionale AIRTUM. Available from: https://www.registri-tumori.it/cms/pubblicazioni/report-i-tumori-cutanei.
3. Schmults CD. High-Risk Cutaneous Squamous Cell Carcinoma: A Practical Guide for Patient Management. Berlin, Germany: Springer-Verlag Berlin Heidelberg; 2016.
4. Lucas R, McMichael T, Smith W, Armstrong B. Solar Ultraviolet Radiation: Global Burden of Disease from Solar Ultraviolet Radiation. Environmental Burden of Disease Series, No. 13. Public Health and the Environment. Geneva: World Health Organization; 2006.
5. Stratigos AJ, Garbe C, Dessinioti C, et al. European interdisciplinary guideline on invasive squamous cell carcinoma of the skin: part 1. epidemiology, diagnostics and prevention. Eur J Cancer. 2020.
6. Stratigos AJ, Garbe C, Dessinioti C, et al. European interdisciplinary guideline on invasive squamous cell carcinoma of the skin: part 2. treatment. Eur J Cancer. 2020.
7. AIOM AIRTUM. I numeri del cancro in Italia; 2018. Available from: https://www.aiom.it/wp-content/uploads/2018/10/2018_NumeriCancro-operatori.pdf.
8. Alam M, Ratner D. Cutaneous squamous-cell carcinoma. N Engl J Med. 2001;344(13):975–983. doi:10.1056/NEJM200103293441306
9. Riihila PM, Nissinen LM, Ala-aho R, et al. Complement factor H: a biomarker for progression of cutaneous squamous cell carcinoma. J Invest Dermatol. 2014;134(2):498–506. doi:10.1038/jid.2013.346
10. Ascierto PA, Schadendorf D. Immunotherapy in non-melanoma skin cancer: updates and new perspectives. Drugs Context. 2019;8:212583. doi:10.7573/dic.212583
11. Ronconi G, Piccinni C, Dondi L, et al. Identification of cases and estimate of direct costs of unresectable and advanced cutaneous squamous cell carcinoma: real-world data from a large Italian database. Br J Dermatol. 2020;10.
12. Hillen U, Leiter U, Haase S, et al. Advanced cutaneous squamous cell carcinoma: a retrospective analysis of patient profiles and treatment patterns-results of a non-interventional study of the DeCOG. Eur J Cancer (Oxford, England: 1990). 2018;96:34–43. doi:10.1016/j.ejca.2018.01.075
13. Cowey CL, editor. Treatment Patterns and Outcomes Among Patients with Advanced Cutaneous Squamous Cell Carcinoma (CSCC) in a US Community Oncology Setting. ASCO Annual meeting; 2019.
14. Sun L, Chin R-I, Gastman B, et al. Association of disease recurrence with survival outcomes in patients with cutaneous squamous cell carcinoma of the head and neck treated with multimodality therapy. JAMA Dermatol. 2019;155(4):442–447. doi:10.1001/jamadermatol.2018.5453
15. Berens AM, Akkina SR, Patel SA. Complications in facial Mohs defect reconstruction. Curr Opin Otolaryngol Head Neck Surg. 2017;25(4):258–264. doi:10.1097/MOO.0000000000000375
16. Arunachalam D, Thirumoorthy A, Devi S, Devi S. Quality of life in cancer patients with disfigurement due to cancer and its treatments. Indian J Palliat Care. 2011;17(3):184–190. doi:10.4103/0973-1075.92334
17. Marcellusi A, Bini C, Peris K, et al. Cost of illness of cutaneous squamous cell carcinoma in Italy. Value Health. 2019;22(suppl3):S452. doi:10.1016/j.jval.2019.09.281
18. Jarkowski A, Hare R, Loud P, et al. Systemic therapy in advanced Cutaneous Squamous Cell Carcinoma (CSCC): the roswell park experience and a review of the literature. Am J Clin Oncol. 2016;39(6):545–548. doi:10.1097/COC.0000000000000088
19. LIBTAYO. Summary of product characteristics. Available from: https://www.ema.europa.eu/en/medicines/human/EPAR/libtayo.
20. AIFA. Determina maggio 2020. Riclassificazione del medicinale per uso umano «Libtayo», ai sensi dell’articolo 8, comma 10 della legge 24 dicembre 1993, n. 537. (Determina n. DG 594/2020). (20A02750) (GU Serie Generale n.134 del 26-05-2020). 2020
21. Williams C, Lewsey JD, Mackay DF, Briggs AH. Estimation of survival probabilities for use in cost-effectiveness analyses: a comparison of a multi-state modeling survival analysis approach with partitioned survival and markov decision-analytic modeling. Med Decis Making. 2017;37(4):427–39. doi:10.1177/0272989X16670617
22. Goeree R, Villeneuve J, Goeree J, Penrod JR, Orsini L, Tahami Monfared AA. Economic evaluation of nivolumab for the treatment of second-line advanced squamous NSCLC in Canada: a comparison of modeling approaches to estimate and extrapolate survival outcomes. J Med Econ. 2016;19(6):630–644. doi:10.3111/13696998.2016.1151432
23. Woods B, Sideris E, Palmer S, Latimer N, Soares M. NICE DSU Technical Support Document 19: Partitioned Survival Analysis for Decision Modelling in Health Care: A Critical Review. The National Institute for Health and Care Excellence; 2017.
24. Caro JJ, Briggs AH, Siebert U, Kuntz KM; ISPOR-SMDM Modeling Good Research Practices Task Force. Modeling good research practices–overview: a report of the ISPOR-SMDM modeling good research practices task force–1. Value Health. 2012;15(6):796–803. doi:10.1016/j.jval.2012.06.012
25. Capri S, Ceci A, Terranova L, Merlo F, Mantovani L; The Members of the Italian Group for Pharmacoeconomic. Guidelines for economic evaluations in Italy: recommendations from the Italian group of pharmacoeconomic studies. Drug Inf J. 2001;35(1):189–201. doi:10.1177/009286150103500122
26. Jansen JP, Fleurence R, Devine B, et al. Interpreting indirect treatment comparisons and network meta-analysis for health-care decision making: report of the ISPOR task force on indirect treatment comparisons good research practices: part 1. Value Health. 2011;14(4):417–428. doi:10.1016/j.jval.2011.04.002
27. Ishak KJ, Benedict A. Novel methods for indirect comparison of treatments: when are they needed and how do they work? Value Outcomes Spotlight. 2016;2(1):20–23.
28. Phillippo DM, Ades AE, Dias S, Palmer S, Abrams KR, Welton KJ NICE DSU technical support document 18: methods for population-adjusted indirect comparisons in submissions to NICE. Regent Court, 30 Regent Street Sheffield, S1 4DA December 2016. 2016
29. Longworth L, Yang Y, Young T, et al. Use of generic and condition-specific measures of health-related quality of life in NICE decision-making: a systematic review, statistical modelling and survey. Health Technol Assess. 2014;18(9):1–224. doi:10.3310/hta18090
30. Scalone L, Cortesi PA, Ciampichini R, et al. Italian population-based values of EQ-5D health states. Value Health. 2013;16(5):814–822. doi:10.1016/j.jval.2013.04.008
31. Szende A, Janssen B, Cabases J. Self-reported population health: an international perspective based on EQ-5D. Springer; 2014. Available from: http://www.ncbi.nlm.nih.gov/books/NBK500356/.
32. Nafees B, Stafford M, Gavriel S, Bhalla S, Watkins J. Health state utilities for non-small cell lung cancer. Health Qual Life Outcomes. 2008;6:84. doi:10.1186/1477-7525-6-84
33. Lloyd A, Nafees B, Narewska J, Dewilde S, Watkins J. Health state utilities for metastatic breast cancer. Br J Cancer. 2006;95(6):683–690. doi:10.1038/sj.bjc.6603326
34. Tolley K, Goad C, Yi Y, Maroudas P, Haiderali A, Thompson G. Utility elicitation study in the UK general public for late-stage chronic lymphocytic leukaemia. Eur J Health Econ. 2013;14(5):749–759. doi:10.1007/s10198-012-0419-2
35. Ministero della Salute. Decreto 18 ottobre 2012. Remunerazione prestazioni di assistenza ospedaliera per acuti, assistenza ospedaliera di riabilitazione e di lungodegenza post acuzie e di assistenza specialistica ambulatoriale. GU Serie Generale n.23 del 28-01-2013 - Suppl. Ordinario n. 8. 2012
36. Conferenza delle Regioni e delle Province Autonome. Accordo Interregionale per la compensazione della mobilità sanitaria. 20/54/CR/7b/C7 del 31 marzo 2020.
37. Scaccabarozzi G, Limonta F, Amodio E. Hospital, local palliative care network and public health: how do they involve terminally ill patients? Eur J Public Health. 2017;27(1):25–30. doi:10.1093/eurpub/ckw152
38. Veneto R. Coordinamento regionale per le cure palliative e per la lotta al dolore. Ricorso al ricovero ospedaliero nella fase terminale della vita dei pazienti oncologici: analisi per azienda ULSS; 2006. Available from: https://www.regione.veneto.it/c/document_library/get_file?uuid=c0884b2e-3d98-4fa6-9b7c-127fae163a6d&groupId=10793.
39. Zucco F HOSPICE IN ITALIA. Seconda rilevazione ufficiale. 2010; Available from: http://www.salute.gov.it/imgs/C_17_pubblicazioni_1450_allegato.pdf.
40. Ministero della Salute. 2006. Nuova caratterizzazione dell’assistenza territoriale domiciliare e degli interventi ospedalieri a domicilio. Available from: http://www.salute.gov.it/imgs/C_17_pubblicazioni_572_allegato.pdf.
41. Vermorken JB, Stöhlmacher-Williams J, Davidenko I, et al. Cisplatin and fluorouracil with or without panitumumab in patients with recurrent or metastatic squamous-cell carcinoma of the head and neck (SPECTRUM): an open-label Phase 3 randomised trial. Lancet Oncol. 2013;14(8):697–710. doi:10.1016/S1470-2045(13)70181-5
42. Lazzaro C, Bordonaro R, Cognetti F, et al. An Italian cost-effectiveness analysis of paclitaxel albumin (nab-paclitaxel) versus conventional paclitaxel for metastatic breast cancer patients: the COSTANza study. Clinicoecon Outcomes Res. 2013;5:125–135. doi:10.2147/CEOR.S41850
43. Mickisch G, Gore M, Escudier B, Procopio G, Walzer S, Nuijten M. Costs of managing adverse events in the treatment of first-line metastatic renal cell carcinoma: bevacizumab in combination with interferon-alpha2a compared with sunitinib. Br J Cancer. 2010;102(1):80–86. doi:10.1038/sj.bjc.6605417
44. Brown B, Diamantopoulos A, Bernier J, et al. An economic evaluation of cetuximab combined with radiotherapy for patients with locally advanced head and neck cancer in Belgium, France, Italy, Switzerland, and the United Kingdom. Value Health. 2008;11(5):791–799. doi:10.1111/j.1524-4733.2007.00302.x
45. Messori A, Santarlasci B, Trippoli S, Vaiani M. Controvalore economico del farmaco e beneficio clinico: stato dell’arte della metodologia e applicazione di un algoritmo farmacoeconomico. Pharmacoeconomics-Ital-Res-Articles. 2003;5(2):53–67. doi:10.1007/BF03320605
46. Fattore G. Proposta di linee guida per la valutazione economica degli interventi sanitari in Italia: documento per la discussione. Pharmacoeconomics-Ital-Res-Articles. 2009;11(2):83–93. doi:10.1007/BF03320660
47. Pearson I, Rothwell B, Olaye A, Knight C. Economic modeling considerations for rare diseases. Value Health. 2018;21(5):515–524. doi:10.1016/j.jval.2018.02.008
48. Drummond MF, Wilson DA, Kanavos P, Ubel P, Rovira J. Assessing the economic challenges posed by orphan drugs. Int J Technol Assess Health Care. 2007;23(1):36–42. doi:10.1017/S0266462307051550
 © 2021 The Author(s). This work is published and licensed by Dove Medical Press Limited. The
full terms of this license are available at https://www.dovepress.com/terms
and incorporate the Creative Commons Attribution
- Non Commercial (unported, 3.0) License.
By accessing the work you hereby accept the Terms. Non-commercial uses of the work are permitted
without any further permission from Dove Medical Press Limited, provided the work is properly
attributed. For permission for commercial use of this work, please see paragraphs 4.2 and 5 of our Terms.
© 2021 The Author(s). This work is published and licensed by Dove Medical Press Limited. The
full terms of this license are available at https://www.dovepress.com/terms
and incorporate the Creative Commons Attribution
- Non Commercial (unported, 3.0) License.
By accessing the work you hereby accept the Terms. Non-commercial uses of the work are permitted
without any further permission from Dove Medical Press Limited, provided the work is properly
attributed. For permission for commercial use of this work, please see paragraphs 4.2 and 5 of our Terms.