Back to Journals » Nutrition and Dietary Supplements » Volume 11
Predictors of thinness and improved dietary diversity among School Aged Children in Southern Ethiopia
Authors Wolde T ![]() , Belachew T
, Belachew T
Received 3 July 2019
Accepted for publication 27 September 2019
Published 7 November 2019 Volume 2019:11 Pages 49—58
DOI https://doi.org/10.2147/NDS.S221739
Checked for plagiarism Yes
Review by Single anonymous peer review
Peer reviewer comments 2
Editor who approved publication: Dr Chandrika Piyathilake
Tsedeke Wolde, Tefera Belachew
Department of Nutrition and Dietetics, Faculty of Public Health, Institute of Health, Jimma University, Jimma, Ethiopia
Correspondence: Tsedeke Wolde
Department of Nutrition and Dietetics, Faculty of Public Health, Institute of Health, Jimma University, Jimma, Ethiopia
Tel +251910-9430-69
Email [email protected]
Introduction: Thinness and lack of diversified foods are common nutritional problems among children in developing countries. There is limited evidence on the level of thinness, and dietary among school aged children in Ethiopia. Therefore, the aim of this study was to determine the prevalence of thinness and adequate dietary diversity and their predictors among primary schools.
Methods: A cross-sectional study was conducted in Meskan District of Southern Ethiopia, from October 11 to November 3, 2016. A simple random sampling technique was used to select 408 school age children. Data on sociodemographic, and anthropometric variables were collected using structured and trained interviewer administered questionnaires and anthropometrists, respectively. Body-mass-index-for-age z-scores for thinness were computed using WHO AnthroPlus, and dietary diversity score was generated using 24-hour recall dietary data. Both bivariate and multivariable logistic regression analyses were done to identify factors associated with thinness and dietary diversity. A p-value <0.05 was used to declare the significance of association.
Results: The prevalence of thinness was 10.1% (95% CI=7.1–13). Children who lived in urban areas were 65% less likely to be thin (AOR=0.35; 95% CI=0.13-0.93) compared to those who lived in rural areas after controlling for other variables. The proportion of children who met minimum dietary diversity was 27.5% (95% CI=23–32). Children living in households with rich wealth index Terciles (AOR=1.88; 95% CI=1.09–3.21) and children living in urban areas (AOR=2.38; 95% CI=1.28–4.39) were twice more likely to have adequate dietary diversity compared to their counter parts. 
Discussion: The prevalence of thinnessn is less common in the study area when compared to the prevalence reported by other studies in developing countries. Residence of children was associated with thinness. The practice of having diversified diet was low among children . Rich family wealth status and place of residence were significantly associated with adequate dietary diversity. Hence, targeted interventions that focus on rural children and household socioeconomic status are needed to improve dietary diversity and nutritional status.
Keywords: Dietary diversity, school age children, thinness, South Ethiopia
Introduction
Thinness greatly affects both the cognitive and physical development of children.1,2 Thinness has been adapted recently as a more appropriate indicator of relatively recent nutritional deprivation, such as insufficient dietary intakes of energy, protein, or several micronutrients, than underweight in older children.3
Undernutrition is widespread among school age children (particularly in South Asia and Africa), and their nutritional status often worsens during their school years.1,2 Studies showed that the developing countries India, Kenya, and Tunisia reported that the prevalence of thinness was 49%, 15.6%, and 1.3%, respectively.4–6
In Ethiopia, undernutrition and consumption of poor dietary diversity intake among children continues to be a major public health problem. A study done in Fogera and Libo Kemkem Districts of North Ethiopia shows that the prevalence of thinness among school-aged children was 21.4% in rural areas and 20.8% in urban areas.7 Another study done in rural areas of Tigray, Ethiopia shows that 58.3% of the female children were thin.8 Studies done in Arba Minch area of Southern Ethiopia and Addis Ababa, capital city of Ethiopia, reported that the prevalence of thinness was 8% and 6.2%, respectively.9,10 Similar research conducted in National School Health and Nutrition (SHN) in 2008 showed that the prevalence of thinness was 23%.11 Socioeconomic status, place of residency, age, family size, maternal education, poor water supply & sanitation, diarrhea episodes, and eating less than three meals per day were the frequently mentioned factors that influence the nutritional status of the children.7–11
Lack of dietary diversity is a severe problem among poor populations in the developing countries, where diets are predominantly based on starchy staples which lack essential micronutrients and contribute to the burden of malnutrition and micronutrient deficiencies.12,13 Studies from different developing countries reported that those having adequate dietary diversity among school age children totaled 11.2% of Zimbabwe,14 26.8% of Southwest Ethiopia,15 and 75.4% of Northwest Ethiopia.16 A number of studies are linked to household food insecurity, poor socioeconomic status, place of residence, nutritional knowledge, maternal education and occupation, all of which are important predictors with dietary diversity of children.15,17–19
The prevalence of undernutrition, minimum dietary diversity, and their predictors are well studied among children under 5 years old. However, there is limited information about the level of thinness and school age children’s dietary diversity in developing countries including Ethiopia. Therefore, this study will address the gap by assessing the level of thinness and improved dietary diversity among primary school children and their predictors in the study area.
Methods
Study Setting, Design, And Period
This study was conducted in primary schools of Meskan District, Southern Ethiopia located 135 km south of Addis Ababa. The district has an estimated total population of 411,933, consisting of 204,037 males and 207,896 females.20 The district is reported to have 1,800 malnourished cases annually.21 A total of 6,745 students were enrolled in the 2015/16 academic year. A school-based cross-sectional study was employed from October 11 to November 3, 2016 to assess the prevalence of thinness and dietary diversity, along with their predictors.
Population And Sampling
The source population were the students grade 5–8 in the selected primary schools during the study period. The study population were the students who were between 10–15 years. Students with edematous conditions were excluded from the study.
The sample size was calculated using the single population proportion formula with assumptions of were 21.4% as prevalence of thinness among school aged children in Fogera and Libo Kemkem District of North Ethiopia,7 95% confidence level, 1.5 design effect, 5% nonresponse rate, and 4% degree of precision. Finally, a total of 408 participants were included in the study.
Study subjects were selected using a two-stage cluster sampling technique from the primary schools of Meskan District. Then 10 schools from the 40 primary schools were selected randomly to get the primary sampling unit. Then proportional allocation to size groups was done for schools to select study subjects from those selected clusters, to get the secondary sampling unit. Study subjects were then selected by simple random sampling (Figure 1).
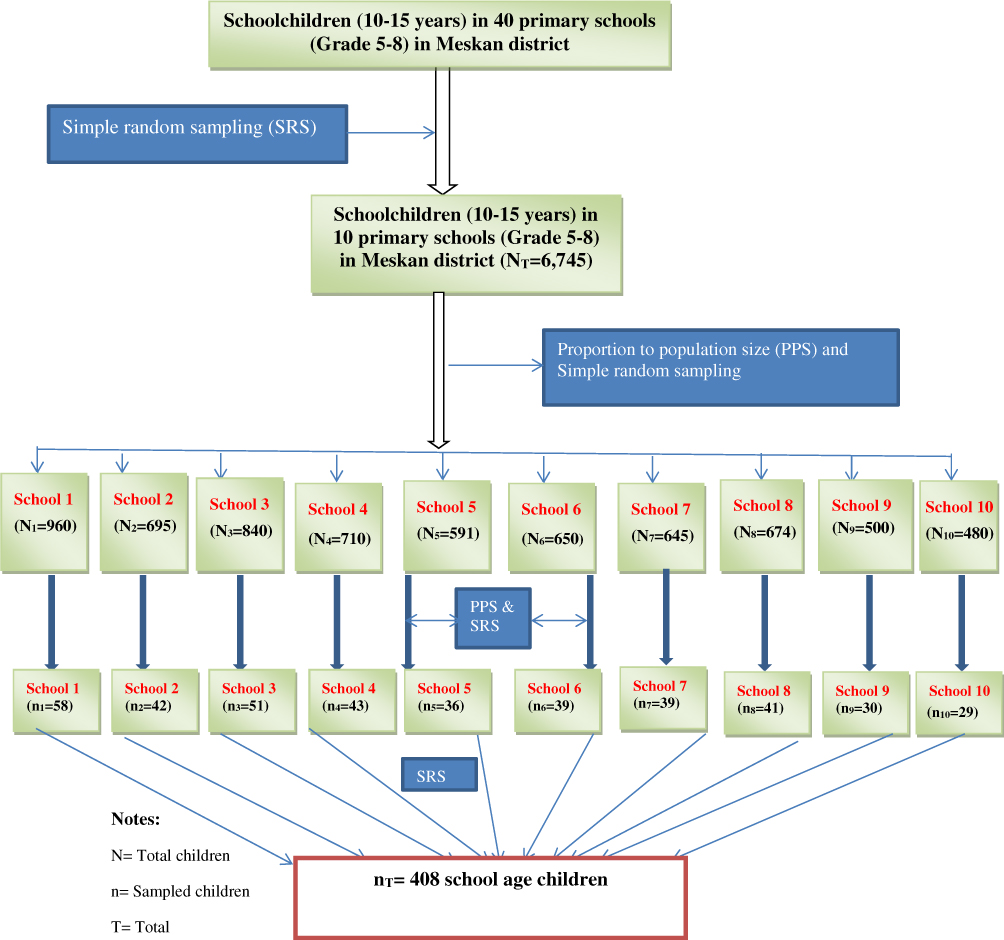 |
Figure 1 Schematic representation of participant enrollment. Abbreviations: N, Total children; n, Sampled children; T, Total. |
Data Collection, Measurements, And Quality Control
The questionnaire was adopted from the National Nutrition Survey (NNS).22 Data were collected using a pre-tested structured interviewer-administered validated questionnaire. Six research assistants (four nurses working as data collectors and two health officers working as supervisors) were recruited for data collection. A three days of intensive training were given on the questionnaire and data collection techniques for the data collectors and supervisors by the principal investigator. Data collectors were supervised throughout the data collection process. The data on household wealth index was collected by asking ownership of durable assets based on EDHS 2016 wealth index variables.23 Household wealth index was generated using a principal component analysis after checking all the assumptions.24 The wealth index was ranked ordered into Terciles (rich, middle, and poor) 24
Anthropometric measurements consisting of height and weight were taken based on the standard procedure outlined in the Anthropometric Indicators Measurement Guide.25 Children were weighed and measured using a standard SECA digital scale. Weight was measured following standard anthropometric techniques and recorded to the nearest 0.1 kilograms without shoes and wearing light clothing.25 Height was measured using a stadiometer with the four points (heel, buttocks, shoulders) touching the vertical stand of the stadiometer and head adjusted in a Frunkfert Plane. The age of the child in completed years was obtained from student’s records and confirmed by their parents. In this study, children whose body mass index (BMI) for age z-score (BAZ) is below minus two standard deviations (−2 SD) from the median of the reference population are classified as having thinness or underweight. Children whose BMI-for-age z-score is below −3 SD from the median were considered severely thin or underweight.26
Data on dietary diversity was assessed using food groups consumed by the schoolchild in the 24 hours prior to the assessment. A total of 12 food groups were considered in this study, ie, Cereals, Vitamin A rich vegetables & tubers, White tubers & roots, Dark green leafy vegetables, Mango, papaya, or vitamin A rich fruits, Other any fruits or vegetables, Organ meat (iron-rich), Any meat products, Eggs, Any fish, Legumes, nuts & seeds, and Milk & milk products. The outcome, dietary diversity, was assessed using a standard tool suggested by the Food and Agricultural Organization to measure children’s dietary diversity.27 Food consumed by schoolchildren was assessed through 24-hour recall method and then food items were categorized into the 12 food groups. A Dietary Diversity Score (DDS) was created as a summary measure of dietary intake, accordingly participants who had a DDS of six and above were deemed as having improved or adequate dietary diversity, whereas inadequate DDS was ascertained when they had less than six DDS.27
Questionnaires were first translated from English to Amharic (local language) and then back translated to English to validate consistency. A pre-test was conducted a week before the actual data collection in 5% of the sample in a school which is not included in the sample assumed to have the same socio demographic characteristics with the sampled schools, and a reliability test was done using cronbach’s alpha.
Data Analysis
The data were edited, coded, and doubly entered into EpiData 3.1. Analysis was carried out by using SPSS for windows version 23. Descriptive statistics was computed for sociodemographic variables. Frequency, mean, and standard deviation were obtained for continuous variables. For anthropometric data analysis, standard deviations (z-scores) were obtained by WHO Anthro Plus software,26 to determine the nutritional status of children.
The collinearity was checked using variance inflation factor (VIF) and standard error, and non-collinear covariates were included in the independent binary logistic regression model to assess the possible association of independent and outcome variables. Hosmer-Lemeshow test was checked for goodness of fit of the model. 28 Those variables with a p<0.2 in bivariable logistic regression model were entered into the multivariable logistic regression model to isolate the independent effect of each predictor variable on the thinness and dietary diversity while controlling the effects of the other variables (and their categories) included in the model. Variables with p<0.05 in multivariable logistic regression analysis were identified as the predictors of thinness and dietary diversity. The crude and adjusted odds ratio with 95% confidence interval was reported.
Ethical Consideration
The proposal was approved by the ethical committee of the College of Health Sciences, Jimma University. Every study participant was briefed about the research intent and asked for permission to participate on his or her own will, and was informed that he or she will not miss anything by refusing to participate in the study. The privacy of study participants was kept. The participants were reassured about confidentiality of the data. Consent forms were signed by the parents of the selected students. The students themselves also agreed orally to participate in the study.
Results
A total of 378 participants were involved in this study from 408 participants planned to be included in the study, giving a response rate of 93%. From the 378 schoolchildren, 207 (54.8%) were females and 171 (45.2%) were males, giving a female-to-male ratio of 1.2:1. The mean (±SD) age of the children was 12.8 ±1.3) years. More than half of the schoolchildren, 202 (53.4%), were attending grade six. The majority of the study participants, 273 (72.2%), were living in rural areas. More than half of the fathers, 205 (54.2%), had completed or were attending primary school education, and half of the mothers, 189 (50%) had no formal schooling or were illiterate. Around two thirds of the fathers, 228 (60.3%) were farmers, and 235 (62.2%) of the mothers were housewives. The majority of the study participants, 342 (90.5%), had a family size above four members. Near to half, 169 (44.7%), of the study participant were categorized into rich family wealth status (Table 1).
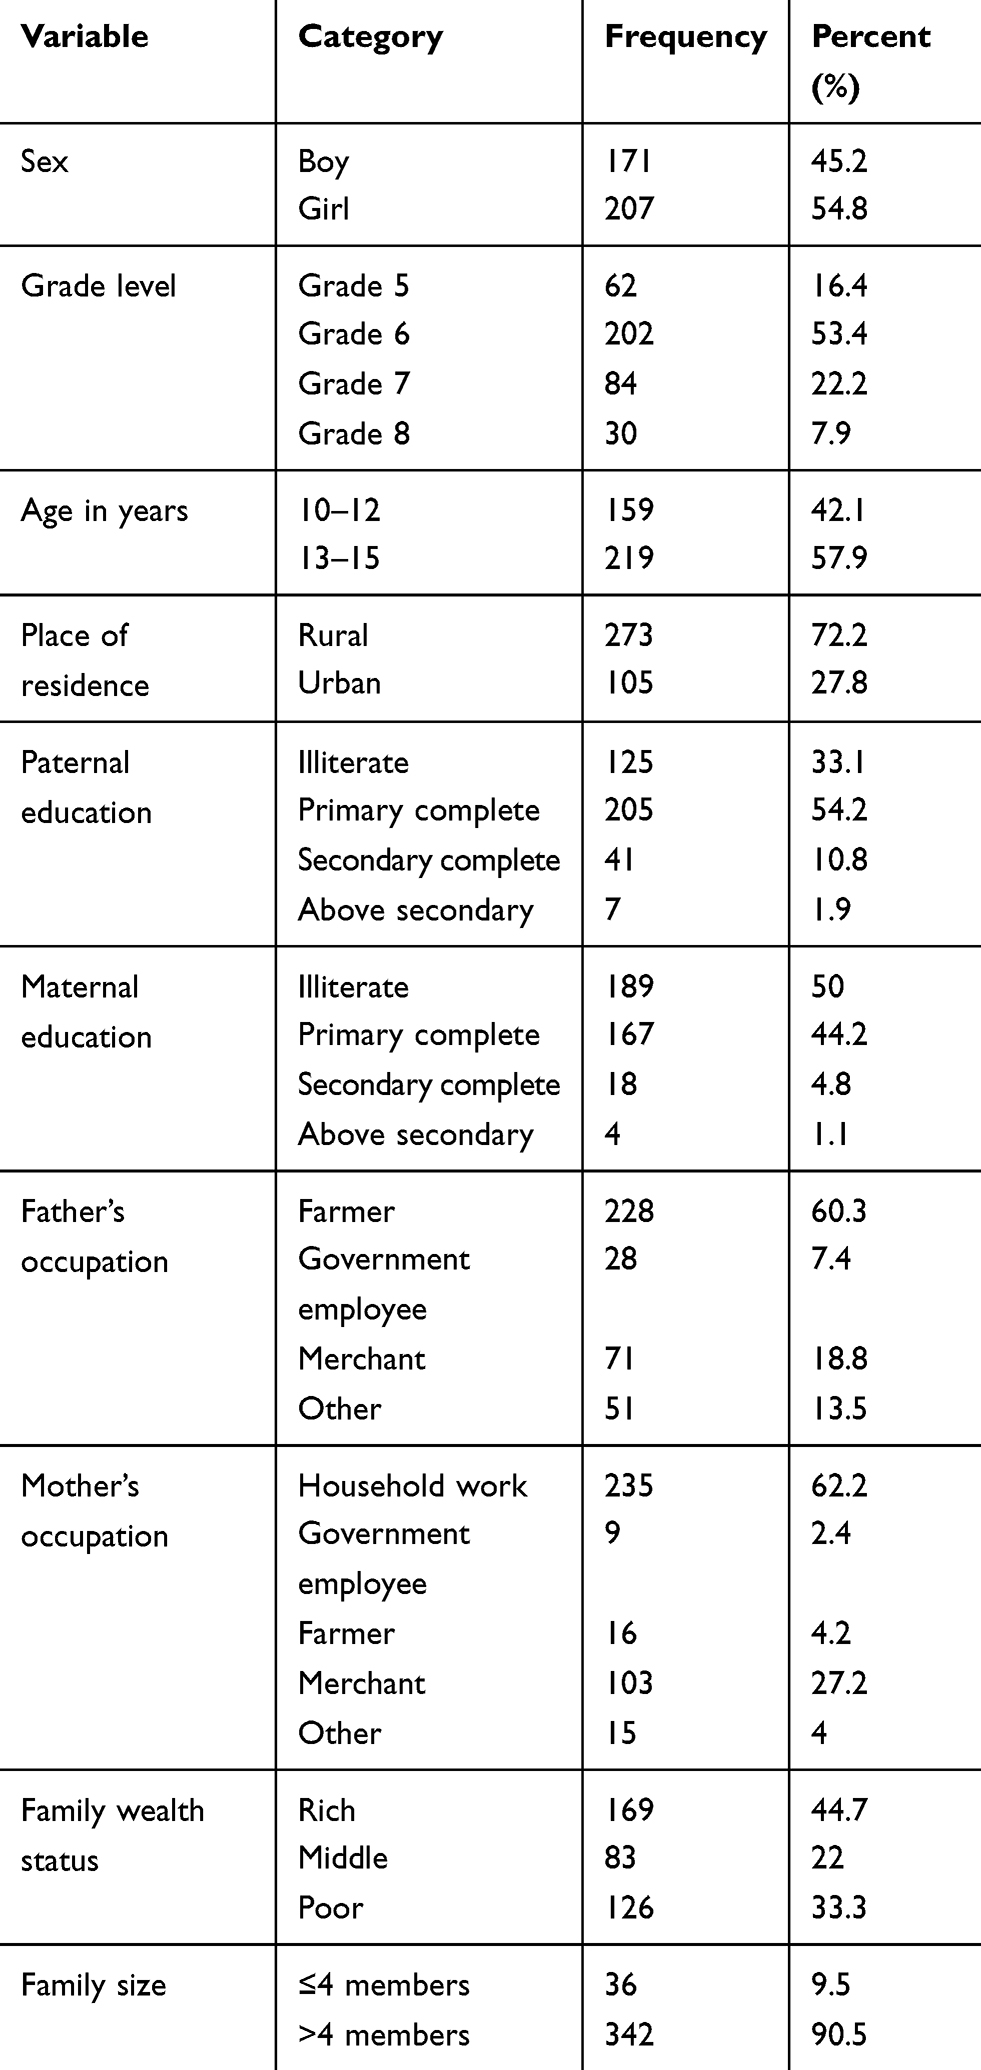 |
Table 1 The Socio-Demographic Characteristics Of The Study Population In Meskan District Of South Ethiopia |
Health And Environmental Conditions Of School Children
Only 131 (34.7%) children experienced illness two weeks preceding the data collection period. History of being infected with intestinal parasites (20.4%) and malaria (16.1%) were the health problems in the study area.
About 42.3% of the children usually ate a lunch meal. Two hundred and thirty-two (61.4%) children had the habit of skipping any regular meal. The majority of respondents stated their reason for ping regular meals was lack of appetite (45.3%).
The availability of home gardening was stated by 77.8% of the study participants. The majority of the households (84.9%) reported that they used water from improved sources, and 67.7% treated their drinking water. The majority (91%) of the respondents had a functional latrine at their home. Of the respondents, 95.8% had good habit of hand washing after toilet, and 97.6% washed hands before eating (Table 2).
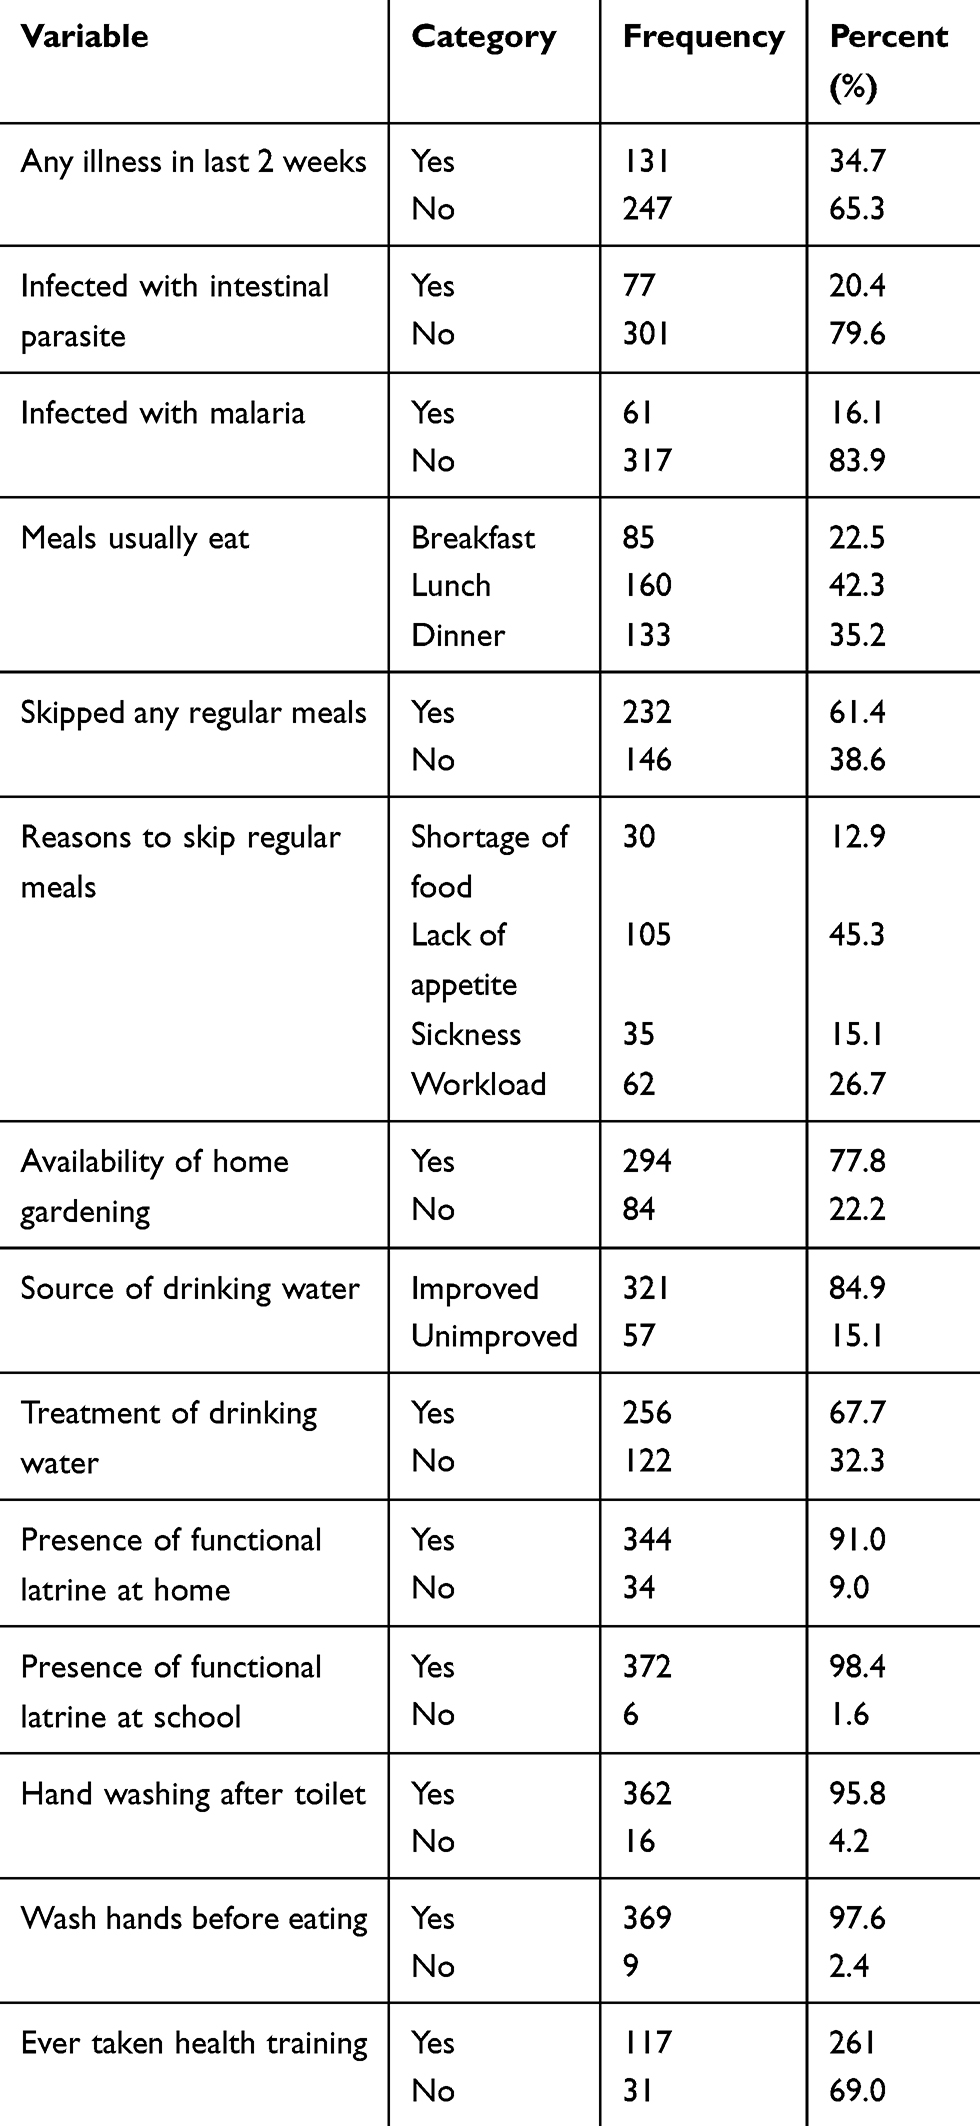 |
Table 2 Health And Environmental Conditions Of Children In Meskan District Of South Ethiopia |
Prevalence Of Thinness Among School Age Children
The mean and standard deviation (±SD) BMI for age z-score of students were 0.72 (±1.03). According to the WHO body mass index (BMI) for age z-score standard,29 the prevalence of thinness among school-aged children was 10.1% (95% CI=7.1–13), while the prevalence of severe forms of thinness was 1.3% (95% CI=0–2.6).
The prevalence of thinness was higher among the male participants (11.7%) compared with the female participants (8.7%). The prevalence of thinness was slightly higher among participants aged between 10–12 years (10.1%) compared with the participants aged 13–15 years (10%). The highest prevalence of thinness (11.7%) was observed among participants from rural areas, while the lowest prevalence of thinness was observed among participants from urban areas (5.7%) (Table 3).
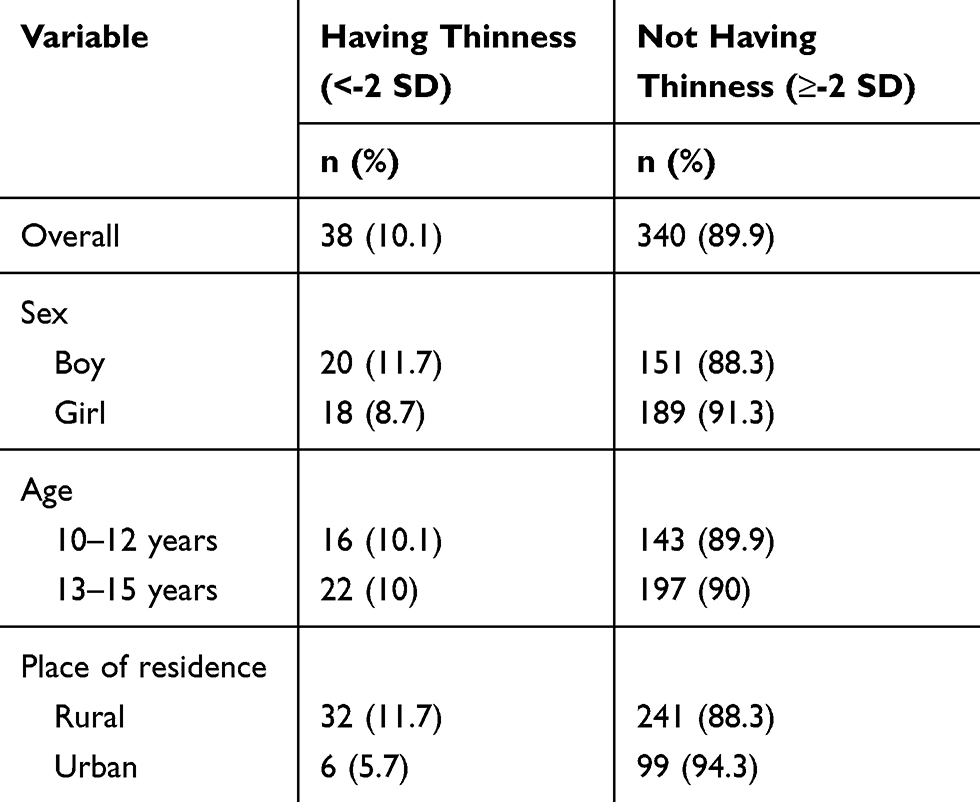 |
Table 3 Prevalence Of Thinness By Overall, Sex, Age Groups, And Residence Of Children In Meskan District Of South Ethiopia |
Dietary Diversity Intakes By Schoolchildren
Overall, 27.5% (95% CI=23–32) of children had adequate dietary diversity. Moreover, the mean dietary diversity score of participants was 4.66±1.85. The majority (78%) of children ate cereal staple foods (teff, corn, wheat, sorghum, millet, barley, etc.). Only 18%, 14%, and 5% ate any meat products, organ meat, and any type of fish, respectively (Figure 2).
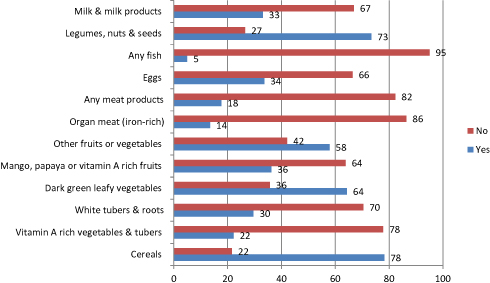 |
Figure 2 Types of food groups consumed by children in Meskan district of South Ethiopia. |
Factors Associated With Thinness And Adequate Dietary Diversity In Bivariable And Multivariable Logistic Regression Model
As shown in the multivariable logistic regression model (Table 4), with 95% CI, thinness was significantly associated with place of residence (rural). However, it was not significantly associated with age, sex, wealth index, family size, illness in the last 2 weeks, skipping any regular meals, source of drinking water, or the availability of home gardening. Children who lived in urban areas were 65% less likely to be thin (AOR=0.35; 95% CI=0.13–0.93) compared to those who lived in rural areas. As indicated in the multivariable logistic regression model (Table 4), with 95% CI, adequate dietary diversity was significantly associated with the place of residence and wealth index. However, it was not significantly associated with age, sex, family size, educational status of parent, or illness in the last 2 weeks. Children from those households with rich wealth terciles (AOR=1.88; 95% CI=1.09–3.21) and living in rural areas (AOR=2.38; 95% CI=1.28–4.39) had almost 2-times higher odds of being on an adequate diversified diet compared to their counterparts (Table 4).
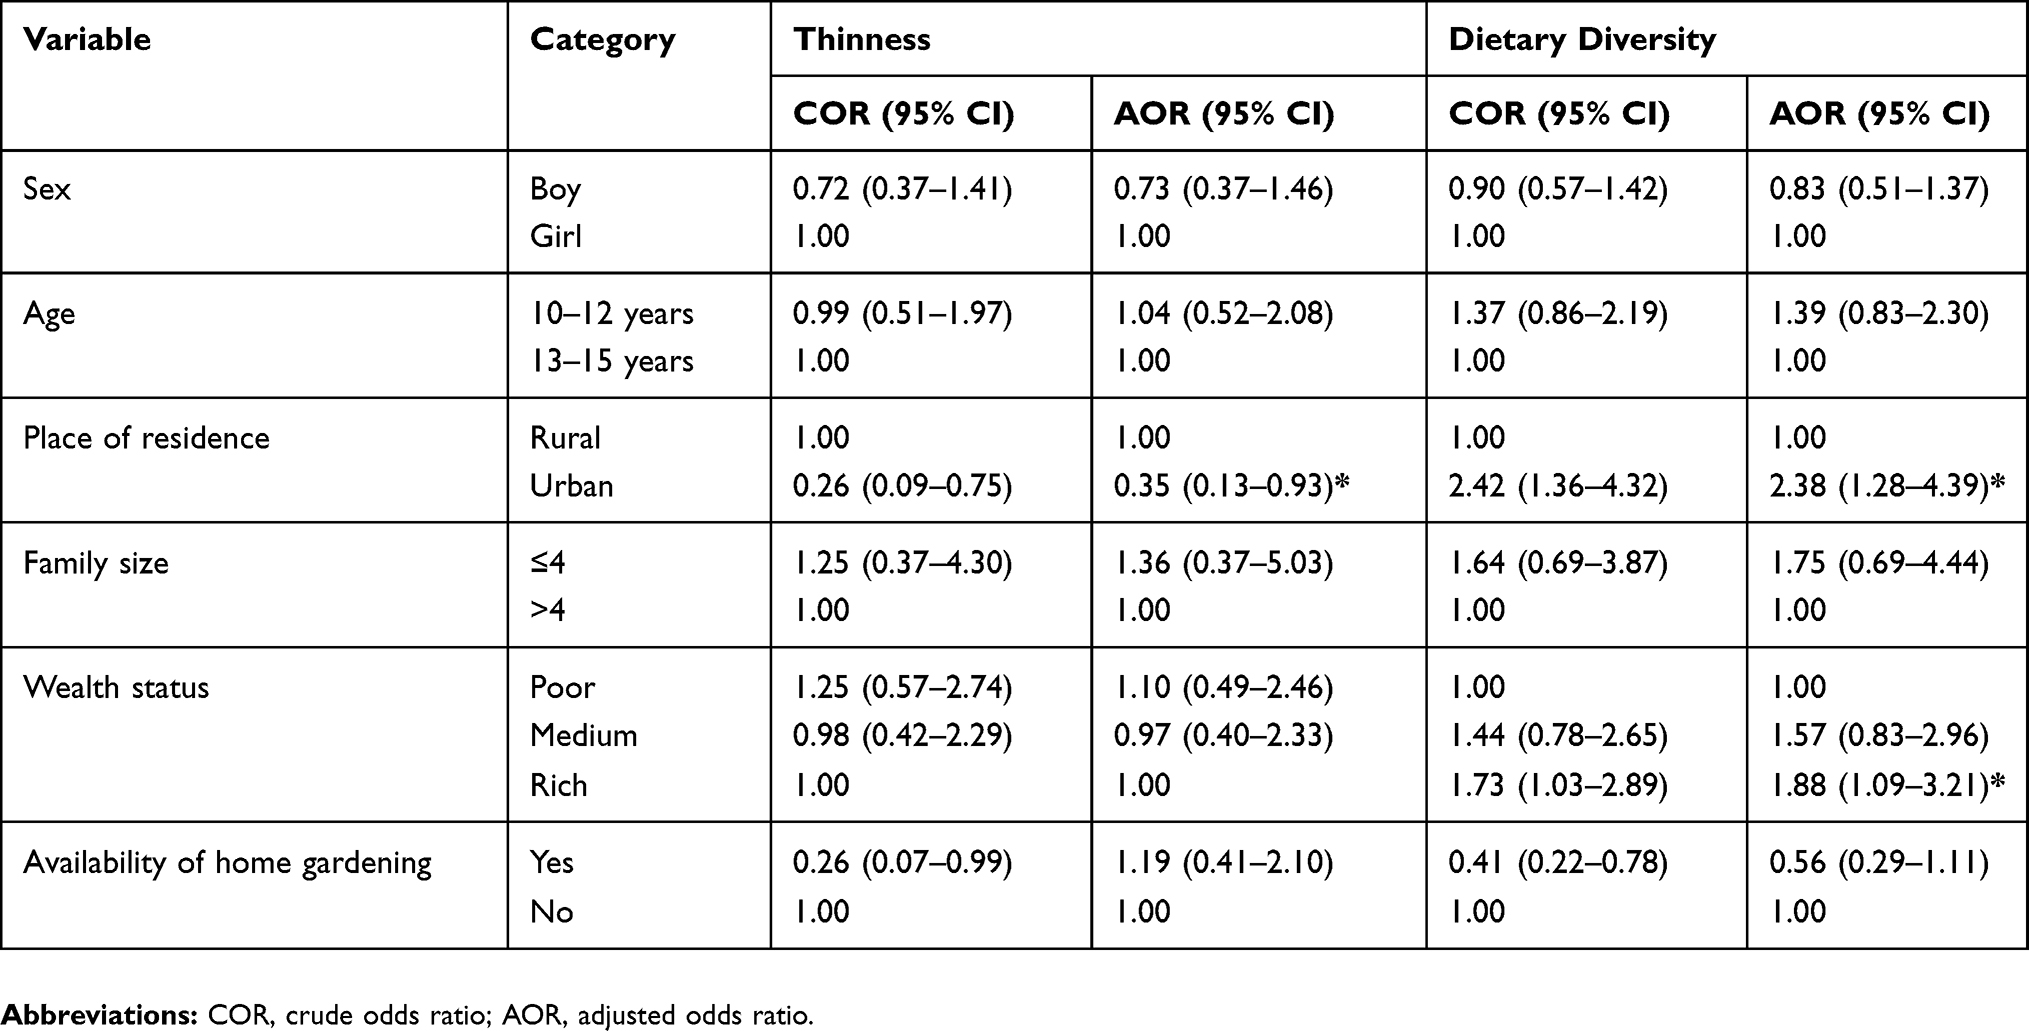 |
Table 4 Factors Associated With Thinness And Dietary Diversity Among Children In Meskan District Of South Ethiopia |
Discussion
Thinness can be considered less common in the study area, at 10% of school age children. This finding is in line with the prevalence observed from Pakistan (10%)30 and Tamale Metropolis-Ghana (10%).31
However, the current finding is much lower than the prevalence reported from other developing countries such as India (49%),4 Seychelles (27.7%),32 and Ghana (19.4%).33 This figure is also lower than the finding reported from the National School Health Nutrition survey, Ethiopia (23%).11 This prevalence is also lower than the results of other similar local studies conducted in Ethiopia.7,34,35
The present study shows that the prevalence of thinness is higher than those findings from Tunisia (1.3%),6 Arba Minch-South-Ethiopia (8%),9 and Addis Ababa City (6.2%).10
Undernutrition varies from region to region depending on ecological, social, economic, and other factors. In Ethiopia, at present, the most serious nutritional problems are mainly due to low socioeconomic status, inadequate diversity foods, and poor water supplies.36,37 The variation could also be due to illiteracy, inadequate access to health facilities, socioeconomic disparities, and cultural differences in dietary habit and care practices.
The odds of being thin were lower among children who lived in urban areas than those who lived in rural areas. The study finding is consistent with findings documented in Ethiopia,38 Nigeria,39 and in Northern Africa,40 that have shown that the prevalence of thinness is higher in rural areas compared with urban areas. This could be due to the low socioeconomic status of the rural areascompounded with high energy expenditure of children due travel to school and other activities. This result is expected, as the issue of undernutrition is closely linked with low income, perhaps a lower level of education, and poverty.41
The current study revealed that only 27.5% of the children had consumed food with adequate dietary diversity on the previous day. Similar findings were reported from Iran (26.6%),42 the National baseline survey in Ethiopia (28%),43 and Gurage Zone, Ethiopia (26.8%).15 The present finding is lower than the study conducted in Bale zone (80.4%),44 Gonder City-Northwest Ethiopia (75.4%),16 Chiro town-East Ethiopia (74.2%),45 and Adama town (41.2%),46 but higher than Zimbabwe (11.2%),47 Libo Kemkem & Fogera Districts (5%),48 and Amhara region (21.8%).49 The finding in this study area was the lower than the reports of developing countries which could be due to the lack of diversity in agricultural production, the monotonous nature of dietary diversification, and the nature of the study.36,37 The majority (72.2%) of the children included in this study were also from the rural residence . The monotonous diet in the area, that is also prevailing all across the country, may be the result of lack of diversity in agricultural production. This is the most likely impediment for dietary practices in the study area. A monotonous diet lacks essential micronutrients and contributes to the burden of micronutrient deficiencies.36,50 In their resource-poor settings – where ongoing food scarcity leads to poorly diversified and low nutrient dense child diets that constrain child growth – food-insecure families .36
Studies in Ethiopia indicated that food consumption patterns are very diverse and their food basket consists of a wide variety of grains and other staples, which are varied across agro ecology, socioeconomic levels, and livelihood strategies,51 as well as affected by tradition of the societies and food preferences.52 In order to overcome the problems of dietary diversity, agricultural interventions geared towards diversification of food production in the study area should constitute among the long-term intervention priorities. The authors also believe that inadequate dietary diversity may well be attributed to a lack of parent’s and children’s knowledge on how to prepare food from different food groups. The result of multivariable logistic regression analysis revealed that students from urban residence and in a family rich wealth index tertile had a more adequately diversified diet compared to their counterparts, which is consistent with the report of a study from Jimma, Southwest Ethiopia.53–55 This could be related to more affordability of a variety of food constituents among rich wealth families.
The limitation of this study was the failure to collect information on variables like seasonal variation of food availability, food taboos, and carrying food to schools. There may be recall bias in reporting different food groups consumed over the previous day referring to dietary diversity score.
Conclusion
The prevalence of undernutrition is low in the study area when compared to the report of other studies in developing countries. Residence of children was associated with thinness. The proportion of children having diversified diet was low. The practice of having a diverse diet among children is low. Houshold wealth status of rich and place of residence were significantly associated with adequate dietary diversity. In addition, the fact that a small fraction of respondents mentioned the consumption of foods from most food sources (except the foods from grains sources and vegetables to some extent) in a typical day confirms the seriousness of the food diversity problem in the area. Hence, targeted interventions that focus on rural children and household socioeconomic status are recommended to improve the practice of diversity foods and nutritional status.
Acknowledgments
The authors would like to express their sincere gratitude to Jimma University for their technical support, study participants, and all individuals who rendered help during the study period.
Author Contributions
TW and TB contributed to conception and design, acquisition of data, or analysis and interpretation of data. All authors contributed to data analysis, drafting or revising the article, gave final approval of the version to be published, and agree to be accountable for all aspects of the work.
Disclosure
The authors report no conflicts of interest in this work.
References
1. Drake L, Maier C, Jukes M, et al. School-age children: their nutrition and health. Partnership for Child Development. SCN News. 2002;25:4–30.
2. Jukes M, McGuire J, Method F, Sternberg R. Nutrition: A Foundation For Development. Geneva: ACC/SCN. 2002; 1–4. Available from: http://www.bvsde.paho.org/texcom/nutricion/intnut2.
3. World Health Organization (WHO). Physical status: the use and interpretation of anthropometry. Report of a WHO Expert Committee. World Health Organ Tech Rep Ser. 1995;854:1–452. PMID: 859483.
4. Amitava P, Amal P, Arunangshu S, Prakash D. Prevalence of undernutrition and associated factors: a cross-sectional study among rural adolescents in West Bengal, India. Int J Pediatr Adolesc Med. 2017;4:9e18.
5. Leenstra T, Petersen L, Kariuki S, Oloo A, Kager P, TerKuile F. Prevalence and severity of malnutrition and age at menarche: cross-sectional studies in adolescent schoolgirls in western Kenya. Eur J Clin Nutr. 2005;59(1):41–48. doi:10.1038/sj.ejcn.1602031
6. Aounallah-Skhiri H, Romdhane H, Traissac P, et al. Nutritional status of Tunisian adolescents: associated gender, environmental and socio-economic factors. Public Health Nutr. 2008;11(12):1306–1317. doi:10.1017/S1368980008002693
7. Herrador Z, Sordo L, Gadisa E, et al. Cross-sectional study of malnutrition and associated factors among school aged children in rural and urban settings of Fogera and Libo Kemkem districts, Ethiopia. PLoS One. 2014;9(9):e105880. doi:10.1371/journal.pone.0105880
8. Mulugeta A, Hagos F, Stoecker B, et al. Nutritional status of adolescent girls from rural communities of Tigray, Northern Ethiopia. Ethio J Health Dev. 2009;23(1):5–11. doi:10.4314/ejhd.v23i1.44831
9. Tariku Z, Abebe A, Melketsedik A, Gutema T. Prevalence and factors associated with stunting and thinness among school-age children in Arba Minch Health and Demographic Surveillance Site, Southern Ethiopia. PLoS One. 2018;13(11):e0206659. doi:10.1371/journal.pone.0206659
10. Gebreyohannes Y, Shiferaw S, Demtsu B, Bugssa G. Nutritional status of adolescents in selected government and private secondary schools of addis Ababa, Ethiopia. Int J Nutr Food Sci. 2014;3(6):504–514. doi:10.11648/j.ijnfs.20140306.1
11. Ministry of Education (MoE). Situation Analysis on School Health and Nutrition in Ethiopia, September 2008, Addis Ababa, Ethiopia; 2008.
12. Arimond M, Ruel T. Dietary diversity is associated with child nutritional status: evidence from 11 demographic and health surveys. J Nutr. 2004;134:2579–2585. doi:10.1093/jn/134.10.2579
13. Kennedy G, Ballard T, Dop C. Guidelines for measuring household and individual dietary diversity. Nutrition and Consumer Protection Division, Food and Agriculture Organization of the United Nations; 2013.
14. Minister of Health and Child Care. Zimbabwe National Nutrition strategy; 2014–2018.
15. Worku M, Hailemicael G, Wondmu A. Dietary diversity score and associated factors among high school adolescent girls in Gurage zone, Southwest Ethiopia. World J Nutr Health. 2017;5(2):41–45.
16. Birru S, Tariku A, Belew A. Improved dietary diversity of school adolescent girls in the context of urban Northwest Ethiopia. Ital J Pediatr. 2018;44:48. doi:10.1186/s13052-018-0490-0
17. Belachew T, Hadley C, Lindstrom D. Differentials in measures of dietary quality among adolescents in Jimma zone, Southwest Ethiopia. Ethiop Med J. 2008;46(2):133–142.
18. Oldewage-Theron W, Egal A, Moroka T. Nutrition knowledge and dietary intake of adolescents in Cofimvaba, eastern cape, South Africa. Ecol Food Nutr. 2015;54(2):138–156. doi:10.1080/03670244.2014.959944
19. Belachew T, Lindstrom D, Gebremariam A, et al. Food insecurity, food based coping strategies and suboptimal dietary practices of adolescents in Jimma zone Southwest Ethiopia. PLoS One. 2013;8(3):e57643. doi:10.1371/journal.pone.0057643
20. Federal Democratic Republic of Ethiopia Population Census Commission. Summary and statistical report of the central statics agency 2013 population and housing census. Addis Ababa: United Nations Population Fund (UNFPA); 2014.
21. Health department of Meskan district. Maternal and Child Nutrition Unit HMIS report of 2016. Butajira town, Meskan district of Southern Ethiopia; 2016.
22. National Nutrition Baseline Survey for the National Nutrition Program of Ethiopia. Addis Ababa: Ethiopian Health and Nutrition Research Institute; 2009–2010.
23. Central Statistical Agency (CSA)/ICF: Ethiopia Demographic and Health Survey 2016. Addis Ababa, Ethiopia: CSA and ICF; 2016.
24. Raya R, Reyes J, Almoro D Education watch toolkit a resource pack for EFA. Research and monitoring: module 5: the wealth index. Asia-South Pacific Education Watch. 2010; Available from: http://www.aspbae.org.
25. Cogill B. Anthropometric Indicators Measurement Guide. Food and Nutrition Technical Assistance Project, Academy for Educational Development, Washington, DC, 2003.
26. World Health Organization (WHO). WHO AnthroPlus for personal computers manual: software for assessing growth of the world’s children and adolescents. Geneva: WHO. 2009. http://www.who.int/growthref/tools/en/.
27. Kennedy G, Razes M, Ballard T, Dop M, editors. Measurement of Dietary Diversity for Monitoring the Impact of Food Based Approaches. Rome: International symposium on food and nutrition security; 2010.
28. Hosmer W, Lemeshow S. Applied Logistic Regression. New York: Wiley; 2000.
29. De Onis M, Onyango W, Borghi E, Siyam A, Nishida C, Siekmann J. Development of a WHO growth reference for school-aged children and adolescents. Bull World Health Organ. 2007;85(9):660–667. PMID: 18026621. doi:10.2471/BLT.07.043497.
30. Muhammad M, Sibgha G, Usman K, Ubeera S, Mushtaq S, Arif S. Prevalence and socio-demographic correlates of stunting and thinness among Pakistani primary school children. BMC Public Health. 2011;11:790. pmid:21988799. doi:10.1186/1471-2458-11-790
31. Abiba A, Grace A, Kubreziga K. Effects of dietary patterns on the nutritional status of upper primary school children in Tamale metropolis. Pak J Nutr. 2012;11(7):591–609.
32. Bovet P, Kizirian N, Madeleine G, Blössner M, Chioler A. Prevalence of thinness in children and adolescents in the Seychelles: comparison of two international growth references. Nutr J. 2011;10:65. doi:10.1186/1475-2891-10-65
33. Prince K, Laar A. Nutritional status of school-age children in the Nkwanta South District—Volta region of Ghana. Eur Sci J. 2014;10(30):1857–7431.
34. Yohannes M, Gordon Z, Tiffany G, Robert A, Zumin S. Prevalence and factors associated with stunting and thinness among adolescent students in Northern Ethiopia: a comparison to World Health Organization standards. Arch Public Health. 2015;73:44. doi:10.1186/s13690-015-0093-9
35. Gebregyorgis T, Tadesse T, Atenafu A. Prevalence of thinness and stunting and associated factors among adolescent school girls in Adwa Town, North Ethiopia. Int J Food Sci. 2016;2016:1–8. doi:10.1155/2016/8323982
36. World vision Inc., USA. Findings from the Alive and Thrive project baseline survey in Southern Ethiopia; 2010.
37. Somali National Micronutrient Deficiency Control Strategy (2014–2016): Consensus reached at the FAO/WHO International Conference on Nutrition in 1992.
38. Tesfaye M. Bayesian approach to identify predictors of children Nutritional status in Ethiopia; 2009.
39. Olumakaiye F. Prevalence of underweight: a matter of concern among adolescents in Osun State, Nigeria. Pak J Nutr. 2008;7(3):503–508. doi:10.3923/pjn.2008.503.508
40. Mokhtar N, Elati J, Chabir R. Diet culture and obesity in Northern Africa. The American society for nutritional Sciences. J Nutr. 2001;131:887–892. doi:10.1093/jn/131.3.887S
41. Akingbade K, Sanusi A. Nutritional status of in-school adolescents in Ekiti state, Nigeria. Glob J Med Public Health. 2016;5(4):1–11.
42. Vakili M, Abedi P, Sharifi M, Hosseini M. Dietary diversity and its related factors among adolescents: a survey in Ahvaz-Iran. Glob J Health Sci. 2013;5(2):181. doi:10.5539/gjhs.v5n2p181
43. Hall A, Kassa T, Demissie T, Degefie T, Lee S. National survey of the health and nutrition of schoolchildren in Ethiopia. Trop Med Int Health. 2008;13(12):1518–1526. doi:10.1111/j.1365-3156.2008.02168.x
44. Mohammed AY, Tefera B. Nutritional status and associated risk factors among adolescents girls in Agarfa High School, Bale Zone, Oromia Region, South East Ethiopia. Inter J Nutr Food Sci. 2015;4:445–452. doi:10.11648/j.ijnfs.20150404.15
45. Damie D, Wondafrash M, Teklehaymanot N. Nutritional status and associated factors among school adolescent in Chiro Town, West Hararge, Ethiopia. Gaziantep Med J. 2015;21:32–42. doi:10.5455/GMJ-30-169505
46. Roba K, Abdo M, Wakayo T. Nutritional status and its associated factors among school adolescent girls in Adama City. Central Ethiopia J Nutr Food Sci. 2016;6(493):2.
47. Reese A. Assessment of Adolescent Girl Nutrition, Dietary Practices, and Roles in Zimbabwe. Zimbabwe: International Medical Corps; 2015.
48. Herrador Z, Perez-Formigo J, Sordo L, et al. Low dietary diversity and intake of animal source foods among school aged children in Libo Kemkem and Fogera Districts, Ethiopia. PLoS One. 2015;10:e0133435. doi:10.1371/journal.pone.0133435
49. Wassie M, Gete A, Yesuf E, Alene D, Belay A, Moges T. Predictors of nutritional status of Amhara region of Ethiopian adolescent girls: a community based cross sectional study. BMC Nutr. 2015;1(1):20. doi:10.1186/s40795-015-0015-9
50. Allen H. To what extent can food-based approaches improve micronutrient status? Asia Pac J Clin Nutr. 2008;17:103–105.
51. Berhane G, Paulos Z, Tafere K, Tamru S. Food grain consumption and calorie intake patterns in Ethiopia. IFPRI Ethiopia Strategy Support Program II (ESSP II) Working Paper 23; 2011.
52. Alemayehu S, Dorosh P, Asrat S. Crop production in Ethiopia: regional patterns and trends. Food Agric Ethiop Prog Policy Chall. 2013;74:53.
53. Yabsira M, Anteneh D, Garumma F, Dessalegn T. Optimal dietary practices and nutritional knowledge of school adolescent girls in Jimma Town, South West Ethiopia. Int J Adolesc Youth. 2018;23(3):299–307. doi:10.1080/02673843.2017.1369889
54. Gali N, Tamiru D, Tamrat M .The emerging nutritional problems of school adolescents: overweight/obesity and associated factors in Jimma Town, Ethiopia. J Pediatr Nurs.2017;35:98–104. Elsevier Inc. doi:10.1016/j.pedn.2017.03.002
55. Tamiru D, Argaw A, Gerbaba M, Nigussie A, Ayana G, Belachew T. Improving dietary diversity of school adolescents through school based nutrition education and home gardening in Jimma Zone: quasi-experimental design. Eat Behav. 2016;23:180–186. doi:10.1016/j.eatbeh.2016.10.009
 © 2019 The Author(s). This work is published and licensed by Dove Medical Press Limited. The
full terms of this license are available at https://www.dovepress.com/terms
and incorporate the Creative Commons Attribution
- Non Commercial (unported, 3.0) License.
By accessing the work you hereby accept the Terms. Non-commercial uses of the work are permitted
without any further permission from Dove Medical Press Limited, provided the work is properly
attributed. For permission for commercial use of this work, please see paragraphs 4.2 and 5 of our Terms.
© 2019 The Author(s). This work is published and licensed by Dove Medical Press Limited. The
full terms of this license are available at https://www.dovepress.com/terms
and incorporate the Creative Commons Attribution
- Non Commercial (unported, 3.0) License.
By accessing the work you hereby accept the Terms. Non-commercial uses of the work are permitted
without any further permission from Dove Medical Press Limited, provided the work is properly
attributed. For permission for commercial use of this work, please see paragraphs 4.2 and 5 of our Terms.