Back to Journals » Diabetes, Metabolic Syndrome and Obesity » Volume 12
Predictors of Insulin Treatment During Pregnancy and Abnormal Postpartum Glucose Metabolism in Patients with Gestational Diabetes Mellitus
Authors Tang L, Xu S, Li P ![]() , Li L
, Li L ![]()
Received 5 October 2019
Accepted for publication 20 November 2019
Published 12 December 2019 Volume 2019:12 Pages 2655—2665
DOI https://doi.org/10.2147/DMSO.S233554
Checked for plagiarism Yes
Review by Single anonymous peer review
Peer reviewer comments 2
Editor who approved publication: Prof. Dr. Antonio Brunetti
Lei Tang,1 Shiting Xu,1 Ping Li,1 Ling Li1,2
1Department of Endocrinology, Shengjing Hospital Affiliated to China Medical University, Shenyang, Liaoning Province, People’s Republic of China; 2Liaoning Province Key Laboratory of Endocrine Diseases, Shenyang, Liaoning Province, People’s Republic of China
Correspondence: Ling Li
Department of Endocrinology, Shengjing Hospital Affiliated to China Medical University, No. 36, Sanhao Street, Heping District, Shenyang, Liaoning Proving, People’s Republic of China
Tel +86 18940251181
Fax +86 024-25944460
Email [email protected]
Background: To investigate the potential predictors of insulin treatment during pregnancy and abnormal postpartum glucose metabolism in gestational diabetes mellitus (GDM).
Methods: A total of 534 patients with GDM, who were diagnosed based on 75 g oral glucose tolerance test (OGTT) during pregnancy, were divided into the diet group (n=354) and insulin group (n=180) according to the treatment of hyperglycemia in pregnancy. Based on 75 g OGTT after delivery, 178 of the 534 patients were divided into the normal glucose tolerance (NGT; n=104) and the abnormal glucose tolerance (AGT; n=74) groups. Characteristics and metabolic indicators were compared. Logistic regression analysis was developed to assess the potential predictors of insulin treatment and abnormal postpartum glucose metabolism. Receiver operating characteristic curve was performed to determine the cut-off values.
Results: Fasting plasma glucose (FPG), 1 h plasma glucose, and hemoglobin A1c (HbA1c) at GDM diagnosis were higher in the insulin group compared with the diet group (P <0.05). FPG, 1 h plasma glucose, HbA1c, maternal age, pre-gestational weight and maximum weight, pre-gestational body mass index, maternal birth weight, family history of diabetes in first-degree relatives, acanthosis nigricans, and prenatal weight were risk factors for insulin treatment (P <0.05), and the cut-offs of FPG, 1 h plasma glucose and HbA1c were 5.7 mmol/L, 11.4 mmol/L and 5.3%. Simultaneously, FPG at GDM diagnosis, insulin treatment during pregnancy, maternal age, family history of diabetes in first-degree relatives, acanthosis nigricans, and prenatal weight were risk factors of abnormal postpartum glucose metabolism (P <0.05), and the cut-off of FPG was 5.7 mmol/L.
Conclusion: Patients with FPG >5.7 mmol/L, 1 h plasma glucose >11.4 mmol/L, or HbA1c >5.3% at GDM diagnosis required insulin treatment, and patients with FPG >5.7 mmol/L had a greater risk of abnormal postpartum glucose metabolism. FPG at GDM diagnosis was the most important predictor.
Keywords: gestational diabetes mellitus, insulin treatment, postpartum glucose metabolism
Plain Language Summary
Gestational diabetes mellitus (GDM) is the most common hyperglycemia in pregnancy and could result in short-term and long-term adverse outcomes for both the fetus and mother. Most patients with GDM can achieve normal blood glucose levels through diet and exercise management, with only 20–30% requiring drug treatment. Furthermore, the majority of GDM return to normal blood glucose levels after delivery, with only a few patients retaining high levels. However, few people screen for glucose metabolism after delivery, and the lower screening rate has resulted in the untimely discovery of blood glucose abnormalities. Therefore, it is crucial for clinicians to identify high-risk populations who require insulin treatment during pregnancy and have abnormal postpartum blood glucose levels based on their characteristics and metabolic indicators. We found that fasting plasma glucose (FPG), 1 h plasma glucose, and hemoglobin A1c (HbA1c) at GDM diagnosis, maternal age, pre-gestational weight and maximum weight, pre-gestational body mass index, maternal birth weight, family history of diabetes in first-degree relatives, acanthosis nigricans, and prenatal weight were risk factors for insulin treatment during pregnancy. Simultaneously, FPG at GDM diagnosis, insulin treatment during pregnancy, maternal age, family history of diabetes in first-degree relatives, acanthosis nigricans, and prenatal weight were risk factors of abnormal postpartum glucose metabolism. Patients with FPG >5.7 mmol/L, 1 h plasma glucose >11.4 mmol/L, or HbA1c >5.3% at GDM diagnosis required insulin treatment during pregnancy, and patients with FPG >5.7 mmol/L had a greater risk of abnormal postpartum glucose metabolism.
Introduction
Gestational diabetes mellitus (GDM) refers to glucose intolerance that is first discovered or occurred during pregnancy, and it is the most common hyperglycemia in pregnancy.1 Several studies have demonstrated that hyperglycemia in pregnancy could result in short-term and long-term adverse outcomes for both the mother and fetus.2 Therefore, it is very crucial to precisely manage blood glucose during pregnancy. Current guidelines3,4 recommended that blood glucose levels should be as close to the normal levels as possible without hypoglycemia.
In contrast to patients with pre-gestational diabetes who mostly require insulin treatment during pregnancy, most patients with GDM can achieve normal blood glucose levels through diet and exercise management, with only 20–30% requiring drug treatment.5 Pregnancy was associated with lots of biochemical changes. The insulin sensitivity decreased by 50–70% during pregnancy and was usually compensated by an increase in insulin secretion by 200% to maintain euglycemia.6 As a temporary organ formed during pregnancy, the placenta is not just the only interface connecting the mother and fetus, but also has important endocrine function. Placenta-derived hormones antagonize insulin and increase insulin resistance, which in turn lead to GDM.7,8 However, the majority of GDM patients return to normal blood glucose levels after delivery, with only a few patients retaining high levels. Kim et al.9 reviewed 28 postpartum follow-up studies in patients with GDM from 1965 to 2001 and found that the cumulative incidence of diabetes at 6 weeks to 28 years after delivery increased from 2.6% to more than 70%, especially within 5 years. GDM was the most important risk factor of developing diabetes in the future, and the risk of type 2 diabetes mellitus (T2DM) in GDM patients was 7.43 times than that of non-pregnant women.10 However, only a few GDM patients were currently screened for diabetes after delivery. The screening rate was less than 50% at 6–12 weeks postpartum,11 and the long-term follow-up rate was even less than 20%.12 This lower screening rate has resulted in the untimely discovery of blood glucose abnormalities. When discovered, these alterations have become severely abnormal and may even have progressed to diabetes.
Therefore, it is crucial for clinicians to identify high-risk populations who require insulin treatment during pregnancy and have abnormal postpartum blood glucose levels based on their characteristics and metabolic indicators, recommend insulin treatment in time to strictly manage blood glucose, give them some warnings and urge them to undergo screening to prevent T2DM. In the present study, patients with GDM were enrolled to explore the potential predictors of insulin requirement during pregnancy and risk factors affecting abnormal postpartum glucose metabolism.
Materials and Methods
Patients with GDM
Between June 2015 and October 2018, pregnant women who were at the endocrinology outpatient clinic of Shengjing Hospital affiliated to China Medical University with no adverse outcomes, were recruited. None of them had previous type 1 and type 2 diabetes, any other diseases affecting blood glucose levels, including hyperthyroidism, Cushing syndrome, and pancreatitis, and acute complications such as diabetic ketoacidosis and severe heart, liver, and kidney disease. This study was conducted in accordance with the Declaration of Helsinki and approved by the ethics committee of Shengjing Hospital affiliated to China Medical University. All the participants provided written informed consent.
Finally, a total of 534 patients with GDM, who were diagnosed based on the 75 g oral glucose tolerance test (OGTT) results during pregnancy, were recruited. Furthermore, based on the 75 g OGTT results screened for glucose metabolism after delivery in our hospital, 178 of the 534 patients with GDM were further divided into the normal glucose tolerance (NGT; n=104) group and the abnormal glucose tolerance (AGT; n=74) group.
Diagnostic Criteria
Pregnant women were diagnosed with GDM if one or more of the following 75 g OGTT results were met: 5.1 mmol/L ≤ fasting plasma glucose (FPG) <7.0 mmol/L, 1 h plasma glucose ≥10.0 mmol/L, and 8.5 mmol/L ≤2 h plasma glucose <11.1 mmol/L.3,13
World Health Organization (WHO) criteria14 were used to assess postpartum glucose metabolism of subjects. Impaired fasting glucose (IFG) was defined as FPG ≥6.1–<7.0 mmol/L and 2 h plasma glucose <7.8 mmol/L. Impaired glucose tolerance (IGT) was defined as FPG <6.1 mmol/L and 2 h plasma glucose ≥7.8–<11.1 mmol/L. Subjects with IFG and/or IGT were considered prediabetic. Subjects with typical symptoms of diabetes and FPG ≥7.0 mmol/L, or 2 h plasma glucose ≥11.1 mmol/L, or random venous blood glucose ≥11.1 mmol/L were diagnosed with T2DM. Subjects without typical symptoms of diabetes were tested again on the following day; if the results were confirmed, the subjects were diagnosed with T2DM.
Clinical Data and Observation Indicators
Collected clinical data included maternal age, height, pre-gestational weight, history of polycystic ovary syndrome, history of menstruation, family history of diabetes in first- or second-degree relatives, acanthosis nigricans, parity, the number and causes of previous adverse pregnancy outcomes, obstetric complications, insulin treatment during pregnancy, prenatal weight, delivery time and methods, birth weight, gender, and feeding methods of newborns. Pre-gestational body mass index (BMI) was calculated as weight (kg)/height2 (m2). Low birth weight infant referred to newborns with birth weight <2500 g, and macrosomia were newborns with birth weight >4000 g.
At the first visit during pregnancy, alanine aminotransferase, aspartate aminotransferase, and alkaline phosphatase were measured using serial detection (OLYMPUS AU5800, China); γ-glutamine transferase was measured using the JSCC method (OLYMPUS AU5400, Japan); triglyceride (TG), high density lipoprotein-cholesterol (HDL-C) and low density lipoprotein-cholesterol (LDL-C) were measured using the enzyme method (OLYMPUS AU5400, Japan); and thyroid stimulating hormone (TSH), free triiodothyronine (FT3), free thyroxine (FT4), thyroid peroxidase antibody (TPOAb) and thyroglobulin antibody (TgAb) were measured using chemiluminescent microparticle immunoassay (Abbott, USA).
The 75 g OGTT was performed as described by the WHO.11 After overnight fasting for at least 10 h, venous blood samples were collected from all subjects at 08:00 am. FPG was detected using the glucose oxidase method (OLYMPUS AU5800, China), and fasting plasma insulin (FINS) was detected using chemiluminescent microparticle immunoassay (ARCHITECT i2000, China). Glycated albumin (GA) was detected using the enzymatic method (OLYMPUS AU5400, Japan), and hemoglobin A1c (HbA1c) was detected using high performance liquid chromatography (VARIANT II, USA). FPG, FINS, GA, and HbA1c levels were determined from the same blood sample. Similarly, venous blood samples were also collected 1 h and 2 h after drinking 200–300 mL of glucose solution (containing 75 g glucose powder). The homeostasis model assessment of insulin resistance (HOMA-IR) was calculated as [FINS (μU/mL) × FPG (mmol/L)]/22.5.15 The homeostasis model assessment of β cell (HOMA-β) was calculated as 20 × FINS (μU/mL)/[FPG (mmol/L)−3.5].15 The composite insulin sensitivity index (CISI) was calculated as 10,000/√ [FPG (mmol/L) × FINS (μU/mL)] × [meanGLUOGTT (mmol/L) × meanINSOGTT (μU/mL)],16 and meanGLUOGTT and meanINSOGTT represent the average blood glucose and insulin levels following the 75g OGTT, respectively. During pregnancy, FPG, 2 h postprandial blood glucose, and GA were evaluated every 2–4 weeks; and HbA1c was evaluated every 2–3 months.
Treatment Principles and Measures
Medical nutrition therapy (MNT) was the first-line treatment for all patients with hyperglycemia in pregnancy. It was individualized with respect to the pre-gestational BMI of patients. Physical activity included aerobic exercise and resistance exercise, and less than 45 mins per day was recommended as a reasonable target to all patients.
The control standard levels for blood glucose during pregnancy were fingerprick fasting blood glucose >3.3–5.3 mmol/L, 1 h postprandial blood glucose <7.8 mmol/L, and 2 h postprandial blood glucose <6.7 mmol/L.4 If the glycemic targets were not achieved after 1–2 weeks of lifestyle management, insulin treatment was initiated along with a continuation of lifestyle interventions.
Statistical Analysis
Data processing and statistical analysis were performed using SPSS 22.0 software (IBM, Armonk, NY, USA). The Kolmogorov–Smirnov test was used to test the normality of each variable. Variables with a normal distribution are presented as mean ± standard deviation, whereas variables with a skewed distribution are shown as median (interquartile range). For continuous variables, differences between the groups were analyzed using Student’s t-test or Mann–Whitney U-test in case of skewed distribution. Categorical variables were compared using the Chi-square test. Spearman’s rho was used to explore the correlation between different variables during pregnancy and postpartum glucose metabolism indicators. Logistic regression models were developed to assess the potential predictors of insulin treatment during pregnancy and abnormal postpartum glucose metabolism in patients with GDM. Receiver operating characteristic (ROC) curve was performed to determine the cut-off values in the requirement for insulin treatment during pregnancy and predicting postpartum prediabetes and T2DM. P <0.05 was considered statistically significant.
Results
Predictors for Insulin Requirement During Pregnancy in Patients with GDM
Characteristics of Patients with GDM
Of the 534 patients with GDM, glycemic control was achieved in 354 of them with medical nutrition therapy only, while in 180 (33.7%) of them required additional insulin treatment along with a continuation of lifestyle interventions. Maternal age, pre-gestational weight and maximum weight, pre-gestational BMI, maternal birth weight, neck and armpit acanthosis nigricans, and prenatal weight in the insulin group were higher than in the diet group (P <0.05, Table 1).
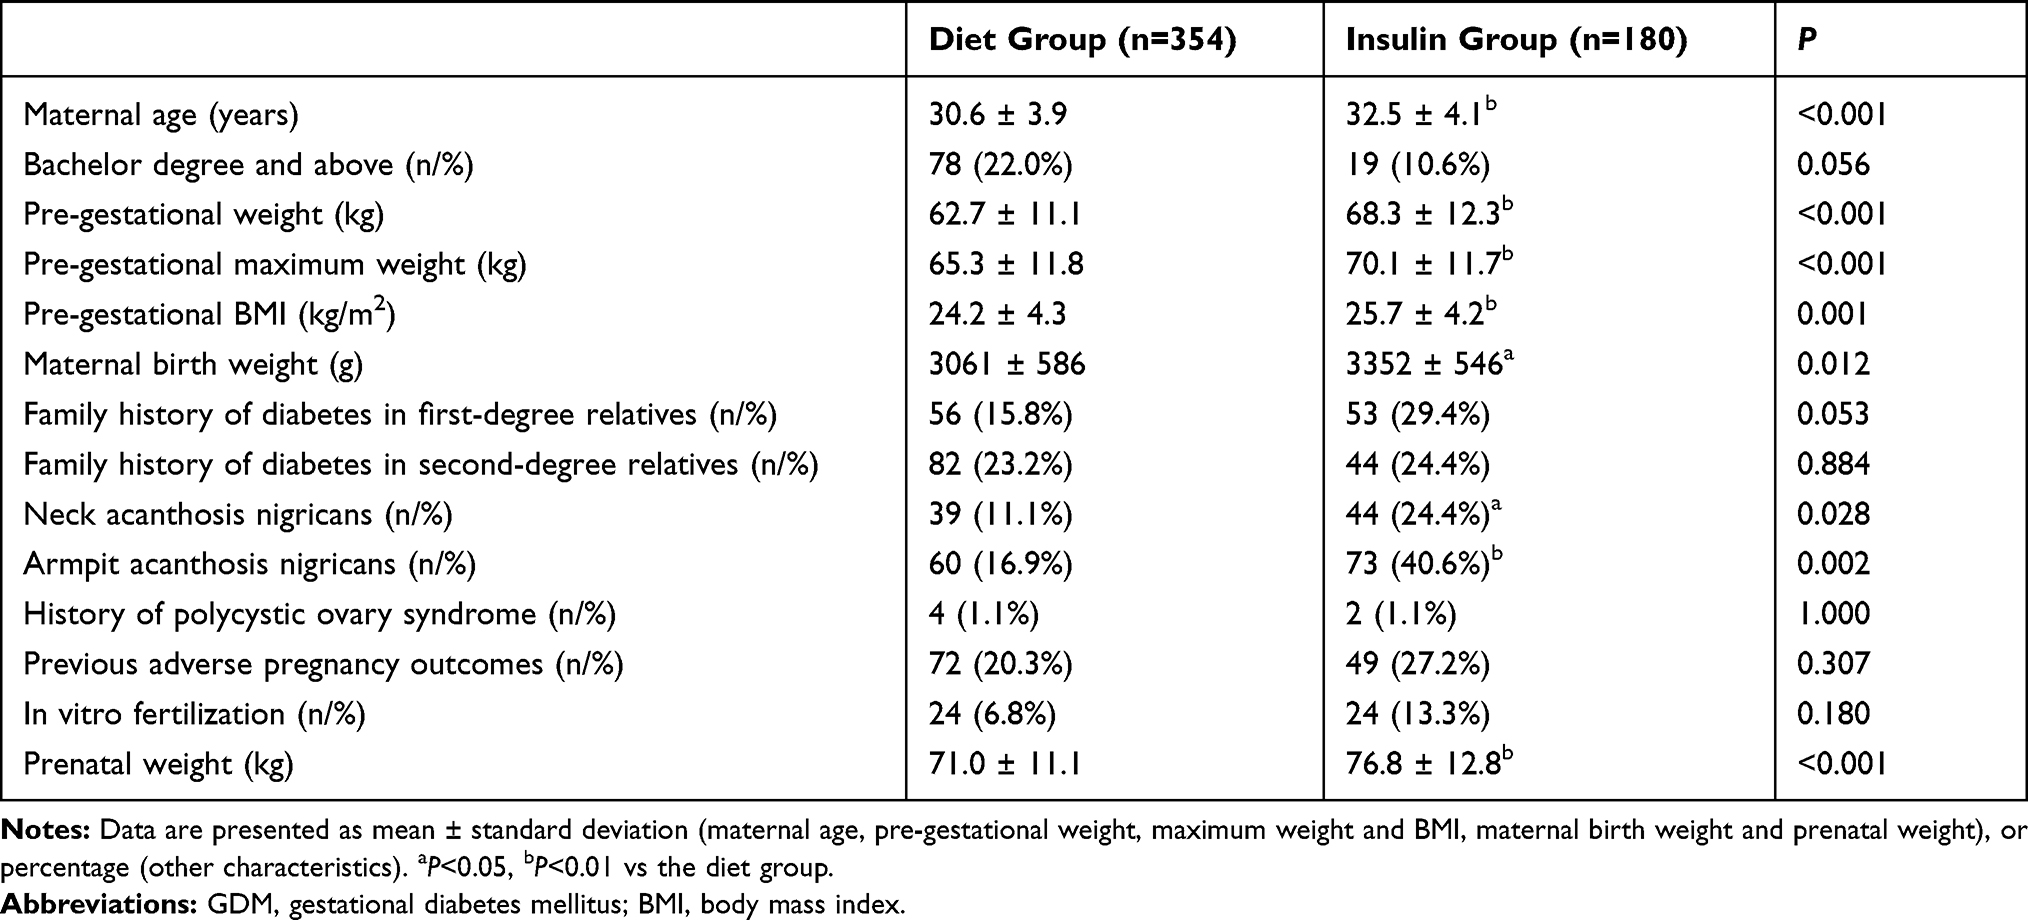 |
Table 1 Characteristics of Patients with GDM |
Comparison of 75 g OGTT and Glucose Metabolism Indicators During Pregnancy
FPG and 1 h plasma glucose following 75 g OGTT, and HbA1c at the time of GDM diagnosis were significantly higher in the insulin group compared with the diet group (P <0.05, Table 2). No statistically significant difference in other glucose metabolic indicators was observed between the two groups.
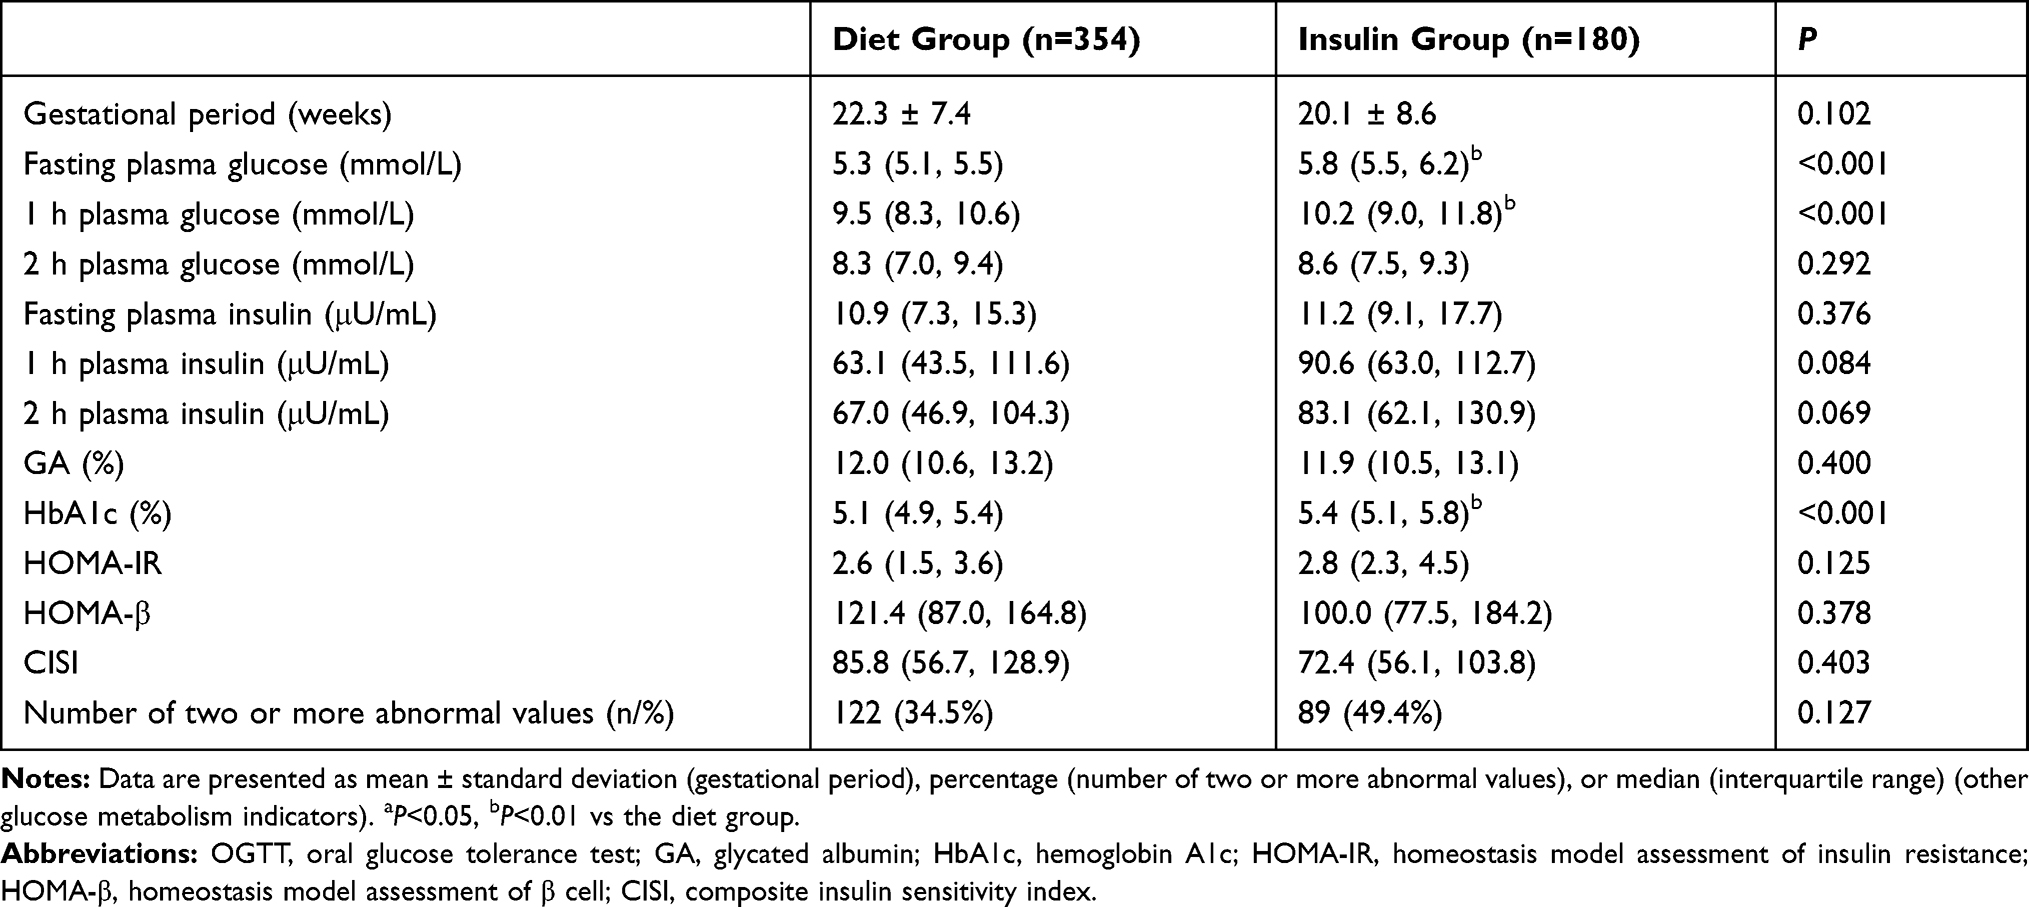 |
Table 2 Comparison of 75 g OGTT and Glucose Metabolism Indicators During Pregnancy |
There were no statistical differences in FPG (5.0 [4.7, 5.4] vs 5.1 [4.9, 5.4] mmol/L, P =0.156), 2 h postprandial blood glucose (6.3 [5.6, 7.2] vs 6.4 [5.8, 7.4] mmol/L, P =0.251), GA (12.0 [10.8, 13.7] vs 11.8 [10.6, 13.4] %, P =0.235) and HbA1c (5.1 [4.9, 5.3] vs 5.1 [4.8, 5.3] %, P =0.506) in the third trimester, indicating that blood glucose levels between the diet and insulin groups are equivalent after the lifestyle intervention or insulin treatment during pregnancy.
Comparison of Other Metabolic Indicators During Pregnancy
Of the metabolic indicators that were measured at the first visit during pregnancy, only FT4 level in the insulin group was lower than in the diet group (12.78 [11.35, 15.09] vs 13.85 [11.95, 15.35] pmol/L, P =0.037). TPOAb level was higher in the insulin group compared with the diet group (1.14 [0.20, 40.97] vs 0.42 [0.14, 9.30] IU/mL, P =0.055); however, the differences were not statistically significant. Furthermore, no significant difference in other metabolic indicators was observed between the two groups.
Risk Analysis of Factors Related to the Requirement of Insulin Treatment During Pregnancy
In the logistic regression model, FPG (odds ratio [OR] =8.378, 95% confidence interval [CI]: 4.936–14.220, P <0.001) at GDM diagnosis, 1 h plasma glucose (OR =1.347, 95% CI: 1.152–1.573, P <0.001) at GDM diagnosis, HbA1c (OR =2.165, 95% CI: 1.333–3.516, P =0.002) at GDM diagnosis, maternal age (OR =1.126, 95% CI: 1.075–1.179, P <0.001), pre-gestational weight (OR =1.041, 95% CI: 1.023–1.160, P <0.001), pre-gestational BMI (OR =1.087, 95% CI: 1.035–1.141, P <0.001), pre-gestational maximum weight (OR =1.038, 95% CI: 1.019–1.058, P <0.001), family history of diabetes in first-degree relatives (OR =2.221, 95% CI: 1.446–3.411, P <0.001), neck acanthosis nigricans (OR =2.390, 95% CI: 1.526–3.743, P <0.001), armpit acanthosis nigricans (OR=2.372, 95% CI: 1.719–3.274, P <0.001), and prenatal weight (OR =1.042, 95% CI: 1.022–1.062, P <0.001) were potential predictors of insulin treatment during pregnancy.
ROC Curve for Insulin Treatment During Pregnancy
As shown in Figure 1, the cut-off values of FPG, 1 h plasma glucose, and HbA1c at the time of GDM diagnosis were 5.7 mmol/L (sensitivity 59.6% and specificity 89.9%; area under the curve [AUC] 0.788, 95% CI: 0.704–0.872, P <0.001), 11.4 mmol/L (sensitivity 34.0% and specificity 94.4%; AUC 0.642, 95% CI: 0.540–0.744, P <0.001), and 5.3% (sensitivity 59.6% and specificity 70.8%; AUC 0.683, 95% CI: 0.587–0.779, P <0.001), respectively.
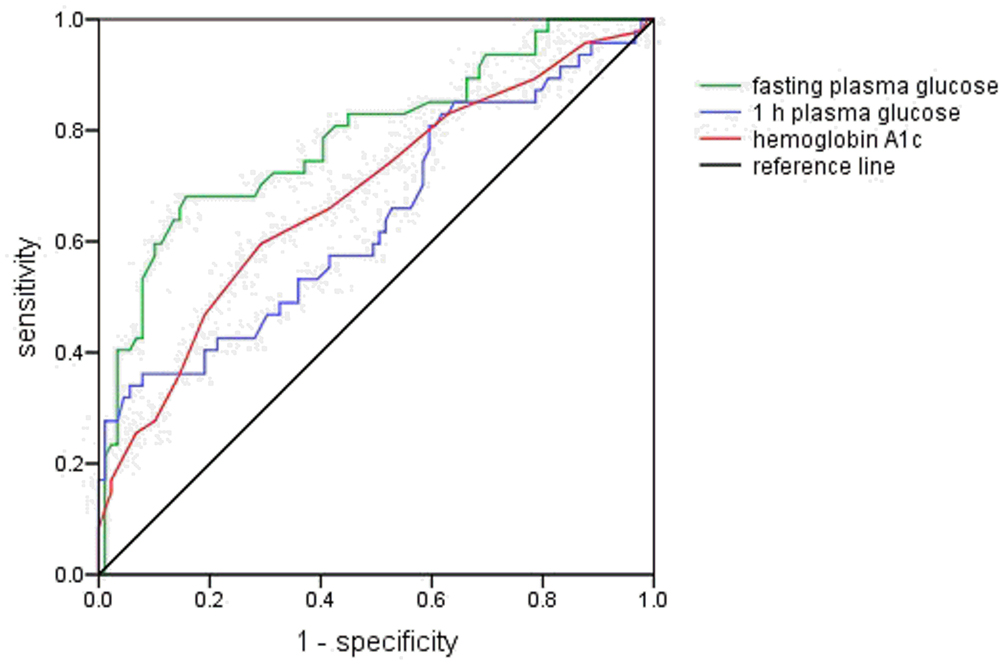 |
Figure 1 Receiver operating characteristics curve for fasting and 1 h plasma glucose levels following 75 g oral glucose tolerance test and hemoglobin A1c. The green, blue and red lines represent fasting plasma glucose, 1 h plasma glucose and hemoglobin A1c, respectively. The black line is the reference line. |
Factors Affecting Postpartum Glucose Metabolism in Patients with GDM
Characteristics and Pregnancy-Related Outcomes of Patients with GDM
Of the 534 patients with GDM, 178 patients screened for glucose metabolism after delivery in our hospital. 104 had normal glucose tolerance and 74 (41.6%) had abnormal glucose tolerance (58 had prediabetes and 16 had T2DM). The mean interval from delivery to postpartum 75 g OGTT was 12.0 ± 6.5 weeks. Maternal age, family history of diabetes in first-degree relatives, acanthosis nigricans, prenatal weight, and weight gain per week during pregnancy in the AGT group were higher than in the NGT group (P <0.05). Furthermore, there were no significant differences in delivery time, birth weight of newborns, rates of preterm birth, cesarean section and breast feeding, incidence of low birth weight infants and macrosomia. None of the newborns developed hypoglycemia and no other neonatal adverse outcomes were observed (Table 3).
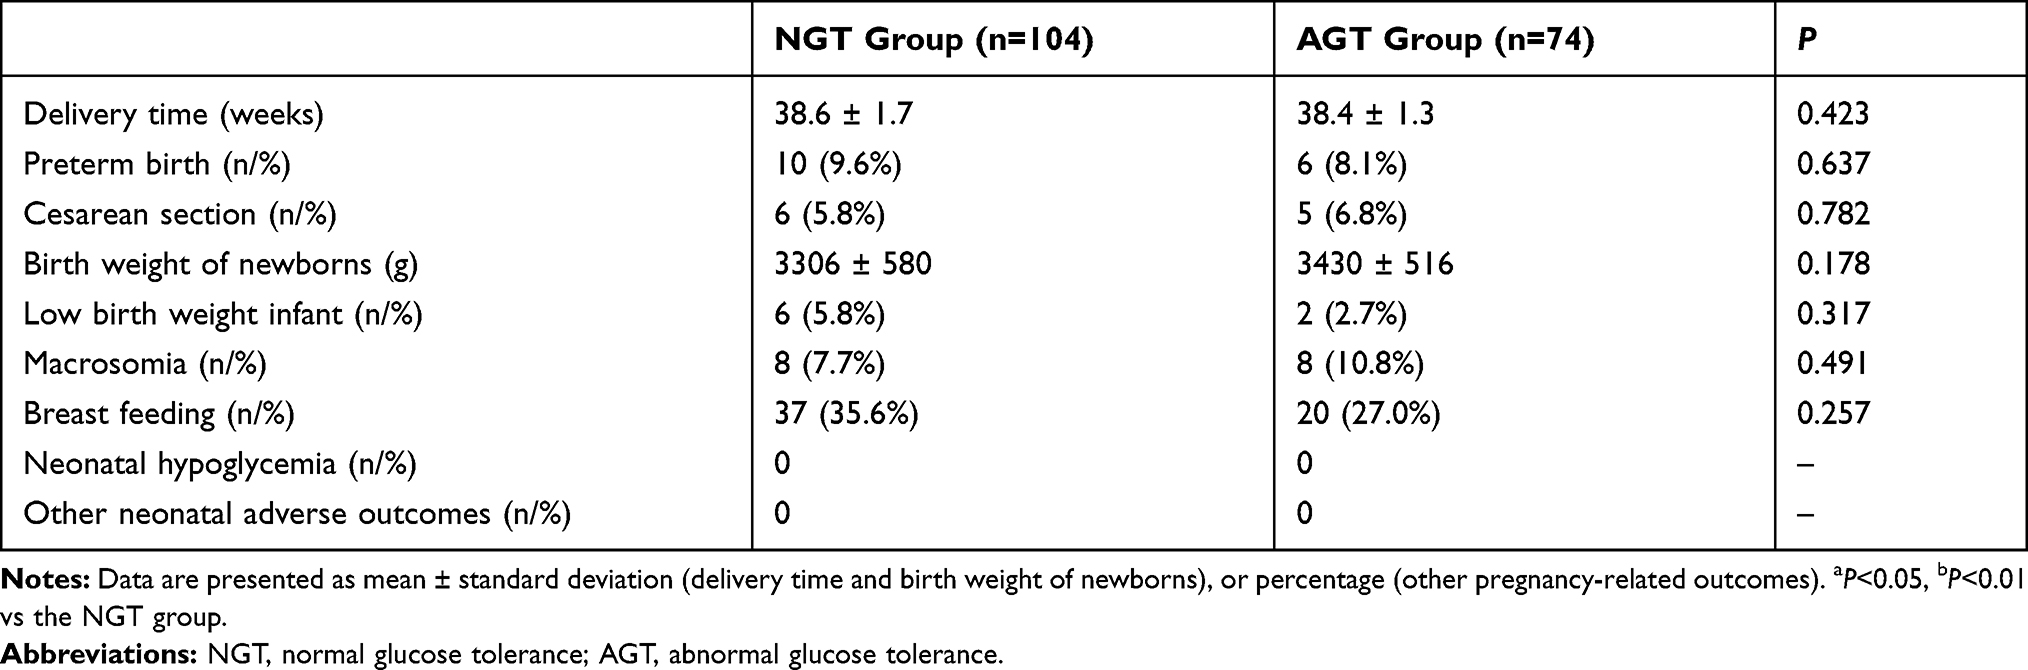 |
Table 3 Comparison of Pregnancy-Related Outcomes |
Comparison of 75 g OGTT and Glucose Metabolism Indicators During Pregnancy and After Delivery
FPG, 1 h plasma insulin following 75 g OGTT, and HbA1c at the time of GDM diagnosis, and proportion of insulin treatment during pregnancy were significantly higher in the AGT group compared with the NGT group (P <0.05, Table 4). Comparison of postpartum glucose metabolism between the two groups was also shown in Table 4.
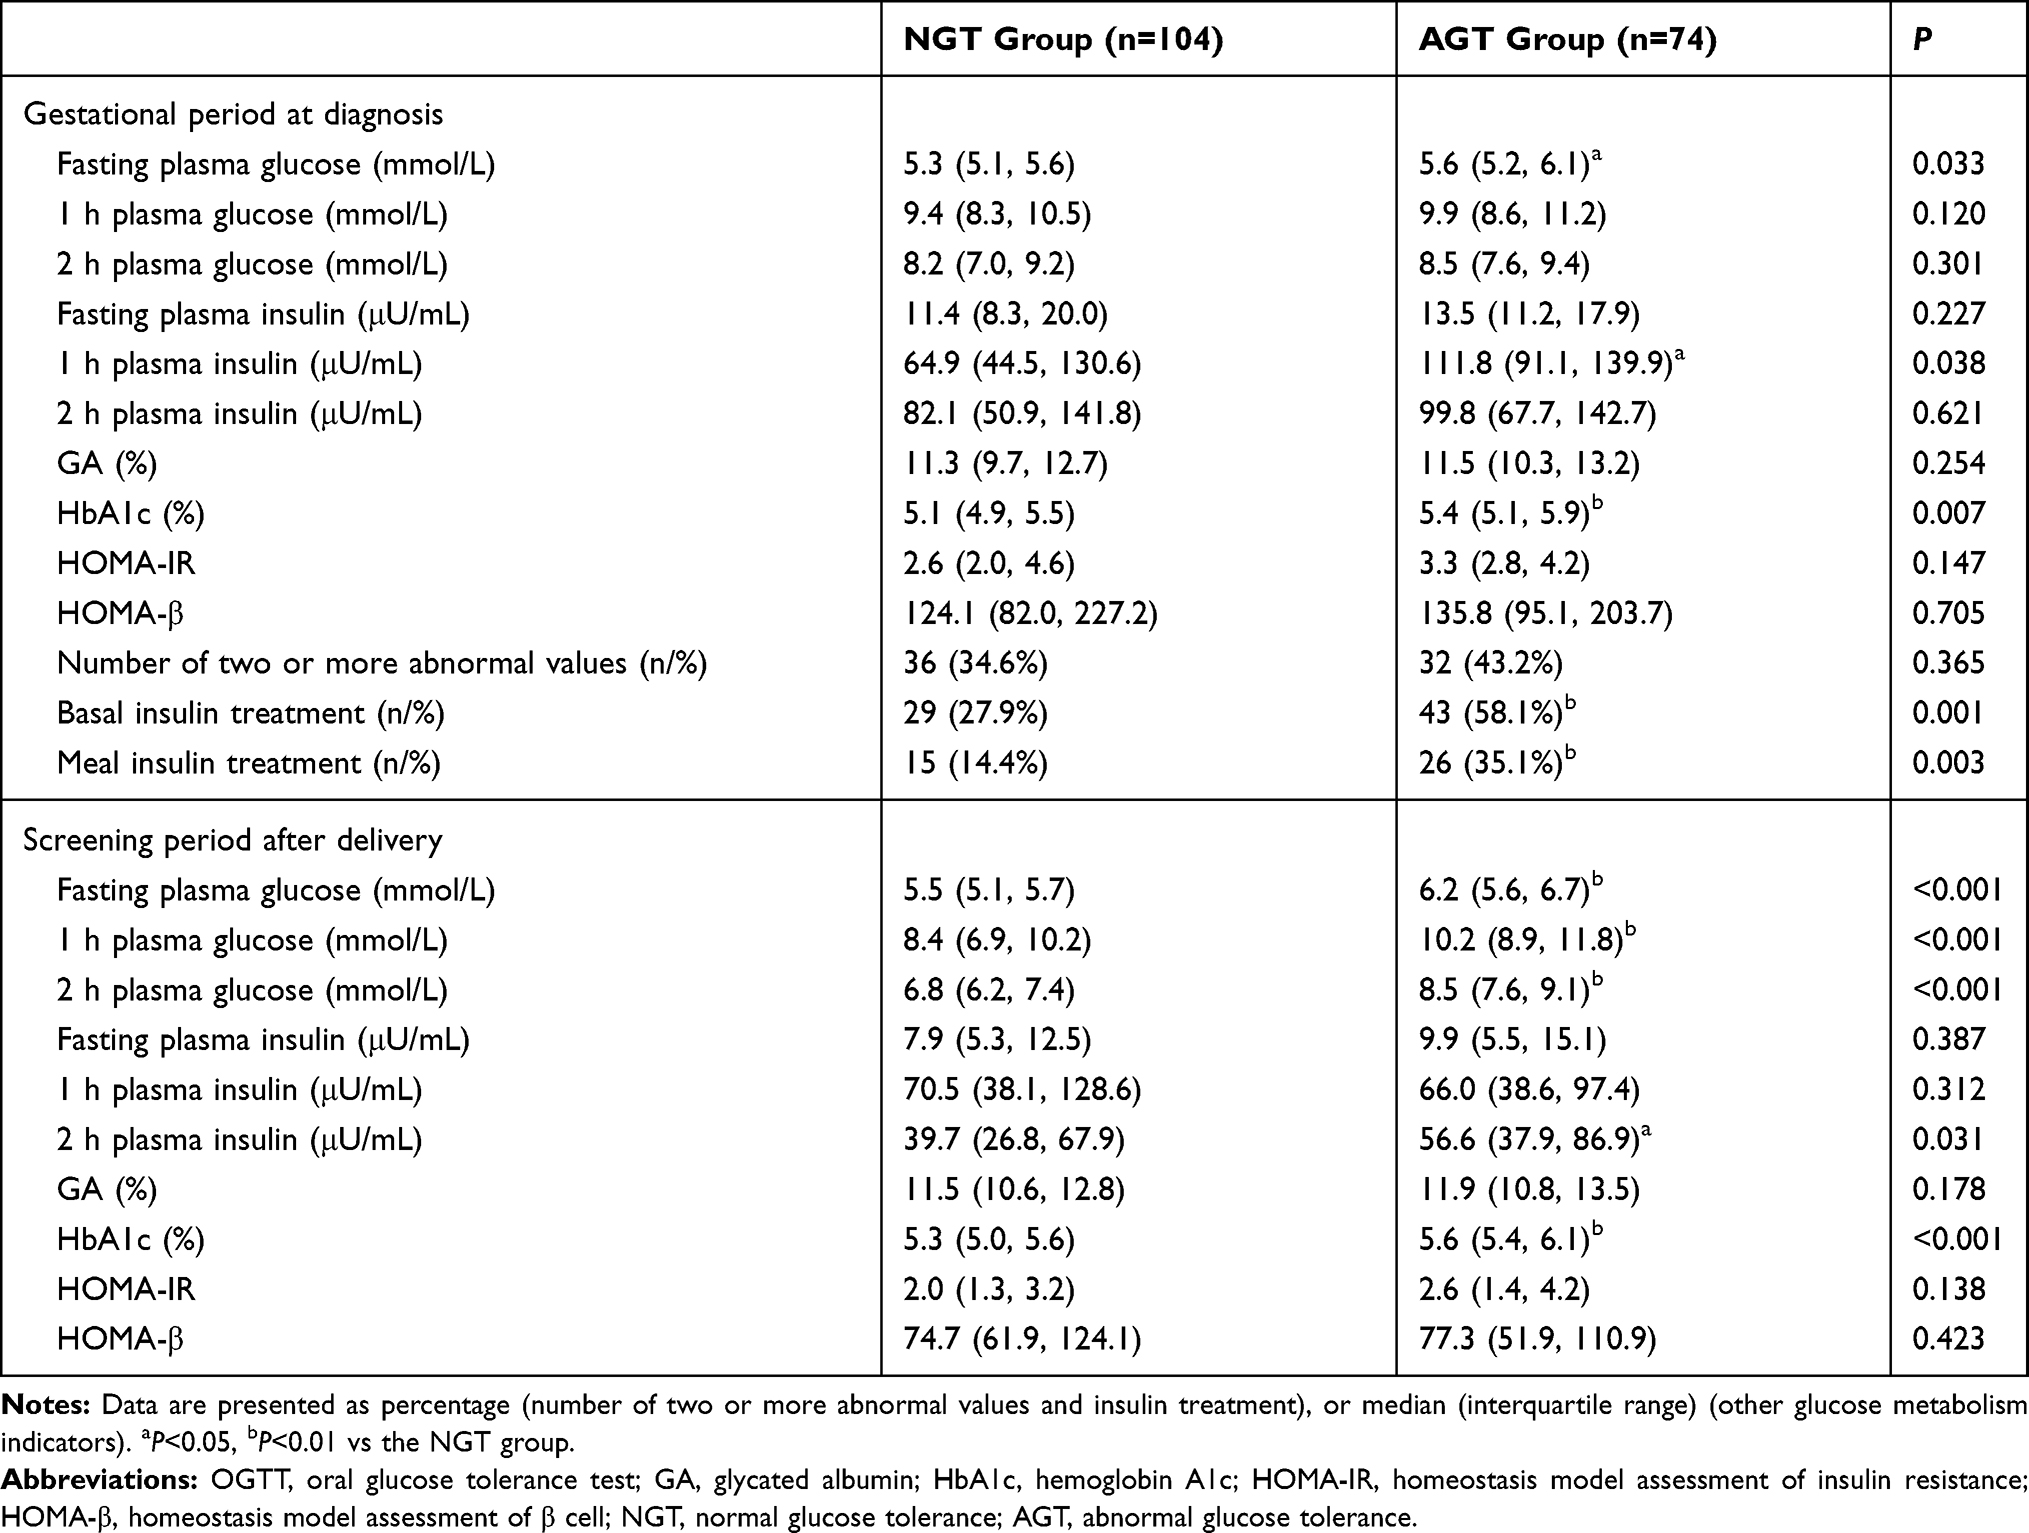 |
Table 4 Comparison of 75 g OGTT and Glucose Metabolism Indicators During Pregnancy and After Delivery |
Correlation Between Indicators During Pregnancy and Postpartum Glucose Metabolism
A positive correlation was observed between maternal age, weight gain per week during pregnancy, and postpartum FPG. Prenatal weight was positively correlated with postpartum FPG, FINS, HOMA-IR, and HOMA-β. Furthermore, FPG at the time of GDM diagnosis was positively correlated with postpartum FPG, FINS, 1 h plasma glucose and insulin, HbA1c, and HOMA-IR. HbA1c at the time of GDM diagnosis was significantly positively correlated with postpartum 1 h plasma glucose, and HbA1c. No correlation was found between the other indicators (P >0.05, Table 5).
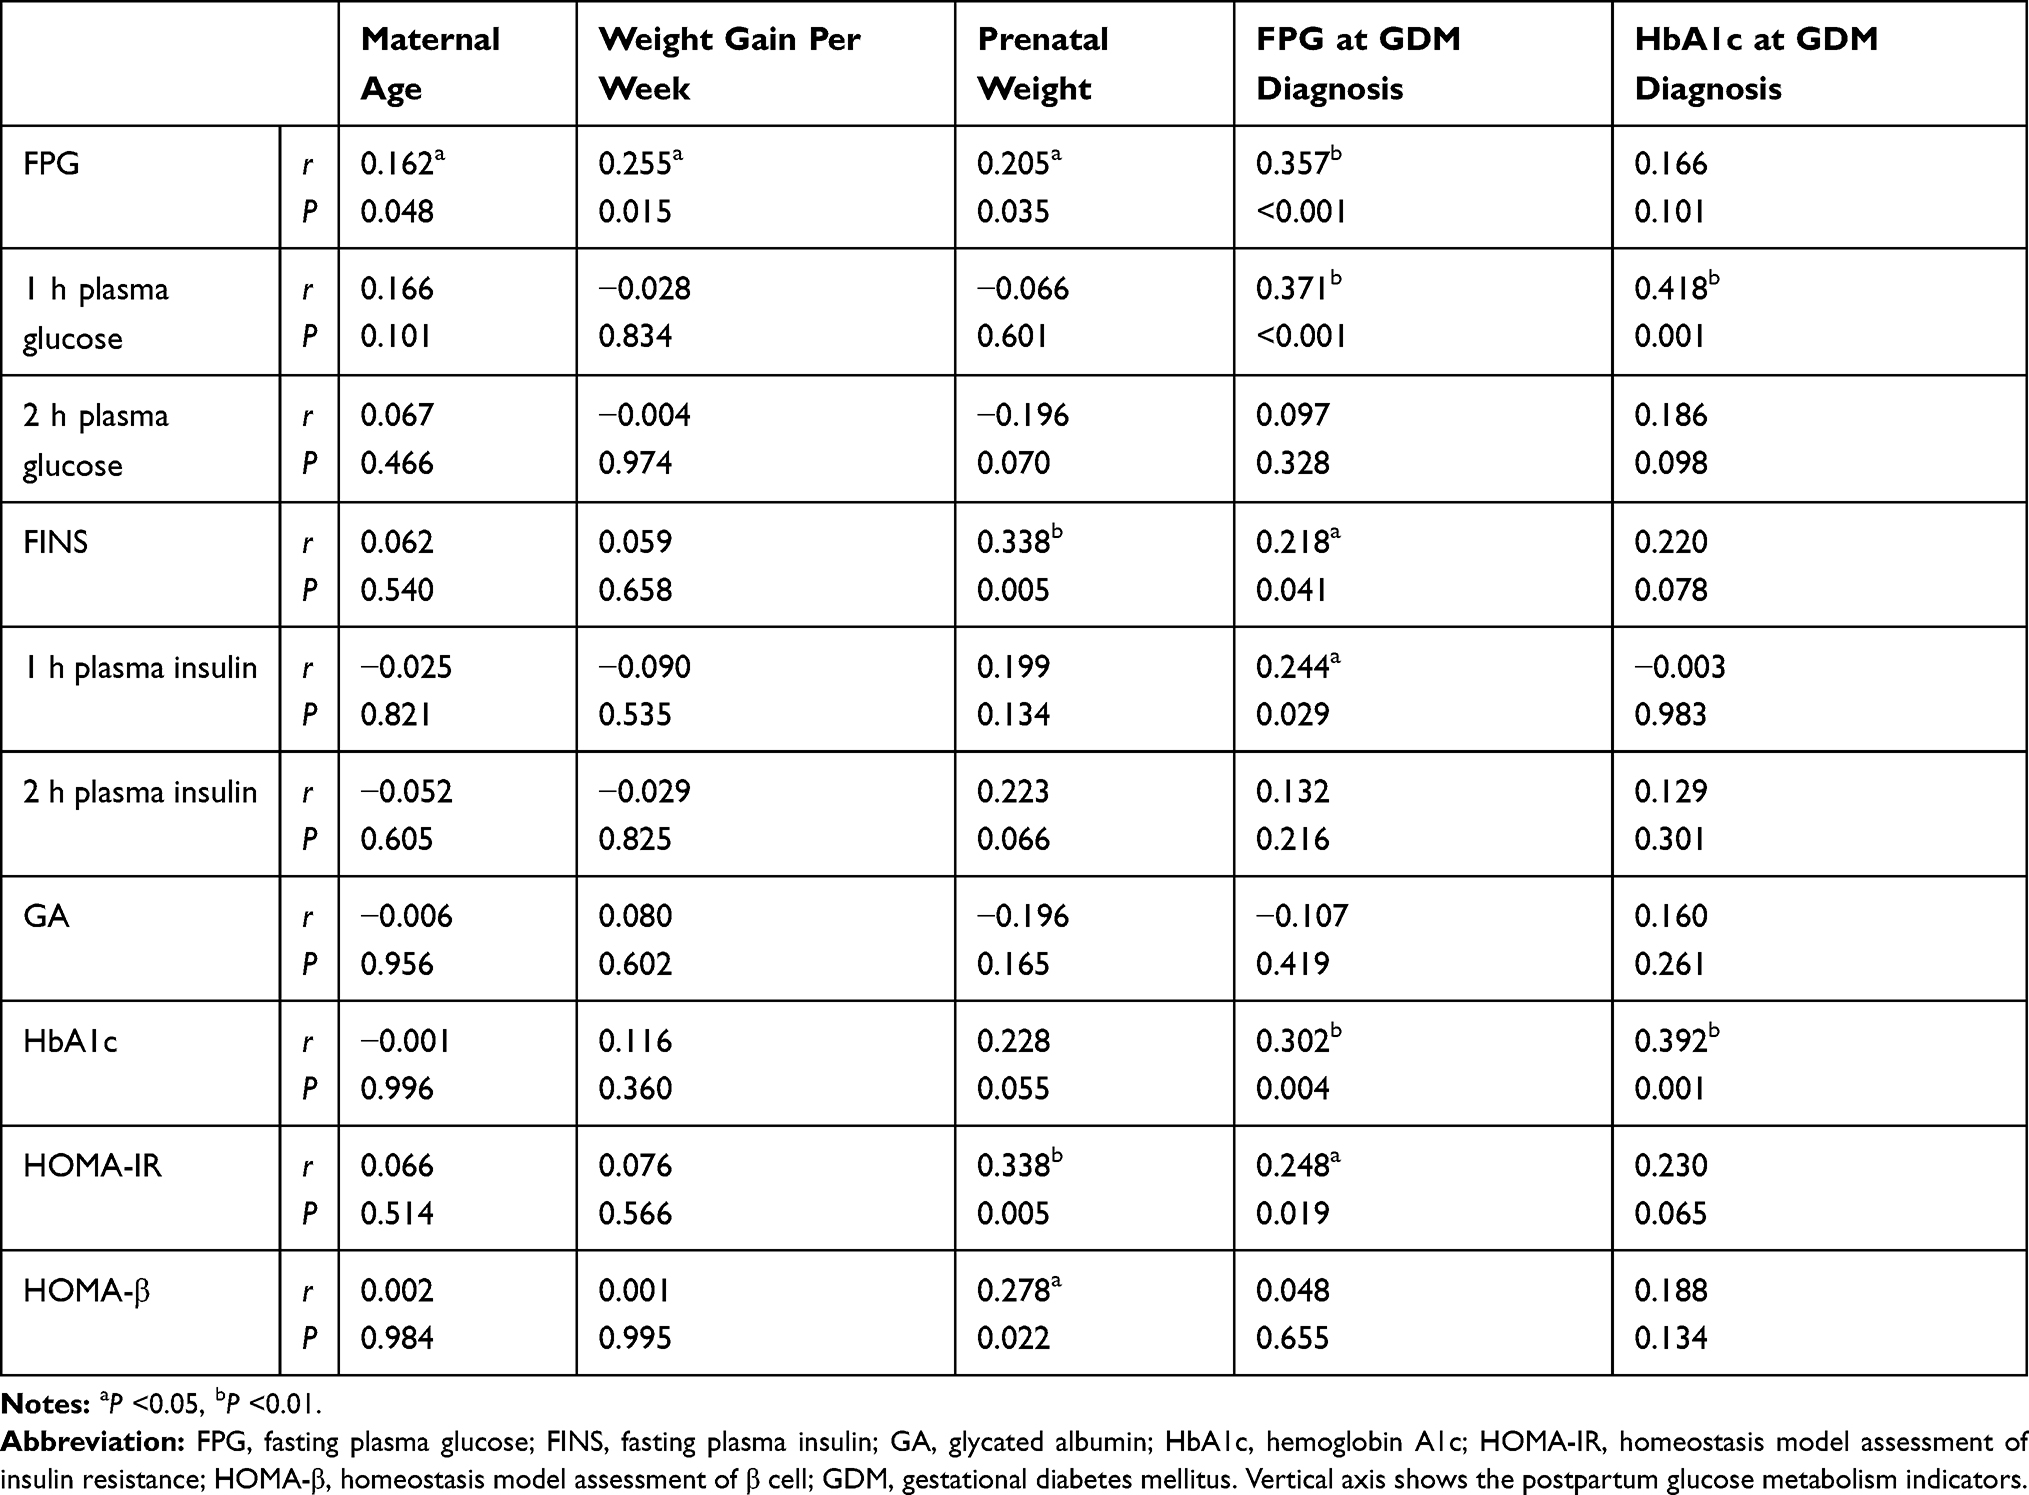 |
Table 5 Correlation Between Indicators During Pregnancy and Postpartum Glucose Metabolism |
Risk Analysis of Factors Affecting Postpartum Glucose Metabolism
In a logistic regression model, FPG (OR =2.021, 95% CI: 1.058–3.863, P =0.033) at GDM diagnosis, basal insulin treatment during pregnancy (OR =3.587, 95% CI: 1.911–6.736, P <0.001), meal insulin treatment during pregnancy (OR =3.214, 95% CI: 1.555–6.642, P =0.002), maternal age (OR =1.079, 95% CI: 1.002–1.162, P =0.044), family history of diabetes in first-degree relatives (OR =2.480, 95% CI: 1.201–5.123, P =0.014), acanthosis nigricans (OR =2.197, 95% CI: 1.192–4.048, P =0.012), and prenatal weight (OR =1.034, 95% CI: 1.002–1.067, P =0.035), were independent predictors of abnormal postpartum glucose metabolism.
ROC Curve for Abnormal Postpartum Glucose Metabolism
ROC curves were used to determine the cut-off values to predict abnormal postpartum glucose metabolism. As shown in Figure 2, the cut-off value of FPG at the time of GDM diagnosis were 5.7 mmol/L (sensitivity of 42.1% and specificity of 81.5%; AUC 0.607, 95% CI: 0.508–0.706, P =0.033).
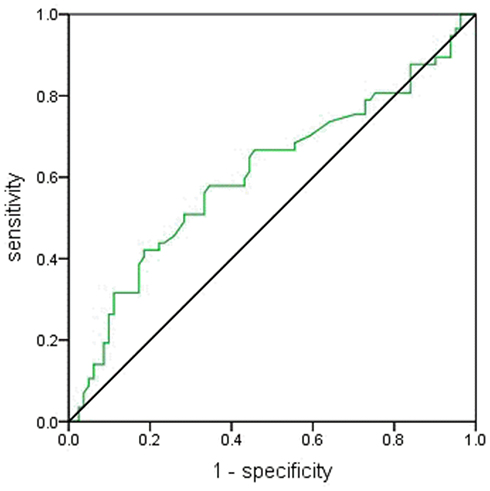 |
Figure 2 Receiver operating characteristics curve for fasting plasma glucose following 75 g oral glucose tolerance test. The green line represents fasting plasma glucose and the black line is the reference line. |
Discussion
Medical nutrition therapy is the cornerstone of treatment for hyperglycemia in pregnancy and should be prescribed throughout the pregnancy. Good glycemic control in most patients with GDM can be obtained through diet and exercise guidance. For patients who fail to effectively control blood glucose, it is an important challenge for clinicians to identify those at high-risk based on characteristics and biochemical indicators and to determine when to start insulin treatment. Our study found that FPG and 1 h plasma glucose following 75 g OGTT, and HbA1c at the time of GDM diagnosis were significantly higher in the insulin group compared with the diet group. FPG, 1 h plasma glucose, HbA1c, maternal age, pre-gestational weight and maximum weight, pre-gestational BMI, family history of diabetes in first-degree relatives, acanthosis nigricans, and prenatal weight were potential predictors of insulin treatment during pregnancy, and FPG was the most important predictor. Patients with FPG >5.7 mmol/L, 1 h plasma glucose >11.4 mmol/L, or HbA1c >5.3% at the time of GDM diagnosis require insulin treatment during pregnancy. These predictors were previously reported in several studies;17–21 however, different studies have reported different blood glucose thresholds, which may be related to the population characteristics (such as ethnicity), number of study samples, dietary compliance of subjects, different glucose metabolism screening methods, diagnostic criteria for GDM, and glycemic control standards in each study under different times and conditions.18
Additionally, a total of 178 pregnant women with GDM underwent 75 g OGTT at 12 weeks postpartum, and 74 had abnormal glucose tolerance, of which 58 had prediabetes and 16 had T2DM. FPG, 1 h plasma insulin following 75 g OGTT, and HbA1c at the time of GDM diagnosis were significantly higher in the AGT than in the NGT group. FPG at the time of GDM diagnosis was positively correlated with postpartum fasting and 1 h plasma glucose and insulin, HbA1c and HOMA-IR. FPG following 75 g OGTT at the time of GDM diagnosis, maternal age, family history of diabetes in first-degree relatives, acanthosis nigricans, insulin treatment during pregnancy, and prenatal weight were all independent predictors of abnormal postpartum glucose metabolism. Our results showed that FPG at the time of GDM diagnosis was the most important predictor, and patients with FPG >5.7 mmol/L had a greater risk of abnormal postpartum glucose tolerance, which was consistent with the findings of Nouhjah et al.22 and Capula et al.23 in which the diagnostic criteria for GDM, the timing of OGTT during pregnancy, and postpartum screening for blood glucose were all similar. Furthermore, Liu et al.24 found that a 1 mmol/L increase in FPG increased the risk of postpartum diabetes by 1.61-fold. Monroy et al.25 also considered FPG was the best predictor of abnormal postpartum glucose tolerance. The importance of FPG at the time of GDM diagnosis in predicting postpartum glucose metabolism was thus demonstrated. Moreover, several studies26,27 reported that 1 h and 2 h plasma glucose following OGTT and HbA1c were also risk factors for postpartum prediabetes and T2DM, indicating that the degree of abnormal blood glucose in patients with GDM was closely related to postpartum glucose metabolism. Factors such as age, family history of diabetes, acanthosis nigricans, and insulin treatment during pregnancy have also been shown to influence the recovery of blood glucose after delivery.28–31
The Hyperglycemia and Adverse Pregnancy Outcomes (HAPO) study32 found that even if maternal blood glucose levels were lower than the diagnostic criteria of diabetes, the incidence of adverse outcomes would increase with rising blood glucose levels. Based on this study, by considering a 75% increase in the adverse outcomes as the cut-off value, The International Association of Diabetes and Pregnancy Study Groups proposed the “one-step” diagnostic criteria for GDM in 2010. Subsequently, international organizations re-defined hyperglycemia in pregnancy and established new control standards. Nevertheless, this measure led to a great controversy. Some scholars argued that the diagnostic and control criteria were set so low that might result in wasting of medical resources. However, Parretti et al.33 studied the changes in blood glucose in healthy pregnant women and reported that the blood glucose levels gradually increased during 28–38 weeks of gestation, even until 38 weeks; nevertheless, the peak postprandial blood glucose was still lower than 6.0 mmol/L. Therefore, the control standard for hyperglycemia in pregnancy were reasonable and clinicians should continuously raise awareness among pregnant women of strict blood glucose management, especially in women with higher risk of perinatal complications, in order to reduce the duration of hyperglycemia and improve the prognoses of both the fetus and mother.
Diabetes is rapidly and dramatically increasing in various countries and regions around the world. Apart from factors such as more frequent overweight and obesity and changes in lifestyle, the increase in the number of young women with a history of GDM is also an important reason. Due to the lack of relevant knowledge of high-risk factors for diabetes, this population has poor compliance with postpartum evaluation, resulting in low screening rates and consequently in untimely finding blood glucose abnormalities. Guidelines4 recommend that patients with GDM should perform 75 g OGTT to assess blood glucose levels 4–12 weeks postpartum, even if blood glucose levels are normal, and should screen glucose metabolism every 1–3 years. The frequency of screening depends on other risk factors, including family history of diabetes, pre-gestational BMI, and treatment with insulin or oral hypoglycemic drugs. Pre-diabetes women with a history of GDM should receive intensive lifestyle interventions or metformin treatment to prevent diabetes.3
This study has certain limitations. First, retrospective collection may result in selective bias and incomplete clinical data, such as lack of other factors. Second, the long-term follow-up of the subjects has not been performed in this study, and the long-term incidence of metabolic syndrome such as diabetes and hypertension cannot be obtained. Third, we could not provide information on the growth and development of the offspring.
In summary, it is really crucial for patients with FPG >5.7 mmol/L, 1 h plasma glucose >11.4 mmol/L, or HbA1c >5.3% at the time of GDM diagnosis to require appropriate glucose-lowering therapy such as insulin that was safely used in this cohort, in order to reduce the duration of hyperglycemia and enable a healthy intrauterine environment, with FPG having the biggest impact. Simultaneously, efforts should also be employed to improve the awareness of these patients, especially those with FPG >5.7 mmol/L at the time of GDM diagnosis, for regular screening of glucose metabolism after delivery and throughout life, and to stimulate lifestyle changes to prevent or delay the occurrence of T2DM.
Conclusion
Patients with FPG >5.7 mmol/L, 1 h plasma glucose >11.4 mmol/L, or HbA1c >5.3% at the time of GDM diagnosis required insulin treatment during pregnancy, and patients with FPG >5.7 mmol/L had a greater risk of abnormal postpartum glucose metabolism.
Abbreviations
GDM, gestational diabetes mellitus; OGTT, oral glucose tolerance test; NGT, normal glucose tolerance; AGT, abnormal glucose tolerance; WHO, World Health Organization; T2DM, type 2 diabetes mellitus; IFG, impaired fasting glucose; IGT, impaired glucose tolerance; BMI, body mass index; TG, triglyceride; HDL-C, high density lipoprotein-cholesterol; LDL-C, low density lipoprotein-cholesterol; TSH, thyroid stimulating hormone; FT3, free triiodothyronine; FT4, free thyroxine; TPOAb, thyroid peroxidase antibody; TgAb, thyroglobulin antibody; FPG, fasting plasma glucose; FINS, fasting plasma insulin; GA, glycated albumin; HbA1c, hemoglobin A1c; HOMA-IR, homeostasis model assessment of insulin resistance; HOMA-β, homeostasis model assessment of β cell; CISI, composite insulin sensitivity index; MNT, Medical nutrition therapy; ROC, receiver operating characteristic; OR, odds ratio; CI, confidence interval; HAPO, hyperglycemia and Adverse Pregnancy Outcomes.
Acknowledgment
The authors wish to thank all the physicians at the Department of Endocrinology, Shengjing Hospital affiliated to China Medical University.
Disclosure
The authors report no conflicts of interest in this work.
References
1. Zhu W, Yang H, Wei Y, et al. Comparing the diagnostic criteria for gestational diabetes mellitus of World Health Organization 2013 with 1999 in Chinese population. Chin Med J (Engl). 2015;128(1):125–127. doi:10.4103/0366-6999.147858
2. Zhao E, Zhang Y, Zeng X, Liu B. Association between maternal diabetes mellitus and the risk of congenital malformations: a meta-analysis of cohort studies. Drug Discov Ther. 2015;9(4):274–281. doi:10.5582/ddt.2015.01044
3. The Chinese Medical Association Diabetes Society. Guidelines for the prevention and treatment of type 2 diabetes in China (2017 edition). Chin J Diabetes Mellitus. 2018;10(1):4–67. doi:10.19538/j.nk2018040108
4. American Diabetes Association. 13. Management of diabetes in pregnancy: standards of medical care in diabetes-2018. Diabetes Care. 2018;41(Suppl 1):S137- S143. doi:10.2337/dc18-S013
5. Benhalima K, Robyns K, Van Crombrugge P, et al. Differences in pregnancy outcomes and characteristics between insulin-and diet-treated women with gestational diabetes. BMC Pregnancy Childbirth. 2015;15:271. doi:10.1186/s12884-015-0706-x
6. Kühl C. Etiology and pathogenesis of gestational diabetes. Diabetes Care. 1998;21(Suppl 2):B19–B26.
7. Ryan EA, Enns L. Role of gestational hormones in the induction of insulin resistance. J Clin Endocrinol Metab. 1988;67(2):341–347. doi:10.1210/jcem-67-2-341
8. Mastorakos G, Ilias I. Maternal and fetal hypothalamic-pituitary-adrenal axes during pregnancy and postpartum. Ann N Y Acad Sci. 2003;997:136–149. doi:10.1196/annals.1290.016
9. Kim C, Newton KM, Knopp RH. Gestational diabetes and the incidence of type 2 diabetes: a systematic review. Diabetes Care. 2002;25(10):1862–1868. doi:10.2337/diacare.25.10.1862
10. Bellamy L, Casas JP, Hingorani AD, Williams D. Type 2 diabetes mellitus after gestational diabetes: a systematic review and meta-analysis. Lancet. 2009;373(9677):1773–1779. doi:10.1016/S0140-6736(09)60731-5
11. Lawrence JM, Black MH, Hsu JW, Chen W, Sacks DA. Prevalence and timing of postpartum glucose testing and sustained glucose dysregulation after gestational diabetes mellitus. Diabetes Care. 2010;33(3):569–576. doi:10.2337/dc09-2095
12. Koning SH, Lutgers HL, Hoogenberg K, Trompert CA, van den Berg PP, Wolffenbuttel BH. Postpartum glucose follow-up and lifestyle management after gestational diabetes mellitus: general practitioner and patient perspectives. J Diabetes Metab Disord. 2016;15:56. doi:10.1186/s40200-016-0282-2
13. Metzger BE, Gabbe SG; International Association of Diabetes and Pregnancy Study Groups Consensus Panel, et al. International association of diabetes and pregnancy study groups recommendations on the diagnosis and classification of hyperglycemia in pregnancy. Diabetes Care. 2010;33(3):676–682. doi:10.2337/dc10-0719
14. Alberti KG, Zimmet PZ. Definition, diagnosis and classification of diabetes mellitus and its complications. Part 1: diagnosis and classification of diabetes mellitus provisional report of WHO consultation. Diabet Med. 1998;15(7):539–553. doi:10.1002/(SICI)1096-9136(199807)15:7<539::AID-DIA668>3.0.CO;2-S
15. Matthews DR, Hosker JP, Rudenski AS, Naylor BA, Treacher DF, Turner RC. Homeostasis model assessment: insulin resistance and beta-cell function from fasting plasma glucose and insulin concentrations in man. Diabetologia. 1985;28(7):412–419. doi:10.1007/BF00280883
16. Matsuda M, DeFronzo RA. Insulin sensitivity indices obtained from oral glucose tolerance testing: comparison with the euglycemic insulin clamp. Diabetes Care. 1999;22(9):1462–1470. doi:10.2337/diacare.22.9.1462
17. Pertot T, Molyneaux L, Tan K, Ross GP, Yue DK, Wong J. Can common clinical parameters be used to identify patients who will need insulin treatment in gestational diabetes mellitus? Diabetes Care. 2011;34(10):2214–2216. doi:10.2337/dc11-0499
18. Bakiner O, Bozkirli E, Ozsahin K, Sariturk C, Ertorer E. Risk factors that can predict antenatal insulin need in gestational diabetes. J Clin Med Res. 2013;5(5):381–388. doi:10.4021/jocmr1515w
19. Clayton W
20. Watanabe M, Katayama A, Kagawa H. Ogawa D, Wada J. Risk factors for the requirement of antenatal insulin treatment in gestational diabetes mellitus. J Diabetes Res. 2016;2016:9648798. doi:10.1155/2016/9648798
21. Ikenoue S, Miyakoshi K, Saisho Y, et al. Clinical impact of women with gestational diabetes mellitus by the new consensus criteria: two year experience in a single institution in Japan. Endocr J. 2014;61(4):353–358. doi:10.1507/endocrj.EJ13-0496
22. Nouhjah S, Shahbazian H, Shahbazian N, Jahanshahi A, Jahanfar S, Cheraghian B. Incidence and contributing factors of persistent hyperglycemia at 6-12 weeks postpartum in iranian women with gestational diabetes: results from LAGA cohort study. J Diabetes Res. 2017;2017:9786436. doi:10.1155/2017/9786436
23. Capula C, Chiefari E, Vero A, Foti DP, Brunetti A, Vero R. Prevalence and predictors of postpartum glucose intolerance in Italian women with gestational diabetes mellitus. Diabetes Res Clin Pract. 2014;105(2):223–230. doi:10.1016/j.diabres.2014.05.008
24. Liu H, Zhang S, Wang L, et al. Fasting and 2-hour plasma glucose, and HbA1c in pregnancy and the postpartum risk of diabetes among Chinese women with gestational diabetes. Diabetes Res Clin Pract. 2016;112:30–36. doi:10.1016/j.diabres.2015.11.007
25. Monroy G, Tundidor D, Orellana I, García-Patterson A, Adelantado JM, Corcoy R. Antenatal oral glucose tolerance test in women with gestational diabetes mellitus: fasting plasma glucose is the best predictor of both large for-gestational-age newborns and postpartum glucose tolerance. Minerva Endocrinol. 2017;42(4):311–317. doi:10.23736/S0391-1977.16.02509-8
26. Inoue H, Ishikawa K, Takeda K, et al. Postpartum risk of diabetes and predictive factors for glucose intolerance in East Asian women with gestational diabetes. Diabetes Res Clin Pract. 2018;140:1–8. doi:10.1016/j.diabres.2018.03.031
27. Nishikawa T, Ono K, Hashimoto S, et al. One-hour oral glucose tolerance test plasma glucose at gestational diabetes diagnosis is a common predictor of the need for insulin therapy in pregnancy and postpartum impaired glucose tolerance. J Diabetes Investig. 2018;9(6):1370–1377. doi:10.1111/jdi.2018.9.issue-6
28. Kugishima Y, Yasuhi I, Yamashita H, et al. Risk factors associated with abnormal glucose tolerance in the early postpartum period among Japanese women with gestational diabetes. Int J Gynaecol Obstet. 2015;129(1):42–45. doi:10.1016/j.ijgo.2014.09.030
29. Coetzee A, Mason D, Hall DR, Conradie M. Prevalence and predictive factors of early postpartum diabetes among women with gestational diabetes in a single-center cohort. Int J Gynaecol Obstet. 2018;142(1):54–60. doi:10.1002/ijgo.12494
30. Gupta Y, Kapoor D, Desai A, et al. Conversion of gestational diabetes mellitus to future Type 2 diabetes mellitus and the predictive value of HbA1c in an Indian cohort. Diabet Med. 2017;34(1):37–43. doi:10.1111/dme.2017.34.issue-1
31. Cabizuca CA, Rocha PS, Marques JV, et al. Postpartum follow up of gestational diabetes in a Tertiary Care Center. Diabetol Metab Syndr. 2018;10:2. doi:10.1186/s13098-017-0303-4
32. Metzger BE, Lowe LP; HAPO Study Cooperative Research Group, et al. Hyperglycemia and adverse pregnancy outcomes. N Engl J Med. 2008;358(19):1991–2002.
33. Parretti E, Mecacci F, Papini M, et al. Third-trimester maternal glucose levels from diurnal profiles in nondiabetic pregnancies: correlation with sonographic parameters of fetal growth. Diabetes Care. 2001;24(8):1319–1323. doi:10.2337/diacare.24.8.1319
 © 2019 The Author(s). This work is published and licensed by Dove Medical Press Limited. The
full terms of this license are available at https://www.dovepress.com/terms
and incorporate the Creative Commons Attribution
- Non Commercial (unported, 3.0) License.
By accessing the work you hereby accept the Terms. Non-commercial uses of the work are permitted
without any further permission from Dove Medical Press Limited, provided the work is properly
attributed. For permission for commercial use of this work, please see paragraphs 4.2 and 5 of our Terms.
© 2019 The Author(s). This work is published and licensed by Dove Medical Press Limited. The
full terms of this license are available at https://www.dovepress.com/terms
and incorporate the Creative Commons Attribution
- Non Commercial (unported, 3.0) License.
By accessing the work you hereby accept the Terms. Non-commercial uses of the work are permitted
without any further permission from Dove Medical Press Limited, provided the work is properly
attributed. For permission for commercial use of this work, please see paragraphs 4.2 and 5 of our Terms.