Back to Journals » Risk Management and Healthcare Policy » Volume 13
Predictors of (in)efficiencies of Healthcare Expenditure Among the Leading Asian Economies – Comparison of OECD and Non-OECD Nations
Authors Jakovljevic M ![]() , Sugahara T
, Sugahara T ![]() , Timofeyev Y
, Timofeyev Y ![]() , Rancic N
, Rancic N
Received 5 June 2020
Accepted for publication 5 October 2020
Published 21 October 2020 Volume 2020:13 Pages 2261—2280
DOI https://doi.org/10.2147/RMHP.S266386
Checked for plagiarism Yes
Review by Single anonymous peer review
Peer reviewer comments 2
Editor who approved publication: Professor Marco Carotenuto
Mihajlo Jakovljevic,1– 3 Takuma Sugahara,2 Yuriy Timofeyev,4 Nemanja Rancic5,6
1Department of Global Health Economics and Policy, Faculty of Medical Sciences, University of Kragujevac, Kragujevac, Serbia; 2Institute of Comparative Economics, Hosei University, Tokyo, Japan; 3N.A.Semashko Department of Public Health and Healthcare, I.M. Sechenov First Moscow State Medical University (Sechenov University), Moscow, Russia; 4National Research University Higher School of Economics, Moscow, Russia; 5Centre for Clinical Pharmacology, Military Medical Academy, Belgrade, Serbia; 6Faculty of Medicine of the Military Medical Academy, University of Defence, Belgrade, Serbia
Correspondence: Mihajlo Jakovljevic
Department of Global Health Economics and Policy, Faculty of Medical Sciences, University of Kragujevac, Kragujevac 34000, Serbia
Tel +381 34306 800
Email [email protected]
Purpose: The goal of this study was to assess the effectiveness of healthcare spending among the leading Asian economies.
Methods: We have selected a total of nine Asian nations, based on the strength of their economic output and long-term real GDP growth rates. The OECD members included Japan and the Republic of Korea, while the seven non-OECD nations were China, India, Indonesia, Malaysia, Pakistan, the Philippines, and Thailand. Healthcare systems efficiency was analyzed over the period 1996– 2017. To assess the effectiveness of healthcare expenditure of each group of countries, the two-way fixed effects model (country- and year effects) was used.
Results: Quality of governance and current health expenditure determine healthcare system performance. Population density and urbanization are positively associated with a healthy life expectancy in the non-OECD Asian countries. In this group, unsafe water drinking has a statistically negative effect on healthy life expectancy. Interestingly, only per capita consumption of carbohydrates is significantly linked with healthy life expectancy. In these non-OECD Asian countries, unsafe water drinking and per capita carbon dioxide emissions increase infant mortality. There is a strong negative association between GDP per capita and infant mortality in both sub-samples, although its impact is far larger in the OECD group. In Japan and South Korea, unemployment is negatively associated with infant mortality.
Conclusion: Japan outperforms other countries from the sample in major healthcare performance indicators, while South Korea is ranked second. The only exception is per capita carbon dioxide emissions, which have maximal values in the Republic of Korea and Japan. Non-OECD nations’ outcomes were led by China, as the largest economy. This group was characterized with substantial improvement in efficiency of health spending since the middle of the 1990s. Yet, progress was noted with remarkable heterogeneity within the group.
Keywords: Asia, health expenditure, healthy life expectancy, infant mortality, nutrition, population health outcomes
Introduction
Efficiency of healthcare attributable spending is quite an old concept in the theory of health economics. It can even be dated back to the early works of Milton Friedman1 and Selma Mushkin2 back in the 1930s and early 1950s. Over the course of many decades, this concept has substantially evolved in seminal literature. Health economics principles, grounded in theoretical concepts, like the Human Capital approach,3 were largely based on the value of statistical life hypothesis.4 In Marxist theory, these notions and practice remained poorly understood for decades and were even regarded as unethical5 by the socialist policy-makers in the East Asia region.6 In these countries, healthcare, just like education, was regarded as a consumption branch of the national economy, instead of being a productive one – a role typically reserved for the industry. Social equality in access to healthcare was deemed to be a constitutional civil right and was generally truly exercised in reality, to a large extent.7 Predictably, purchasing power for medical goods and services was much better in coastal, industrial and urban areas in comparison to the rural countryside.8 Yet, the social inequalities in these countries, in many areas of life, healthcare alike, began to deepen actually with the arrival of free-market reforms in typical real-socialism societies.9 Changes visible today, in a Chinese mainland model, are mirrored in most other surrounding nations, regardless of a formerly socialist social order.
This study aimed to assess the effectiveness of healthcare spending among the leading Asian countries. These nine observed nations were selected for the purpose of this research, based on the strength of their economic potential and contribution to the rapidly developing, new geo-economic epicenter of worldwide activity, with its heavyweight geographically located in Southeast Asia.10 Depending on their dominant social pattern, they might be roughly divided alongside their OECD membership. The OECD members are Japan and the Republic of Korea, and the remaining seven non-OECD nations are: China, India, Indonesia, Malaysia, Pakistan, the Philippines, and Thailand. There are a few core indicators of population health, such as human longevity and early childhood survival, which might be regarded as particularly sensitive performance indicators of health system efficiency.11 These public health outcomes actually measure the capability of a certain health system to deliver, to its citizens, the quantity and quality of health needed for the nation.12 There is a large body of evidence in published literature, providing reliable grounds for comparison within and outside this region.13 Thus, we attempted to measure the impact of the variety of lifestyle and economic underlying factors with the capability to influence these deliverables. In a later step, we compared these two groups of countries in the sense of their overall system effectiveness. Closer methodological explanations and results follow beneath.
Materials and Methods
Theoretical Framework
We decided to apply comprehensive knowledge broadly adopted in econometrics on causes and consequences of cost-effective resource allocation in medicine, to the most rapidly developing and high-income Asian nations. Most seminal studies so far refer to North America, Western Europe and Japan on underlying drivers of health expenditure. Yet, there is scarcity of such studies on China, India, and surrounding low- and middle-income countries of Asia. The major UN multilateral agencies and academic literature alike broadly recognized that this region remains a driver of real GDP growth worldwide.15 Thus, we attempted to partially fill this knowledge gap while applying principles of health economics, well familiar to free-market economies, to some of these nations with significant centrally controlled economic sectors. A particularly important part of our consideration was comparison of a scale between rich OECD societies and slightly lagging behind, non-OECD nations. Although our theoretical framework might sound simplistic to some extent, we intended to bring important transnational and comparative conclusions. Such knowledge would otherwise be impossible to generate with a focus on a single market or a limited sample of smaller to medium population-sized nations. Thus, we attempted to open a public debate on respective strengths and weaknesses among their mutually complementary or competing regional health policies. Furthermore, we believe such endeavor might spark interest for the Asian policy-makers and provide insights for these health systems to learn from each other’s historical successes and failures.
In the theoretical framework, it was our assumption that healthy life expectancy, infant mortality and under-five mortality are the key performance indicators of healthcare effectiveness. These efficiency indicators are typical in the literature (see a summary by Kim and Kang: p.26).16 The main factors directly contributing to a human health condition are balanced nutrition,17 high quality of drinking water,18 high air quality,17 and sufficient physical activity.19 The most important indirect factors include socio-economic conditions, quality of governance,18,20 health expenditure,17,18 and physicians’ density.17 Importantly, although indirect factors, like high income per capita,17,18 high health expenditure or urbanization,18 are very influential, they do not imply optimal values of direct factor quality, such as, for example, diet composition. Eg, high per capita healthcare expenditure does not necessarily mean that an average citizen receives balanced nutrition, and vice versa. Therefore, a complex approach is necessary to assess healthcare system effectiveness by looking at the impact of both groups of factors, direct and indirect, on the key performance indicators.
Sample and Data Collection Procedure
Diet composition data were obtained from the Food and Agriculture Organization (FAO).21 The main healthcare system and economic characteristics were collected from the World Health Organization (WHO) and the World Bank (WB) databases, while some specific information on the environmental situation, for each country, were obtained from the Socioeconomic Data and Applications Center (SDAC). Healthcare systems efficiency is analyzed over the period 1996–2017. Thus, the final sample consists of 198 observations for nine Asian countries: Japan, China, India, Indonesia, the Republic of Korea, Malaysia, Pakistan, the Philippines, and Thailand.
Method
To assess the effectiveness of healthcare expenditure from the selected group of Asian countries, the following two-way fixed effects model (country- and year effects) is used:
Dependent Variablei,t = δ0 + δ1 (Independent Variables) + δ2 (Control Variables) + + δ3 (Country Dummies) + δ4 (Year Dummies) + αi + ut + εi,t [Eq. 1]
Our dependent variables are infant mortality (WB: Mortality rate, per 1,000 live births), under-five mortality rate (WB: Mortality rate, under-five, per 1,000 live births) and healthy life expectancy (WHO: Healthy life expectancy at birth, years). Independent variables include current healthcare expenditure [(Global Health Expenditure Database: Current Health Expenditure (CHE) as percentage of Gross Domestic Product (GDP)] or current health expenditure per capita [(CHE) per capita, PPP (current international USD)]; regulatory quality or control of corruption (WB: World Governance Indicators); animal protein, plant protein, fat and carbohydrates consumption (FAO: the average per capita supply of calories derived from protein, fat, and carbohydrates, respectively, all measured in kilocalories per person per day); carbon dioxide emissions per capita (Our World in Data: CO2 metric tons per capita); unsafe water drinking index (SDAC: UWD). Control variables include GDP per capita in USD, PPP (WB: GDP per capita, PPP, constant 2011 international USD), unemployment rate (WB: unemployment, total percentage of total labor force; modeled ILO estimate); real GDP growth ratio (The International Monetary Fund: Real GDP growth, annual percent change), population density (WB: people per sq. km of land area). Logarithmic transformations are applied if necessary as suggested by, eg, Wooldridge.14 We add a square term for either component of diet composition in each regression, assuming the existence of certain optimal, per capita consumption levels for respective components. Table 1 presents a detailed description of all variables. The appendix contains a matrix of cross-correlations.
 |
Table 1 Descriptive Statistics |
In our regression analysis, we compare the two sub-samples, seven non-OECD members (low- and middle-income countries) and two OECD members (the Republic of Korea and Japan, both high income), in order to identify predictors, which are specific for each sub-group.
We have also considered inclusion of other empirical methods such as Bayesian quantile regression method that was extensively used in scholarly literature.22,23 This method assumes that the effects of independent variables differ across the quantiles of dependent variables. Yet, after thorough exploration, we concluded our ground assumptions where selected to be the ones described above. Thus, according to our best econometric assessment we picked up two-way fixed effects model as a convenient one to address our research question.
In addition, we utilize the counterfactual decomposition technique, popularized by Blinder24 and Oaxaca,25 which is widely used to study mean outcome differences between groups. The goal of decomposition analysis is to quantify the contribution of various factors to the change of outcomes or difference in outcomes between groups. For two groups, A and B, decomposition is formulated in terms of group B: how would group B perform if it had group A’s endowment? Jann26 provides a guide for Stata software to estimate our models.
Summary Statistics
Apparently, Japan outperforms other countries from the sample in major healthcare performance indicators like life expectancy and infant mortality. The Republic of Korea is ranked second. Not surprisingly, the main contributing factors, which affect, directly or indirectly, the health of people in the two countries, have either the best or second best values. The only exception is per capita carbon dioxide emissions, which have maximal values in the Republic of Korea and Japan.
Results
Tables 2–4 demonstrate that regression analysis, with sub-samples, is useful for identifying predictors of infant mortality, under-five mortality and healthy life expectancy, which are specific to the OECD-members with outstanding healthcare outcomes among the analyzed countries, compared to other Asian countries from our sample.
 |
Table 2 Predictors of Infant Mortality in Nine Asian Countries: Log-Linear Regression Estimates |
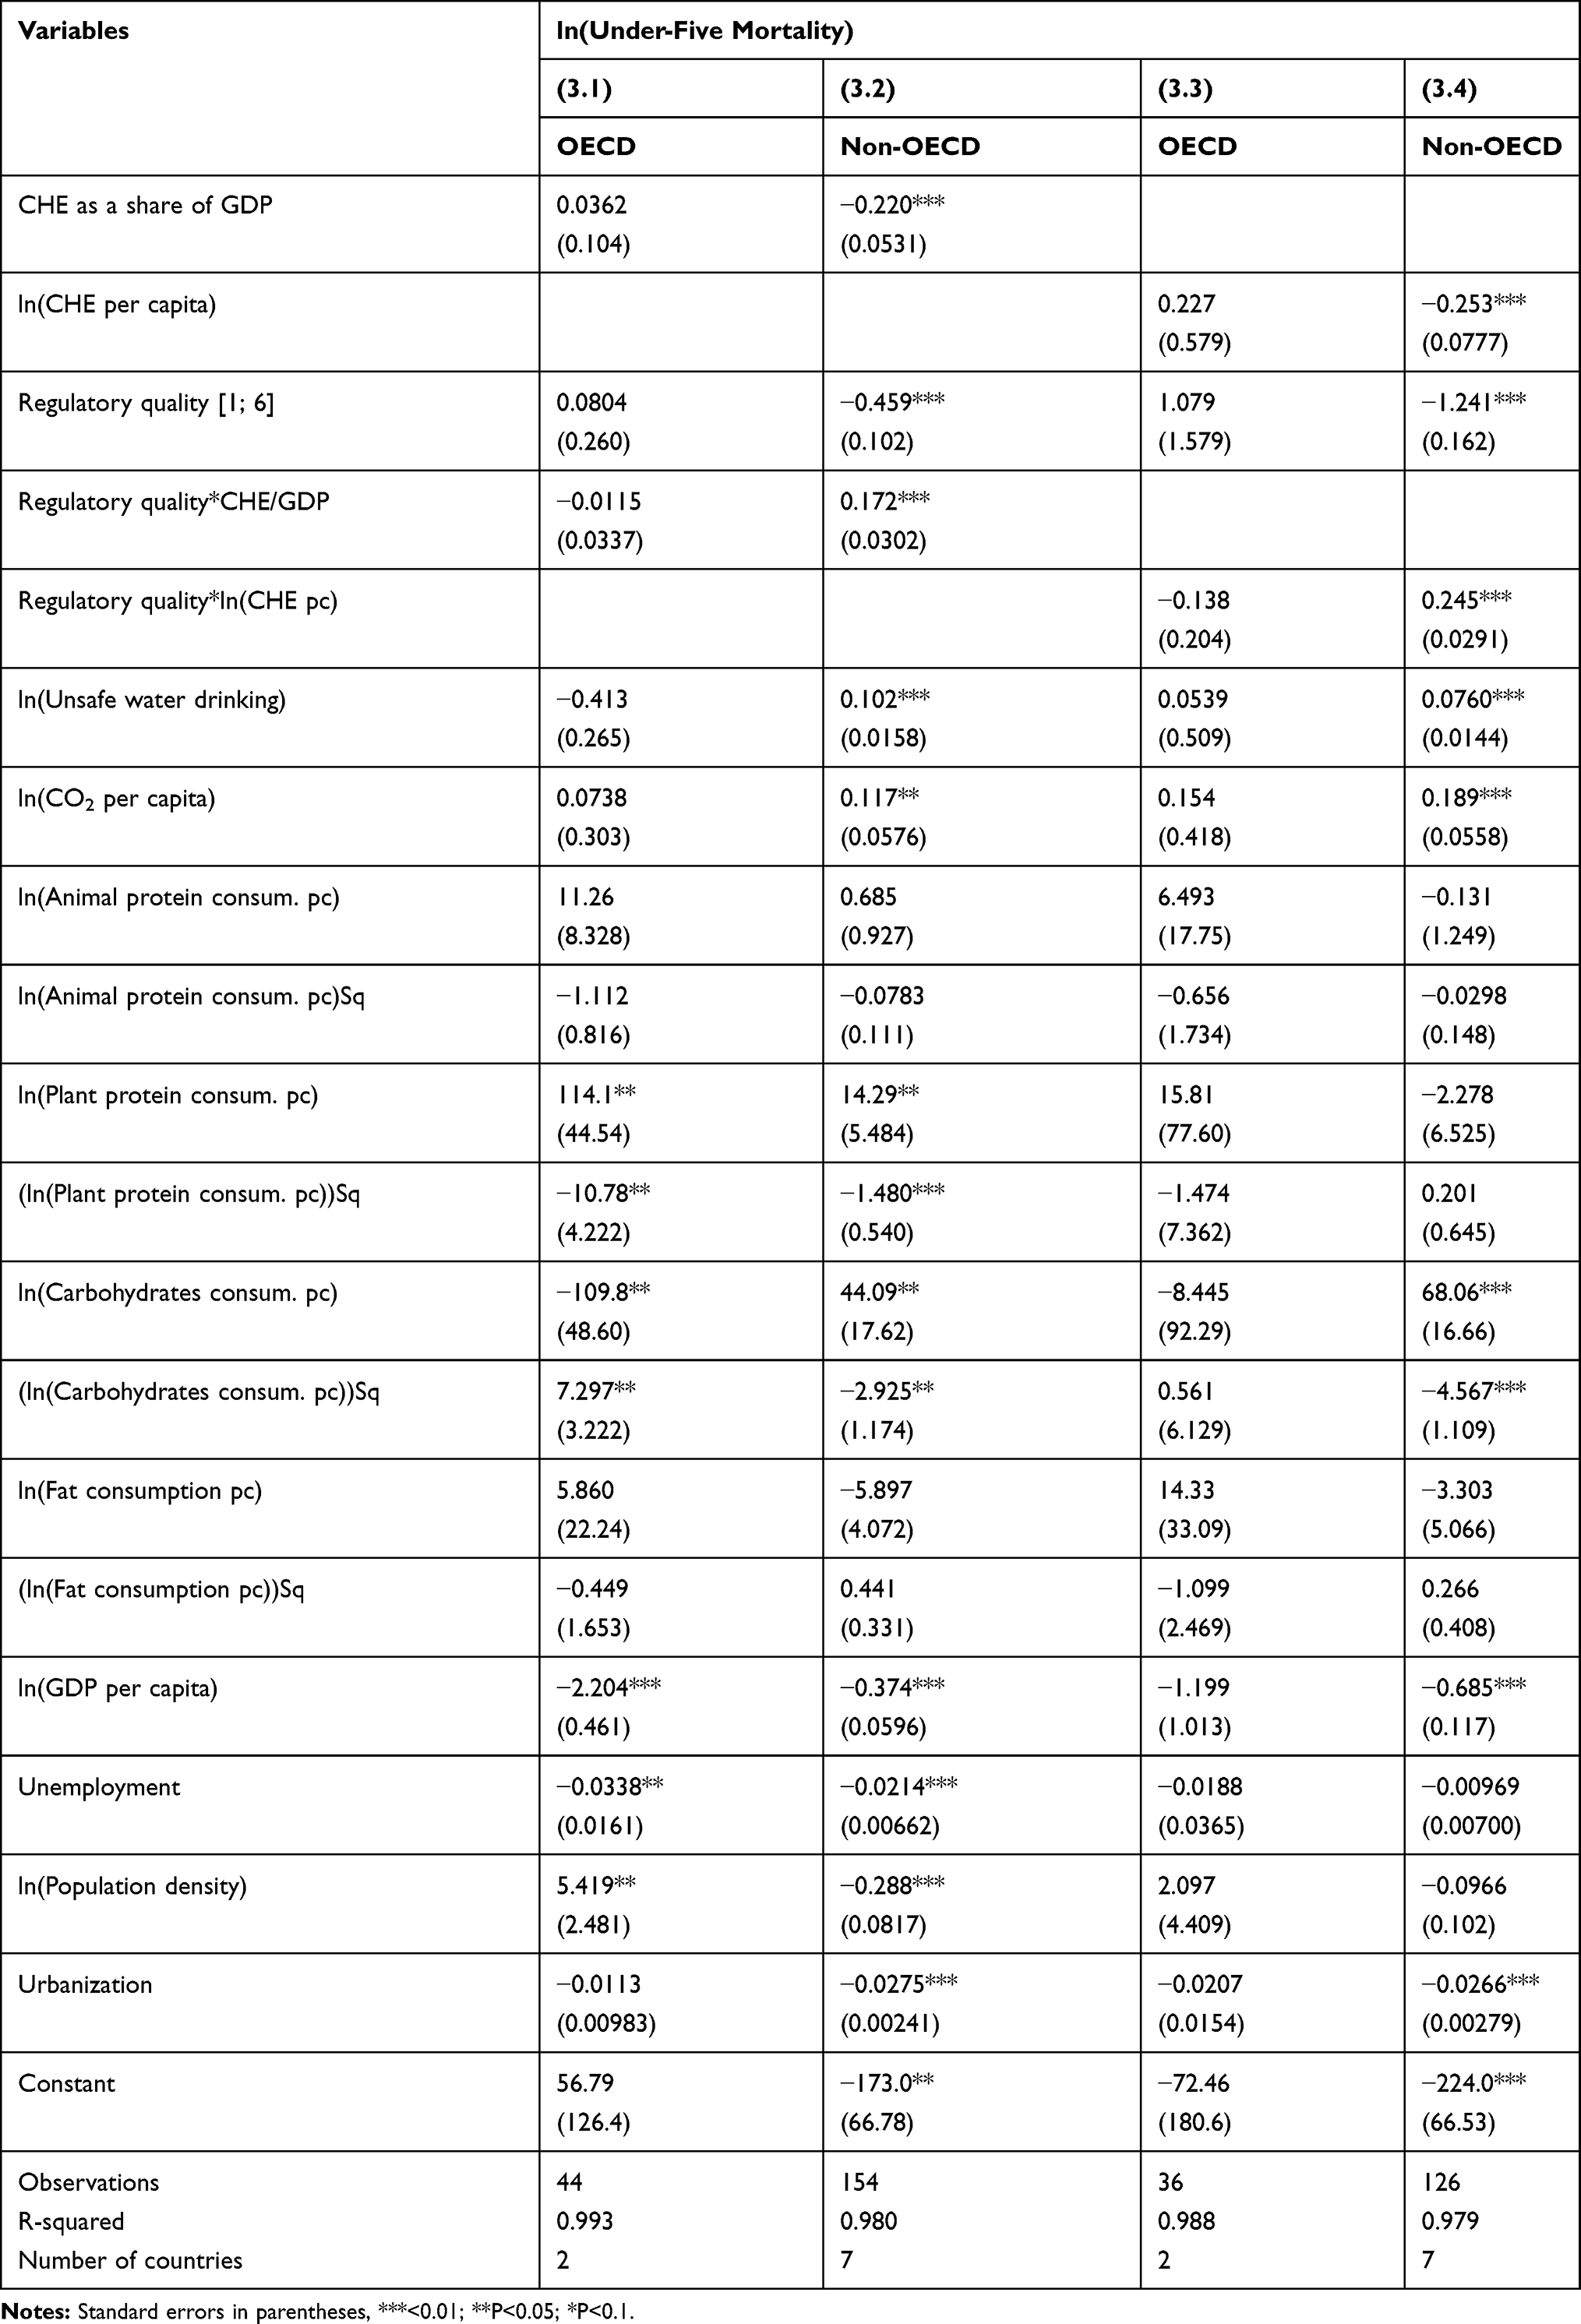 |
Table 3 Predictors of Under-Five Mortality in Nine Asian Countries: Log-Linear Regression Estimates |
 |
Table 4 Predictors of Healthy Life Expectancy in Nine Asian Countries: Log-Linear Regression Estimates |
Predictors of Infant Mortality in the Leading Asian Countries
Regressions (2.1)-(2.4), from Table 2, contain the OLS estimates of our model given in Eq. (1) for infant mortality. Regressions (2.1) and (2.2) present the results from estimating a version of Eq. (1) with current health expenditure in GDP, for OECD and non-OECD countries, respectively. Similarly, regressions (2.3) and (2.4) provide the results from estimating a version of Eq. (1) with per capita current health expenditure, for OECD and non-OECD countries, respectively. In our regressions, we interact current health expenditure as a share of GDP (2.1 and 2.2) or per capita current health expenditure (2.3 and 2.4) with regulatory quality and include this as an additional independent variable. To capture the direct effect of regulatory quality on infant mortality, we also include regulatory quality independently.
The main result here is that, in non-OECD Asian countries, both interaction terms of regulatory quality, with either current health expenditure as a share of GDP, or per capita current health expenditure, are significant at the 1%-level (coefficients of 0.153 and 0.225, respectively). The results suggest that one percentage point increase in the share of health expenditure in GDP is associated with a 19.3% decline in infant mortality (significant at the 1%-level). Similarly, one percentage point growth of per capita health expenditure is linked with a 23.8% decrease in infant mortality (significant at the 1%-level). Regulatory quality is negative and statistically significant at the1%-level in both model specifications: (2.2) and (2.4). In addition, statistically significant interaction terms imply that the better regulatory quality is, the larger becomes the effect of the share of health expenditure in GDP on infant mortality (or alternatively, the worse regulatory quality is, the smaller the effect of the share of health expenditure in GDP on infant mortality becomes). As for direct factors, in non-OECD Asian countries, unsafe water drinking and per capita carbon dioxide emissions increase infant mortality. Interestingly, only per capita consumption of carbohydrates and its square term are statistically significantly linked with infant mortality in non-OECD Asian countries, suggesting the existence of a non-linear relationship between the two variables. The results of the estimates, with control of corruption, included instead of regulatory quality, are qualitatively the same (see Supplementary Material 1). Both regulatory quality and control of corruption are indicators of the quality of governance calculated by the World Bank.20 Simultaneous inclusion of both indicators in one model would cause multicollinearity problem as the two indicators are highly correlated (see Appendix).
Regarding the effects of control variables, there is a strong negative association between GDP per capita and infant mortality in both sub-samples, although its impact is far larger in Japan and the Republic of Korea. Predictably, in non-OECD Asian countries, urbanization has a negative impact on infant mortality, statistically significant at the 1%-level as population has better access to medical facilities: models (2.2) and (2.4).
Predictors of Under-Five Mortality in the Leading Asian Countries
Regressions (3.1)-(3.4), from Table 3, contain the OLS estimates of our model given in Eq. (1) for under-five mortality. Regressions (3.1) and (3.2) present the results from estimating a version of Eq. (1) with current health expenditure in GDP, for OECD and non-OECD countries, respectively. Similarly, regressions (3.3) and (3.4) provide the results from estimating a version of Eq. (1) with per capita current health expenditure, for OECD and non-OECD countries, respectively. In our regressions, we interact current health expenditure as a share of GDP (3.1 and 3.2) or per capita current health expenditure (3.3 and 3.4) with regulatory quality and include this as an additional independent variable. To capture the direct effect of regulatory quality on under-five mortality, we also include regulatory quality independently.
The key result here is that, in non-OECD Asian countries, both interaction terms of regulatory quality with either current health expenditure as a share of GDP or per capita current health expenditure are significant at the 1%-level (coefficients of 0.172 and 0.245, respectively). The results suggest that a one percentage point increase in the share of health expenditure in GDP is associated with a 22% decline in under-five mortality (significant at the 1%-level). Similarly, a one percentage point growth of per capita health expenditure is linked with a 25.3% decrease in under-five mortality (significant at the 1%-level). Regulatory quality is negative and statistically significant at the 1%-level in both model specifications: (3.2) and (3.4). In addition, positive and statistically significant interaction terms imply that the better regulatory quality is, the larger becomes the effect of the share of health expenditure in GDP on under-five mortality (or alternatively, the worse regulatory quality is, the smaller the effect of the share of health expenditure in GDP on under-five mortality becomes). As for direct factors, in non-OECD Asian countries, unsafe water drinking and per capita carbon dioxide emissions increase under-five mortality. Interestingly, only per capita consumption of carbohydrates and its square term are statistically significantly linked with under-five mortality in non-OECD Asian countries, suggesting the existence of a non-linear relation between the two variables. Results of the estimates with control of corruption, included instead of regulatory quality, are qualitatively the same (see Supplementary Material 2).
Regarding the effects of control variables, there is a strong negative association between GDP per capita and under-five mortality in both sub-samples, although its impact is far larger in Japan and the Republic of Korea. Predictably, in non-OECD Asian countries, urbanization has a negative impact on under-five mortality, statistically significant at 1%-level in models (3.2) and (3.4).
Predictors of Healthy Life Expectancy in the Leading Asian Countries
Regressions (4.1)-(4.4), from Table 4, contain the OLS estimates of our model given in Eq. (1) for healthy life expectancy. Although more than three quarters (77.3%) of observations of our dependent variable are multiple imputations, we consider these estimates as insightful supporting evidence. Regressions (4.1) and (4.2) present the results from estimating a version of Eq. (1) with current health expenditure in GDP, for OECD and non-OECD countries, respectively. Similarly, regressions (4.3) and (4.4) provide the results from estimating a version of Eq. (1) with per capita current health expenditure, for OECD and non-OECD countries, respectively. In our regressions, we interact current health expenditure as a share of GDP (4.1 and 4.2) or per capita current health expenditure (4.3 and 4.4) with regulatory quality and include this as an additional independent variable. To capture the direct effect of regulatory quality on healthy life expectancy, we also include regulatory quality independently.
The main result here is that, in non-OECD Asian countries, both interaction terms of regulatory quality, with either current health expenditure as a share of GDP, or per capita current health expenditure, are significant at the 1%-level (coefficients of −0.015 and −0.020, respectively). The results suggest that a one percentage point increase in the share of health expenditure in GDP is associated with a three percent growth in healthy life expectancy (significant at the 1%-level). Similarly, a one percentage point growth of per capita health expenditure is linked with a 2.1% growth in healthy life expectancy. Regulatory quality is positive and statistically significant at the 1%-level in both model specifications: (4.2) and (4.4). In addition, negative and statistically significant interaction terms imply that the better regulatory quality is, the smaller becomes the effect of the share of health expenditure in GDP on healthy life expectancy (or alternatively, the worse regulatory quality is, the larger the effect of the share of health expenditure in GDP on healthy life expectancy becomes). As for direct factors, in non-OECD countries, unsafe water drinking has a statistically negative effect on healthy life expectancy. Interestingly, only per capita consumption of carbohydrates and its square term are statistically significantly linked with healthy life expectancy in non-OECD Asian countries, suggesting the existence of an optimal level of per capita carbohydrates consumption associated with healthy life expectancy. The results of the estimates with control of corruption, included instead of regulatory quality, are qualitatively the same (see Supplementary Material 3).
Regarding the effects of control variables, population density and urbanization are positively associated with healthy life expectancy in non-OECD Asian countries. The respective coefficients are statistically significant at the 1%-level in models (4.2) and (4.4). In Japan and the Republic of Korea, per capita GDP is positively and statistically significantly linked with healthy life expectancy.
Decomposition Results
Table 5 demonstrates Oaxaca-Blinder decomposition of infant mortality in OECD and non-OECD countries. The first four columns represent the estimates with regulatory quality, while the last four columns – with control of corruption. In our sample, the mean of the ln(infant mortality) is 3.217 for non-OECD and 1.240 for OECD, yielding a gap of −1.977. The decrease of −2.224 indicates that differences in endowments account for about 220% of the gap in ln(infant mortality). The second term (−1.049) quantifies the change in ln(infant mortality) when applying the OECD’s coefficients to the non-OECD characteristics.
 |
Table 5 Oaxaca-Blinder Decomposition of Infant Mortality in Nine Asian Countries: Log-Linear Estimates with CHE as a Share of GDP |
Table 6 demonstrates Oaxaca-Blinder decomposition of under-five mortality in OECD and non-OECD countries. The first four columns represent the estimates with regulatory quality, while the last four columns – with control of corruption. The mean of the ln(under-five mortality) is 3.424 for non-OECD and 1.476 for OECD, yielding a gap of −1.948. The decrease of −2.294 indicates that differences in endowments account for about 230% of the gap in ln(under-five mortality). The second term (−0.789) quantifies the change in ln(under-five mortality) when applying the OECD’s coefficients to the non-OECD characteristics.
 |
Table 6 Oaxaca-Blinder Decomposition of Under-Five Mortality in Nine Asian Countries: Log-Linear Estimates with CHE as a Share of GDP |
Table 7 demonstrates Oaxaca-Blinder decomposition of healthy life expectancy in OECD and non-OECD countries. The first four columns represent the estimates with regulatory quality, while the last four columns – with control of corruption. The mean of the ln(healthy life expectancy) is 4.108 for non-OECD and 4.272 for OECD, yielding a gap of 0.164. The increase of 0.297 indicates that differences in endowments account for about 29.7% of the gap in ln(healthy life expectancy). The second term (0.191) quantifies the change in ln(healthy life expectancy) when applying the OECD’s coefficients to the non-OECD characteristics.
 |
Table 7 Oaxaca-Blinder Decomposition of Healthy Life Expectancy in Nine Asian Countries: Log-Linear Estimates with CHE as a Share of GDP |
The results of the estimates for either key performance indicator with control of corruption, included instead of regulatory quality, are the same, except, of course, for overall endowments and coefficients. The results of the estimates with per capita current health expenditure, included instead of current health expenditure as a share of GDP, for either key performance indicator are qualitatively the same and are available in Supplementary Materials 4–6 for infant mortality, under-five mortality and healthy life expectancy, respectively.
Thus, not surprisingly, our estimates suggest that efficiency of healthcare systems, measured through any of the three indicators, is lower in our non-OECD sub-sample. These countries can achieve better outcomes by systematic improvement of direct and indirect factors through the respective policy measures.
Discussion
In line with the previous studies,17,18 our results demonstrate that quality of governance and current health expenditure are indeed the main determinants of healthcare system performance in Asia. In addition, population density and urbanization are positively linked with healthy life expectancy in non-OECD Asian countries. In this group, unsafe water drinking negatively affects healthy life expectancy. Interestingly, our estimates suggest the presence of an optimal level of per capita carbohydrates consumption associated with healthy life expectancy. In the analyzed non-OECD Asian countries, unsafe water drinking and per capita carbon dioxide emissions increase infant mortality. In the OECD group, represented by Japan and South Korea, there is a strong negative association between per capita GDP and infant mortality in both sub-samples, although its impact is far larger in the OECD group. In addition, unemployment is negatively associated with infant mortality there.
Since we focus our attention on Asian health systems, we need to track important differences in the historical legacy of OECD and non-OECD health systems in this vast region. Since 1949, and during the entire Cold War Era, most contemporary non-OECD Asian countries adopted Marxist-Leninist state theory routed health system establishments. All of them were essentially based on the legacy of the Soviet Semashko tradition, established in 1921.27 It was largely focused on the principles of social justice and equity and obsessed with the goal to deliver as much affordable medical care as was possible, at the level of technology and social development, in the early Post-WWII decades.28,29 The remaining socialist nations today in this region are China, North Korea, Vietnam, and Laos. In contrast, the typical free-market economies are Japan, India, Indonesia, Malaysia, Pakistan, the Philippines, the Republic of Korea, and Thailand. Japan was admitted to the OECD as early as of 1964 only four years after its establishment, while South Korea got its membership only in 1996.30 These health systems faceted alongside Western European Bismarck and Beveridge traditions and the North American influence. Market mechanisms of supply and demand, although with a strict state regulation, allowed Japan to achieve a welfare state status in the early 1960s. “Asian Tigers” – the economies of South Korea, Singapore and Taiwan – followed these footsteps during the late 1980s and early 1990s.31 This has reflected the adoption of health economics principles in resource allocation and governance among the non-OECD, free-market economies. Historically speaking, these development milestones are visible in the order of mushrooming of Health Technology Assessment agencies (HTA) across the Far East.32,33 Unlike the rest, the huge South Asian nations of India and Pakistan, so far, have not managed to establish a prosperous welfare statehood with a substantial degree of income and living standard equality for large swaths of population.34 The blossoming economy of India, which currently demonstrates the fastest real GDP growth among large nations worldwide, exposes huge inequalities as reported via Gini indices in numerous studies.35–37
Population density and urbanization were positively associated with healthy life expectancy in non-OECD Asian countries. This may be largely attributable to the strong network coverage of healthcare institutions in core urban coastal areas and large industrial cities scattered across mainland China and Indochinese nations.38 This effect is further visible in improved access to medical care and its affordability. Thus, a constellation of citizens in densely populated areas, regardless of few major setbacks, such as environmental pollution, has had prevailingly positive effects on longevity.39 An elevation of lower social layers from the poverty in China and many of these countries has contributed to these successes. The Chinese breakthrough achievement of lifting up to 800 million people from the poverty as documented by the respective UNDP,40 UN41 reports on sustainable Millennium Development Goals (MDGs),42 and National Strategy documents,43,44 was an important social policy model for less rich non-OECD surrounding nations facing similar challenges. Surprisingly, even Japanese average life expectancy in the early Post-WWII period was barely 55 years as an example among Asian OECD nations.45 Japanese Imperial legacy of strong industrial development was the pioneering case in this vast Asian region, historically dating back from the Meiji reformation of 1868 and culminating in the early 1900s.46–48 With the introduction of meat into diet, improved housing, heating systems and a variety of public health measures, life expectancy was rapidly increasing during the following decades. Nowadays, this success story is repeated on a much larger scale in Asia.49
In this group, unsafe water drinking has a statistically negative effect on healthy life expectancy. As noted earlier, environmental pollution, particularly in coastal industrialized mega-cities has become a brand feature of rapid development of a scale.50 Theoretically, it can be explained it with the fact that many effectively dirty technologies were moved from the rich OECD nations to China, and, later on, India,51 Vietnam, Malaysia, Indonesia, Thailand and other surrounding nations. Water scarcity, given the fact that the major bulk of the human population lives in this large region, is gradually becoming an issue of strategic importance.52 This refers particularly to the scarcity of drinking water supplies. Currently, there is less shortage of the technical water for building and industrial needs. Our study confirms substantially higher per capita carbon dioxide emissions in the Republic of Korea and Japan. This phenomenon might be largely attributable to the living standards, volume of household consumption and traffic density in relation to the population size.53 Many countries in the Middle Eastern region of Asia, together with Australian regions, alike, have already imposed control policies over citizens’ water consumption.54 Yet, most of Southeast Asia remains blessed with monsoon rains with some notable exceptions surrounding the huge Gobi desert – China, Mongolia, and Central Asian countries.55 These regions are mostly outside our current consideration, but remain loosely tied to the economy of the vast area of Southeast Asia. This is heavily driven by the unfolding build-up of the huge New Silk Road or “One Road – One Belt” (OBOR) project, co-funded by the Asian Investment Bank, the BRICS Bank, and national governments.56 Notably, the “Belt and Road” is commonly designated in Asia and the West alike, as the largest infrastructure investment project in the entire history of humanity.57
Interestingly, only per capita consumption of carbohydrates is significantly linked with healthy life expectancy. Nutrition is increasingly gaining attention in interdisciplinary sciences of health economics and policy alike, given its tremendous influence over contemporary lifestyle. Foods with high numbers of preservatives, allowing them to be stored in supermarket warehouses for up to two years were confirmed for their carcinogenicity and other chronic toxicity.58 Next to this, high degrees of saturated fats and recycled oil are being consistently used in Asian cuisines, with a particularly strong presence in many authentic national cuisines across Chinese (typically Sichuan, Anhui, and Yunan), Korean and Vietnamese regions.59 Correlation of the use of carbohydrates with healthy life expectancy is logical, given the fact that rice (Oryza glaberrima or Oryza sativa) and sweet potato (Ipomoea batatas) play a central role in the diet of all these nations. Other regional cuisines, eg, the Thai, own their seductive reputation largely to the addition of simple sugars in a variety of meat, fruits, and vegetable-based meals.60 The WHO has recently formally acknowledged saccharose as an addictive substance and recommended its abolishment in the institutional nutrition of children in kindergartens’ and schools’ kitchens.61 This is being complemented with large quantities of wheat made pasta, among which traditional Japanese Soba is among the most famous ones.62 This means that huge quantities of complex carbohydrates, also known as polysaccharides, like starches, are being used as a base compound of any meal in Asian societies.63 Given the contemporary daily routines in high-income OECD societies, it appears that in Asian societies the presence of starches plays a far more important dietary role.64 This short insight into the habitual ways of life and nutrition patterns gives us an explanation for our findings, supported by the seminal studies.65
Among non-OECD Asian countries, unsafe water drinking and per capita carbon dioxide emissions increase the infant mortality rate. Early childhood survival, proxied by under-five mortality as a long-term trend, continues to improve radically all across the region.66 The pace of these positive developments is, of course, much slower in lower income societies like Myanmar, Nepal, Bangladesh, rural regions of India, Pakistan and Indonesia, which contribute greatly to early childhood mortality across the region.67 Yet, one should understand that unsafe water drinking remains directly correlated to both infectious juvenile diarrhea syndromes68 and heavy metal toxicities.69 There is an abundance of academic literature on complex causal relationship between economic growth and human survival.70 In our observation of the nationwide aggregate data, we have observed a strong negative association between GDP per capita and infant mortality as well as under-five mortality in both sub-samples, although its impact is far larger in Japan and the Republic of Korea.71 This means that the richest of these societies achieve much more favorable early childhood survival.72 In contrast, low- and middle-income countries among them have a lower capacity for resource allocation in preventive childhood medical care.28 Vaccination coverage, neonatal intensive care unit accessibility, midwife nursing staff density, sanitary and dietary conditions for post-delivery conditions and maternal care are obviously very heterogeneous across the region.73
Among the limitations of this study, we should mention that data on sufficient physical activity were not included in the analysis because the WHO did not satisfy our data request.19 Further research should benefit from considering the impact of this important factor, which directly affects human health. In addition, statistical analysis would benefit from including recent data when it becomes available. Nevertheless, we hope that these findings might facilitate further comparative research on the effectiveness of leading Asian health systems.
In addition, the multicollinearity problem was not solved completely due to either control variables, or powers, products of our independent variables, or year- and country-dummy variables. However, as Allison74 suggests:
Regardless of your criterion for what constitutes a high VIF, there are at least three situations in which a high VIF is not a problem and can be safely ignored: 1. The variables with high VIFs are control variables, and the variables of interest do not have high VIFs. […] 2. The high VIFs are caused by the inclusion of powers or products of other variables. […] 3. The variables with high VIFs are indicator (dummy) variables that represent a categorical variable with three or more categories.
All three cases mentioned above are presented in our model. Following the usual practice of addressing the multicollinearity problem, we excluded, in various combinations, variables with high VIFs. Predictably, this led to violations of other assumptions, namely, model specification problem, functional form problem, influential observation problem, residuals’ normality problem, or heteroskedasticity problem.
Major policy implications of this study refer to the balance of input–output ratio of health care investment versus the population health outcomes achieved in various Asian nations with diverse national health policies in place. In the observed period, an array of political reforms affecting health sectors took place. Among many notable improvements are increased physician and nursing staff density and extensive development of a rural network of primary and outpatient medical care facilities across their vast rural peripheries. An additional milestone is International Health Technology Assessment (HTAi), resulting in the establishment of national Health Technology Assessment (HTA) agencies with South Korea on the lead, followed by Taiwan, Singapore, China, Japan, and Thailand. Concerning growth of citizen out-of-pocket (OOP) spending alongside the deepening gap between the newly established rich elites and middle-income citizens presents a serious obstacle towards achieving universal health coverage. Thus, the major policy implication of our study is that most of Asian national authorities should keep in mind their control of OOP private expenditure via an array of risk-sharing agreements. Room for exit strategies to decrease huge budgetary pressures was already recognized in such negotiations among Big Pharma multinationals and governmental authorities in charge of marketing approval of expensive innovative medicines, such as Chinese CFDA and Japanese PMDA. Additional strong policy implication of our study, for Japanese policy-makers in particular, is in their almost unbearable approaching burden of accelerated population aging, seriously questioning the financial sustainability of entire social, retirement, and health insurance funds. Thus, we frankly hope that insights provided with these econometric and population health estimates could help local authorities to derive a clearer transnational understanding of their joint and shared challenges and risks approaching during the 2020s.
Conclusion
Our goal was to assess the effectiveness of healthcare spending among these nine Asian nations over the period 1996–2017. Throughout the complex two-way fixed effects model, based on aggregate national datasets, we managed to reveal some of the hidden underlying drivers of health sectors evolving change in Asia. It became apparent that major performance indicators of the national health system included population density, degree of urbanization, nutrition structure and dietary patterns, unemployment and the availability of clean, safe water for citizens’ everyday needs.
Japan has generally outperformed other countries from the sample in major healthcare performance indicators75 like healthy life expectancy and infant mortality, while the Republic of Korea is ranked second. The only exception is per capita carbon dioxide emissions, which have maximal values in the Republic of Korea and Japan. Non-OECD nations’ outcomes were led by China as the largest economy. In terms of the declared UN Sustainable Millennium Goals, China was designated as a classical case of overachiever by the WHO reports. Thus, it may be regarded as a success story with few structural elements of its health policies76 being applicable to some surrounding nations and the UN Sustainable Millennium Goals overachiever.10 This group was characterized with a substantial improvement in the efficiency of health spending since the middle of the 1990s. Yet, progress was noted with remarkable heterogeneity within the group. In the few decades long horizon, observation of these core developments within Asia has exposed rapid growth and appearance of sustainable health system capacities. Their pace of improvement in human longevity, early childhood survival, physician density and affordability of medical care might be regarded a positive exemplary case for most of LMICs worldwide.
Ethical Statement
This study has been conducted with the anonymous, national-level aggregate data thus no patient interventions neither private data protection issues where involved. According to the Helsinki declaration, such study design does not require prior IRB/Ethical Committee consideration neither its approval.
Disclosure
Authors Mihajlo Jakovljevic and Takuma Sugahara express their funding acknowledgement to the Government-owned Japanese Society for promotion of science for awarding the Grant number ID S19161 out of which this project expenses were largely covered. Takuma Sugahara reports grants from Japan Society for the Promotion of Science (JSPS), during the conduct of the study. Yuriy Timofeyev acknowledges that the study was supported by a grant of the Russian Science Foundation (project No. 20-78-00023). The authors report no other potential conflicts of interest for this work.
References
1. Kneeland H, Schoenberg EH, Friedman M. Plans for a study of the consumption of goods and services by American families. J Am Stat Assoc. 1936;31(193):135–140. doi:10.1080/01621459.1936.10503325
2. Mushkin SJ. Toward a definition of health economics. Public Health Rep. 1958;73(9):785–794. doi:10.2307/4590242
3. Grossman M. On the concept of health capital and the demand for health. J Polit Econ. 1972;80(2):223–255. doi:10.1086/259880
4. Hall RE. Stochastic implications of the life cycle-permanent income hypothesis: theory and evidence. J Polit Econ. 1978;86(6):971–987. doi:10.1086/260724
5. Miller TR. Variations between countries in values of statistical life. J Transp Econ Policy. 2000;169–188.
6. Brass DJ, Butterfield KD, Skaggs BC. Relationships and unethical behavior: a social network perspective. Acad Manage Rev. 1998;23(1):14–31. doi:10.5465/amr.1998.192955
7. Reshetnikov V, Arsentyev E, Bolevich S, et al. Analysis of the financing of Russian health care over the past 100 years. Int J Environ Res Public Health. 2019;16(10):1848. doi:10.3390/ijerph16101848
8. Jakovljevic M, Jakab M, Gerdtham U, et al. Comparative financing analysis and political economy of noncommunicable diseases. J Med Econ. 2019;22(8):722–727. doi:10.1080/13696998.2019.1600523
9. Zhou K, Zhang X, Ding Y, et al. Inequality trends of health workforce in different stages of medical system reform (1985–2011) in China. Hum Resour Health. 2015;13(1):94. doi:10.1186/s12960-015-0089-0
10. Jakovljevic M, Timofeyev Y, Ekkert NV, et al. The impact of health expenditures on public health in BRICS nations. J Sport Health Sci. 2019;8(6):516–519. doi:10.1016/j.jshs.2019.09.002
11. Jakovljevic MB, Vukovic M, Fontanesi J. Life expectancy and health expenditure evolution in Eastern Europe – DiD and DEA analysis. Expert Rev Pharmacoecon Outcomes Res. 2016;16(4):537–546. doi:10.1586/14737167.2016.1125293
12. Jakovljevic M, Ogura S. Health economics at the crossroads of centuries – from the past to the future. Front Public Health. 2016;4. doi:10.3389/fpubh.2016.00115
13. Yi Z, Vaupel JW, Zhenyu X, et al. The healthy longevity survey and the active life expectancy of the oldest old in China. Population. 2001;95–116.
14. Wooldridge JM. Introductory Econometrics: A Modern Approach.
15. Jakovljevic M, Timofeyev Y, Ranabhat C, et al. Real GDP growth rates and healthcare spending – comparison between the G7 and the EM7 countries. Global Health. 2020;16:64. doi:10.1186/s12992-020-00590-3
16. Kim Y, Kang M. The measurement of health care system efficiency: cross-country comparison by geographical region. Korean J Policy Stud. 2014;29(1):21–44.
17. Hadad S, Hadad Y, Simon-Tuval T. Determinants of healthcare system’s efficiency in OECD countries. Eur J of Health Econ. 2013;14(2):253–265. doi:10.1007/s10198-011-0366-3
18. Rajkumar AS, Swaroop V. Public spending and outcomes: does governance matter? J Dev Econ. 2008;86(1):96–111. doi:10.1016/j.jdeveco.2007.08.003
19. Guthold R, Stevens GA, Riley LM, et al. Worldwide trends in insufficient physical activity from 2001 to 2016: a pooled analysis of 358 population-based surveys with 1.9 million participants. Lancet Global Health. 2018;6(10):e1077–e1086. doi:10.1016/S2214-109X(18)30357-7
20. Kaufmann D, Kraay A, Mastruzzi M. The worldwide governance indicators: a summary of methodology, data and analytical issues. World Bank Policy Res. 2010;2–29.
21. Ritchie H, Roser M. Diet compositions. 2020. Available from: https://ourworldindata.org/diet-compositions.
22. Xu X, Zhang C, Chen L, Li C. How does industrial waste gas emission affect health care expenditure in different regions of China: an application of Bayesian quantile regression. Int J Environ Res Public Heal. 2019;16:2748. doi:10.3390/ijerph16152748
23. Xu X, Chen L. Projection of long-term care costs in China, 2020–2050: based on the Bayesian quantile regression method. Sustainability. 2019;11:3530. doi:10.3390/su11133530
24. Blinder AS. Wage discrimination: reduced form and structural estimates. J Hum Resour. 1973;8:436–455. doi:10.2307/144855
25. Oaxaca R. Male–female wage differentials in urban labor markets. Int Econ Rev. 1973;14:693–709. doi:10.2307/2525981
26. Jann B. The Blinder–Oaxaca decomposition for linear regression models. Stata J. 2008;8(4):453–479. doi:10.1177/1536867X0800800401
27. Arsentyev EV, Reshetnikov VA. To the biography of NA Semashko: on the work of the first People’s commissar of health in 1920–1925. Hist Med. 2018;5(3):183–192. doi:10.3897/hmj.5.3.32480
28. Jakovljevic M. Resource allocation strategies in Southeastern European health policy. Eur J Health Econ. 2013;14:153–159. doi:10.1007/s10198-012-0439-y
29. Jakovljevic M, Lazarevic M, Milovanovic O, et al. The new and old Europe: East-West split in pharmaceutical spending. Front Pharmacol. 2016. doi:10.3389/fphar.2016.00018
30. Organisation for Economic Co-operation and Development (OECD). 2020. Available from: https://www.oecd.org/about/members-and-partners/.
31. Siddiqi A, Hertzman C. Economic growth, income equality, and population health among the Asian tigers. Int J Health Serv. 2001;31(2):323–333. doi:10.2190/YFXB-E27P-HQDQ-04AM
32. Sivalal S. Health technology assessment in the Asia Pacific region. Int J Technol Assess Health Care. 2009;25(S1):196–201. doi:10.1017/S0266462309090631
33. Ngorsuraches S, Chaiyakunapruk N, Guo JJ, et al. Is it time for joint health technology assessment in Asia? Opportunities and challenges. Value Health Reg Issues. 2017;12:99–100. doi:10.1016/j.vhri.2017.04.002
34. Fan S, Hazell P, Thorat S. Government spending, growth and poverty in rural India. Am J Agric Econ. 2000;82(4):1038–1051. doi:10.1111/0002-9092.00101
35. Azam M, Shariff A. Income inequality in rural India: decomposing the Gini by income sources. Econ Bull. 2011;31(1):739–748.
36. Goli S, Arokiasamy P. Trends in health and health inequalities among major states of India: assessing progress through convergence models. Health Econ Policy Law. 2014;9(2):143–168. doi:10.1017/S1744133113000042
37. Joe W, Mishra US, Navaneetham K. Health inequality in India: evidence from NFHS 3. Econ Polit Wkly. 2008;41–47.
38. Yip W, Fu H, Chen AT, et al. 10 years of health-care reform in China: progress and gaps in universal health coverage. Lancet. 2019;394(10204):1192–1204. doi:10.1016/S0140-6736(19)32136-1
39. Lv J, Wang W, Krafft T, et al. Effects of several environmental factors on longevity and health of the human population of Zhongxiang, Hubei, China. Biol Trace Elem Res. 2011;143(2):702–716. doi:10.1007/s12011-010-8914-8
40. United Nations Development Programme. China national human development report special edition. China Publishing Group Corporation; 2019. Available from: https://www.undp.org/content/dam/china/docs/Publications/NHDR-ENG.pdf.
41. The United Nations (UN). Helping 800 million people escape poverty was greatest such effort in history, says secretary-general, on seventieth anniversary of China’s founding. Available from: https://www.un.org/press/en/2019/sgsm19779.doc.htm.
42. Ministry of Foreign Affairs of the People’s Republic of China. China’s progress report on implementation of the 2030 Agenda for sustainable development. 2019. Available from: https://www.fmprc.gov.cn/mfa_eng/topics_665678/2030kcxfzyc/P020190924780823323749.pdf.
43. Garnaut R, Song L, Fang C, Ed. China’s 40 Years of Reform and Development: 1978–2018. China Update Book Series. Acton: ANU Press; 2018.
44. National Bureau of Statistics of China. Statistical communiqué of the People’s Republic of China on the 2019 national economic and social development. 2020. Available from: http://www.stats.gov.cn/english/PressRelease/202002/t20200228_1728917.html.
45. Ogura S, Jakovljevic M. Health financing constrained by population aging – an opportunity to learn from Japanese experience. Serbian J Exp Clin Res. 2014;15(4):175–181. doi:10.2478/sjecr-2014-0022
46. Mosk C. Japanese Industrial History: Technology, Urbanization, and Economic Growth. ME Sharpe; 2000.
47. Smith TC. The introduction of western industry to Japan during the last years of the Tokugawa period. Harv J Asiat Stud. 1948;11(1/2):130–152. doi:10.2307/2718077
48. Honda G. Differential structure, differential health: industrialization in Japan, 1868–1940. In: Health and Welfare During Industrialization. University of Chicago Press; 1997:251–284.
49. Rancic N, Jakovljevic M. Long term health spending alongside population aging in N-11 emerging nations. East Eur Bus Econ J. 2016;2(1):2–26.
50. Peng SJ, Bao Q. Economic growth and environmental pollution: an empirical test for the environmental Kuznets curve hypothesis in China. Res Financial Economic Issues. 2006;8(273):3–17.
51. Acharyya J. FDI, growth and the environment: evidence from India on CO2 emission during the last two decades. J Econ Dev. 2009;34(1):43–58. doi:10.35866/caujed.2009.34.1.003
52. Rasul G. Food, water, and energy security in South Asia: a nexus perspective from the Hindu Kush Himalayan region. Environ Sci Policy. 2014;39:35–48. doi:10.1016/j.envsci.2014.01.010
53. Ghazouani T, Boukhatem J, Sam CY. Causal interactions between trade openness, renewable electricity consumption, and economic growth in Asia-Pacific countries: fresh evidence from a bootstrap ARDL approach. Renew Sust Energ Rev. 2020;133:110094. doi:10.1016/j.rser.2020.110094
54. Roudi-Fahimi F, Creel L, De Souza RM. Finding the Balance: Population and Water Scarcity in the Middle East and North Africa. Washington, DC: Population Reference Bureau; 2002:1–8.
55. Törnqvist R, Jarsjö J, Karimov B. Health risks from large-scale water pollution: trends in Central Asia. Environ Int. 2011;37(2):435–442. doi:10.1016/j.envint.2010.11.006
56. Jakovljevic MB, Ekkert NV, Mikerova MS, et al. BRICs nations growing impact on the global health sector. MGIMO Rev Int Rel. 2019;12(6):150–166. doi:10.24833/2071-8160-2019-6-69-150-166
57. Li P, Qian H, Howard KW, et al. Building a new and sustainable “Silk Road economic belt”. Environ Earth Sci. 2015;74(10):7267–7270. doi:10.1007/s12665-015-4739-2
58. Laetz CA, Baldwin DH, Collier TK, et al. The synergistic toxicity of pesticide mixtures: implications for risk assessment and the conservation of endangered Pacific salmon. Environ Health Perspect. 2009;117(3):348–353. doi:10.1289/ehp.0800096
59. Ye Q, Pei X. Methods for differentiating recycled cooking oil needed in China. Am Oil Chem Soc. 2015.
60. Kriengsinyos W, Chan P, Amarra MSV. Consumption and sources of added sugar in Thailand: a review. Asia Pac J Clin Nutr. 2018;27(2):262–283.
61. Eneli IU, Oza-Frank R, Grover K, et al. Instituting a sugar-sweetened beverage ban: experience from a children’s hospital. Am J Public Health. 2014;104(10):1822–1825. doi:10.2105/AJPH.2014.302002
62. Lovegrove A, Edwards CH, De Noni I, et al. Role of polysaccharides in food, digestion, and health. Crit Rev Food Sci Nutr. 2017;57(2):237–253. doi:10.1080/10408398.2014.939263
63. Kumar V, Sinha AK, Makkar HP, et al. Dietary roles of non-starch polysachharides in human nutrition: a review. Crit Rev Food Sci Nutr. 2012;52(10):899–935. doi:10.1080/10408398.2010.512671
64. Chen HH, Wang YS, Leng Y, et al. Effect of NaCl and sugar on physicochemical properties of flaxseed polysaccharide-potato starch complexes. Sci Asia. 2014;40(1):60–68. doi:10.2306/scienceasia1513-1874.2014.40.060
65. Glencross B, Blyth D, Tabrett S, et al. An assessment of cereal grains and other starch sources in diets for barramundi (Lates calcarifer) – implications for nutritional and functional qualities of extruded feeds. Aquac Nutr. 2012;18(4):388–399. doi:10.1111/j.1365-2095.2011.00903.x
66. Jakovljevic MB, Netz Y, Buttigieg SC, et al. Population aging and migration – history and UN forecasts in the EU-28 and its east and south near neighborhood – one century perspective 1950–2050. Global Health. 2018;14(1):30. doi:10.1186/s12992-018-0348-7
67. Houweling TA, Jayasinghe S, Chandola T. The social determinants of childhood mortality in Sri Lanka: time-trends & comparisons across South Asia. Indian J Med Res. 2007;126(4):239–248.
68. Mertens TE, Fernando MA, Cousens SN, et al. Childhood diarrhoea in Sri Lanka: a case-control study of the impact of improved water sources. Trop Med Parasitol. 1990;41(1):98–104.
69. He B, Yun Z, Shi J, et al. Research progress of heavy metal pollution in China: sources, analytical methods, status, and toxicity. Chinese Sci Bull. 2013;58(2):134–140. doi:10.1007/s11434-012-5541-0
70. Mazumdar K. Causal flow between human well-being and per capita real gross domestic product. Soc Indic Res. 2000;50(3):297–313.
71. Thorvaldsen G. Infant mortality now and then: the dual role of economic resources. Transylvanian Rev. 2018;27(02):104–121.
72. Schell CO, Reilly M, Rosling H, et al. Socioeconomic determinants of infant mortality: a worldwide study of 152 low-, middle-, and high-income countries. Scand J Public Health. 2007;35(3):288–297. doi:10.1080/14034940600979171
73. Jakovljevic M, Getzen TE. Growth of global health spending share in low and middle income countries. Front Pharmacol. 2016;7. doi:10.3389/fphar.2016.00021
74. Allison P. When can you safely ignore multicollinearity? 2012. Available from: https://statisticalhorizons.com/multicollinearity.
75. Jakovljevic M, Nakazono S, Ogura S. Contemporary generic market in Japan – key conditions to successful evolution. Expert Rev Pharmacoecon Outcomes Res. 2014;14(2):181–194. doi:10.1586/14737167.2014.881254
76. Chen L, Zhang X. Health insurance and long-term care services for the disabled elderly in China: based on CHARLS data. Risk Manag Healthc Policy. 2020;13:155–162. doi:10.2147/RMHP.S233949
 © 2020 The Author(s). This work is published and licensed by Dove Medical Press Limited. The
full terms of this license are available at https://www.dovepress.com/terms
and incorporate the Creative Commons Attribution
- Non Commercial (unported, 3.0) License.
By accessing the work you hereby accept the Terms. Non-commercial uses of the work are permitted
without any further permission from Dove Medical Press Limited, provided the work is properly
attributed. For permission for commercial use of this work, please see paragraphs 4.2 and 5 of our Terms.
© 2020 The Author(s). This work is published and licensed by Dove Medical Press Limited. The
full terms of this license are available at https://www.dovepress.com/terms
and incorporate the Creative Commons Attribution
- Non Commercial (unported, 3.0) License.
By accessing the work you hereby accept the Terms. Non-commercial uses of the work are permitted
without any further permission from Dove Medical Press Limited, provided the work is properly
attributed. For permission for commercial use of this work, please see paragraphs 4.2 and 5 of our Terms.