Back to Journals » OncoTargets and Therapy » Volume 9
Predictive values of diffusion-weighted imaging and perfusion-weighted imaging in evaluating the efficacy of transcatheter arterial chemoembolization for hepatocellular carcinoma
Authors Lin M, Tian MM, Zhang WP, Xu L, Jin P
Received 11 May 2016
Accepted for publication 3 September 2016
Published 14 November 2016 Volume 2016:9 Pages 7029—7037
DOI https://doi.org/10.2147/OTT.S112555
Checked for plagiarism Yes
Review by Single anonymous peer review
Peer reviewer comments 3
Editor who approved publication: Dr Samir Farghaly
Min Lin,1 Man-Man Tian,1 Wei-Ping Zhang,2 Li Xu,1 Ping Jin1
1Department of Radiology, 2Department of Oncology, The Third Affiliated Hospital of Zhejiang Chinese Medical University, Hangzhou, Zhejiang Province, People’s Republic of China
Abstract: This study explored the predictive values of diffusion-weighted imaging (DWI) and perfusion-weighted imaging (PWI) in evaluating the efficacy of transcatheter arterial chemoembolization (TACE) for patients with hepatocellular carcinoma (HCC). A total of 118 HCC patients treated with TACE were selected from April 2013 to November 2015. T1-weighted imaging (T1WI)/T2-weighted imaging (T2WI), DWI, and PWI were performed on all patients before and after TACE. Efficacy was evaluated according to modified Response Evaluation Criteria in Solid Tumors 1.1. Receiver operating characteristic curve was used to evaluate the diagnostic power of quantitative DWI and PWI parameters in evaluating the efficacy of TACE for HCC patients. Among the 118 HCC patients, there were 17 cases (14.4%) with complete response, 50 cases (42.4%) with partial response, 28 cases (23.7%) with stable disease, and 23 cases (19.5%) with progressive disease. There were 67 patients in the effective group (complete response + partial response) and 51 patients in the ineffective group (stable disease + progressive disease). Before TACE, there were significant differences in maximum tumor diameter (MTD), apparent diffusion coefficient (ADC), slow ADC (Dslow), fast ADC (Dfast), transfer constant of vessel at the maximum level (Ktrans), and rate constant of backflux (Kep) between the effective and ineffective groups (all P<0.05). After TACE, the effective group exhibited lower MTD, Dfast, and Kep and higher ADC and Dslow than the ineffective group (all P<0.05). Tumor regression rate negatively correlated with MTD, Ktrans, Kep, and Dfast but positively correlated with ADC and Dslow. Receiver operating characteristic curve analysis suggested that the area under the curve of ADC, Dslow, Dfast, Ktrans, and Kep were 0.869, 0.833, 0.812, 0.802, and 0.809, respectively. In conclusion, these results suggest that quantitative DWI and PWI parameters might be useful in evaluating the efficacy of TACE in the treatment of HCC patients.
Keywords: hepatocellular carcinoma, transcatheter arterial chemoembolization, diffusion-weighted imaging, perfusion-weighted imaging, efficacy
Introduction
Hepatocellular carcinoma (HCC) is one of the most common malignancies worldwide for its high incidence and mortality, which seriously threatens human health and life.1 In the People’s Republic of China, HCC is the second leading malignancy with an annual incidence and mortality of ~360,000 and 350,000, respectively.2 Surgical resection remains the first option for HCC patients, but a number of patients are diagnosed after the optimal time for surgical resection has passed.3 Transcatheter arterial chemoembolization (TACE) has been widely used in patients with unresectable HCC.4 TACE involves the emulsification of a chemotherapeutic agent in a viscous drug carrier and embolic material into the tumor-feeding arteries, thereby inducing tumor necrosis and regression.3,5 Thus, it is of paramount importance to assess the efficacy of TACE in the treatment of HCC accurately and timely.
Computed tomography (CT), magnetic resonance imaging (MRI), and digital subtraction angiography (DSA) are common imaging techniques in evaluating the efficacy of TACE for HCC.6 Diffusion-weighted imaging (DWI) and perfusion-weighted imaging (PWI), as representatives of functional MRI techniques, play pivotal roles in the diagnosis and efficacy assessment of HCC.7 DWI exploits the random motion of water molecules in tissues, which takes apparent diffusion coefficient (ADC) as a quantitative index in clinical practice.8 PWI provides information on microvascular distribution and blood perfusion with high temporal and spatial resolutions.9 Compared with the commonly used methods such as CT, MRI, and DSA, in the follow-up of HCC after TACE, DWI is capable of detecting new lesions and distinguishing residual neoplastic tissue and necrotic neoplastic tissue timely and accurately.10 Additionally, PWI acts as a very sensitive imaging technique that could be used to monitor blood flow changes in HCC both before and after TACE as well as to evaluate the efficacy of TACE.11 The combination of DWI and PWI could achieve a more accurate diagnosis of tumor residual or recurrence after TACE, which exerts a beneficial impact on assessing early clinic effects and making further therapeutic plan. However, few studies report the quantitative parameters of DWI combined with PWI in evaluating the therapeutic efficacy of TACE in the treatment of HCC. In the present study, we aimed to explore the predictive values of DWI and PWI in evaluating the efficacy of TACE in the treatment of HCC patients.
Patients and methods
Ethics statement
This study was approved by the ethics committee of The Third Affiliated Hospital of Zhejiang Chinese Medical University. Written informed consent was obtained from each patient. All procedures were performed strictly in accordance with the guidelines of the Declaration of Helsinki.
Study subjects
A total of 118 HCC patients treated with TACE were selected from April 2013 to November 2015 from the Third Affiliated Hospital of Zhejiang Chinese Medical University, including 64 males and 54 females with a mean age of 57.7±10.12 years (range 26–79 years). These patients included 59 cases (50.0%) with primary liver cancer, 24 cases (20.3%) with gastric cancer metastasis, and 35 cases (29.7%) with adenosquamous carcinoma. In all, 48 cases (40.7%) had tumor diameter ≤5 cm, 45 cases (38.1%) had a history of liver disease, 70 cases (59.3%) had phospholipase C with cirrhosis and macronodular cirrhosis (cirrhosis nodule ≥3 cm), and 66 cases (55.9%) had positive serum hepatitis B surface antigens (HBsAg). In 29 cases (24.6%), alpha fetoprotein (AFP) level (>20–400 ng/mL) was examined by radio-immunity assay. Clinical stage was determined according to the staging criteria formulated in the National Collaboration Conference for Hepatocellular Carcinoma: stage I, no obvious symptoms or signs (33 cases); stage II, clinical symptoms or signs appeared but no signs of stage III appeared (44 cases); stage III, evident dyscrasia, jaundice, ascites, or distant metastasis appeared (41 cases). All HCC patients were pathologically confirmed by CT-guided fine-needle aspiration biopsy. The following were the diagnostic criteria: 1) cirrhosis and hepatitis B virus infection confirmed by MRI and 2) liver tumors ≥2 cm in diameter determined by CT or MRI. The inclusion criteria were as follows: 1) the liver lesions had been determined as HCC by puncture pathology; 2) the tumor was in a single nodule or of massive type with the maximum tumor diameter (MTD) >2 cm; and 3) there was no large necrosis in the selected lesion region. The exclusion criteria were as follows: 1) patients with contraindication for MRI examination; 2) patients who had serious illness in the heart, brain, liver, or kidney; immune system disease; mental and neurological disorders; or serious internal medicine disease; 3) patients who cannot tolerate breath holding for 15–20 s after respiratory training; 4) pregnant and lactating females; and 5) patients without complete imaging examination data or clear images.
MRI examination
At 1–3 days before TACE, MRI began with routine liver imaging protocol, including axial T1-weighted imaging (T1WI) of dual echo, axial fat-suppressed T2WI (T2WI/FS), coronal T2WI, DWI, DWI at multiple b values, and liver acceleration volume acquisition (LAVA-XA)-enhanced scanning. Specific scanning orders and sequences were as follows: 1) With tri-plane location image, T2 single-shot fast spin-echo (SSFSE) sequence was used once in the scan area (Repetition time/Echo time [TR/TE], 1,000–1,500 ms/80–100 ms; width, 125 Hz; field of view [FOV], 48×48 cm; matrix size, 288×l60; slice thickness/inter-slice gap, 6 mm/3.0 mm); 2) Array spatial sensitivity encoding technique sequence was used to correct scanning image in full coverage of the entire liver once, and the up-and-down scan was beyond the range of the coronal or sagittal plane. FOV center was aligned to anatomic center and frequency encoding direction to the anterior–posterior direction, and scanning time tried to start at the end of breath, namely, the beginning of breath-hold when the breath-hold line was horizontal. Breath-hold fast spoiled gradient-echo sequence was as follows: TR/TE, 150 ms/2.1 ms; FOV, consistent with planar location image; and slice thickness/inter-slice gap, 1.0 mm/0 mm; 3) Axial breath-hold TIWI dual-echo sequence was used: gradient-recalled echo in two-dimensional mode; TR/TE, 250 ms/2.9 ms; FOV, 34–38 cm; slice thickness/inter-slice gap, 6.0 mm/0.6 mm; width, 84.3 Hz; frequency direction, R/L; matrix size, 288×192; number of excitation (NEX), 1; and scanning time, 16–22 s; 4) Axial breath-hold fat-saturated fast recovery fast spin-echo/T2WI sequence was carried out (TR/TE, 6,000–7,000 ms/100–130 ms; width, 31.25–62.5 Hz; FOV, 34–38 cm; echo train length [ETL], 17–20; section thickness/inter-slice gap, 6.0 mm/0.6 mm; matrix size, 288×224; NEX, 2; and scanning slice, 20–24); 5) Axial T2WI sequence was as follows: TR/TE, 6,000–7,000 ms/100–130 ms; ETL, 17–20; width, 31.25–62.5 Hz; FOV, 34–38 cm; slice thickness/inter-slice gap, 6.0 mm/0.6 mm; matrix size, 224×288; NEX, 2; and scanning slice, 20–24; 6) Axial breath-hold DWI sequence: with echo-planar imaging, SSFSE sequence was conducted at b values of 800 s/mm2 and 0 s/mm2 when gradients were applied in all the three orthogonal directions (TR/TE, 2,500 ms/65 ms; slice thickness/inter-slice gap, 6.0 mm/2.0 mm; FOV, 34–38 cm; matrix size, 128×128; NEX, 2; scanning time, 20–24 s; location parameter and T2WI parameter to ensure the consistency of the image); and 7) Intravoxel incoherent motion (IVIM) sequence: namely, axial DWI sequence at multiple b values. T2-SSFSW DWI was performed using nine different b values (1,000, 800, 600, 400, 200, 100, 50, 20, and 0 s/mm2) with DWI sequence (TR/TE, 6,000 ms/57.9 ms; matrix size, 128×160; FOV, 36×36 cm–40×40 cm; slice thickness/inter-slice gap, 5 mm/0.5 mm; scanning slice, 20–24).
PWI consisted of LAVA-XA sequence, which took fast absolute quantification T1 sequence as the foundation and lesion at the maximum level as the center (scan slice, 16–20; scanning time, 6–10 s [namely, one time phase]; TR/TE, 2.9 ms/1.3 ms; slice thickness, 4.2 mm; matrix size, 224×224; FOV, 36–42 cm ×36–42 cm). After matrix size was reconstructed into 512×512, images were acquired at flip angles of 3°, 6°, 9°, 10°, and 12° successively. Dynamic enhanced sequence was the same as T1 quantification sequence in terms of range and scanning parameters (flip angle, 12°; width, 83.3 kHz; NEX, 0.75; acquisition time, 6–10 s). With an injection of contrast agent (Schering Pharmaceutical Ltd., Berlin, Germany) at 3 mL/s in 0.1 mmol/kg (gross volume <20 mL), another dose of meglumine gadopentetate was injected, followed by a 20 mL saline flush at 3 mL/s. After 10–12 s, scanning began (once every 10 s; every time two phases; total scan phase, 12; scanning time, 122–182 s). Each scan was carried out as soon as the patients held their breath at the end of expiration to ensure the breath-holding position was at the same level. When the breath baseline in the detector was stable and the end-expiratory baseline was maintained at the same level, scanning covered the entire liver.
Image processing and data analysis
All multi-b values and DWI images were transferred to a dedicated workstation (Advantage Windows 4.5; GE Healthcare, Milwaukee, WI, USA), and image classification was performed by using machine-assisted detection and classification (MADC) software (GE Medical Systems, Milwaukee, WI, USA) and ADC software (GE Medical Systems, Milwaukee, WI, USA). With double-exponential nonlinear model calculation, MADC software was used to generate pseudo-color parameter diagram, including slow ADC (Dslow), fast ADC (Dfast), and fraction of fast ADC (f). Here, each parameter was measured three times for the average value, and the average values were recorded. Single-exponential linear model was performed to calculate ADC, which was generated into a pseudo-color parameter diagram using the ADC software.
All PWI data were uploaded into a workstation (Advantage Windows 4.5), followed by an analysis and process in Cine Tool perfusion analysis software (GE Medical Systems, Milwaukee, WI, USA), and then all PWI data were analyzed by pharmacokinetics two-compartment model (Tofts model). With T1 calibration to tissues, the quantitative analysis was conducted, and in the meantime, pseudo-color parameter diagram was generated, including rate constant of backflux (Kep), transfer constant of vessel at the maximum level (Ktrans), and extravascular space fractional volume (Ve).
TACE
The arterial system of all patients was accessed using the Seldinger technique under the guide of DSA device (GE Medical Systems). Angiography of the abdominal aorta was performed by femoral artery puncture and catheter to determine the general distribution of the tumor-feeding arteries. Next, hepatic artery angiography was carried out by a catheter advancing into proper hepatic artery or arterial branches to observe the staining of tumor, which further confirmed the diagnosis and identified the tumor-feeding arteries through selectively accessing the catheter into the feeding artery as far as possible. An emulsion consisting of mitomycin (6 mg), adriamycin (20 mg), cisplatin (60 mg), and lipiodol (5–25 mL) was delivered in each patient through the catheter for embolization. After surgery, the catheters were pulled out, followed by local compression and pressure bandaging. Embolization was considered successful when angiography showed that the tumor-feeding artery was basically blocked, that the staining practically disappeared, and that lipiodol was well accumulated in lesions.
Efficacy evaluation
During the first follow-up visit at 1 month after TACE, all patients were re-examined by T1WI/T2WI, DWI, and PWI. The therapeutic efficacy of TACE was evaluated by two experienced radiologists according to MRI images; the two radiologists discussed for a final decision in case of different opinions. The specific judgment criteria were as follows: 1) Lesions showed as low signal at T1WI and high signal at T2WI tend to be determined as tumor residue or recurrence; 2) Before TACE, enhanced lesion was in the arterial phase by enhanced MRI scan. If there is no enhancement in the arterial phase by post-therapeutic enhanced scan, this region tends to be determined as tumor necrosis and vice versa tumor residue or recurrence; and 3) There was no obvious enhanced lesion in the arterial phase by enhanced MRI scan before TACE. If tumor grows or is enhanced in the portal vein phase and equilibrium phase by post-therapeutic enhanced MRI scan, it tends to be determined as tumor residue or recurrence and vice versa tumor necrosis. Efficacy was evaluated according to modified Response Evaluation Criteria in Solid Tumors (mRECIST) 1.1:12 1) complete response (CR) means that all targets show no obvious enhancement in the arterial phase; 2) partial response (PR) refers to a reduction (≥30%) in the total diameter of the survived target lesion (with enhancement in the arterial phase); 3) stable disease (SD) means that changes in enhancement of the maximum diameter in the arterial phase are between PR and progressive disease (PD); 4) PD means that the total diameter of the survived target lesion is ≥20% or that a new lesion appeared. Based on mRECIST 1.1, SD + PD cases were regarded as the ineffective group (including local recurrence of tumor, intra-hepatic metastasis, or distant metastasis) and CR + PR cases were considered as the effective group.
|

Statistical analysis
All data were analyzed by Statistical Package for the Social Sciences 20.0 software (IBM Corporation, Armonk, NY, USA). Continuous data were expressed as mean ± standard deviation (StD), and the comparison between two groups was conducted by independent t-test and paired t-test. Categorical data were expressed as a percentage and compared with the chi-square test or Fisher’s exact test. Receiver operating characteristic (ROC) curve was drawn to assess the diagnostic power of quantitative DWI and PWI parameters in evaluating the efficacy of TACE for HCC. A two-tailed P-value of <0.05 was considered as statistically significant.
Results
Baseline characteristics of HCC patients
Before TACE, 37 lesions were located in the left lobe of liver, 74 lesions in the right, and seven lesions at the junction. All HCC lesions were massive type or nodular type and in circular or quasi-circular shape. The MTD was 2.2–13.9 cm, and the median value was 6.4 mm. The ROI area of lesion at the maximum level was 228–3,561 mm2, and the median value was 1,727 mm2.
After TACE, there were 17 cases (14.4%) with CR, 50 cases (42.4%) with PR, 28 cases (23.7%) with SD, and 23 cases (19.5%) with PD. There were 67 patients in the effective group (CR + PR) and 51 patients in the ineffective group (SD + PD). As shown in Table 1, there were no significant differences in age, gender, AFP levels, and nodular types between the effective and ineffective groups (all P>0.05). However, significant differences were found in pathological types, tumor–node–metastasis stage, tumor regression rate, history of liver disease, positive HBsAg, and history of cirrhosis between the effective and ineffective groups (all P<0.05).
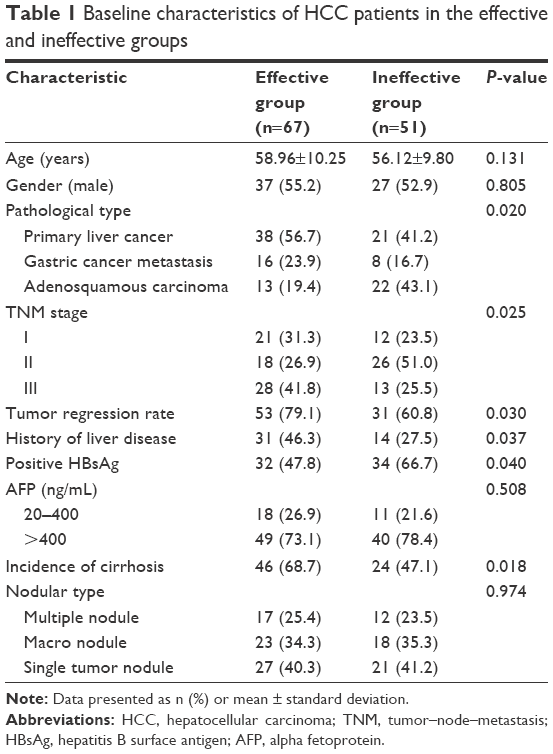 | Table 1 Baseline characteristics of HCC patients in the effective and ineffective groups |
Comparisons of quantitative DWI and PWI parameters of HCC patients in the effective and ineffective groups
Before TACE, there were significant differences in MTD, ADC, Dslow, Dfast, Ktrans, and Kep between the effective and ineffective groups (all P<0.05). After TACE, the effective group exhibited lower MTD, Dfast, and Kep and higher ADC and Dslow than the ineffective group (all P<0.05; Table 2 and Figure 1).
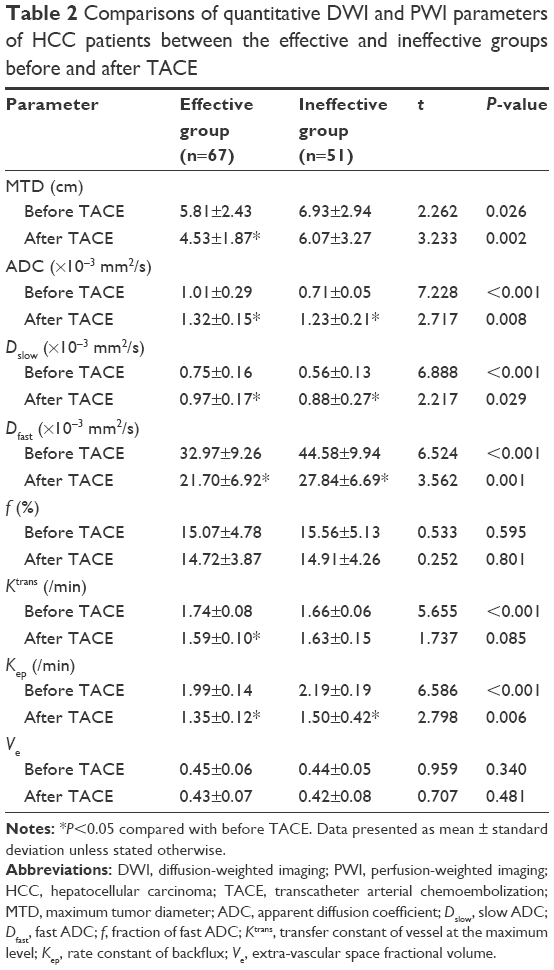 | Table 2 Comparisons of quantitative DWI and PWI parameters of HCC patients between the effective and ineffective groups before and after TACE |
 | Figure 1 DWI and PWI images of a 58-year old male patient with HCC in the effective group before and after TACE. |
Comparisons of quantitative DWI and PWI parameters of HCC patients with different pathological types before and after TACE
Compared with the ineffective group, patients with primary liver cancer in the effective group showed decreases in Dfast and Kep and increases in ADC, Dslow, and Ktrans before TACE (all P<0.05), but MTD, Dfast, and Kep decreased after TACE (all P<0.05). In comparison to the ineffective group, patients with gastric cancer metastasis in the effective group showed decreases in Dfast and Kep and increases in ADC, Dslow, and Ktrans before TACE (all P<0.05), but Kep decreased and ADC increased after TACE (all P<0.05). Furthermore, patients with adenosquamous carcinoma in the effective group had lower Dfast and Kep and higher ADC, Dslow, and Ktrans than those in the ineffective group before TACE (all P<0.05), but the effective group exhibited higher ADC than the ineffective group after TACE (P<0.05). Compared with before TACE, ADC and Dslow significantly increased and Dfast, Ktrans, and Kep decreased after TACE in patients with primary liver cancer, gastric cancer metastasis, and adenosquamous carcinoma in the effective group (all P<0.05), while ADC and Dslow significantly increased but Dfast and Kep decreased after TACE (all P<0.05; Table 3).
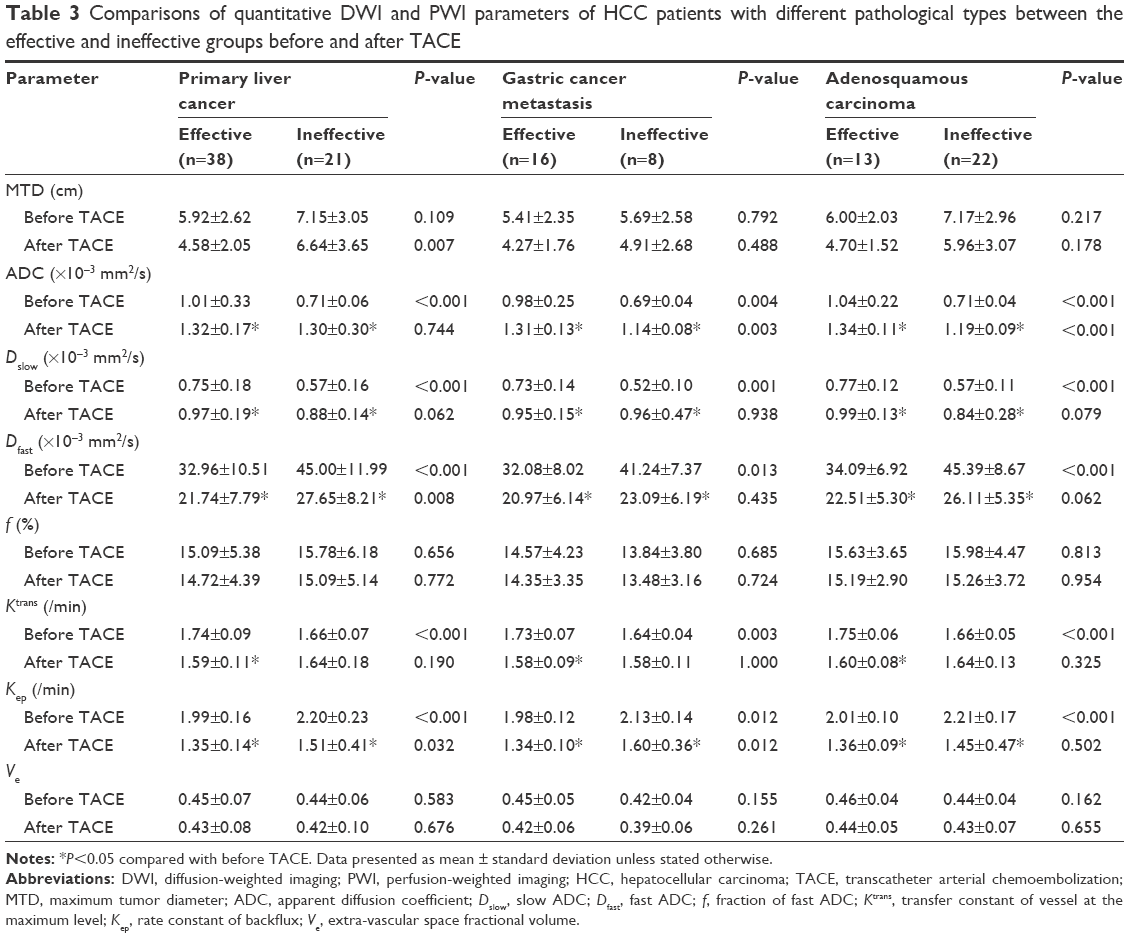 | Table 3 Comparisons of quantitative DWI and PWI parameters of HCC patients with different pathological types between the effective and ineffective groups before and after TACE |
Correlations of quantitative DWI and PWI parameters with tumor regression rate after TACE
As shown in Table 4, tumor regression rate negatively correlated with MTD, Ktrans, Kep, and Dfast but positively correlated with ADC and Dslow (all P<0.05).
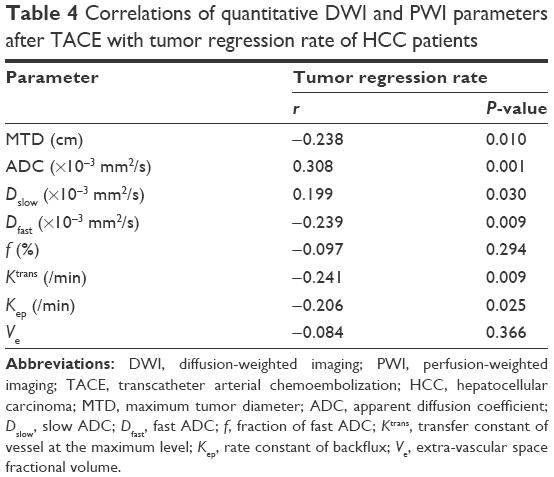 | Table 4 Correlations of quantitative DWI and PWI parameters after TACE with tumor regression rate of HCC patients |
Diagnostic power of quantitative DWI and PWI parameters in evaluating the efficacy of TACE for HCC
As shown in Table 5, ROC curve analysis suggested that the area under the curve of ADC, Dslow, Dfast, Ktrans, and Kep were 0.869, 0.833, 0.812, 0.802, and 0.809, respectively (Figure 2).
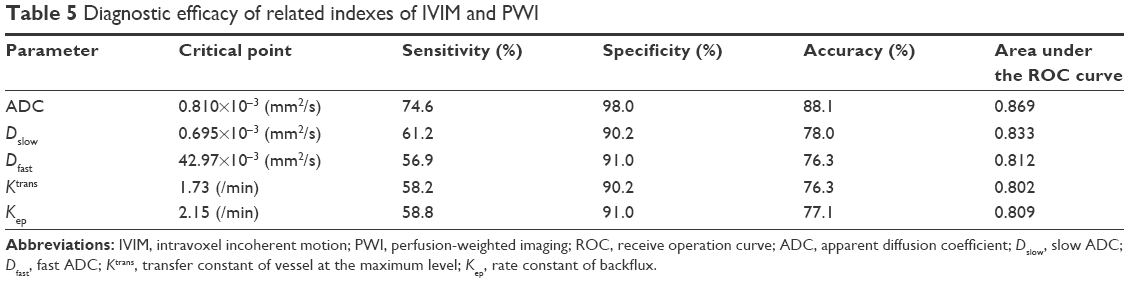 | Table 5 Diagnostic efficacy of related indexes of IVIM and PWI |
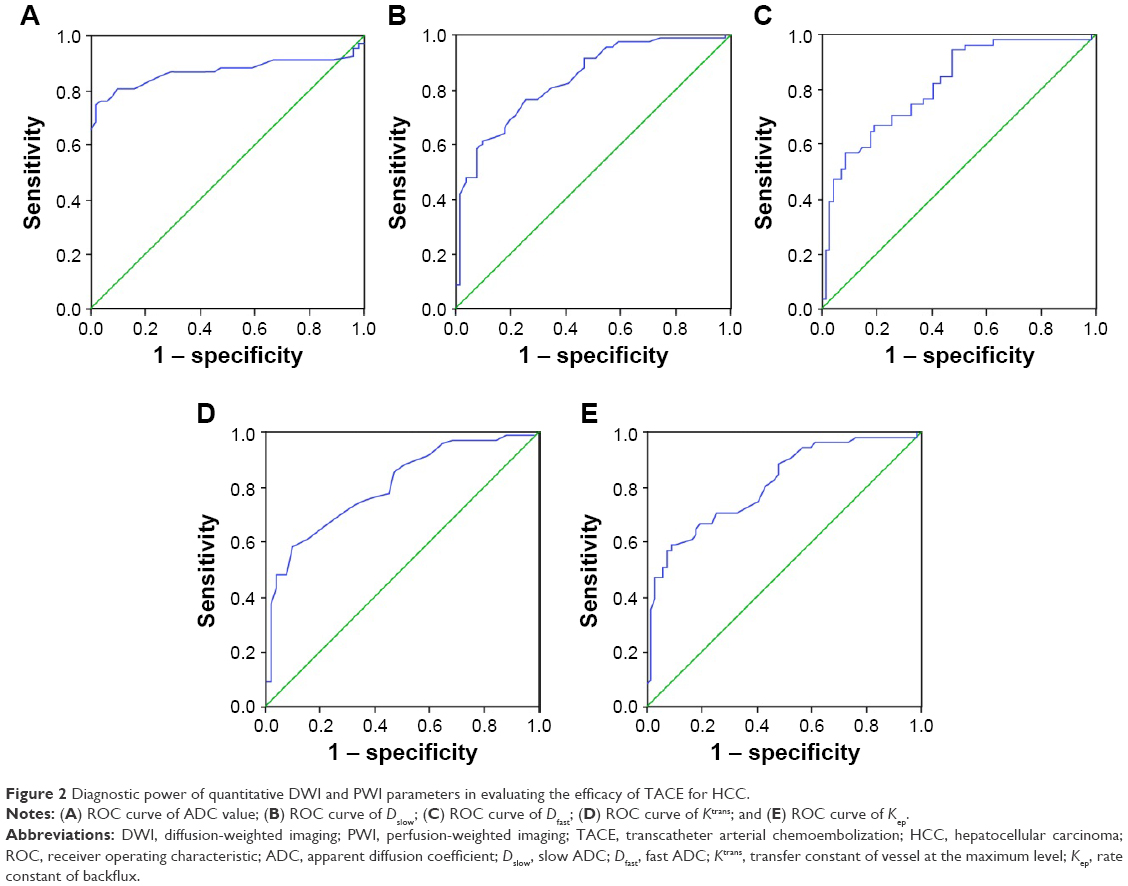 | Figure 2 Diagnostic power of quantitative DWI and PWI parameters in evaluating the efficacy of TACE for HCC. |
Discussion
TACE provides the benefit of inducing ischemic tumor necrosis and minimizing damage to normal liver parenchyma and has become the first choice of non-surgical treatment for HCC.13,14 In recent years, accumulating attention has been given to MRI to evaluate the effects of interventional therapy for HCC,15 especially the combination of DWI and PWI in the therapeutic evaluation of TACE. Therefore, this study aimed to explore the values of quantitative DWI and PWI parameters in predicting the efficacy of TACE for HCC patients. This study demonstrated that after TACE, MTD, Dfast, and Kep decreased, while ADC, Dslow, and Ktrans increased in the effective group compared with those in the ineffective group. Moreover, there was an evident decrease in MTD, Dfast, Ktrans, and Kep in the effective group as well as Dfast and Kep in the ineffective group after TACE. Here, Dslow and Dfast were calculated by dual exponential model based on the IVIM theory, which mainly reflected micro-vascular flow properties and effects of perfusion and diffusion.16 In this study, Dslow value was increased in the effective group after TACE, which was consistent with the results that Hauser et al17 found, that is, Dslow value of chemotherapy responsive tumor was increased after therapy, suggesting that necrosis induced the decrease in the tumor cell density so as to reduce the MTD value. Similarly, Park et al18 agreed that Dfast was higher in well-supplied tumor and reported that Dfast of patients with HCC decreased after treatment with TACE as well. Ktrans refers to the velocity of intravascular contrast agent transferring to the extracellular matrix, which is a reflection of tumor blood flow, vascular surface area, vascular permeability, concentration and flow of contrast agent, and extracellular volume. Kep means the velocity of the contrast agent flowing back from the extracellular matrix to the blood vessel, which plays a crucial role in the efflux rate of the contrast agent in the extracellular matrix back to the blood vessel.19 According to the research of Jarnagin et al,20 after patients with HCC were treated with TACE, both Ktrans and Kep decreased, indicating that MRI quantitative parameters could predict treatment outcome. ADC values can evaluate tumor activity, mainly because the intact tumor cell membrane in the growing period restricts the water molecular activity, which contributes to decreased ADC value, and the increased permeability of the tumor cell membrane caused by tumor necrosis frees water molecule diffusion, which contributes to the higher ADC value.8 In this study, ADC values were higher in the effective group than in the ineffective group, suggesting that TACE treatment induced tumor necrosis.
Additionally, our study demonstrated that tumor regression rate negatively correlated with MTD, Ktrans, Kep, and Dfast but positively correlated with ADC value and Dslow. Since tumor neovascularization is an important index to evaluate tumor type, growth, and metastasis,21 TACE induces tumor necrosis by blocking the blood supply for lesion with an embolic agent.22 As shown in the MRI parameters, MTD, Ktrans, and Kep decreased, while the ADC value increased.23 Furthermore, the results of ROC curve analysis showed that quantitative DWI and PWI parameters, as critical values, were valuable to predict the treatment response of TACE for HCC. A previous study in patients with HCC treated with TACE reported that the ADC value of poor-response patients was lower than that in the good-response patients and that pre-therapeutic ADC values were lower than post-therapeutic values in both poor- and good-response patients, indicating that the ADC value could be used as a crucial index to evaluate the therapeutic efficacy of TACE in the treatment of HCC.24 Braren et al25 demonstrated that ADC, Ktrans, and Ve were all increased, which confirmed the values of DWI combined with PWI in predicting the therapeutic efficacy of TACE in the treatment of HCC.
Conclusion
These results suggest that quantitative DWI and PWI parameters might be useful in evaluating the efficacy of TACE in the treatment of HCC patients. This study has several limitations. We had only included a limited number of patients and did not make the long-term follow-up visits for post-therapeutic treatment response. Except for several shortcomings, the combination of DWI and PWI offers a different angle to evaluate therapeutic efficacy of TACE accurately in all directions, which provides the basis for early clinical diagnosis and helps for making a clinical treatment plan of HCC in a precise and detailed way.
Acknowledgment
The authors would like to give their sincere appreciation to the reviewers for their helpful comments on this article.
Disclosure
The authors report no conflicts of interest in this work.
References
Jemal A, Bray F, Center MM, Ferlay J, Ward E, Forman D. Global cancer statistics. CA Cancer J Clin. 2011;61(2):69–90. | ||
Chen JG, Chen WQ, Zhang SW, Zheng RS, Zhu J, Zhang YH. [Incidence and mortality of liver cancer in China: an analysis on data from the National Registration System between 2003 and 2007]. Zhonghua Liu Xing Bing Xue Za Zhi. 2012;33(6):547–553. | ||
Pascual S, Herrera I, Irurzun J. New advances in hepatocellular carcinoma. World J Hepatol. 2016;8(9):421–438. | ||
Song DS, Nam SW, Bae SH, et al. Outcome of transarterial chemoembolization-based multi-modal treatment in patients with unresectable hepatocellular carcinoma. World J Gastroenterol. 2015;21(8):2395–2404. | ||
Roccarina D, Garcovich M, Ainora ME, et al. Usefulness of contrast enhanced ultrasound in monitoring therapeutic response after hepatocellular carcinoma treatment. World J Hepatol. 2015;7(14):1866–1874. | ||
Schutte K, Schulz C, Malfertheiner P. Hepatocellular carcinoma: current concepts in diagnosis, staging and treatment. Gastrointest Tumors. 2014;1(2):84–92. | ||
Luypaert R, Boujraf S, Sourbron S, Osteaux M. Diffusion and perfusion MRI: basic physics. Eur J Radiol. 2001;38(1):19–27. | ||
Li SP, Padhani AR. Tumor response assessments with diffusion and perfusion MRI. J Magn Reson Imaging. 2012;35(4):745–763. | ||
Schmiedeskamp H, Straka M, Newbould RD, et al. Combined spin- and gradient-echo perfusion-weighted imaging. Magn Reson Med. 2012;68(1):30–40. | ||
Kamel IR, Bluemke DA, Eng J, et al. The role of functional MR imaging in the assessment of tumor response after chemoembolization in patients with hepatocellular carcinoma. J Vasc Interv Radiol. 2006;17(3):505–512. | ||
Chen X, Xiao E, Shu D, et al. Evaluating the therapeutic effect of hepatocellular carcinoma treated with transcatheter arterial chemoembolization by magnetic resonance perfusion imaging. Eur J Gastroenterol Hepatol. 2014;26(1):109–113. | ||
Kasper B, Gruenwald V, Reichardt P, Bauer S, Hohenberger P, Haller F. Correlation of CTNNB1 mutation status with progression arrest rate in RECIST progressive desmoid-type fibromatosis treated with imatinib: translational research results from a phase 2 study of the German Interdisciplinary Sarcoma Group (GISG-01). Ann Surg Oncol. 2016;23(6):1924–1927. | ||
Shin SW. The current practice of transarterial chemoembolization for the treatment of hepatocellular carcinoma. Korean J Radiol. 2009;10(5):425–434. | ||
Wiggermann P, Sieron D, Brosche C, et al. Transarterial Chemoembolization of Child-A hepatocellular carcinoma: drug-eluting bead TACE (DEB TACE) vs. TACE with cisplatin/lipiodol (cTACE). Med Sci Monit. 2011;17(4):CR189–CR195. | ||
Kalb B, Chamsuddin A, Nazzal L, Sharma P, Martin DR. Chemoembolization follow-up of hepatocellular carcinoma with MR imaging: usefulness of evaluating enhancement features on one-month posttherapy MR imaging for predicting residual disease. J Vasc Interv Radiol. 2010;21(9):1396–1404. | ||
Cho GY, Kim S, Jensen JH, Storey P, Sodickson DK, Sigmund EE. A versatile flow phantom for intravoxel incoherent motion MRI. Magn Reson Med. 2012;67(6):1710–1720. | ||
Hauser T, Essig M, Jensen A, et al. Characterization and therapy monitoring of head and neck carcinomas using diffusion-imaging-based intravoxel incoherent motion parameters-preliminary results. Neuroradiology. 2013;55(5):527–536. | ||
Park YS, Lee CH, Kim JH, et al. Using intravoxel incoherent motion (IVIM) MR imaging to predict lipiodol uptake in patients with hepatocellular carcinoma following transcatheter arterial chemoembolization: a preliminary result. Magn Reson Imaging. 2014;32(6):638–646. | ||
Kim KA, Park MS, Ji HJ, et al. Diffusion and perfusion MRI prediction of progression-free survival in patients with hepatocellular carcinoma treated with concurrent chemoradiotherapy. J Magn Reson Imaging. 2014;39(2):286–292. | ||
Jarnagin WR, Schwartz LH, Gultekin DH, et al. Regional chemotherapy for unresectable primary liver cancer: results of a phase II clinical trial and assessment of DCE-MRI as a biomarker of survival. Ann Oncol. 2009;20(9):1589–1595. | ||
Brannigan M, Burns PN, Wilson SR. Blood flow patterns in focal liver lesions at microbubble-enhanced US. Radiographics. 2004;24(4):921–935. | ||
Guan YS, Hu Y, Liu Y. Multidetector-row computed tomography in the management of hepatocellular carcinoma with transcatheter arterial chemoembolization. J Gastroenterol Hepatol. 2006;21(6):941–946. | ||
Kim H, Keene KS, Sarver DB, et al. Quantitative perfusion- and diffusion-weighted magnetic resonance imaging of gastrointestinal cancers treated with multikinase inhibitors: a pilot study. Gastrointest Cancer Res. 2014;7(3–4):75–81. | ||
Mannelli L, Kim S, Hajdu CH, Babb JS, Taouli B. Serial diffusion-weighted MRI in patients with hepatocellular carcinoma: prediction and assessment of response to transarterial chemoembolization. Preliminary experience. Eur J Radiol. 2013;82(4):577–582. | ||
Braren R, Altomonte J, Settles M, et al. Validation of preclinical multiparametric imaging for prediction of necrosis in hepatocellular carcinoma after embolization. J Hepatol. 2011;55(5):1034–1040. |
 © 2016 The Author(s). This work is published and licensed by Dove Medical Press Limited. The
full terms of this license are available at https://www.dovepress.com/terms
and incorporate the Creative Commons Attribution
- Non Commercial (unported, 3.0) License.
By accessing the work you hereby accept the Terms. Non-commercial uses of the work are permitted
without any further permission from Dove Medical Press Limited, provided the work is properly
attributed. For permission for commercial use of this work, please see paragraphs 4.2 and 5 of our Terms.
© 2016 The Author(s). This work is published and licensed by Dove Medical Press Limited. The
full terms of this license are available at https://www.dovepress.com/terms
and incorporate the Creative Commons Attribution
- Non Commercial (unported, 3.0) License.
By accessing the work you hereby accept the Terms. Non-commercial uses of the work are permitted
without any further permission from Dove Medical Press Limited, provided the work is properly
attributed. For permission for commercial use of this work, please see paragraphs 4.2 and 5 of our Terms.