Back to Journals » International Journal of General Medicine » Volume 14
Predictive Value of Limb Artery Indices and Endothelial Functional Tests for the Degree of Coronary Artery Stenosis in a Diabetic Population
Authors Wang Z ![]() , Chen Y, Lv S
, Chen Y, Lv S ![]() , Sun Z
, Sun Z ![]() , Lu X, Huang L, Li L
, Lu X, Huang L, Li L ![]()
Received 20 April 2021
Accepted for publication 19 May 2021
Published 3 June 2021 Volume 2021:14 Pages 2343—2349
DOI https://doi.org/10.2147/IJGM.S316297
Checked for plagiarism Yes
Review by Single anonymous peer review
Peer reviewer comments 2
Editor who approved publication: Dr Scott Fraser
Zihan Wang,1 Ying Chen,1 Shuying Lv,1 Ziyi Sun,1 Xiaoyan Lu,2 Li Huang,2 Lin Li2
1Beijing University of Chinese Medicine, Beijing, People’s Republic of China; 2Department of Integrative Cardiology, China-Japan Friendship Hospital, Beijing, People’s Republic of China
Correspondence: Lin Li
Department of Integrative Cardiology, China-Japan Friendship Hospital, Beijing, People’s Republic of China
Tel +86-18600285198
Email [email protected]
Objective: To investigate the correlation between limb artery indices (brachial-ankle pulse wave velocity and ankle-brachial index), endothelial function index (FMD value), and the degree of coronary artery stenosis in diabetic patients and analyze their values in predicting the degree of coronary artery stenosis.
Methods: The study included 151 patients with type 2 diabetes mellitus and suspected coronary atherosclerotic heart disease. The patients were divided into “coronary atherosclerotic heart disease” (N=94) and “non-coronary atherosclerotic heart disease” (N=57) groups based on the coronary angiographic findings. Within the coronary atherosclerotic heart disease group, the patients were further divided into “low stenosis” (N=47) and “high stenosis” (N=47) subgroups according to their Gensini score. Indicators such as brachial-ankle pulse wave velocity, ankle-brachial index, and FMD value were measured and correlated with the degree of coronary artery stenosis. Logistic regression models were constructed and receiver operating characteristic curves plotted to assess the predictive ability of limb artery and endothelial functional indices for the degree of coronary artery stenosis.
Results: In a diabetic population, FMD value (P=0.003), ankle-brachial index (P=0.004), and brachial-ankle pulse wave velocity (P=0.003) were different in patients with and without coronary atherosclerotic heart disease. In the population with both diabetes mellitus and coronary atherosclerotic heart disease, the ankle-brachial index and FMD value were both independently associated with the degree of coronary artery stenosis (P=0.003). The area under the receiver operating characteristic curve plotted from the combined coefficients of ankle-brachial index and FMD value was 0.773, which is predictive of coronary artery stenosis in diabetic patients.
Conclusion: Ankle-brachial index and FMD value are indicative of the degree of coronary artery stenosis in diabetic patients, and predictive efficacy can be improved by combining the two tests.
Keywords: type 2 diabetes mellitus, coronary artery stenosis, limb artery testing, vascular endothelial function, clinical predictive model
Introduction
Diabetes is one of the major risk factors for cardiovascular events.1 Vascular health in diabetes patients with coronary atherosclerotic heart disease (CHD) is worse than in patients with CHD alone. They have more complications and more severe target organ damage, and require earlier evaluation and initiation of treatment. Coronary angiography is currently the most effective and reliable method for determining the condition of coronary arteries, and the Gensini score is widely used to quantitatively evaluate the degree of coronary artery stenosis. Meanwhile, relevant vascular functional tests performed outside the body, such as those that assign limb artery index and vascular endothelial function index, have the advantage of being easy to perform, convenient and noninvasive, and studies have confirmed that their index levels correlate with cardiovascular events.2 However, whether they can be used to predict coronary artery stenosis is uncertain. In this report, we analyze the ability of limb artery indices, including brachial-ankle pulse wave velocity (baPWV), ankle-brachial index (ABI) and endothelial function index (brachial artery flow-mediated vasodilatation-FMD value) to predict the degree of coronary artery stenosis, and explore their utility in evaluating the degree of coronary artery stenosis in a diabetic population.
Patients and Methods
Selection Method
A type 2 diabetes population attending the Department of Integrative Cardiology at China-Japan Friendship Hospital from 2019-01 to 2020-01 was retrospectively selected, in which patients with suspected CHD were included in the study. Patients with acute complications of diabetes mellitus, contraindications to coronary angiography, inability to cooperate with arterial vascular examination, combined acute infection, severe cardiac arrhythmia, severe abnormal liver and kidney function, severe diseases of the hematopoietic and endocrine systems, pregnant status, lactating, and those whose data collection was hindered by mental or verbal factors were excluded. After coronary angiography, the patients were diagnosed as “CHD” or “non-CHD”, and the patients with CHD were divided into “low stenosis” and “high stenosis” subgroups according to the calculated Gensini score, with the cutoff point being the median Gensini score of the population in the “CHD” group.
Diagnostic Criteria
Diagnostic Criteria of Diabetes Mellitus
Referring to the “Classification and Diagnosis of Diabetes: Standards of Medical Care in Diabetes-2020” published by the American Diabetes Association,3 patients were diagnosed with type 2 diabetes mellitus after glucose monitoring.
Diagnostic Criteria of CHD
According to the
Nomenclature and criteria for diagnosis of ischemic heart disease. Report of the Joint International Society and Federation of Cardiology/World Health Organization task force on standardization of clinical nomenclature, 4
CHD was diagnosed when coronary angiography showed ≥50% stenosis in at least one coronary artery.
Research Methods
Basic Information
Clinical information was recorded based on the patients’ general condition and included demographic information (sex, age, height, weight, smoking history); comorbidities (hypertension, heart failure, atrial fibrillation); and coronary artery lesions as well as the patients’ main symptoms.
Index Testing
Venous blood was collected from patients who had fasted on the morning of the second day after admission, and glycosylated hemoglobin (HbA1c), hypersensitive C-reactive protein (Hs-CRP), total cholesterol (TC), and low-density lipoprotein cholesterol (LDL-C) were measured in the Department of Laboratory Medicine of China-Japan Friendship Hospital. Echocardiography was then carried out by two independent echocardiographers who measured common parameters, including 2D ultrasound, left ventricular end-diastolic diameter (LVIDd), left ventricular posterior wall thickness (PWTd), and septal thickness (SWTd), according to the DEVEREUX-corrected ventricular mass formula:5 LVM (g)=0.8 × {1.04 [(LVIDd+ PWTd+ SWTd)3- LVIDd 3]}+0.6g, and the body surface area formula: BSA (m2)=0.0061× height (cm) + 0.0128× weight (kg) - 0.1529, calculating the left ventricular mass index (LVMI)=LVM/BSA.
Coronary Angiography
Coronary angiography was performed by a team of skilled cardiologists. When coronary angiography showed at least one coronary artery stenosis ≥50%, the patient was diagnosed as the “CHD” group, and those who did not meet the criteria were designated the “non-CHD” group.
Gensini Score
Using the results of coronary angiography, lesions in different vessels were recorded, and the final Gensini score was calculated according to the “Guide for Gensini Score calculation”.6 For patients diagnosed with CHD, the median Gensini score within the group was counted and used to classify the degree of coronary artery stenosis into “low stenosis” and “high stenosis” subgroups.
Examination of Limb Arteries
An atherosclerosis detector made by OMRON, Japan was used, and basic parameters such as age, sex, height, and weight were entered. The limb arteries of patients were examined before coronary angiography between 0800 and 1000 h after 8–12 h fasting. All vasodilator drugs were stopped on the day of examination. The instrument automatically analyzed and recorded the pulse waveforms of the brachial and anterior tibial arteries, and the blood pressure of the upper and lower extremities bilaterally, and finally reported baPWV and ABI.
Examination of Vascular Endothelial Function
An instrument manufactured by UNEX, Japan, was used for testing vascular endothelial function. Patients were examined before coronary angiography between 0800 and 1000 h after 8–12 h fasting, and all vasodilator drugs were stopped on the same day. The procedure was started with patients in a supine position in a quiet individual room, and were rested for 5 min. Using limb lead electrocardiographic monitoring, the brachial artery was located in the right upper arm, a pressure cuff was placed 5-cm above the transverse elbow stripe, and blood flow was monitored by ultrasound after determining the position of the brachial artery and attaching a probe. Doppler images of flow in the brachial artery were recorded during deflation of the cuff to obtain the FMD value.
Statistical Processing
SPSS 21.0 and MedCalc 19.6.1 software were used for analysis. Normally distributed data were expressed as mean ± standard deviation, non-normal distributions were expressed as median and quartiles, and count data were expressed as percentages. When comparing the sample means of two groups, the independent samples t-test was used for normally distributed data, the rank sum (Kruskal–Wallis H) test was used for non-normally distributed data, and the chi-square test was used for count data. The linear regression equation associated with the main findings of the examinations was firstly constructed with the Gensini score as the dependent variable, and further multifactorial logistic regression analysis was used to determine the correlation between baPWV, ABI, FMD and the degree of coronary artery stenosis. A combined equation was constructed to plot the receiver operating characteristic curve (ROC) of the indices for single and combined indices, calculate the area under the curve (AUC), and compare differences in the sizes of the AUC of each index by the DeLong method. This combined equation was used to evaluate the predictive ability of the tests of limb artery and endothelial function for the degree of coronary artery stenosis in diabetic patients. The maximum value of the coordinates of each point on the ROC curves was taken to obtain the best cutoff point, while the corresponding sensitivity, specificity, positive and negative likelihood ratios were obtained and the Youden index was calculated to indicate the veracity of the model. Finally, each index and joint coefficient was compared with the Gensini score, and Cohen’s kappa coefficient was used to judge consistency. Differences were considered statistically significant when P<0.05. Based on preliminary data collection, sample size was calculated using Power Analysis and Site Size Calculation V.11.0 software. The research was approved by the Ethics Committee for Clinical Research of China-Japan Friendship Hospital (No.2018-59-K43). Our study was conducted in accordance with the Declaration of Helsinki. Patient consents were waived as the study did not collect information regarding patient privacy or identifiable features.
Results
Basic Clinical Information of the Population
As shown in Table 1, there were no differences in overall age, gender, and body mass index between patients with CHD compared with those without CHD, and the proportion of comorbidities with atrial fibrillation and heart failure was similar, and no significant differences were seen in Hs-CRP and HbA1c. Patients with CHD had a greater history of hypertension (P=0.003) and smoking (P=0.018), a higher Gensini score (P<0.01), and a greater LVMI (P=0.019). Notably, TC and LDL-C levels were higher in the non-CHD group (P<0.01), reflecting the fact that patients often lack strict lipid management in the absence of a diagnosis of CHD.
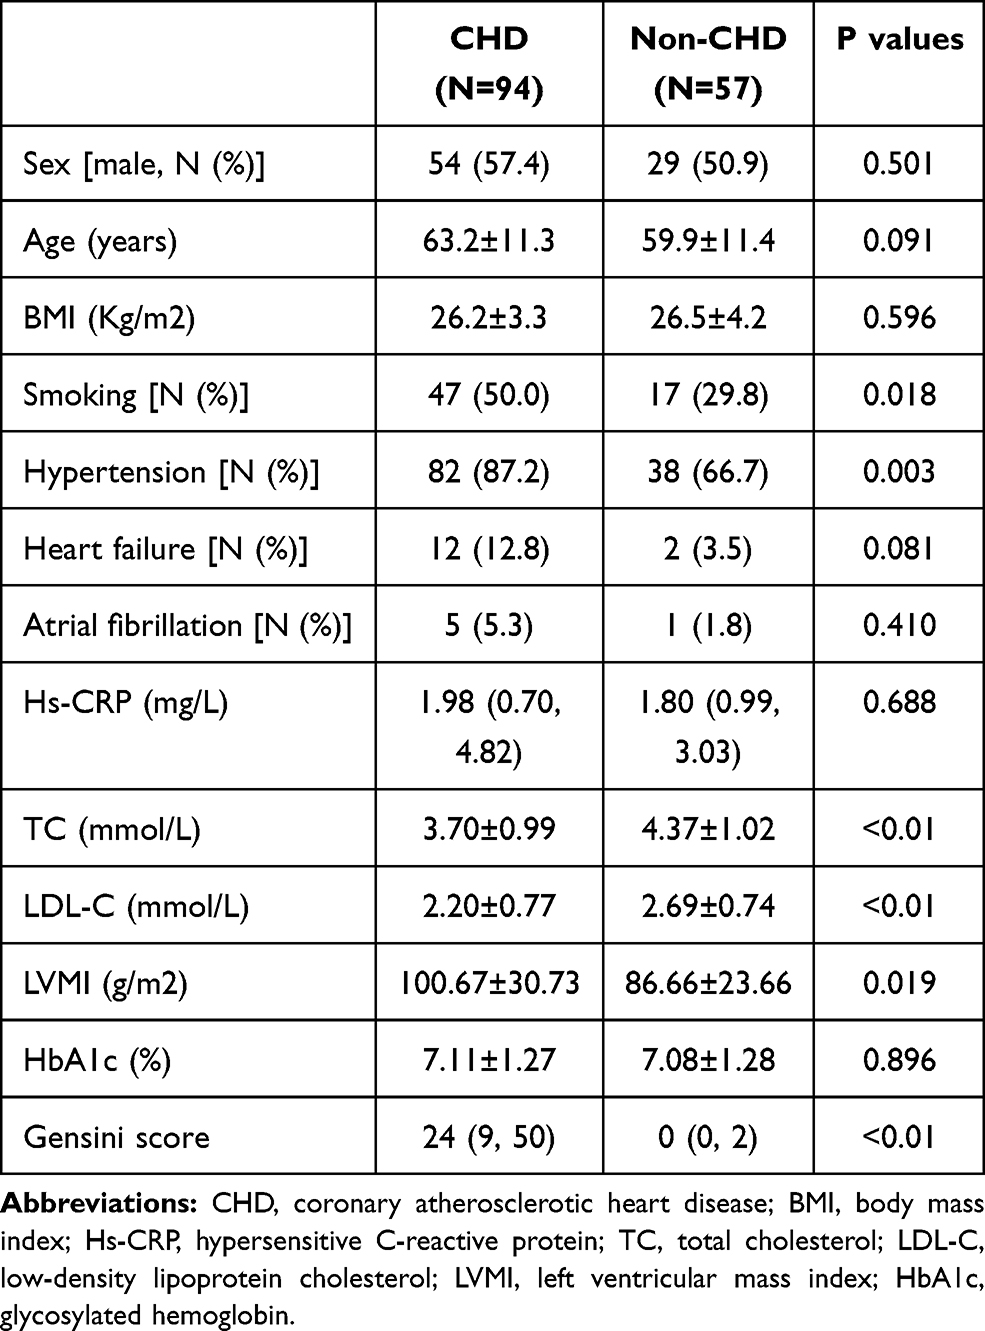 |
Table 1 Basic Clinical Information of the Included Diabetic Patients |
Statistical Analysis of the Main Study Factors
As shown in Table 2, the ABI and FMD values were significantly lower in patients with CHD (P=0.004, P=0.003, respectively), while baPWV was higher in comparison with non-CHD patients (P=0.003). In multifactorial logistic regression with “CHD” as the dependent variable (Table 3), the results indicated that ABI (P=0.019), FMD value (P=0.014), and baPWV (P=0.010) were independently associated with CHD. We further expressed the degree of coronary artery stenosis by the Gensini score and entered the main observed indices as independent variables in a multifactorial linear regression model (Table 4). The model showed that only ABI (P<0.001) and FMD value (P=0.001) were significantly associated with the Gensini score, while baPWV was excluded from the model because of its insignificant association (P=0.275). These results demonstrate that ABI, FMD value, and baPWV are all correlated with CHD, and the first two can more accurately predict the degree of coronary artery stenosis.
 |
Table 2 Comparison of the Main Study Indicators |
 |
Table 3 Multifactorial Logistic Regression with “CHD” as the Dependent Variable |
 |
Table 4 Multifactorial Linear Regression with “Gensini Score” as the Dependent Variable |
Statistical Analysis of the Main Study Indicators Between Subgroups
In patients with CHD, the Gensini score was used to determine the degree of coronary artery stenosis, and a median score of 24 was used as a cutoff point to classify a “high stenosis” subgroup with a Gensini score ≥24 and a “low stenosis” subgroup with a Gensini score <24. As shown in Table 5, analysis of variance revealed significant differences in ABI and FMD value between patients with different degrees of stenosis (P<0.001, P=0.001), while there was no significant variation in baPWV (P=0.188). To exclude interactions between factors, we included ABI, FMD value, and baPWV in a multifactorial logistic regression model with “high stenosis” status as the dependent variable (Table 6), and the results showed that the degree of coronary artery stenosis was independently associated only with ABI and FMD value (P=0.003). Based on this result, a new combined equation was developed: combined coefficient=9.2−16.42×ABI−0.36×FMD value.
 |
Table 5 Comparison of the Main Study Indicators in Patients Within the CHD Group |
 |
Table 6 Multifactorial Logistic Regression with “High Stenosis” as the Dependent Variable |
Predictive Ability of in-vitro Arterial Testing Methods for the Degree of Coronary Artery Stenosis
We further analyzed the predictive ability of the study indices for coronary artery stenosis. Based on the logistic regression equation shown in the previous section, ROC curves were plotted using the ABI, FMD value, and combined coefficient to diagnose coronary artery “high stenosis” based on the AUC for each of the curves as shown in Figure 1. The combined coefficient had the largest area under the curve (AUC=0.773, 95% confidence interval (CI) 0.679–0.867), followed by ABI (AUC=0.715, 95% CI 0.612–0.819), and FMD value (AUC=0.685, 95% CI 0.577–0.793). The AUC of the combined coefficient was significantly greater than that of the FMD value (P=0.03), but when compared with the ABI, the difference was not statistically significant (P=0.20).
 |
Figure 1 ROC curves for the “high stenosis” status of coronary arteries. Green line: FMD, AUC=0.685; Blue line: ABI, AUC=0.715; Red line: Combined coefficient, AUC=0.773; Dotted line: Reference line. |
The best cutoff value was obtained from the ROC curves; the model most accurately predicted “high coronary artery stenosis” in diabetic patients when the FMD value was ≤6.4%, ABI was ≤1.05, or the combined coefficient was ≥1.98. The accuracy of each prediction is shown in Table 7. We previously found that the AUC did not show a significant advantage over the ABI when using the combined coefficient for target status prediction, but the Youden index was calculated to be higher, indicating superior diagnostic effectiveness and veracity using this approach. In addition, the patients’ coronary artery stenosis status as determined by the Gensini score was used to test the consistency of each of the three prediction methods (FMD value, ABI, and combined coefficient). Cohen’s kappa coefficient was found to be highest when the combined coefficient was used to predict the degree of coronary artery stenosis, 0.43 (P<0.001), showing moderate to strong agreement with the Gensini score.
 |
Table 7 Optimal Cutoff Points for Each Examination Method and Their Predictive Abilities for the Degree of Coronary Artery Stenosis |
Discussion
Patients with diabetes often suffer from vascular damage, and CHD increases the risk of cardiovascular events. Timely identification of coronary artery disease is a clinical priority, and observation of arteries from outside the body, such as by carotid ultrasonography,7 can provide some information on the condition of the coronary arteries. Previous studies have reported a correlation between FMD value, ABI, and coronary artery lesions,8,9 with lower values often predicting poor coronary vascular outcomes. In this report, we built on these earlier results to explore the relationship between these arterial tests and the degree of coronary artery stenosis.
Consistent with previous studies, we showed that ABI, FMD value, and baPWV were correlated with the development of CHD: higher baPWV and lower ABI and FMD values are risk factors for CHD. In contrast, baPWV was excluded from further analysis of the correlation between the impact factors and the degree of coronary artery stenosis. Peripheral arterial lesions occur earlier than coronary arterial lesions, and changes in stiffness of these vessels affect the hemodynamics of the cardiovascular system. In the early stages of coronary artery stenosis, elasticity of peripheral arteries is more variable, and in-vitro tests are accurate. However, in the later stages of the disease when severe stenosis of coronary arteries occurs and peripheral arteries have long been severely sclerotic, the accuracy of some in-vitro tests is reduced. The baPWV method measures elasticity of peripheral arteries using a pulse wave signal, which appears to rise early in the course of the disease before the onset of coronary artery stenosis.10 However, as peripheral atherosclerosis progresses, there are smaller changes in the pulse wave, and as a result the accuracy of baPWV detection decreases in the later stages of coronary artery stenosis. These effects suggest that baPWV can predict the presence of CHD only in early stages of the disease. In contrast, FMD value and ABI are measurements of diastolic function and blood pressure ratio of blood vessels,11 and the degree of atherosclerosis has less effect on the accuracy of those indices, resulting in a more accurate assessment of coronary artery stenosis. On the other hand, according to the recommendations of the American Heart Association, ABI is usually judged as abnormal when ≤0.9,12 although our result was higher due to the poor vascular condition of the diabetic patients. This suggests that we need stricter control intervals for ABI in specific populations, and that some diabetic patients with seemingly normal test results should be screened early to facilitate timely treatment of vasculopathy.
Our study investigated the association of FMD and ABI with CHD and coronary artery stenosis in a diabetic population; additionally, we plotted the ROC curves of FMD value combined with ABI as a means of evaluating the value of both tests in predicting coronary artery stenosis in the diabetic population. Compared with previous studies, this study had more targeted data, a larger sample size, and included diabetic non-CHD patients as a control group. We selected the best predictor based on ROC curves, showing that FMD value and ABI can be used alone or in combination as predictors of the degree of coronary artery stenosis. The combination was superior, yielding sensitivity and specificity of 70.2% and 74.5%, respectively, with good predictive fidelity and high agreement with the traditional gold standard indicator, the Gensini score. If other biomarkers indicative of vascular function, such as the level of nitric oxide, are introduced on this basis, the predictive value of the model might be further improved.
Of course, our study has some limitations, including enrollment of patients from only one hospital and mostly from the same city, which may have introduced bias into the clinical data. The study involved more than 150 diabetic patients, and although the sample size was large, sampling error could not be eliminated, and a series of prospective multicenter studies would be needed to further support the potential clinical use of FMD value and ABI for predicting the degree of coronary artery stenosis.
Conclusion
We conducted a retrospective study to explore the use of indices of limb artery and endothelial function to predict the degree of coronary artery stenosis in diabetic patients. In the diabetic population, ABI, FMD value, and baPWV showed good predictive power for the diagnosis of CHD. A more detailed analysis revealed significant differences in FMD value and ABI in patients with highly stenotic coronary arteries when compared with those exhibiting either little stenosis or no CHD, with lower levels of FMD value and ABI being predictive of greater coronary artery stenosis. We believe that the results of this study increase our understanding of limb artery and endothelial functional indices, and the in vitro tests described herein are predictive of coronary artery stenosis in diabetic patients in the clinical setting.
Funding
This research received funding from the Beijing Municipal Commission of Health and Family Planning, Capital Health Development Scientific Research Project (NO. 2018–2-4063).
Disclosure
The authors report no conflicts of interest in this work.
References
1. Goodarzi MO, Rotter JI. Genetics insights in the relationship between type 2 diabetes and coronary heart disease. Circ Res. 2020;126(11):1526–1548. doi:10.1161/CIRCRESAHA.119.316065
2. Naka KK, Papathanassiou K, Bechlioulis A, et al. Association of vascular indices with novel circulating biomarkers as prognostic factors for cardiovascular complications in patients with type 2 diabetes mellitus. Clin Biochem. 2018;53:31–37. doi:10.1016/j.clinbiochem.2017.12.010
3. American Diabetes Association. 2. Classification and Diagnosis of Diabetes: standards of Medical Care in Diabetes-2020. Diabetes Care. 2020;43(Suppl1):S14–S31. doi:10.2337/dc20-S002
4. Bernard R, Corday E, Eliasch H, et al. Nomenclature and criteria for diagnosis of ischemic heart disease. Report of the Joint International Society and Federation of Cardiology/World Health Organization task force on standardization of clinical nomenclature. Circulation. 1979;59(3):607–609. doi:10.1161/01.CIR.59.3.607
5. Devereux RB, Alonso DR, Lutas EM, et al. Echocardiographic assessment of left ventricular hypertrophy: comparison to necropsy findings. Am J Cardiol. 1986;57(6):450–458. doi:10.1016/0002-9149(86)90771-X
6. Rampidis GP, Benetos G, Benz DC, et al. A guide for Gensini Score calculation. Atherosclerosis. 2019;287:181–183. doi:10.1016/j.atherosclerosis.2019.05.012
7. Wang L, He X. The relationship between the carotid and coronary artery stenosis: a study based on angiography. Neurol Res. 2019;41(8):722–727. doi:10.1080/01616412.2019.1609165
8. Joseph TP, Kotecha NS, Kumar HBC, et al. Coronary artery calcification, carotid intima-media thickness and cardiac dysfunction in young adults with type 2 diabetes mellitus. J Diabetes Complications. 2020;34(8):107609. doi:10.1016/j.jdiacomp.2020.107609
9. Bryniarski KL, Tokarek T, Bryk T, et al. Intima-media thickness and ankle-brachial index are correlated with the extent of coronary artery disease measured by the SYNTAX score. Postepy Kardiol Interwencyjnej. 2018;14(1):52–58. doi:10.5114/aic.2018.74355
10. Wu S, Jin C, Li S, et al. Aging, Arterial stiffness, and Blood Pressure Association in Chinese Adults. Hypertension. 2019;73(4):893–899. doi:10.1161/HYPERTENSIONAHA.118.12396
11. Thurston B, Dawson J. Ankle Brachial pressure index: an update for the vascular specialist and general practitioner. Vascular. 2019;27(5):560–570. doi:10.1177/1708538119842395
12. Aboyans V, Criqui MH, Abraham P, et al. Measurement and interpretation of the ankle-brachial index: a scientific statement from the American Heart Association. Circulation. 2012;126(24):2890–2909. doi:10.1161/CIR.0b013e318276fbcb
 © 2021 The Author(s). This work is published and licensed by Dove Medical Press Limited. The
full terms of this license are available at https://www.dovepress.com/terms
and incorporate the Creative Commons Attribution
- Non Commercial (unported, 3.0) License.
By accessing the work you hereby accept the Terms. Non-commercial uses of the work are permitted
without any further permission from Dove Medical Press Limited, provided the work is properly
attributed. For permission for commercial use of this work, please see paragraphs 4.2 and 5 of our Terms.
© 2021 The Author(s). This work is published and licensed by Dove Medical Press Limited. The
full terms of this license are available at https://www.dovepress.com/terms
and incorporate the Creative Commons Attribution
- Non Commercial (unported, 3.0) License.
By accessing the work you hereby accept the Terms. Non-commercial uses of the work are permitted
without any further permission from Dove Medical Press Limited, provided the work is properly
attributed. For permission for commercial use of this work, please see paragraphs 4.2 and 5 of our Terms.