Back to Journals » OncoTargets and Therapy » Volume 10
Predictive value of interim PET/CT visual interpretation in the prognosis of patients with aggressive non-Hodgkin’s lymphoma
Authors Liao CC, Qin YY, Tan XH, Hu JJ, Tang Q, Rong Y, Cen H, Li LQ
Received 24 October 2017
Accepted for publication 9 November 2017
Published 30 November 2017 Volume 2017:10 Pages 5727—5738
DOI https://doi.org/10.2147/OTT.S154995
Checked for plagiarism Yes
Review by Single anonymous peer review
Peer reviewer comments 2
Editor who approved publication: Dr William C. Cho
Cheng-Cheng Liao,1,* Yun-Ying Qin,2,* Xiao-Hong Tan,1 Jia-Jie Hu,3 Qi Tang,2 Yan Rong,1 Hong Cen,1 Le-Qun Li4,5
1Department of Chemotherapy, 2Department of Radiology, Affiliated Tumor Hospital of Guangxi Medical University, 3Department of the Communist Youth League, Basic Medical College of Guangxi Medical University, 4Department of Hepatobiliary Surgery, Affiliated Tumor Hospital of Guangxi Medical University, 5Department of Liver Cancer Treatment, Guangxi Liver Cancer Diagnosis and Treatment Engineering and Technology Research Center, Nanning, People’s Republic of China
*These authors contributed equally to this work
Objective: The objective of the study was to evaluate the prognostic value of positron emission tomography (PET)/computed tomography (CT) visual interpretation in patients with aggressive non-Hodgkin’s lymphoma (NHL) using a meta-analysis and systematic review.
Methods: Using the PubMed, Embase, and Web of Science databases, we performed a systematic review of the use of visual evaluation mid-chemotherapy to evaluate the prognosis of aggressive NHL in studies published up to May 2017. Prospective and retrospective studies assessing progression-free survival (PFS) and overall survival (OS) were included. We used hazard ratio (HR) to determine the value of Deauville criteria and International Harmonization Project (IHP) criteria for measuring survival. Subgroup analysis was performed based on the number of chemotherapy cycles before the mid-term evaluation as well as the visual evaluation method.
Results: A total of 11 studies were included. PFS (HR =2.93, 95% confidence interval [CI]: 2.93–3.90, p<0.0001) and OS (HR =2.55, 95% CI: 1.76–3.68, p<0.0001) of PET/CT-positive patients were significantly lower when determined by the visual method. In subgroup analysis, IHP, Deauville criteria, and having no standard interpretation groups were factors able to predict PFS; IHP and having no standard interpretation group were able to predict OS. With PET/CT, IHP, and Deauville 5-point criteria, the PFS of patients receiving 2–4 cycles of chemotherapy before PET/CT was significantly lower than that of PET/CT-negative patients. No significant difference in OS was observed when patients received 3 or fewer cycles of chemotherapy before PET/CT, though OS was significantly lower in patients receiving more than 3 chemotherapy cycles.
Conclusion: IHP and Deauville criteria are commonly used for PET/CT visual evaluation at present. Interim PET/CT analysis after 3–4 chemotherapy cycles is capable of predicting disease prognosis. Large-scale prospective clinical trials are needed to confirm whether PET/CT analysis can be used as an indication for changing a treatment strategy.
Keywords: PET/CT, visual interpretation, prognosis, non-Hodgkin’s lymphoma, interim
Introduction
Malignant lymphoma represents a group of malignant tumors originating in the lymphatic hematopoietic system. Malignant lymphoma can be classified as T-cell lymphoma, B-cell lymphoma, or natural killer cell lymphoma depending on the cells of origin. According to its pathology, clinical features, and prognosis, malignant lymphoma can be further classified into Hodgkin’s lymphoma (HL) and non-Hodgkin’s lymphoma (NHL). NHL includes a group of highly heterogeneous lymphoproliferative disorders, and its incidence in People’s Republic of China is far higher than that of HL. Moreover, NHL can be further classified as highly aggressive, aggressive, or indolent lymphoma according to the natural course of the disease. Although aggressive NHL develops rapidly, ~62.8%–65.1% of patients show long-term disease-free survival.1 However, as nearly half of all patients eventually show disease progression or develop refractory symptoms after chemotherapy,2 it is critical to accurately classify patients according to risk in the early stages and to adjust the treatment strategy based on the results of risk assessment.
The International Prognostic Index (IPI) has been widely used in clinical diagnosis and treatment as an important prognostic indicator of aggressive lymphoma.3 Nonetheless, the application of IPI has been challenged with the development of molecularly targeted therapeutics, such as rituximab. Despite the development of a revised IPI,4 neither of these measures includes tumor cell surface molecular markers. In recent years, several studies have found that whole-genome expression profiles can provide predictive molecular biology-based information for lymphoma patients; however, these special tests are expensive, and they have not been routinely implemented in clinical practice. Positron emission tomography (PET)/computed tomography (CT) imaging is increasingly being applied to lymphoma, and this new method of detection has shown robust advantages in the diagnosis, staging, and prognostic evaluation of aggressive NHL. Compared with clinical indicators such as age, physical fitness status score, clinical stage, and lactate dehydrogenase levels, PET/CT can be dynamically evaluated according to the patient’s response to chemotherapy during treatment. Recent studies have shown that interim PET/CT therapeutic evaluation is an independent prognostic factor that is superior to the aforementioned criteria after chemotherapy. However, when evaluating PET/CT treatment effects, correctly interpreting the imaging results is challenging. Visual judgment, Δ maximum SUX (SUVmax), and quantitative analysis are currently the main methods of PET/CT interpretation. Visual interpretation includes the Deauville criteria (5-point method) and the International Harmonization Project (IHP) criteria. As previous studies have suggested that interpretation of Deauville criteria is more accurate for aggressive lymphoma PET/CT evaluation, the use of these criteria has been recommended by National Comprehensive Cancer Network guidelines for the therapeutic evaluation of diffuse large B-cell lymphoma and HL.5 However, several researchers have reported6–9 that interim PET/CT findings using the Deauville criteria failed to demonstrate clinical utility in the evaluation of diffuse large B-cell lymphoma prognosis and treatment efficacy. Therefore, the accuracy of visual interpretation has yet to be fully demonstrated. In the present study, a meta-analysis and systematic review were performed to evaluate the predictive value of interim PET/CT visual interpretation for the prognosis of aggressive NHL.
Methods
Search strategy
We searched the literature for studies published in PubMed, Embase, Web of Science, and the Cochrane Library through May 2017 reporting the use of visual evaluation mid-chemotherapy to examine the prognosis of lymphoma.
Search keywords included “positron emission tomography/computerized tomography” OR “PET/CT” AND “lymphoma” AND “visual” AND “overall survival” OR “progression-free survival” OR “prognostic”. The literature search was restricted to English-language publications. To avoid omissions, both editorials and reviews were used as search sources, and we retrieved additional possibly valuable documents from the articles. Letters and summaries of meetings were excluded based on the absence of important raw data. When the effective data included in the literature were not reported or when data published in different studies overlapped, we contacted the author to confirm the appropriate data. If the results of a study reported by different authors were clearly from the same analysis, only the latest information and the most complete study were used.
Inclusion criteria
- Histopathological confirmation of aggressive lymphoma10
- Interim evaluation including visual evaluation of PET/CT images
- Relevant survival data, such as overall survival (OS) and progression-free survival (PFS)
- Publicly available studies
Exclusion criteria
- Indolent lymphoma
- Review articles, meeting summaries, letters
- PET/CT evaluation not including a visual method
- The results of PET/CT visual interpretation not analyzed for survival, as indicated by the absence of relevant prognostic indicators, such as the hazard ratio (HR), death/survival, survival, and survival curves
- Incomplete follow-up information, with a loss rate greater than 20%, and reporting of results with less than 2 years of follow-up
Literature quality evaluation
The included articles were evaluated as a non-randomized controlled cohort study performed in accordance with the Newcastle-Ottawa quality assessment scale (NOS) for quality assessment.11 The NOS scale includes the following: 1) selection (representativeness of exposed queues, selection of non-exposed queues, determination of exposure, no subject had an outcome event prior to the study initiation, full marks represent 4 points); 2) comparability (whether the study controls for the most important factors, whether the study controls for other important confounding factors, full marks represent 2 points); and 3) outcome (assessment of outcome events, whether the follow-up is sufficient, completeness of follow-up, full marks represent 3 points). Full marks according to NOS are represented by 9 points; scores of 0–4 indicate low-quality research, and scores of 5–9 indicate high-quality research.
Data extraction
We extracted the following data: 1) the first author’s name and the date of publication; 2) baseline data for the study population, including sample size, sample origin, age, and others; 3) PET measurement parameters; and 4) OS rate, PFS rate (HR), 95% confidence interval (CI), and corresponding p-value. If the HR and the 95% CI could not be obtained from the original manuscript or corresponding author, the observed total number of deaths and the sample size for each group were extracted to calculate the HR. If the survival curve in the study was reported, the corresponding survival period of each point was obtained from the graph, and the HR was calculated using the method reported by Tierney.12 Data extraction was performed independently by 2 researchers according to pre-established criteria. The 2 researchers independently searched the literature and selected articles for inclusion. Final decisions concerning whether to incorporate a study were made by discussion or by consulting a third party. When the data in the literature were incomplete, we contacted the corresponding author of the study as often as possible to obtain the relevant information.
Statistical analysis
HR combination analysis was performed under the assumption of clinical homogeneity. The 95% CI represents the statistical effect. The heterogeneity of each study was analyzed by the χ2 test. With p<0.1 as the significance level, heterogeneity was expressed as an I2 value. When the I2 value is close to zero, heterogeneity can be attributed to chance; less than 25% indicates mild heterogeneity, 25%–50% indicates moderate heterogeneity, and more than 50% indicates a high degree of heterogeneity among studies.13 When heterogeneity was present, a random effects model (DerSimonian-Laird method) was used; otherwise, a fixed effects model (Mantel–Haenszel test) was employed. We utilized a funnel map14 and Egger’s test15 to determine whether there was publication bias in the included studies. If the test indicated the presence of publication bias, we applied the “Decline Method” to estimate the number of articles that were potentially missing and corrected for the combined effect values.16 Finally, by sequentially removing each of the included studies, subsequent sensitivity analysis was performed by means of effect-quantity combination to evaluate the robustness and reliability of each study. In general, an HR >1.0 was considered to indicate a poor survival rate for patients in the PET(+) visual interpretation group; an HR <1.0 in the PET(−) visual interpretation group was associated with poor survival. A lack of overlap of the HR (CI) with 1 suggested that the results of visual interpretation had statistical value for survival prediction. All p-values were calculated with 2-sided tests.
Effect-quantity pooling, heterogeneity testing, sensitivity analysis, and bias testing were analyzed using the meta-package in R (ver.3.2.3; a language and environment for statistical computing; https://www.R-project.org/).17
Results
Results of literature screening
After screening for inclusion and investigation criteria, 11 studies were ultimately included (Table 1).7,18–27
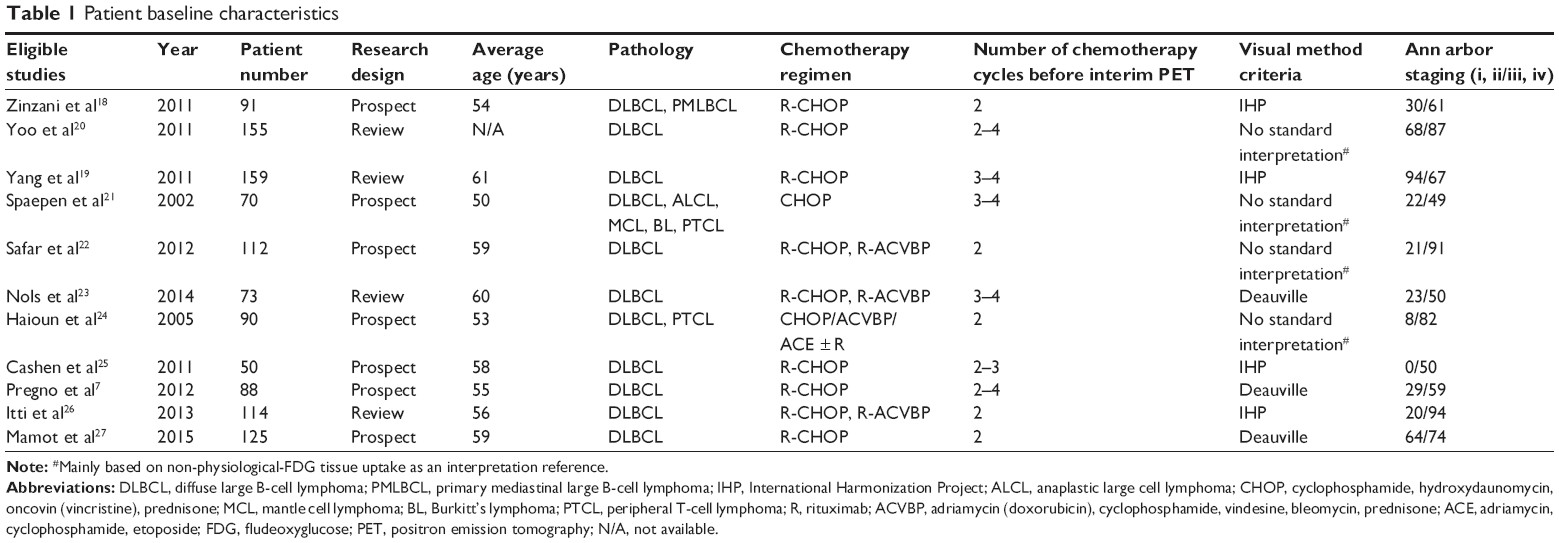 | Table 1 Patient baseline characteristics |
Literature quality evaluation
All of the 11 eligible studies were based on pathologic diagnosis, and the lymphoma subtype, sex, age, and treatment of the patients were described. The baseline conditions of each group were comparable. The basic features of the eligible studies are shown in Table 1. The quality of the 11 eligible studies was assessed in strict accordance with the NOS. The scores ranged from 7 to 9 points, suggesting that the methodological quality level of each eligible study was sufficiently high (Table 2).
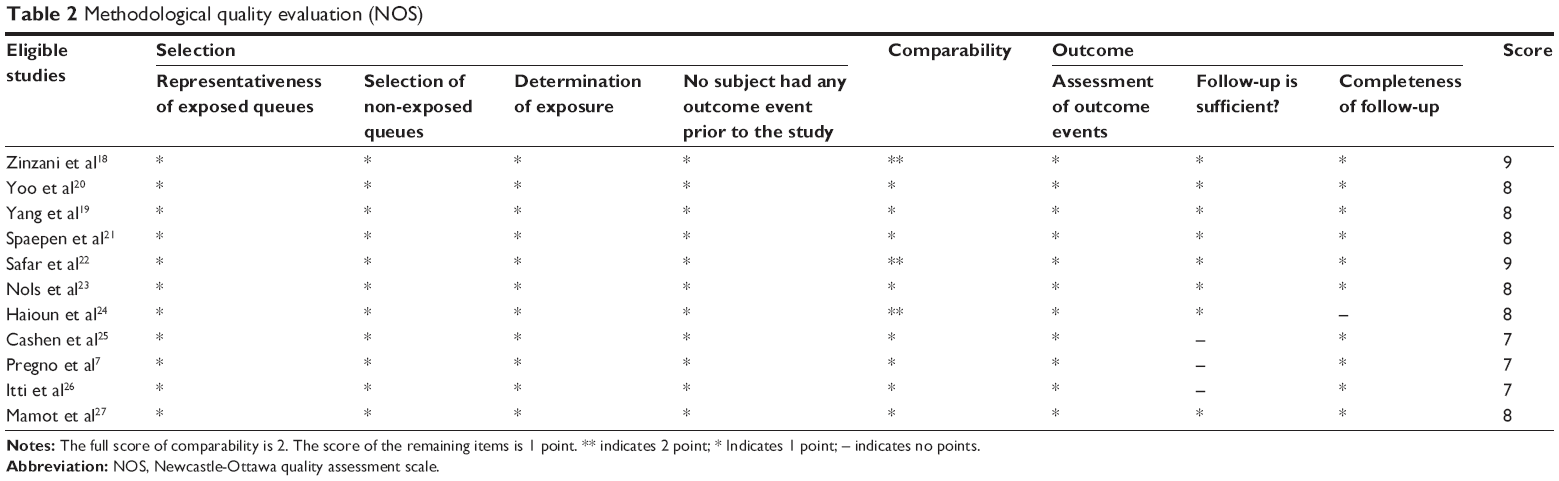 | Table 2 Methodological quality evaluation (NOS) |
Meta-analysis results
We performed meta-analysis of 2 end points (PFS and OS). Eight and nine studies analyzed the effects of visual interpretation of interim PET/CT evaluation on the PFS and OS, respectively, of patients with aggressive lymphoma.
HR of PFS and subgroup analysis
The quantitative results of overall heterogeneity testing (Q test; tau2=0; p=0.6945) and the I2 index test (I2=0.0%) suggested that there was no significant heterogeneity among the studies. Therefore, a fixed effects model was used for the analysis, and the overall HR was found to be 2.93 (95% CI: 2.93–3.90, p<0.0001). The PFS of interim PET/CT-positive patients was low based on the vision method, and the difference was statistically significant.
In subgroup analysis with interpretation criteria as the classification method (Figure 1), quantitative results of tests for the Deauville criteria using the Q test (tau2=0; p=0.6273) and the I2 index test (I2=0.0%) indicated no significant heterogeneity among the studies. Thus, a fixed effects model was employed for the analysis; the HR was 2.91 (95% CI: 1.68–5.04). The PFS of positive patients, as judged by the Deauville 5-point criteria, was low, with a statistically significant difference.
 | Figure 1 Meta-analysis of PFS for interim PET/CT visual evaluation of aggressive non-Hodgkin’s lymphoma (subgroups = interpretation criteria). |
The quantitative results for the IHP group using the Q (tau2=0; p=0.8211) and I2 index (I2=0.0%) tests suggested that no significant heterogeneity was present, and a fixed effects model was used for the analysis; the HR was 2.92 (95% CI: 1.81–4.70). The PFS of positive patients, as determined by the IHP method, was low. The difference was statistically significant.
Quantitative testing for the no standard interpretation group using the Q test (tau2=0.3084; p=0.0867) and I2 index test (I2=59.1%) indicated the presence of heterogeneity among the studies. Therefore, a random effects model was used for the analysis, with an HR of 3.47 (95% CI: 1.53–7.87). The results showed that the PFS of positive patients, as judged by each method with no standard interpretation, was low. The difference was statistically significant.
In subgroup analysis with the number of chemotherapy cycles before PET imaging as the classification method (Figure 2), the quantitative results for the group with an average number of chemotherapy cycles before PET of less than 3 (Q test [tau2=0; p=0.7938] and I2 index test [I2=0.0%]) suggested no significant heterogeneity. Therefore, we employed a fixed effects model for the analysis; the HR was 2.89 (95% CI: 1.75–4.78). The PFS of positive patients who had less than 3 chemotherapy cycles according to Deauville 5-point criteria and IHP criteria was low, and the difference was statistically significant.
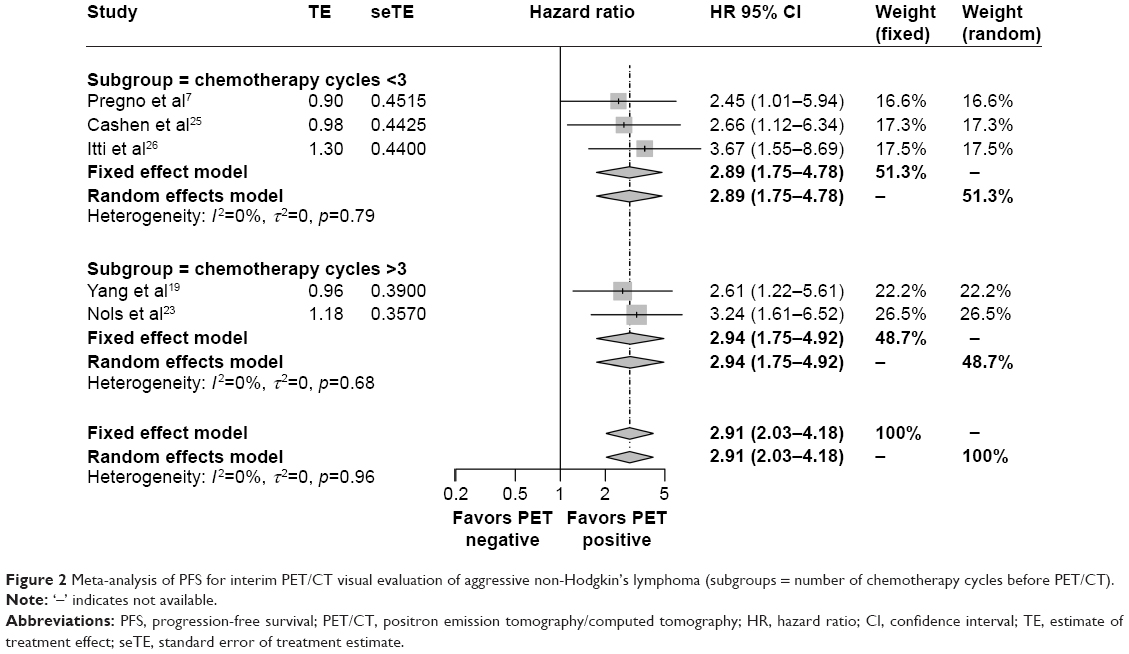 | Figure 2 Meta-analysis of PFS for interim PET/CT visual evaluation of aggressive non-Hodgkin’s lymphoma (subgroups = number of chemotherapy cycles before PET/CT). |
For the group with an average number of chemotherapy cycles before PET greater than 3 (Q test [tau2=0; p=0.6835] and I2 index test [I2=0.0%]), the quantitative results suggested that no significant heterogeneity was present among the studies. Accordingly, a fixed effects model was used for the analysis; the HR was 2.94 (95% CI: 1.75–4.82). The results showed that the PFS of the positive patients who had more than 3 chemotherapy cycles, as judged by the Deauville 5-point and IHP methods, was low. The difference was statistically significant.
HR of OS and subgroup analysis
The quantitative results of overall heterogeneity testing (Q test [tau2=0.087; p=0.1912] and I2 index test [I2=28.5%]) indicated no significant heterogeneity in the studies. The overall HR using a fixed effects model was 2.55 (95% CI: 1.76–3.68, p<0.0001). The results showed that the OS of interim PET/CT-positive patients was low according to the vision method, and the difference was statistically significant.
In subgroup analysis using interpretation criteria as the classification method (Figure 3), the quantitative results for the Deauville group (Q test [tau2=0.3808; p=0.1078] and I2 index test [I2=61.3%]) suggested moderate heterogeneity among the studies. Thus, a random effects model was used; the HR was 1.99 (95% CI: 0.67–5.93). The results showed that the OS of Deauville 5-point method-positive patients was low, though statistical significance was not reached.
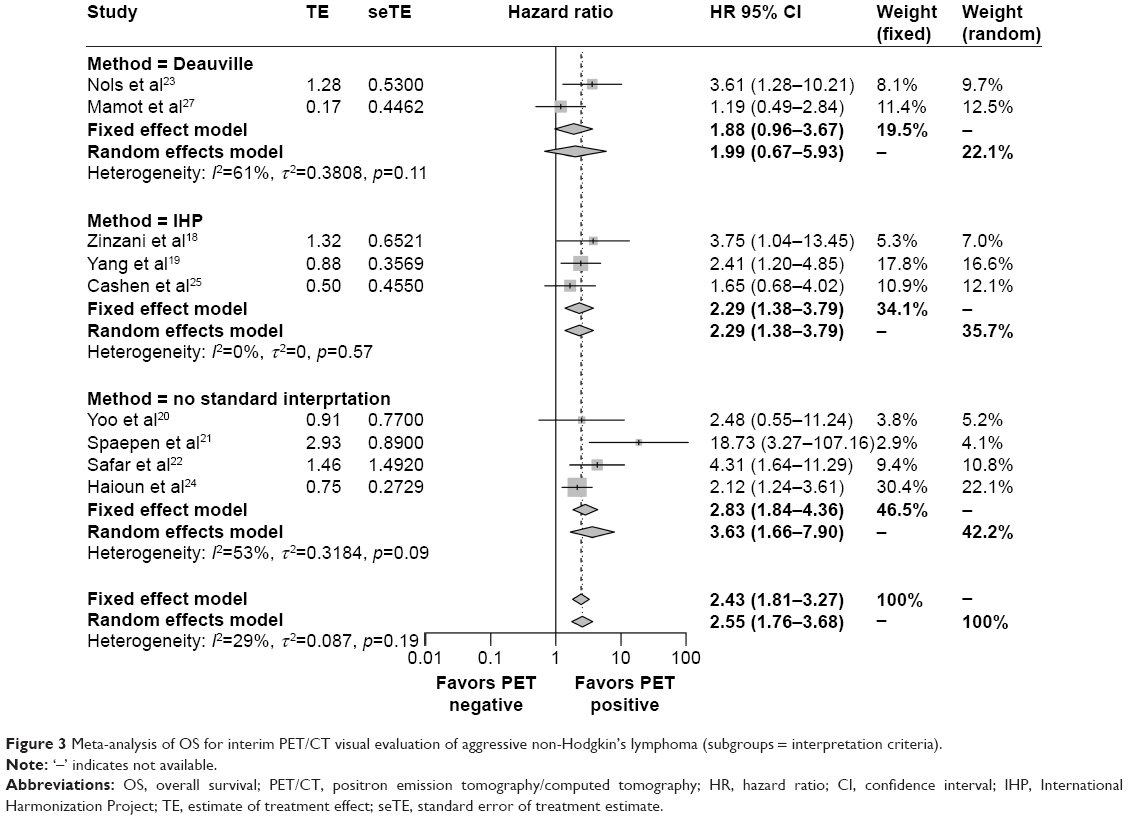 | Figure 3 Meta-analysis of OS for interim PET/CT visual evaluation of aggressive non-Hodgkin’s lymphoma (subgroups = interpretation criteria). |
The quantitative results for the IHP group (Q test [tau2=0; p=0.5734] and I2 index test [I2=0.0%]) revealed no significant heterogeneity, and the fixed effects model showed an HR of 2.29 (95% CI: 1.38–3.79). According to the results, the OS of IHP method-positive patients was low, and the difference was statistically significant.
For the no standard interpretation group, the quantitative results (Q test [tau2=0.3184; p=0.0938] and I2 index test [I2=53.1%]) indicated heterogeneity among the studies, and the HR was 3.63 based on a random effects model (95% CI: 1.66–7.90). A low OS was found for patients positive according to each method with no standard interpretation. The difference was statistically significant.
In subgroup analysis with the number of chemotherapy cycles before PET as the classification method (Figure 4), the quantitative results for the group with the average number of chemotherapy cycles before PET of fewer than 3 (Q test [tau2=0.0162; p=0.3454] and I2 index test [I2=5.9%]) suggested no significant heterogeneity. Therefore, a fixed effects model was used for the analysis, with an HR of 1.69 (95% CI: 0.96–2.95). The OS of positive patients whose average number of chemotherapy cycles was fewer than 3, as judged by the Deauville 5-point and IHP methods, was low, with no statistical significance.
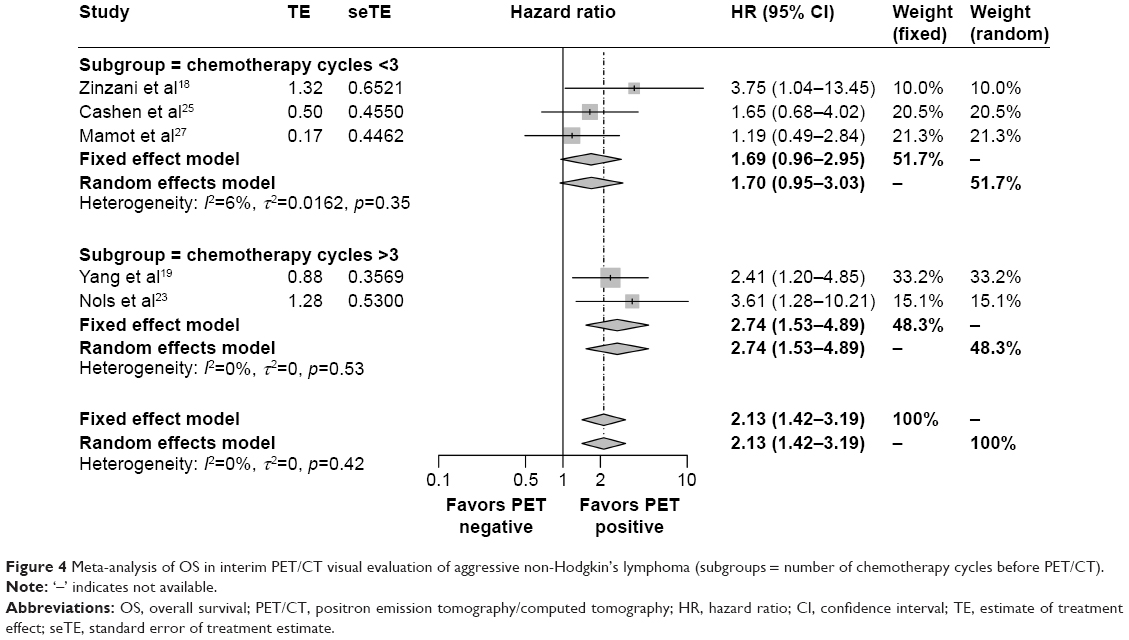 | Figure 4 Meta-analysis of OS in interim PET/CT visual evaluation of aggressive non-Hodgkin’s lymphoma (subgroups = number of chemotherapy cycles before PET/CT). |
The quantitative results for the group with the average number of chemotherapy cycles before PET greater than 3 (Q test [tau2=0; p=0.5269] and I2 index test [I2=0.0%] indicated a lack of significant heterogeneity among the studies, and the HR was 2.74 according to the fixed effects model used for analysis (95% CI: 1.53–4.89). The results showed that the OS of positive patients whose average number of chemotherapy cycles was greater than 3, as determined by the Deauville 5-point and IHP criteria, was low. The difference was statistically significant.
Eligible study publication bias
- The funnel plots (Figure 5A) included in Figure 1 are basically symmetrical. Egger’s test (Figure 5B) showed a bias of 2.69, p=0.0938. There was no significant publication bias.
- The funnel plots (Figure 6A) presented in Figure 2 are essentially symmetrical. Egger’s testing (Figure 6B) revealed a bias of −1.02, p=0.6629, with no significant publication bias.
- Essentially symmetrical funnel plots (Figure 7A) are shown in Figure 3. Egger’s testing (Figure 7B) showed a bias of 1.89, p=0.1114. There was no significant publication bias.
- Figure 4 displays basically symmetrical funnel plots (Figure 8A). Egger’s testing (Figure 8B) showed a bias of 1.78, p=0.5165, with no significant publication bias.
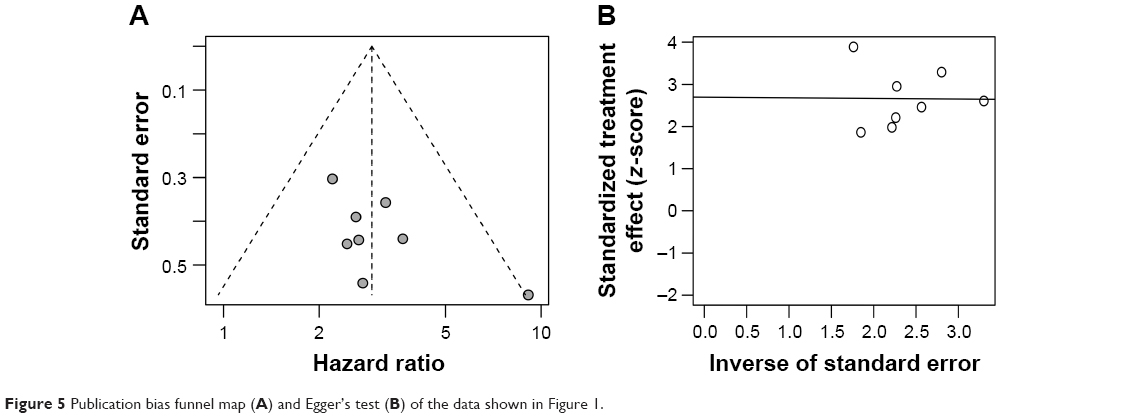 | Figure 5 Publication bias funnel map (A) and Egger’s test (B) of the data shown in Figure 1. |
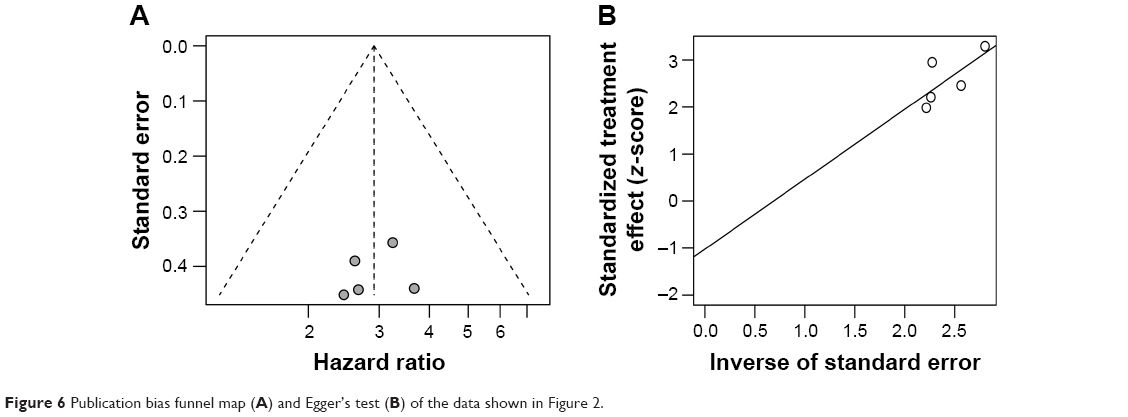 | Figure 6 Publication bias funnel map (A) and Egger’s test (B) of the data shown in Figure 2. |
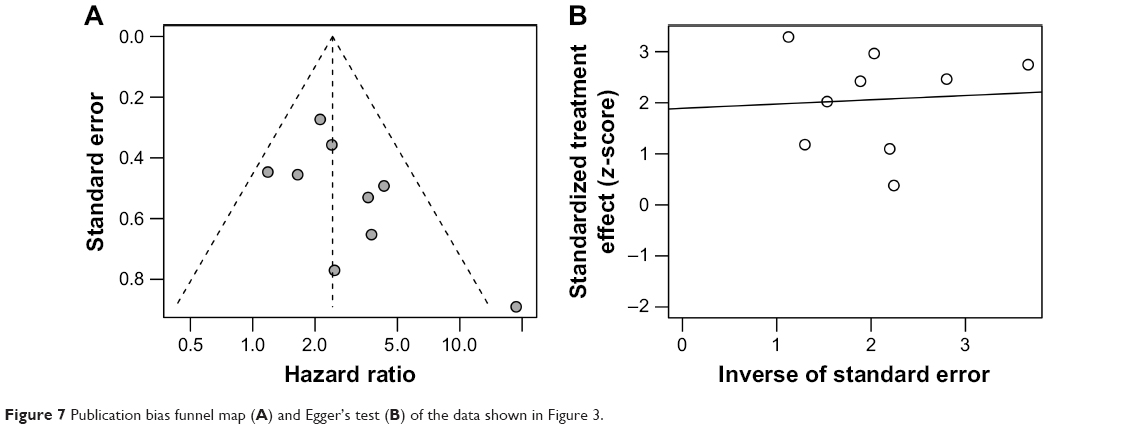 | Figure 7 Publication bias funnel map (A) and Egger’s test (B) of the data shown in Figure 3. |
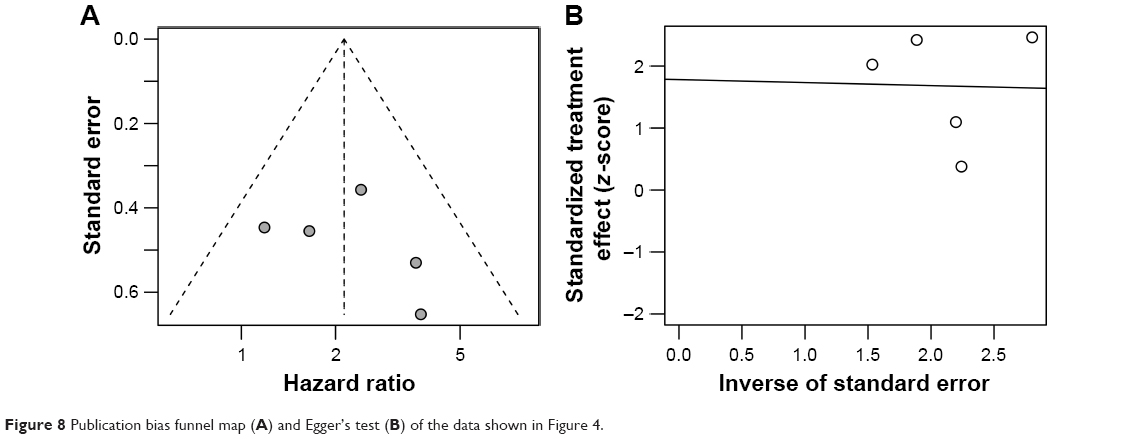 | Figure 8 Publication bias funnel map (A) and Egger’s test (B) of the data shown in Figure 4. |
Sensitivity analysis
We performed sensitivity analysis of eight studies with PFS as an end point and nine studies with OS as an end point. After excluding single clinical trials, the total analysis of the included studies showed that patient prognosis could be predicted, suggesting that heterogeneity between studies was not caused by a single study with variable quality. No single study had a significant effect on the overall analysis, and the overall effect exhibited good stability.
Discussion
Fludeoxyglucose (FDG)-PET/CT imaging has strongly contributed to systematic staging and efficacy evaluation of lymphoma. In 2007, the International Coordination Project formally introduced PET/CT imaging into the efficacy evaluation of lymphoma.28,29 FDG-PET/CT is currently recommended for staging and efficacy evaluation of FDG-high-affinity lymphoma and is mainly used to image the metabolic uptake of tumor tissues to evaluate the efficacy of treatment. Overall, the guiding effect of this approach on the value of long-term prognosis and treatment decision-making is significantly better than the previous method used by the International Working Group, which was adopted in 1999 and relied on measuring the size of the lesion based on CT imaging.30 There are 3 important time points for PET/CT in the evaluation of staging and curative effects in aggressive lymphoma: 1) baseline PET/CT before chemotherapy; 2) interim efficacy evaluation; and 3) confirmation of curative effect after chemotherapy. Among these, the value of mid-term efficacy evaluation has been a significant focus of academic research. Although there are many prognostic factors and evaluation systems that help to determine overall prognosis, it is often difficult to determine individual treatment options accordingly. Early screening of refractory or rapidly relapsing patients can help in the implementation of early recovery programs (such as chemotherapy, transplantation, or new targeted drugs) to improve outcomes. By contrast, early identification of patients with a good prognosis can allow for the treatment intensity to be adjusted, thereby reducing long-term toxicity or the occurrence of a second primary tumor. It has been reported that interim PET/CT can accurately predict the treatment response of patients with lymphoma as well as patients early in treatment who are at risk of failure, and it can predict PFS.21,26,31 In a prospective clinical study of 90 patients with diffuse large B-cell lymphoma, PET/CT imaging of positive patients after 2 cycles of chemotherapy suggested a poor prognosis, and the results were independent of the treatment regimen and age-adjusted IPI.24 Similarly, PET/CT imaging after 4 cycles of chemotherapy also showed a good predictive value.32 Regardless, there are many studies suggesting that interim PET/CT cannot accurately predict the prognosis of patients7,33,34 and that changing the treatment strategy based on the outcome of interim PET/CT analysis does not lead to survival benefits.34 In the rituximab era, the clinical trial prediction value of interim PET/CT has not been good, and several scholars believe that the results of accurate histopathological examination and genetic testing can more accurately guide changes in chemotherapy protocols.18 In the present study, a number of related homogeneous research studies were merged and systematically reviewed, with the goal of providing a higher level of evidence-based medical support for the interim PET/CT evaluation strategy and its predictive value in aggressive NHL.
How to determine the interim PET/CT visual interpretation method
Visual interpretation is designed to assess treatment response using the simplest method. We used a non-standardized method, IHP criteria, and Deauville criteria for interpretation of the studies included in our analysis. The non-standardized method has been developed and used by various researchers, though it is not officially recognized. Through heterogeneity testing of relevant studies, we found that the non-standardized method results in large heterogeneity between different centers or different observers.23 IHP criteria represent a purely visual evaluation method. This classification method states that residual lesions greater than 2 cm be referred to the mediastinal pool and that lesions less than 2 cm be compared with the surrounding background. There are studies8,35 suggesting that the predictive value of chemotherapy efficacy evaluation after 2–4 cycles of immunochemotherapy is poor; the main manifestation of this is that a low positive predictive value is obtained using IHP criteria. The Deauville criteria represent a relatively new visual interpretation methodology, with a 5-point method for analysis. In contrast with the IHP standard method, comparison of liver FDG uptake is included, which improves the accuracy of interpretation. In addition, the Deauville criteria do not include a method to absorb the surrounding environment and classify and compare cases according to tumor size, thus reducing errors caused by different backgrounds of the residual mass. Furthermore, the diagnostic threshold can be adjusted based on the scores, and the Deauville criteria can further improve diagnostic efficiency and interobserver consistency. Nonetheless, in this study, negative results were obtained when using the Deauville criteria for interim PET/CT meta-analysis with OS as the end point. This was due to the high heterogeneity of the study by Mamot et al,27 which applied an ultra-early interim PET/CT time point. Although IHP and Deauville criteria are being used by an increasing number of centers due to their simplicity and consistency with different observers, OS according to Deauville’s criteria prediction in lymphoma patient should be considered with caution. More research should be performed to explore the Deauville criteria for diagnostic thresholds.
Selection of interim PET/CT examination time point
In the subgroup with an average number of chemotherapy cycles fewer than 3 before interim PET/CT examination, the OS of positive and negative patients, as judged by the visual method, was not statistically significant. By contrast, the OS and PFS of positive and negative patients, as based on the visual method, were low in the subgroup with an average number of chemotherapy cycles greater than 3 before interim PET/CT examination. One of the reasons for the poor predictive efficiency of early PET/CT may be an increase in the false-positive rate, as inflammatory reactions caused by chemotherapeutic drugs after tumor regression increase FDG uptake. In addition, in a study using the IPI as a stratification factor,19 visual interpretation of ultra-early interim PET/CT (evaluated immediately after 1–2 cycles of chemotherapy) did not appear to fully reflect the patients’ response to treatment. In that study, several interim PET-positive patients with high IPI scores were ultimately cured because the 2–3 cycles of chemotherapy were inadequate for patients with a high tumor burden and the assessment was too early to evaluate the effectiveness of the intervention. Many clinical trials have employed ΔSUVmax for semi-quantitative interpretation, and this measure for early PET/CT can generate more information about ΔSUV uptake changes than the Deauville 5-point method. Thus, using ΔSUVmax in such patients may be a better choice.26 However, there is no uniform standard for ΔSUVmax interpretation; indeed, most clinical studies use different diagnostic thresholds, and the sample sizes are small. Moreover, when the baseline SUVmax is less than 10, ΔSUVmax analysis is prone to false-negative results.8 In addition, ΔSUVmax calculation requires access to baseline PET data, which is not always available in high-risk patients who need immediate interventional chemotherapy. Based on these considerations, we propose that the positive predictive value of using the visual approach for early interim evaluation (after 1–2 cycles of chemotherapy) is low, and we recommend that evaluation be performed after at least after 3 cycles of chemotherapy. Multi-parameter stratification analysis (such as combining IPI, molecular typing, and others) may help to improve the predictive value, but additional larger clinical trials are needed.
Conclusion
In summary, IHP and Deauville criteria are commonly applied for PET/CT visual evaluation. The interim PET/CT visual method after 3–4 cycles of chemotherapy can accurately assess disease prognosis, but whether this outcome can be used as a basis for changing treatment strategy remains to be confirmed in a large prospective clinical trial.
Acknowledgments
The authors are grateful to Qiang Li, a radiologist at the Affiliated Tumor Hospital of Guangxi Medical University, Nanning, People’s Republic of China. This project was supported by the National Natural Science Foundation of China (No 81260088) and the Self-financed Scientific Research Project of Guangxi Zhuang Autonomous Region Health and Family Planning Commission (Z2016504).
Disclosure
The authors report no conflicts of interest in this work.
References
Pulte D, Jansen L, Gondos A, et al; GEKID Cancer Survival Working Group. Survival of patients with non-Hodgkin lymphoma in Germany in the early 21st century. Leuk Lymphoma. 2013;54(5):979–985. | ||
Philip T, Hartmann O, Biron P, et al. High-dose therapy and autologous bone marrow transplantation in partial remission after first-line induction therapy for diffuse non-Hodgkin’s lymphoma. J Clin Oncol. 1988;6(7):1118–1124. | ||
International Non-Hodgkin’s Lymphoma Prognostic Factors Project. A predictive model for aggressive non-Hodgkin’s lymphoma. N Engl J Med. 1993;329(14):987–994. | ||
Huang HH, Xiao F, Chen FY, et al. Reassessment of the prognostic value of the International Prognostic Index and the revised International Prognostic Index in patients with diffuse large B-cell lymphoma: a multicentre study. Exp Ther Med. 2012;4(3):475–480. | ||
Cheson BD, Fisher RI, Barrington SF, et al. Recommendations for initial evaluation, staging, and response assessment of Hodgkin and non-Hodgkin lymphoma: the Lugano classification. J Clin Oncol. 2014;32(27):3059–3068. | ||
Stewart DA, Kloiber R, Owen C, et al. Results of a prospective phase II trial evaluating interim positron emission tomography-guided high dose therapy for poor prognosis diffuse large B-cell lymphoma. Leuk Lymphoma. 2014;55(9):2064–2070. | ||
Pregno P, Chiappella A, Bello M, et al. Interim 18-FDG-PET/CT failed to predict the outcome in diffuse large B-cell lymphoma patients treated at the diagnosis with rituximab-CHOP. Blood. 2012;119(9):2066–2073. | ||
Casasnovas RO, Meignan M, Berriolo-Riedinger A, et al; Groupe d’étude des lymphomes de l’adulte (GELA). SUVmax reduction improves early prognosis value of interim positron emission tomography scans in diffuse large B-cell lymphoma. Blood. 2011;118(1):37–43. | ||
Cox MC, Ambrogi V, Lanni V, et al. Use of interim [F-18]fluorodeoxyglucose-positron emission tomography is not justified in diffuse large B-cell lymphoma during first-line immunochemotherapy. Leuk Lymphoma. 2012;53(2):263–269. | ||
Jaffe ES, Harris NL, Stein H, Vardiman JW (editors). Pathology and Genetics of Tumours of Haematopoietic and Lymphoid Tissues. Lyon: IARC Press; 2001. | ||
Wells GA, Shea BJ, O’Connell D, et al. The Newcastle–Ottawa Scale (NOS) for assessing the quality of non-randomized studies in meta-analysis. Appl Eng Agric. 2000;18(6):727–734. | ||
Tierney JF, Stewart LA, Ghersi D, Burdett S, Sydes MR. Practical methods for incorporating summary time-to-event data into meta-analysis. Trials. 2007;8(1):16. | ||
DerSimonian R. Meta-analysis in the design and monitoring of clinical trials. Stat Med. 1996;15(12):1249–1252. | ||
Vandenbroucke JP. Bias in meta-analysis detected by a simple, graphical test. Experts’ views are still needed. BMJ. 1998;316(7129):469–470. | ||
Stuck AE, Rubenstein LZ, Wieland D. Bias in meta-analysis detected by a simple, graphical test. Asymmetry detected in funnel plot was probably due to true heterogeneity. BMJ. 1998;316(7129):469. | ||
Duval S, Tweedie R. Trim and fill: a simple funnel-plot-based method of testing and adjusting for publication bias in meta-analysis. Biometrics. 2000;56(2):455–463. | ||
Schwarzer G. Meta: an R package for meta-analysis. R News. 2007;3(7):40–45. | ||
Zinzani PL, Gandolfi L, Broccoli A, et al. Midtreatment 18F-fluorodeoxyglucose positron-emission tomography in aggressive non-Hodgkin lymphoma. Cancer. 2011;117(5):1010–1018. | ||
Yang DH, Min JJ, Song HC, et al. Prognostic significance of interim 18F-FDG PET/CT after three or four cycles of R-CHOP chemotherapy in the treatment of diffuse large B-cell lymphoma. Eur J Cancer. 2011;47(9):1312–1318. | ||
Yoo C, Lee DH, Kim JE, et al. Limited role of interim PET/CT in patients with diffuse large B-cell lymphoma treated with R-CHOP. Ann Hematol. 2011;90(7):797–802. | ||
Spaepen K, Stroobants S, Dupont P, et al. Early restaging positron emission tomography with (18)F-fluorodeoxyglucose predicts outcome in patients with aggressive non-Hodgkin’s lymphoma. Ann Oncol. 2002;13(9):1356–1363. | ||
Safar V, Dupuis J, Itti E, et al. Interim [18F]fluorodeoxyglucose positron emission tomography scan in diffuse large B-cell lymphoma treated with anthracycline-based chemotherapy plus rituximab. J Clin Oncol. 2012;30(2):184–190. | ||
Nols N, Mounier N, Bouazza S, et al. Quantitative and qualitative analysis of metabolic response at interim positron emission tomography scan combined with International Prognostic Index is highly predictive of outcome in diffuse large B-cell lymphoma. Leuk Lymphoma. 2014;55(4):773–780. | ||
Haioun C, Itti E, Rahmouni A, et al. [18F]fluoro-2-deoxy-D-glucose positron emission tomography (FDG-PET) in aggressive lymphoma: an early prognostic tool for predicting patient outcome. Blood. 2005;106(4):1376–1381. | ||
Cashen AF, Dehdashti F, Luo J, Homb A, Siegel BA, Bartlett NL. 18F-FDG PET/CT for early response assessment in diffuse large B-cell lymphoma: poor predictive value of international harmonization project interpretation. J Nucl Med. 2011;52(3):386–392. | ||
Itti E, Meignan M, Berriolo-Riedinger A, et al. An international confirmatory study of the prognostic value of early PET/CT in diffuse large B-cell lymphoma: comparison between Deauville criteria and ΔSUVmax. Eur J Nucl Med Mol Imaging. 2013;40(9):1312–1320. | ||
Mamot C, Klingbiel D, Hitz F, et al. Final results of a prospective evaluation of the predictive value of interim positron emission tomography in patients with diffuse large B-cell lymphoma treated with R-CHOP-14 (SAKK 38/07). J Clin Oncol. 2015;33(23):2523–2529. | ||
Cheson BD, Pfistner B, Juweid ME, et al; International Harmonization Project on Lymphoma. Revised response criteria for malignant lymphoma. J Clin Oncol. 2007;25(5):579–586. | ||
Cheson BD. The International Harmonization Project for response criteria in lymphoma clinical trials. Hematol Oncol Clin North Am. 2007;21(5):841–854. | ||
Cheson BD, Horning SJ, Coiffier B, et al. Report of an international workshop to standardize response criteria for non-Hodgkin’s lymphomas. NCI Sponsored International Working Group. J Clin Oncol. 1999;17(4):1244. | ||
Kostakoglu L, Coleman M, Leonard JP, Kuji I, Zoe H, Goldsmith SJ. PET predicts prognosis after 1 cycle of chemotherapy in aggressive lymphoma and Hodgkin’s disease. J Nucl Med. 2002;43(8):1018–1027. | ||
Dupuis J, Itti E, Rahmouni A, et al. Response assessment after an inductive CHOP or CHOP-like regimen with or without rituximab in 103 patients with diffuse large B-cell lymphoma: integrating 18fluorodeoxyglucose positron emission tomography to the International Workshop Criteria. Ann Oncol. 2009;20(3):503–507. | ||
Han HS, Escalón MP, Hsiao B, Serafini A, Lossos IS. High incidence of false-positive PET scans in patients with aggressive non-Hodgkin’s lymphoma treated with rituximab-containing regimens. Ann Oncol. 2009;20(2):309–318. | ||
Terasawa T, Lau J, Bardet S, et al. Fluorine-18-fluorodeoxyglucose positron emission tomography for interim response assessment of advanced-stage Hodgkin’s lymphoma and diffuse large B-cell lymphoma: a systematic review. J Clin Oncol. 2009;27(11):1906–1914. | ||
Itti E, Juweid ME, Haioun C, et al. Improvement of early 18F-FDG PET interpretation in diffuse large B-cell lymphoma: importance of the reference background. J Nucl Med. 2010;51(12):1857–1862. |
 © 2017 The Author(s). This work is published and licensed by Dove Medical Press Limited. The
full terms of this license are available at https://www.dovepress.com/terms
and incorporate the Creative Commons Attribution
- Non Commercial (unported, 3.0) License.
By accessing the work you hereby accept the Terms. Non-commercial uses of the work are permitted
without any further permission from Dove Medical Press Limited, provided the work is properly
attributed. For permission for commercial use of this work, please see paragraphs 4.2 and 5 of our Terms.
© 2017 The Author(s). This work is published and licensed by Dove Medical Press Limited. The
full terms of this license are available at https://www.dovepress.com/terms
and incorporate the Creative Commons Attribution
- Non Commercial (unported, 3.0) License.
By accessing the work you hereby accept the Terms. Non-commercial uses of the work are permitted
without any further permission from Dove Medical Press Limited, provided the work is properly
attributed. For permission for commercial use of this work, please see paragraphs 4.2 and 5 of our Terms.