Back to Journals » Journal of Hepatocellular Carcinoma » Volume 12
Predictive Radiomics-Based Model for Recurrence-Free Survival After Curative Resection in Patients with Hepatocellular Carcinoma
Authors Cui J, Lin Z, Huang X, Wang S, Guo J, Song J, Zhang S, Lv J, Qiu W
Received 19 April 2025
Accepted for publication 26 July 2025
Published 7 August 2025 Volume 2025:12 Pages 1755—1766
DOI https://doi.org/10.2147/JHC.S535492
Checked for plagiarism Yes
Review by Single anonymous peer review
Peer reviewer comments 4
Editor who approved publication: Dr Ahmed Kaseb
Jinfeng Cui,1,* Zhongkun Lin,1,2,* Xiaojuan Huang,1,* Shasha Wang,1 Jing Guo,1 Jialin Song,1 Siyi Zhang,1 Jing Lv,1 Wensheng Qiu1
1Department of Oncology, The Affiliated Hospital of Qingdao University, Qingdao, Shandong, People’s Republic of China; 2Department of Oncology, Shandong Provincial Third Hospital, Jinan, Shandong, People’s Republic of China
*These authors contributed equally to this work
Correspondence: Wensheng Qiu, Department of Oncology, the Affiliated Hospital of Qingdao University, No. 16 Jiangsu Road, Shinan District, Qingdao, Shandong, 266000, People’s Republic of China, Email [email protected] Jing Lv, Department of Oncology, the Affiliated Hospital of Qingdao University, No. 16 Jiangsu Road, Shinan District, Qingdao, Shandong, 266000, People’s Republic of China, Email [email protected]
Background: Postoperative recurrence after curative resection is a major concern in the management of hepatocellular carcinoma (HCC). This study aimed to develop a radiomics-based model for predicting recurrence-free survival (RFS) after curative resection.
Methods: We retrospectively included 184 patients with early-stage HCC who underwent curative resection. The patients were randomized into training and validation sets in a 7:3 ratio. Radiomics features of the tumors on CT images were extracted to construct the Rad-score. We incorporated the Rad-score, clinical characteristics and biochemical parameters into univariate and multivariate analyses to construct a COX proportional hazards model. A radiomics-based nomogram model for predicting recurrence risk was developed by integrating multiple factors that affect recurrence. Calibration curve was used to assess the predictive performance of the model.
Results: Rad-score was constructed using 15 radiomic features. The results of multivariate analyses showed that Rad-score, lactate dehydrogenase (LDH) and alpha-fetoprotein (AFP) were independent predictors of RFS. They categorized patients into different recurrence risk groups, and RFS was significantly prolonged in patients in the low-risk group in the training (p< 0.001) and validation sets (p< 0.001). The Rad-score based composite prediction model showed good predictive performance with AUC of 0.765 and 0.920 for predicting 3 years RFS in the training and validation sets, respectively. The calibration curves indicated that the nomogram model had a favorable predictive performance.
Conclusion: This postoperative predictive model allows for better screening of patients at a high risk of recurrence and is a valuable instrument to guide clinicians in clinical treatment decisions.
Keywords: hepatocellular carcinoma, radiomics, recurrence-free survival, curative resection, nomogram
Graphical Abstract:

Introduction
Hepatocellular carcinoma (HCC) constitutes approximately 90% of all liver cancers and is the third leading cause of cancer-related mortality globally.1 For patients with early-stage HCC, curative resection remains the treatment of choice.2 However, recurrence rates following surgery are alarmingly high, with more than 50% of patients experiencing recurrence within two years,3 which may suggest the presence of a more aggressive tumor phenotype. This underscores the urgent need for robust predictive models to assess the risk of postoperative recurrence in early-stage HCC patients, enabling timely intervention.
Over the past decade, several predictive models have been developed to address this challenge. Notably, Shim et al4 introduced a nomogram incorporating five key predictors-gender, albumin levels, platelet count, tumor volume, and vascular invasion-to forecast 2-year recurrence-free survival (RFS) in early-stage HCC patients following curative resection. Similarly, Zhang et al combined clinicopathologic data with gene expression profiles to develop a model with high accuracy in predicting RFS.5 Despite their promising performance, these models are hindered by issues such as poor reproducibility, complex implementation, and economic constraints, limiting their broader clinical applicability.
Radiomics, first introduced by Dutch scholar Lambin,6 enables the transformation of medical imaging data into high-dimensional, quantitative features, offering a significant advancement over traditional diagnostic methods. In recent years, the application of radiomics has expanded, serving as an adjunct in the management of various cancers, including HCC.7 For instance, Zhang K et al developed an MRI-based radiomics nomogram to predict microvascular invasion in HCC patients, identifying those who could benefit from postoperative adjuvant transarterial chemoembolization, thereby enhancing clinical decision-making.8 Additionally, radiomics has been employed to distinguish HCC subtypes, assess immune infiltration, and predict the efficacy of immunotherapy.9,10 Peng W et al successfully built a radiomics-based random survival forest model that can potentially be used to predict early recurrence after curative ablation in HCC patients.11 However, the potential of radiomics in forecasting recurrence following radical surgery in early-stage HCC patients remains underexplored.
This study aims to develop a CT-based radiomics model that integrates hematological parameters to identify patients at higher risk of recurrence following radical surgery for early-stage HCC. This model is intended to support clinical decision-making and guide treatment strategies.
Methods and Materials
Patients
The study was approved by the Ethics Committee of our institution, and informed consent was waived due to its retrospective design. This retrospective study included patients with HCC from our hospital with China Liver Cancer Staging (CNLC) I–II from 2017 to 2023. The patient inclusion process was guided by the following principles: (1) pathological diagnosis of HCC; (2) undergoing curative resection with no neoadjuvant or adjuvant therapy pre- and postoperatively; (3) availability of contrast-enhanced CT of the abdomen within two weeks prior to surgery; (4) complete information on clinical characteristics and hematologic parameters within 1 week before surgery; and (5) no loss to follow-up until the study endpoint was reached. The exclusion criteria were as follows: (1) history of other malignancies; (2) previous treatment of local ablation and transcatheter arterial chemoembolization. Postoperative follow-up occurred every 2 to 3 months, during which serum alpha-fetoprotein (AFP) levels, contrast-enhanced CT scans, ultrasound, or magnetic resonance imaging (MRI) were used for assessment. The study’s primary endpoint, RFS, was defined as the time from surgery to the occurrence of the first recurrence or the last follow-up date for patients without recurrence. Patients were randomly assigned to the training and validation sets in a 7:3 ratio.
Data Collection
Clinically relevant data extracted from the hospital’s medical records. The following clinical characteristics and biochemical parameters were collected for analysis: sex, age, body mass index (BMI), CNLC stage, HBsAg, alcohol consumption, white blood cell (WBC) count, hemoglobin, platelet count, albumin (ALB), total bilirubin (TBIL), lactate dehydrogenase (LDH), aspartate aminotransferase (AST), alanine aminotransferase (ALT), alkaline phosphatase (ALP), γ-glutamyl transferase (GGT), blood urea nitrogen (BUN), AFP and Creatinine. Histological characteristics included tumor size, tumor number, tumor grade, and microvascular invasion. A total of 21 preoperative and two postoperative features were recorded (Table 1).
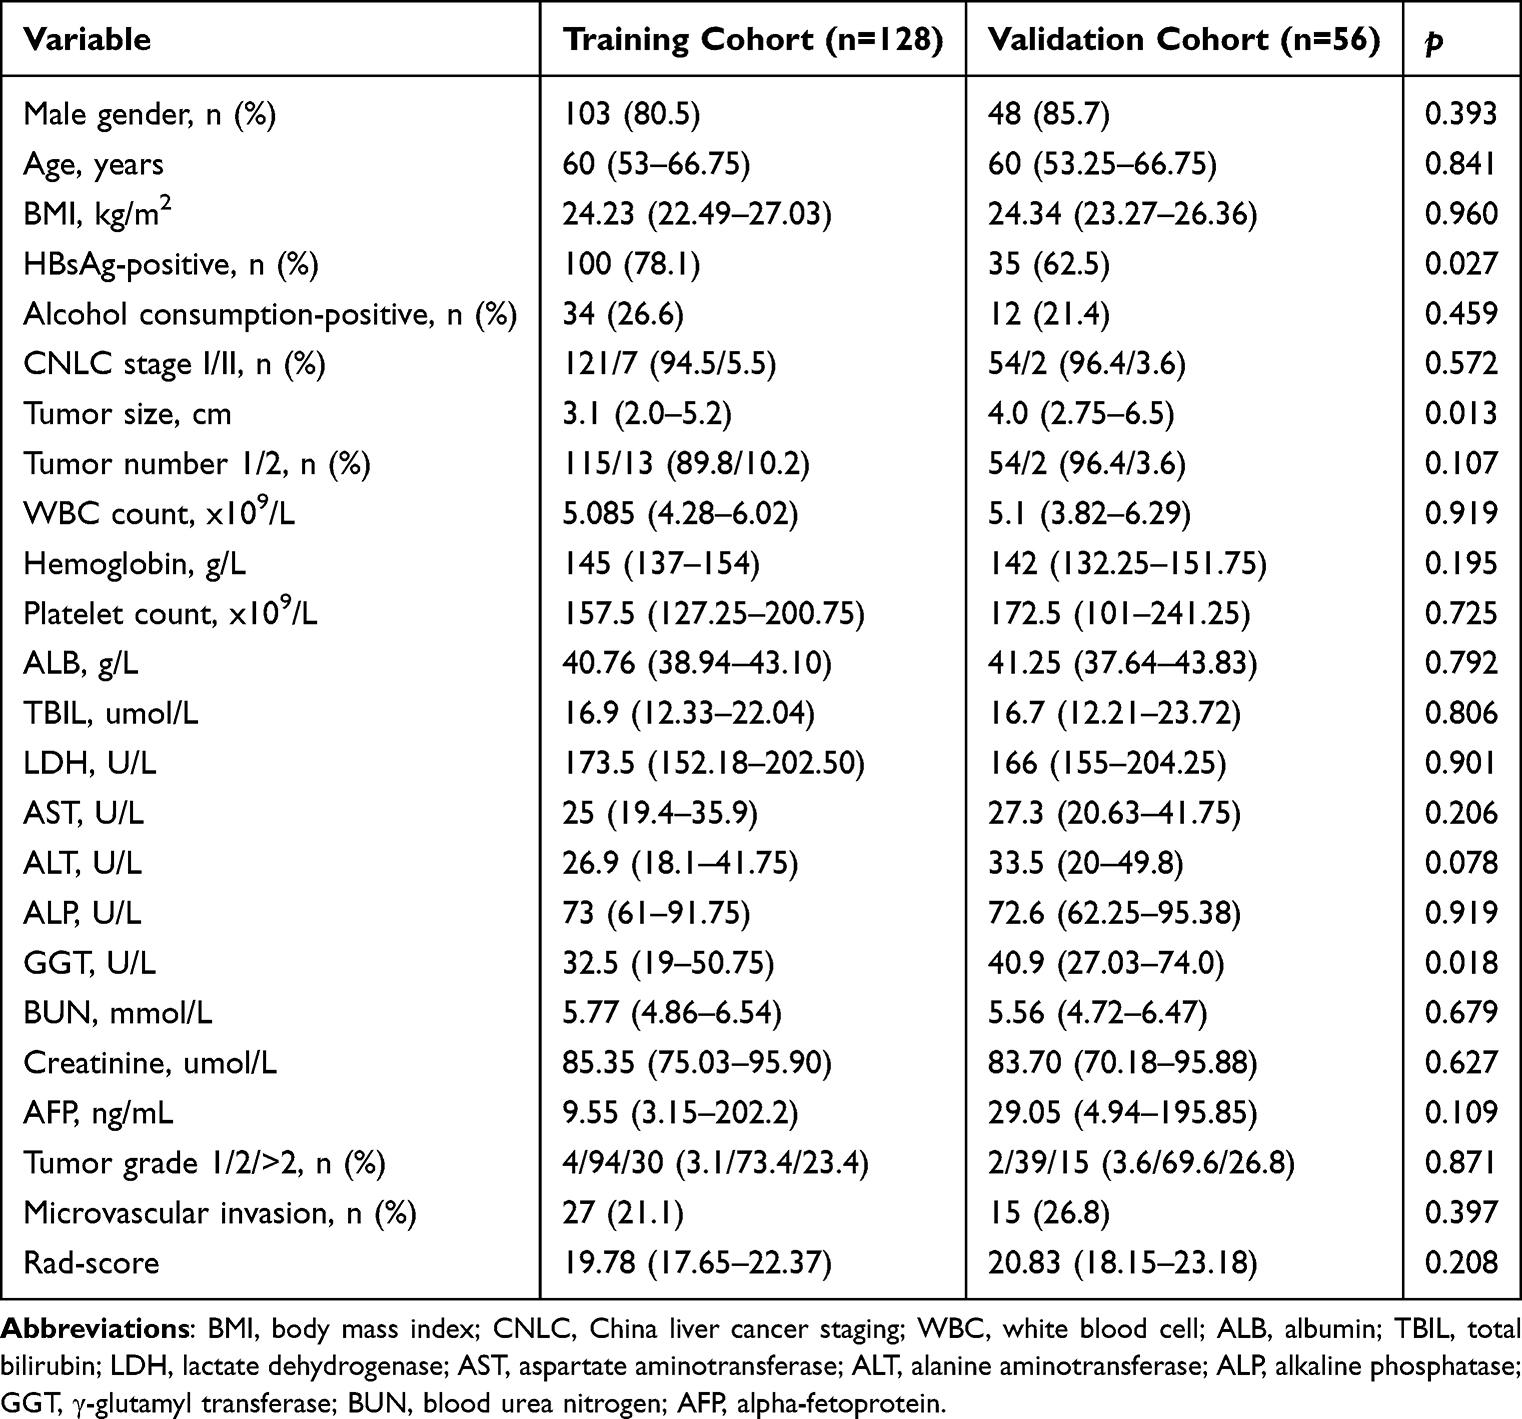 |
Table 1 Baseline Characteristics for the 184 HCC Patients Undergoing Surgical Resection |
Acquisition of CT Images and Extraction of Radiomics Features
All patients were injected with 80–100mL Iopromide injection based on body weight before CT images acquisition. The scanning parameters of CT were as follows: section thickness 5.0 mm, tube voltage 120 kV, tube current 200 mA. A CT scan was performed within two weeks before surgery. Contrast-enhanced CT images in the DICOM format were exported from the PACS system of the hospital’s information department.
Liver tumors were delineated as regions of interest (ROI) layer by layer on arterial-phase images (Figure S1) using 3D-Slicer software (Version 4.11.0). Two clinicians with over 10 years of experience, who were blinded to patient information, performed the segmentation. When multiple tumors were present, the largest tumor was selected for contouring. Tumor boundaries were defined based on distinct imaging characteristics relative to the surrounding liver tissue, in accordance with the Liver Reporting and Data System.12 Radiomics features, including both original and wavelet-filtered features, were extracted from each tumor using Pyradiomics, an open-source software package integrated within 3D-Slice.
Radiomics Feature Screening and Rad-Score Creation
To reduce the possibility of bias and overfitting due to excessive features, feature screening was performed in two steps. First, the ROI of 30 patients sketched by the two clinicians were randomly selected to extract the radiomics features separately. The inter-class correlation coefficient (ICC) was used to assess the consistency of features produced by the two clinicians. ICC values above 0.90 were considered to have excellent reproducibility and were included in the next study. To ensure that the data were comparable with each other, the radiomics features of each patient with ICC values more than 0.90 were standardized with Z-score normalization. Second, least absolute shrinkage and selection operator (LASSO) regression was applied to the training cohort to identify the most valuable features. A 10-fold cross-validation was performed to determine the best lambda (λ) from the LASSO model according to the principle of the minimum mean square error (MSE). The features that were most predictive of RFS and the weighting coefficients were selected. Subsequently, the selected features and corresponding weighting coefficients were linearly combined to produce the Rad-score.
Statistical Analysis
All statistical analyses were conducted using SPSS software (version 27.0, USA). Statistical significance was set at a threshold of 5% (p<0.05). The code for LASSO regression and ICC calculations was written in Python (version 3.9). To assess the clinical characteristics, the chi-square test was applied to categorical variables, while the Mann–Whitney U-test was used for continuous variables, comparing the training and validation groups. The optimal truncation values for continuous variables were determined using X-tile software.13 Both univariate and multivariate analyses were carried out using the Cox proportional hazards model. Kaplan–Meier analysis was used to generate survival curves, with statistical significance assessed through the Log rank test. The model’s accuracy was assessed by generating receiver operating characteristic (ROC) curves with the “timeROC” package in R software (version 4.4.1). A nomogram was constructed with the “Rms” package. To assess the model’s predictive performance, calibration curves and Harrell’s concordance index (C-index) were utilized.
Results
Clinical Characteristics of the Patients
Following screening, a total of 184 patients were enrolled in the study. Of these, 128 patients were assigned to the training set, and 56 to the validation set, based on a 7:3 ratio. With the exception of HBsAg status, tumor size, and GGT levels, no significant differences were observed between the clinical and biochemical characteristics of the two sets (Table 1).
The median follow-up durations were 20.9 months for the training set and 22.7 months for the validation set. In the training set, the median RFS was 49.0 months, compared to 31.7 months in the validation set.
Results of Feature Extraction and Feature Screening
A total of 851 radiomics features were extracted from the ROI of each patient’s CT images using the Pyradiomics software package, including shape features and first order statistical features. The specific feature names and types were detailed in Table S2.
The ICC was calculated by extracting the ROI features of 30 patients outlined by two clinicians separately, and there were 651 features with ICC greater than 0.9 (Figure S2). These 651 features were included in the LASSO regression, and the MSE was minimized when λ=1.6681 (Figure 1a). At this point, there were 15 features with coefficients that were not zero (Figure 1b).
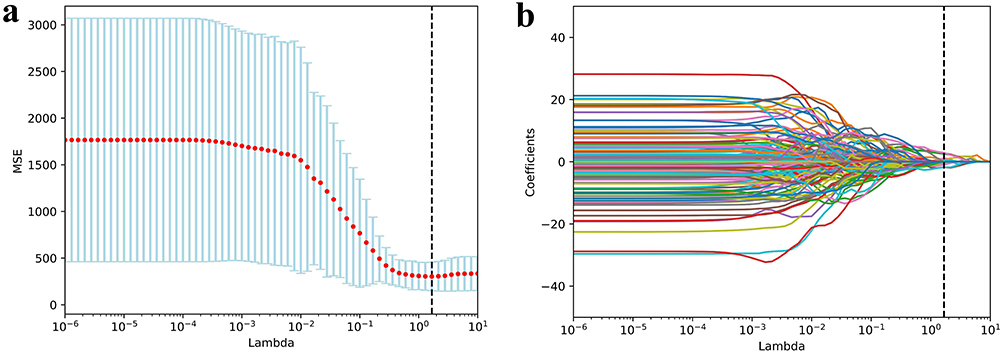 |
Figure 1 LASSO regression models were used to screen RFS-related features. (a) The MSE was minimized when λ = 1.6681. (b) When λ = 1.6681, there were 15 features with coefficients that were not zero. |
The 15 radiomics features and their coefficients were listed in Table S1. The values of each feature were linearly combined with their weight coefficients to construct the Rad-score for each patient. The Rad-score formula was shown in the additional file.
Construction of Predictive Model
The cut-off value for the Rad-score determined using X-tile software was 21.55 and patients were categorized into low (≤21.55) and high (>21.55) groups. We included clinical characteristics, biochemical parameters, and Rad-score for univariate analysis in the training set (Table 2), which showed that LDH (Hazard ratio (HR): 2.089, 95% confidence interval (CI): 1.025–4.256, p=0.043), BUN (HR: 0.475, 95% CI: 0.244–0.926, p=0.029), AFP (HR: 2.283, 95% CI: 1.221–4.270, p=0.010), tumor grade (HR: 1.967, 95% CI: 1.019–3.795, p=0.044), and Rad-score (HR: 0.278, 95% CI: 0.131–0.590, p<0.001) were associated with RFS. Further inclusion of these five factors in a multivariate analysis (Table 2) showed that LDH (HR: 2.396, 95% CI: 1.147–5.004, p=0.020), AFP (HR: 2.109, 95% CI: 1.109–4.013, p=0.023), and Rad-score (HR: 0.238, 95% CI: 0.111–0.512, p<0.001) were independent risk factors for RFS.
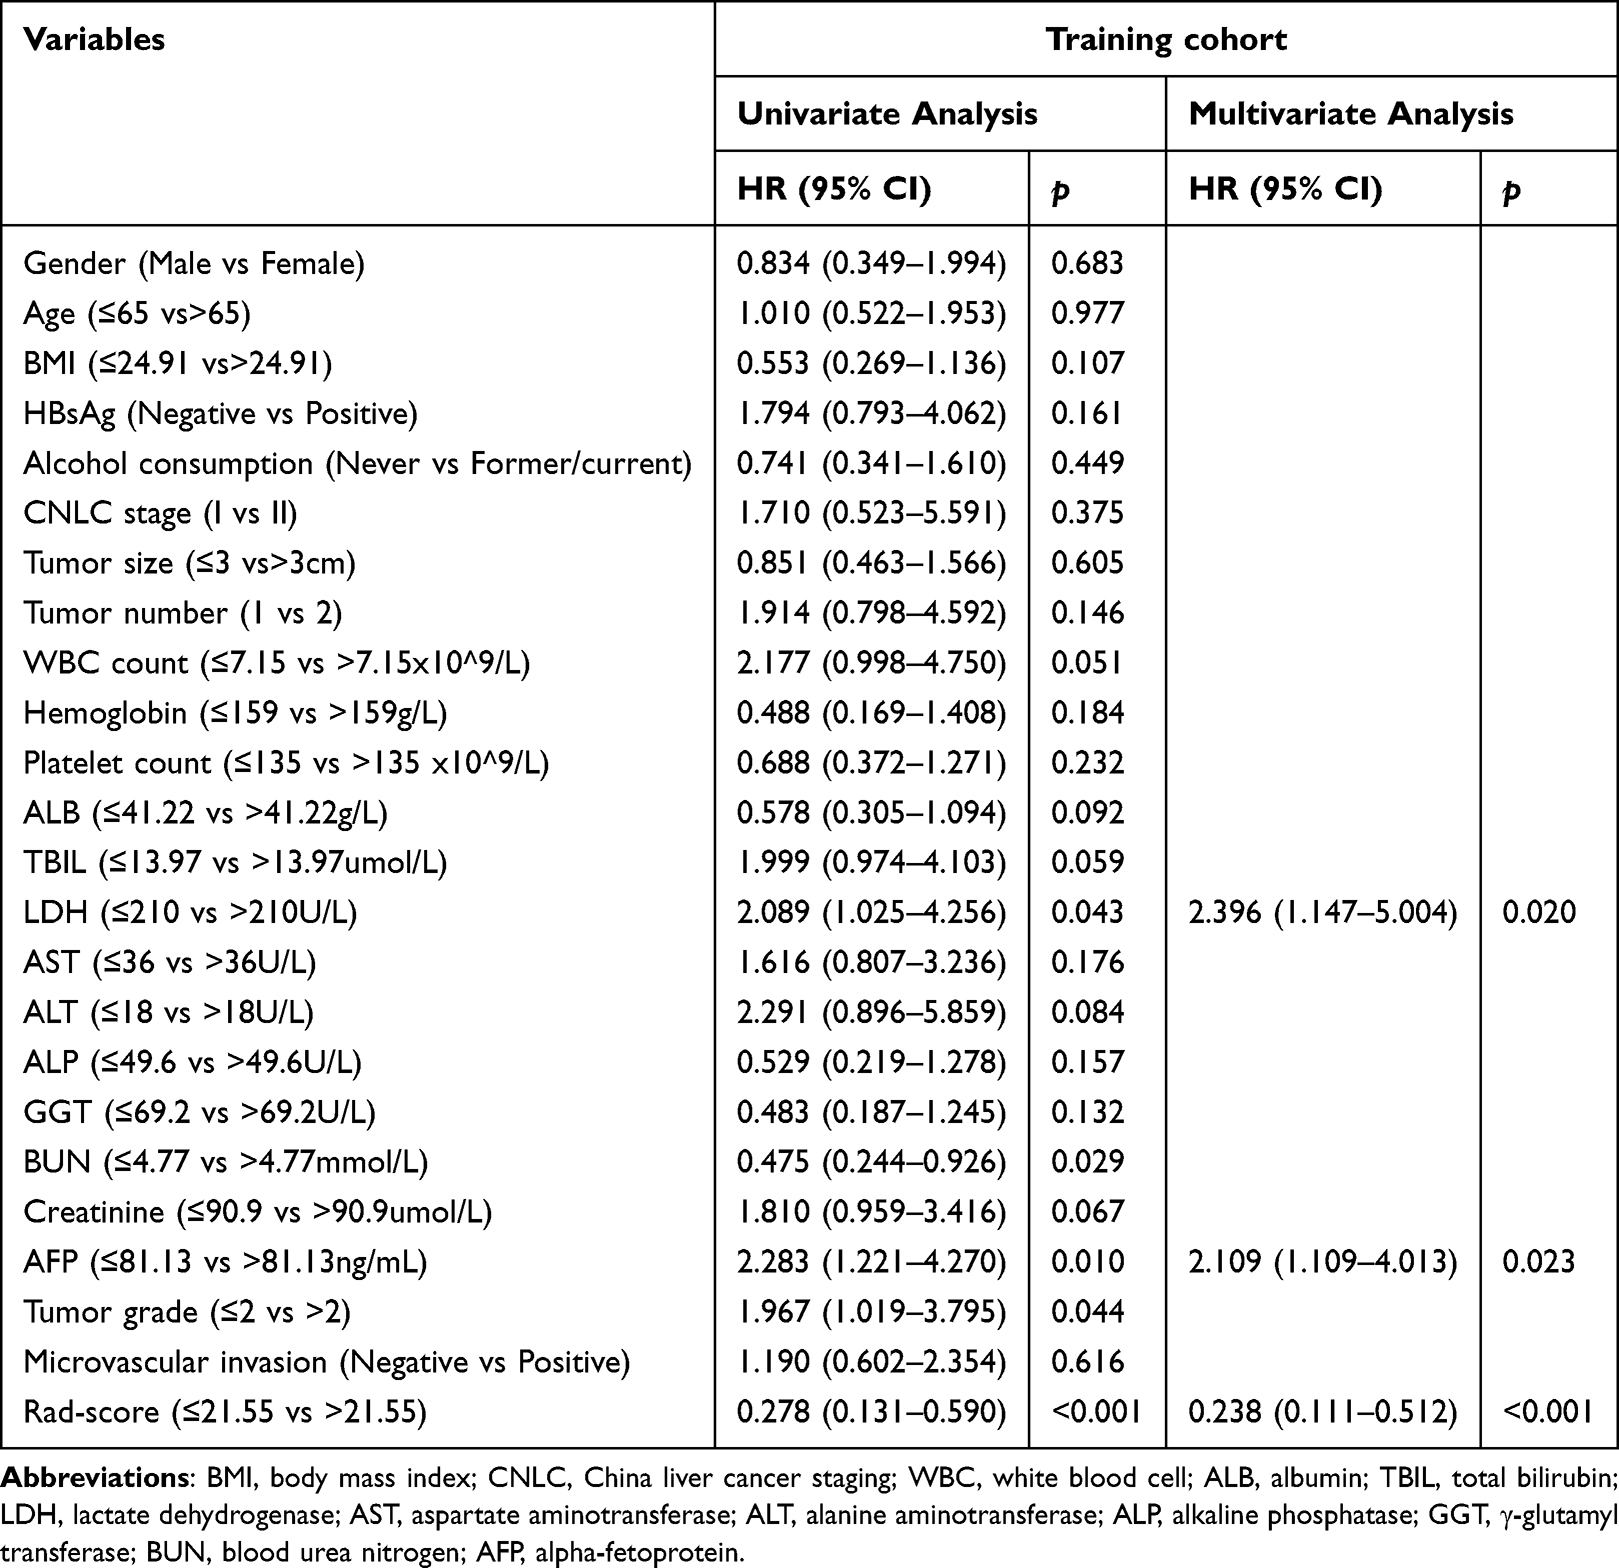 |
Table 2 RFS-Related Univariate and Multivariate Analysis in the Training Group |
Low Rad-Score, High LDH and AFP Correlated with Poor RFS
LDH>210U/L was significantly correlated with shorter median RFS in both the training set (median RFS [95% CI] for high versus low: 28.0 [13.1–43.0] versus 50.9 [44.9–56.9] months; p=0.038, Figure 2a) and validation set (median RFS [95% CI] for high versus low: 17.6 [0–35.8] versus 48.1 [21.5–74.7] months; p<0.001, Figure 2e). Similarly, AFP>81.13ng/mL likewise significantly shortened median RFS in both training set (28.0 [4.9–51.2] versus 50.9 [44.9–56.9] months, p=0.008, Figure 2b) and validation set (24.4 [2.1–46.6] versus 35.9 [10.8–61.0] months, p<0.001, Figure 2f). In contrast, the median RFS was significantly prolonged in patients with Rad-score>21.55 in both training set (median RFS [95% CI] for high versus low: 86.2 [42.1–130.4] versus 25.3 [18.0–32.6] months, p<0.001, Figure 2c) and the validation set (51.9 [31.2–72.6] versus 24.4 [14.5–34.2] months, p=0.013, Figure 2g). The combined LDH, AFP, and Rad-score were used to categorize patients into four groups of low risk, medium risk, high risk, and extremely high risk, and the median RFS of the four groups were 88.0 months, 34.7 months, 20.7 months, and 4.3 months (p<0.001, Figure 2d) in the training set and 53.9 months, 30.2 months, 24.0 months, and 1.7 months (p<0.001, Figure 2h) in the validation set, respectively.
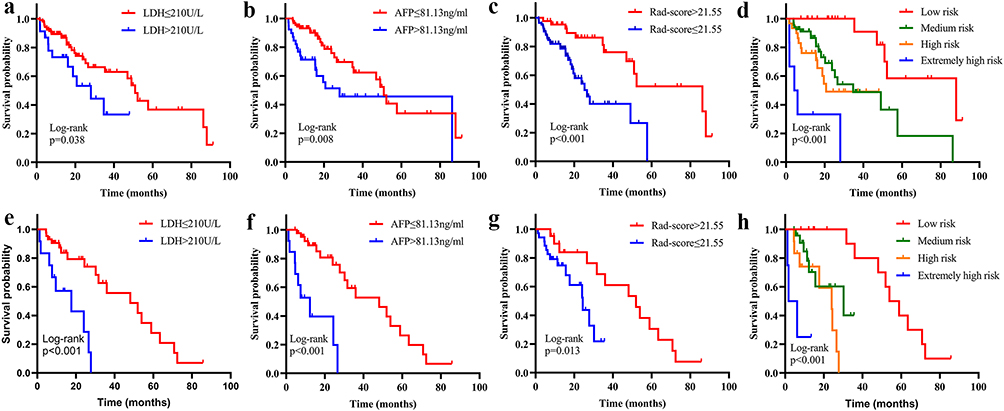 |
Figure 2 RFS curves based on LDH (a), AFP (b), Rad-score (c), and combined prediction models (d) in the training set. RFS curves in the validation set based on LDH (e), AFP (f), Rad-score (g), and the combined prediction model (h). |
All these results suggested that Rad-score, LDH, and AFP were independent prognostic factors of postoperative recurrence in early-stage HCC patients. Patients with a low Rad-score, high LDH, or high AFP levels had a higher recurrence rate.
Predictive Performance of the Model
To compare the predictive performance of different models, we plotted ROC curves based on the results of the multivariate analysis. The area under the curve (AUC) for predicting 1, 2, and 3 years RFS in patients with a single LDH was 0.583 (95% CI: 0.461–0.705), 0.549 (95% CI: 0.442–0.656), and 0.613 (95% CI: 0.504–0.721) in the training set (Figure 3a) and 0.655 (95% CI: 0.484–0.826), 0.643 (95% CI: 0.477–0.808), and 0.716 (95% CI: 0.600–0.833) in the validation set (Figure 3e), respectively. In the training group, the model had a C-index of 0.569 (95% CI: 0.489–0.650), whereas in the validation group, it was 0.648 (95% CI: 0.539–0.757).
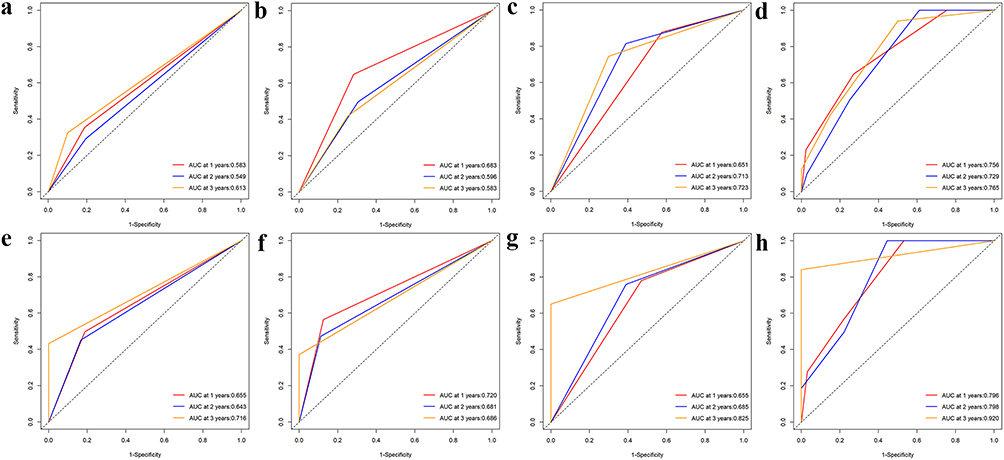 |
Figure 3 The ROC curves demonstrated the predictive performance of the LDH (a–e), AFP (b–f), Rad-score (c–g), and composite models (d–h) in the training and validation sets. |
Figure 3b and f illustrated the AFP predicted AUC for 1, 2, and 3 years RFS. It predicted 1, 2, and 3 years RFS with AUC of 0.683 (95% CI: 0.560–0.807), 0.596 (95% CI: 0.475–0.716), and 0.583 (95% CI: 0.455–0.712) in the training set (Figure 3b) and 0.720 (95% CI: 0.552–0.887), 0.681 (95% CI: 0.523–0.838) and 0.686 (95% CI: 0.577–0.795) in the validation set (Figure 3f), respectively. The C-index was 0.636 (95% CI: 0.549–0.723) and 0.709 (95% CI: 0.610–0.809) in both groups.
The radiomics-constructed Rad-score was used to predict RFS in patients, and 0.651 (95% CI: 0.556–0.746), 0.713 (95% CI: 0.604–0.823) and 0.723 (95% CI: 0.590–0.855) were the AUC for predicting 1, 2, and 3 years RFS in the training set (Figure 3c), respectively. The AUC results for predicting the 1, 2, and 3 years RFS in the validation set (Figure 3g) was 0.655 (95% CI: 0.495–0.816), 0.685 (95% CI: 0.519–0.851), and 0.825 (95% CI: 0.710–0.941), respectively. The C-index was 0.634 (95% CI: 0.570–0.698) and 0.627 (95% CI: 0.541–0.712) in both groups.
The composite model constructed by combining the above three factors, including LDH, AFP, and Rad-score, predicted AUC values of 0.756 (95% CI: 0.648–0.865), 0.729 (95% CI: 0.618–0.840) and 0.765 (95% CI: 0.633–0.897) for 1, 2 and 3 years RFS in the training set (Figure 3d). In the validation set (Figure 3h), for the predictive ability of 1, 2 and 3 years RFS, the composite model achieved AUC values of 0.796 (95% CI: 0.666–0.927), 0.798 (95% CI: 0.654–0.942) and 0.920 (95% CI: 0.822–1.019). The C-index for the two groups was 0.718 (95% CI: 0.637–0.798) and 0.787 (95% CI: 0.704–0.870), respectively.
The above results showed that the combined Rad-score based prediction model had higher AUC values and C-index than the single LDH, AFP, or Rad-score model in its ability to predict 1, 2, and 3 years RFS, which suggested that the integrated prediction model had better predictive performance. Tables 3 and 4 listed and compared the AUC values and C-index of the different models in the training and validation sets.
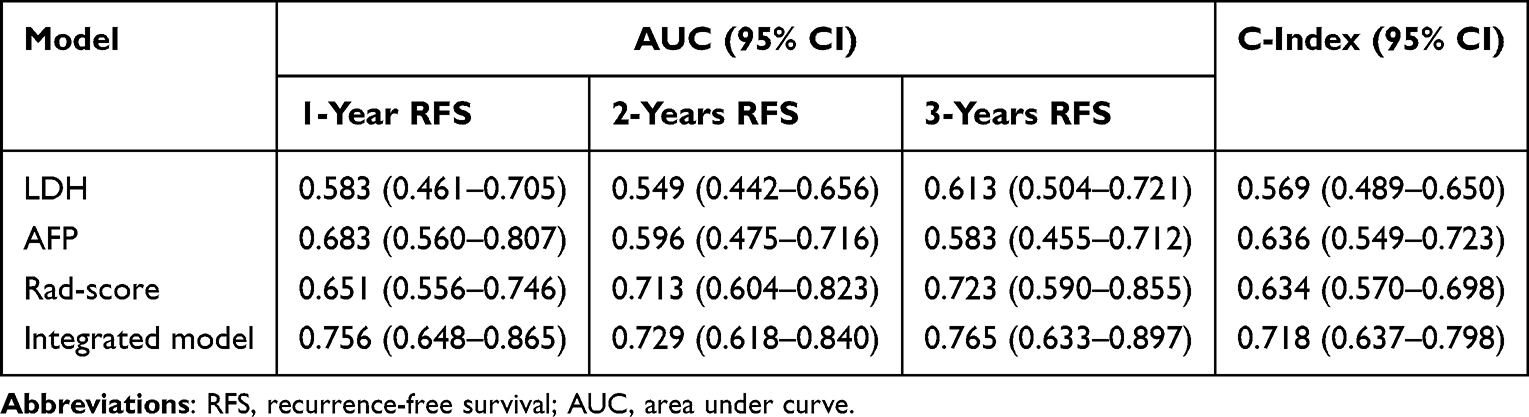 |
Table 3 Predictive Performance of the Four Models in the Training Group for RFS |
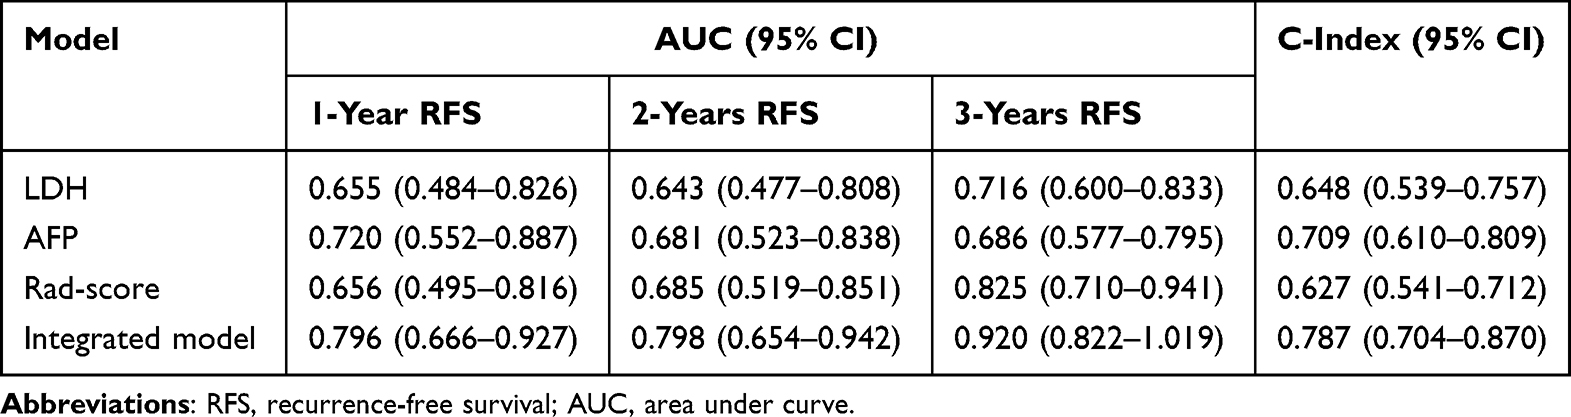 |
Table 4 Predictive Performance of the Four Models in the Validation Group for RFS |
Creation and Validation of a Nomogram Model
Based on the results of the multivariate analysis, we constructed a Rad-score based nomogram model to predict the risk of postoperative recurrence in patients with early-stage HCC (Figure 4). In this model, each variable had a weighting point representing the risk of recurrence. Patients with a high total score have a better prognosis, indicating a lower risk of recurrence. The calibration curve showed that the predicted 2 years RFS and actual 2 years RFS were extremely close in both the training (Figure 5a) and validation (Figure 5b) sets. These results indicated that the nomogram model was effective in predicting postoperative recurrence.
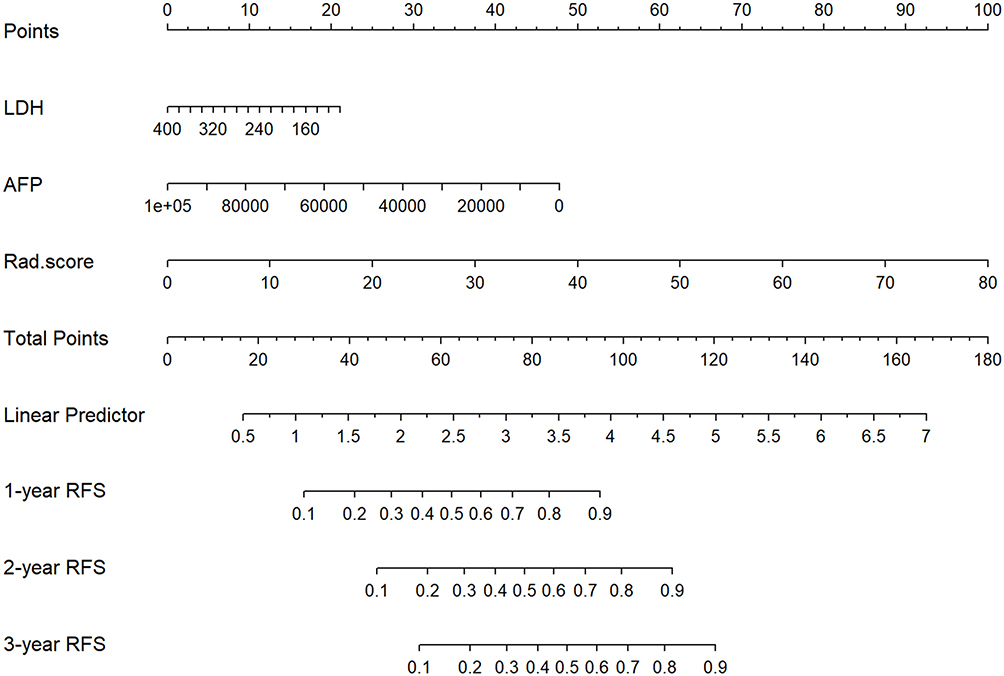 |
Figure 4 Development of Rad-score based nomogram model for recurrence. |
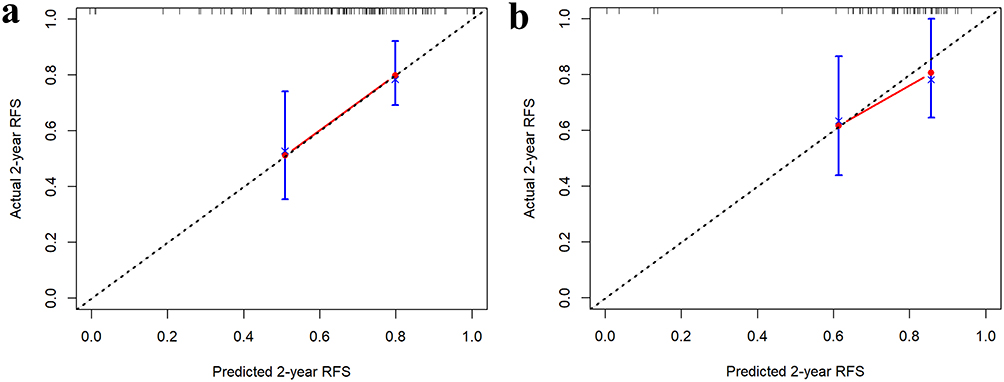 |
Figure 5 (a) Calibration curves for 2 years RFS in the training set. (b) Calibration curves for 2 years RFS in the validation set. |
Discussion
In this study, a CT radiomics features-based Rad-score was established to predict the RFS of patients with early-stage HCC treated with curative resection. In this procedure, the ICC was first identified after inter-observer testing, followed by feature selection and reduction using LASSO regression and 10-fold cross-validation. The Rad-score calculated on the basis of non-zero coefficients and selected features could effectively categorize patients into high- and low-risk groups. We also incorporated clinical and biochemical indicators and constructed a Rad-score-based comprehensive prediction model using COX proportional hazards regression analysis. The model categorized the patients into four groups with different risks of recurrence.
Radiomics is a promising technique for extracting quantitative features from medical images and transforming them into diggable data. This enables the identification of important imaging biomarkers that cannot be detected by the visual eye.14 In a study by San Zhang et al, a novel deep learning radiomics model based on contrast-enhanced CT was constructed to predict early recurrence in HCC patients treated with liver resection, with AUC values of 0.71 and 0.73 for the training and validation sets, respectively.15 Similarly, the Rad-score identified in our study could be used to predict recurrence in patients with AUCs of 0.651–0.825 for predicting 1, 2, and 3 years RFS. In addition, Lee IC et al16 and Zheng B-H et al17 evaluated the role of CT-based radiomics in predicting postoperative recurrence in patients with early stage HCC. However, when outlining the ROI, only the largest dimension of the tumor was outlined, which may not be sufficient to reflect the overall characteristics of the tumor. In our study, we outlined the entire tumor layer by layer, which more comprehensively reflected the heterogeneous characteristics of the tumor. Gao W et al combined deep learning and radiomics to construct an MRI-based comprehensive model, which also had a better prediction performance for early recurrence.18 However, this model did not incorporate clinical factors. In our current study, we incorporated clinical and biochemical parameters and constructed predictive models using COX proportional hazards regression. We identified LDH, AFP, and Rad-score as independent prognostic factors for postoperative recurrence in patients with early-stage HCC.
LDH is one of the most common biochemical markers in clinical practice, and elevated LDH levels are frequently observed in patients with malignant tumors.19 A distinguishing feature of cancer cells is that even in the absence of oxygen, they often transform pyruvate into lactate, a process known as the Warburg effect. LDH is a key enzyme involved in this process. A number of studies have shown that high levels of serum LDH are associated with a poorer prognosis in patients with various cancers.20–25 Our study yielded similar results, with significantly shorter RFS in patients with LDH>210U/L in both training and validation sets.
AFP, the first placental biomarker identified in patients with HCC, is a major tool for the detection and longitudinal monitoring of patients with HCC.26,27 Elevated AFP levels showed a correlation with poor prognosis in different clinical settings.28,29 At the same time, baseline AFP levels had been shown to be effective in prognostic survival outcomes in both local and systemic treatment modalities.30,31 Therefore, in our study, we included AFP at the baseline level of patients, and the result showed that AFP was an independent predictor of RFS and patients with AFP>81.13ng/mL had a significantly shorter RFS.
A nomogram, also known as a column chart, is a graphical computational tool used to predict the probability of a particular event by integrating the effects of multiple variables into a single numerical score. Many previous studies have constructed nomogram models based on clinical characteristics to predict recurrence or survival outcomes.32,33 In addition, recent studies have combined radiomics, clinical characteristics and hematological parameters to construct nomogram predictive models.34–36 For instance, Lu W et al constructed a prediction model based on MRI radiomics and clinical characteristics, which effectively predicted progression-free survival, overall survival, and objective response rate to chemoimmunotherapy in pancreatic cancer patients with liver metastases.35 In our current study, we developed a postoperative nomogram to predict RFS by combining the Rad-score, LDH, and AFP. The calibration curves suggested excellent agreement between the predicted and observed results.
In recent years, the topic of discussion has arisen as to whether high-risk patients vulnerable to early tumor recurrence should be treated with postoperative adjuvant therapy. Cancer cells differ from normal cells in physical properties. By taking advantage of these differences, new methods for more precise, low-toxicity and efficient cancer diagnosis and treatment can be developed.37 There are no internationally standardized protocols or criteria for the selection of individual indications for postoperative adjuvant therapy. However, it is not rigorous to administer adjuvant therapy to patients with only one risk factor. The comprehensive prediction model that we constructed integrates different risk factors and provides a basis for clinicians’ treatment decisions.
As this was a single-center retrospective study, it was impossible to completely eliminate patient selection bias despite the larger sample size. This may limit the generalizability of the findings to some extent. In the future, we intend to conduct a multicenter, large-scale prospective study to verify the results of this study.
Conclusion
In this study, we constructed a radiomics-based integrated prediction model that incorporated not only radiomic features but also two biochemical parameters, LDH and AFP. The AUC values, C-index, and calibration curves showed that our model had excellent predictive performance and accurately predicted the risk of recurrence after curative resection for early-stage HCC. By utilizing this predictive model, clinicians can more accurately predict a patient’s risk of postoperative recurrence and develop individualized treatment plans to prolong survival and improve patient quality of life.
Abbreviations
AFP, alpha-fetoprotein; ALB, albumin; ALT, alanine aminotransferase; ALP, alkaline phosphatase; AST, aspartate aminotransferase; AUC, area under the curve; BMI, body mass index; BUN, blood urea nitrogen; C-index, Harrell’s concordance index; CNLC, China liver cancer staging; CI, confidence interval; GGT, γ-glutamyl transferase; HCC, hepatocellular carcinoma; HR, hazard ratio; ICC, inter-class correlation coefficient; LASSO, least absolute shrinkage and selection operator; LDH, lactate dehydrogenase; MRI, magnetic resonance imaging; MSE, mean square error; RFS, recurrence-free survival; ROC, receiver operating characteristic; ROI, regions of interest; TBIL, total bilirubin; WBC, white blood cell.
Data Sharing Statement
The datasets used and analyzed during the current study are available from the corresponding author upon reasonable request.
Ethics Approval and Consent to Participate
The study was endorsed by the ethical review committee of the Affiliated Hospital of Qingdao University (QYFY WZLL 29667), and the requirement for informed consent was waived due to the retrospective nature. We confirmed that the data was anonymized or maintained with confidentiality and compliance with the Declaration of Helsinki.
Consent for Publication
All the authors agreed to publish the article.
Author Contributions
All authors made a significant contribution to the work reported, whether that is in the conception, study design, execution, acquisition of data, analysis and interpretation, or in all these areas; took part in drafting, revising or critically reviewing the article; gave final approval of the version to be published; have agreed on the journal to which the article has been submitted; and agree to be accountable for all aspects of the work.
Funding
The study was supported by Qingdao Key Clinical Specialty Elite Discipline, Zhongguancun Precision Medicine Foundation (No.GXZDH90) and Beijing Xisike Clinical Oncology Research Foundation (Grant No.Y2019-AZZD-0471).
Disclosure
The authors declare that they have no competing interests in this work.
References
1. Rumgay H, Arnold M, Ferlay J, et al. Global burden of primary liver cancer in 2020 and predictions to 2040. J Hepatol. 2022;77(6):1598–1606. doi:10.1016/j.jhep.2022.08.021
2. Reig M, Forner A, Rimola J, et al. BCLC strategy for prognosis prediction and treatment recommendation: the 2022 update. J Hepatol. 2022;76(3):681–693. doi:10.1016/j.jhep.2021.11.018
3. Tabrizian P, Jibara G, Shrager B, Schwartz M, Roayaie S. Recurrence of hepatocellular cancer after resection: patterns, treatments, and prognosis. Ann Surg. 2015;261(5):947–955. doi:10.1097/SLA.0000000000000710
4. Shim JH, Jun M-J, Han S, et al. Prognostic nomograms for prediction of recurrence and survival after curative liver resection for hepatocellular carcinoma. Ann Surg. 2015;261(5):939–946. doi:10.1097/SLA.0000000000000747
5. Zhang Z-J, Wei B-J, Liu Z-K, Xuan Z-F, Zhou L, Zheng -S-S. Nomogram for prediction of hepatocellular carcinoma recurrence after liver resection. Hepatobiliary Pancreat Dis Int. 2024;24(3):269–276. doi:10.1016/j.hbpd.2024.09.006
6. Lambin P, Rios-Velazquez E, Leijenaar R, et al. Radiomics: extracting more information from medical images using advanced feature analysis. Eur J Cancer. 2012;48(4):441–446. doi:10.1016/j.ejca.2011.11.036
7. Bo Z, Song J, He Q, et al. Application of artificial intelligence radiomics in the diagnosis, treatment, and prognosis of hepatocellular carcinoma. Comput Biol Med. 2024;173:108337. doi:10.1016/j.compbiomed.2024.108337
8. Zhang K, Zhang L, Li W-C, et al. Radiomics nomogram for the prediction of microvascular invasion of HCC and patients’ benefit from postoperative adjuvant TACE: a multi-center study. Eur Radiol. 2023;33(12):8936–8947. doi:10.1007/s00330-023-09824-5
9. Feng Z, Li H, Liu Q, et al. CT radiomics to predict macrotrabecular-massive subtype and immune status in hepatocellular carcinoma. Radiology. 2023;307(1):e221291. doi:10.1148/radiol.221291
10. Hua Y, Sun Z, Xiao Y, et al. Pretreatment CT-based machine learning radiomics model predicts response in unresectable hepatocellular carcinoma treated with lenvatinib plus PD-1 inhibitors and interventional therapy. J Immunother Cancer. 2024;12(7):e008953. doi:10.1136/jitc-2024-008953
11. Peng W, Jiang X, Zhang W, Hu J, Zhang Y, Zhang L. A radiomics-based model can predict recurrence-free survival of hepatocellular carcinoma after curative ablation. Asian J Surg. 2023;46(7):2689–2696. doi:10.1016/j.asjsur.2022.09.130
12. Moura Cunha G, Chernyak V, Fowler KJ, Sirlin CB. Up-to-date role of CT/MRI LI-RADS in hepatocellular carcinoma. J Hepatocell Carcinoma. 2021;8:513–527. doi:10.2147/JHC.S268288
13. Camp RL, Dolled-Filhart M, Rimm DL. X-tile: a new bio-informatics tool for biomarker assessment and outcome-based cut-point optimization. Clin Cancer Res. 2004;10(21):7252–7259. doi:10.1158/1078-0432.CCR-04-0713
14. Dana J, Venkatasamy A, Saviano A, et al. Conventional and artificial intelligence-based imaging for biomarker discovery in chronic liver disease. Hepatol Int. 2022;16(3):509–522. doi:10.1007/s12072-022-10303-0
15. Kinoshita M, Ueda D, Matsumoto T, et al. Deep learning model based on contrast-enhanced computed tomography imaging to predict postoperative early recurrence after the curative resection of a solitary hepatocellular carcinoma. Cancers. 2023;15(7):2140. doi:10.3390/cancers15072140
16. Lee IC, Huang J-Y, Chen T-C, et al. Evolutionary learning-derived clinical-radiomic models for predicting early recurrence of hepatocellular carcinoma after resection. Liver Cancer. 2021;10(6):572–582. doi:10.1159/000518728
17. Zheng B-H, Liu L-Z, Zhang -Z-Z, et al. Radiomics score: a potential prognostic imaging feature for postoperative survival of solitary HCC patients. BMC Cancer. 2018;18(1):1148. doi:10.1186/s12885-018-5024-z
18. Gao W, Wang W, Song D, et al. A predictive model integrating deep and radiomics features based on gadobenate dimeglumine-enhanced MRI for postoperative early recurrence of hepatocellular carcinoma. Radiol Med. 2022;127(3):259–271. doi:10.1007/s11547-021-01445-6
19. Claps G, Faouzi S, Quidville V, et al. The multiple roles of LDH in cancer. Nat Rev Clin Oncol. 2022;19(12):749–762. doi:10.1038/s41571-022-00686-2
20. Dercle L, Ammari S, Roblin E, et al. High serum LDH and liver metastases are the dominant predictors of primary cancer resistance to anti-PD(L)1 immunotherapy. Eur J Cancer. 2022;177:80–93. doi:10.1016/j.ejca.2022.08.034
21. Tjokrowidjaja A, Lord SJ, John T, et al. Pre- and on-treatment lactate dehydrogenase as a prognostic and predictive biomarker in advanced non-small cell lung cancer. Cancer. 2022;128(8):1574–1583. doi:10.1002/cncr.34113
22. Qiu X, Shi Z, Tong F, et al. Biomarkers for predicting tumor response to PD-1 inhibitors in patients with advanced pancreatic cancer. Hum Vaccin Immunother. 2023;19(1):2178791. doi:10.1080/21645515.2023.2178791
23. R DC-P, Martín-Carnicero A, González-Marcos A, Martínez A. New model to predict survival in advanced pancreatic ductal adenocarcinoma patients by measuring GGT and LDH levels and monocyte count. Front Oncol. 2024;14:1411096. doi:10.3389/fonc.2024.1411096
24. Ding H, Yuan M, Yang Y, Gupta M, Xu XS. Evaluating prognostic value of dynamics of circulating lactate dehydrogenase in colorectal cancer using modeling and machine learning. Clin Pharmacol Ther. 2024;115(4):805–814. doi:10.1002/cpt.3052
25. Liu Y, Pan Z, Wang X, Tian Y, Zhu S, Wang X. Clinical significance of serum lactate dehydrogenase combined with a multivariate model for predicting the near-term outcome of primary nasopharyngeal carcinoma. Life Sci. 2024;351:122856. doi:10.1016/j.lfs.2024.122856
26. Wei Z, Zhang Y, Lu H, Ying J, Zhao H, Cai J. Serum alpha-fetoprotein as a predictive biomarker for tissue alpha-fetoprotein status and prognosis in patients with hepatocellular carcinoma. Transl Cancer Res. 2022;11(4):669–677. doi:10.21037/tcr-21-2334
27. Tayob N, Kanwal F, Alsarraj A, Hernaez R, El-Serag HB. The Performance of AFP, AFP-3, DCP as biomarkers for detection of hepatocellular carcinoma (HCC): a phase 3 biomarker study in the United States. Clin Gastroenterol Hepatol. 2023;21(2):415–423.e4. doi:10.1016/j.cgh.2022.01.047
28. Mazzaferro V, Sposito C, Zhou J, et al. Metroticket 2.0 model for analysis of competing risks of death after liver transplantation for hepatocellular carcinoma. Gastroenterology. 2018;154(1):128–139. doi:10.1053/j.gastro.2017.09.025
29. Yang Z, Fu Y, Wang Q, et al. Dynamic changes of serum α-fetoprotein predict the prognosis of bevacizumab plus immunotherapy in hepatocellular carcinoma. Int J Surg. 2024;111(1):751–60.
30. Bruix J, Qin S, Merle P, et al. Regorafenib for patients with hepatocellular carcinoma who progressed on sorafenib treatment (RESORCE): a randomised, double-blind, placebo-controlled, phase 3 trial. Lancet. 2017;389(10064):56–66. doi:10.1016/S0140-6736(16)32453-9
31. Lee DH, Lee JM, Lee JY, et al. Radiofrequency ablation of hepatocellular carcinoma as first-line treatment: long-term results and prognostic factors in 162 patients with cirrhosis. Radiology. 2014;270(3):900–909. doi:10.1148/radiol.13130940
32. He Y, Luo L, Shan R, et al. Development and validation of a nomogram for predicting postoperative early relapse and survival in hepatocellular carcinoma. J Natl Compr Canc Netw. 2023;22(1D):e237069. doi:10.6004/jnccn.2023.7069
33. Wan M, Zhang W, Huang H, et al. Development and validation of a novel prognostic nomogram for advanced diffuse large B cell lymphoma. Clin Exp Med. 2024;24(1):64. doi:10.1007/s10238-024-01326-y
34. Cui J, Zhang D, Gao Y, et al. CT-based radiomics combined with hematologic parameters for survival prediction in locally advanced esophageal cancer patients receiving definitive chemoradiotherapy. Insights Imaging. 2024;15(1):87. doi:10.1186/s13244-024-01647-2
35. Lu W, Wu G, Miao X, et al. The radiomics nomogram predicts the prognosis of pancreatic cancer patients with hepatic metastasis after chemoimmunotherapy. Cancer Immunol Immunother. 2024;73(5):87. doi:10.1007/s00262-024-03644-2
36. Du Y, Cai M, Zha H, et al. Ultrasound radiomics-based nomogram to predict lymphovascular invasion in invasive breast cancer: a multicenter, retrospective study. Eur Radiol. 2024;34(1):136–148. doi:10.1007/s00330-023-09995-1
37. Sharma R, Malviya R. Modifying the electrical, optical, and magnetic properties of cancer cells: a comprehensive approach for cancer management. Med Adv. 2024;2(1):3–19. doi:10.1002/med4.51
 © 2025 The Author(s). This work is published and licensed by Dove Medical Press Limited. The
full terms of this license are available at https://www.dovepress.com/terms
and incorporate the Creative Commons Attribution
- Non Commercial (unported, 4.0) License.
By accessing the work you hereby accept the Terms. Non-commercial uses of the work are permitted
without any further permission from Dove Medical Press Limited, provided the work is properly
attributed. For permission for commercial use of this work, please see paragraphs 4.2 and 5 of our Terms.
© 2025 The Author(s). This work is published and licensed by Dove Medical Press Limited. The
full terms of this license are available at https://www.dovepress.com/terms
and incorporate the Creative Commons Attribution
- Non Commercial (unported, 4.0) License.
By accessing the work you hereby accept the Terms. Non-commercial uses of the work are permitted
without any further permission from Dove Medical Press Limited, provided the work is properly
attributed. For permission for commercial use of this work, please see paragraphs 4.2 and 5 of our Terms.