")
Back to Journals » Pharmacogenomics and Personalized Medicine » Volume 15
Prediction of Tacrolimus Dose/Weight-Adjusted Trough Concentration in Pediatric Refractory Nephrotic Syndrome: A Machine Learning Approach
Authors Mo X, Chen X, Wang X, Zhong X, Liang H, Wei Y, Deng H, Hu R, Zhang T, Chen Y, Gao X, Huang M, Li J
Received 14 September 2021
Accepted for publication 20 January 2022
Published 22 February 2022 Volume 2022:15 Pages 143—155
DOI https://doi.org/10.2147/PGPM.S339318
Checked for plagiarism Yes
Review by Single anonymous peer review
Peer reviewer comments 2
Editor who approved publication: Dr Martin H Bluth
Xiaolan Mo,1,2,* Xiujuan Chen,3,* Xianggui Wang,2,* Xiaoli Zhong,2 Huiying Liang,3 Yuanyi Wei,1 Houliang Deng,1 Rong Hu,1 Tao Zhang,1 Yilu Chen,1 Xia Gao,4 Min Huang,2 Jiali Li2
1Department of Pharmacy, Guangzhou Women and Children’s Medical Center, Guangzhou Medical University, Guangzhou, 510623, People’s Republic of China; 2Institute of Clinical Pharmacology, School of Pharmaceutical Sciences, Sun Yat-sen University, Guangzhou, 510080, People’s Republic of China; 3Department of clinical Data Center, Guangdong Provincial People’s Hospital, Guangdong Academy of Medical Sciences, Guangzhou, 510080, People’s Republic of China; 4Division of Nephrology, Guangzhou Women and Children’s Medical Center, Guangzhou Medical University, Guangzhou, 510623, People’s Republic of China
*These authors contributed equally to this work
Correspondence: Jiali Li; Min Huang, Tel +86-20-39943034 ; +86-20-39943011, Fax +86-20-39943004 ; +86-20-39943000, Email [email protected]; [email protected]
Purpose: Tacrolimus (TAC) is a first-line immunosuppressant for patients with refractory nephrotic syndrome (NS). However, there is a high inter-patient variability of TAC pharmacokinetics, thus therapeutic drug monitoring (TDM) is required. In this study, we aimed to employ machine learning algorithms to investigate the impact of clinical and genetic variables on the TAC dose/weight-adjusted trough concentration (C0/D) in Chinese children with refractory NS, and then develop and validate the TAC C0/D prediction models.
Patients and Methods: The association of 82 clinical variables and 244 single nucleotide polymorphisms (SNPs) with TAC C0/D in the third month since TAC treatment was examined in 171 children with refractory NS. Extremely randomized trees (ET), gradient boosting decision tree (GBDT), random forest (RF), extreme gradient boosting (XGBoost), and Lasso regression were carried out to establish and validate prediction models, respectively. The best prediction models were validated on a cohort of 30 refractory NS patients.
Results: GBDT algorithm performed best in the whole group (R2=0.444, MSE=591.032, MAE=20.782, MedAE=18.980) and CYP3A5 nonexpresser group (R2=0.264, MSE=477.948, MAE=18.119, MedAE=18.771), while ET algorithm performed best in the CYP3A5 expresser group (R2=0.380, MSE=1839.459, MAE=31.257, MedAE=19.399). These prediction models included 3 clinical variables (ALB0, AGE0, and gender) and 10 SNPs (ACTN4 rs3745859, ACTN4 rs56113315, ACTN 4 rs62121818, CTLA4 rs4553808, CYP3A5 rs776746, IL2RA rs12722489, INF2 rs1128880, MAP3K11 rs7946115, MYH9 rs2239781, and MYH9 rs4821478).
Conclusion: The association between the clinical and genetic variables and TAC C0/D was described, and three TAC C0/D prediction models integrating clinical and genetic variables were developed and validated using machine learning, which may support individualized TAC dosing.
Keywords: tacrolimus, nephrotic syndrome, machine learning, prediction model, genetic polymorphism
Introduction
Nephrotic syndrome (NS) is a common chronic disease in children, with clinical manifestations of proteinuria, hypoproteinemia, hyperlipidemia, and edema. Tacrolimus (TAC, also known as FK506), a calcineurin inhibitor, is the first-line immunosuppressant for patients with refractory NS. The pharmacokinetics (PK) characteristics of TAC are its low and variable oral bioavailability (4~89%) and extensive binding to red blood cells. TAC is a substrate of cytochrome P450 (CYP) 3A and P-glycoprotein (P-gp), and it is mainly excreted as metabolites (approximately 99%) via biliary route.1 However, it is difficult to develop an individualized TAC dosing regimen for patients due to the narrow therapeutic window and large interindividual pharmacokinetic variability. Therapeutic drug monitoring (TDM) is required to individually adjust the TAC dose. Therefore, identifying the key factors that affect TAC PK, developing a prediction model, and achieving individualized medication is of great significance.
Interindividual differences in drug disposition and response are mainly related to genetic polymorphisms in drug-metabolizing enzymes, transporters, receptors, and other drug targets.2 TAC is mainly metabolized by CYP3A, and it is a substrate of P-gp.1 Most previous studies on TAC focused on the genetic polymorphisms of TAC PK pathway-related genes (CYP3A, MDR1, etc.) and transcriptional factor coding genes (POR, NR1I2, etc.).3–5 And CYP3A5*3 (rs776746) is the only confirmed single nucleotide polymorphisms (SNPs) affecting TAC PK.6 However, CYP3A5*3 cannot fully explain the individual variations in TAC PK. On the other hand, due to the high plasma protein binding rate of TAC, physiologic function of the kidneys may also contribute to TAC interindividual variability. Alpha-actinin-4 (encoded by ACTN4) is critical for renal filtration barrier, and its mutations may cause kidney damage.7,8 And previous studies on MYH9 (encodes non-muscle myosin II) have shown that changes in MYH9 expression may damage the glomerular filtration barrier.9,10 Therefore, the genetic polymorphisms on ACTN4 and MYH9 may also affect the concentration of TAC.11 Furthermore, most previous studies on individualized drug therapy of TAC were investigated in transplant patients, and studies on pediatric patients with NS are limited.3–5,12 Thus, it is necessary to investigate the impact of those genetic polymorphisms on TAC concentration in refractory NS children, to clarify the reasons for the large individual variations in TAC PK.
Developing a prediction model could provide doctors with reliable and convenient drug administration decision support. However, only several studies have developed TAC population pharmacokinetic (PPK) models for pediatric refractory NS. Wang et al developed a TAC PPK model based on age, cystatin-C, and the daily dose of TAC,13 whereas Hao et al found that body weight and CYP3A5 significantly affected TAC PK.14 However, Wang et al did not investigate the effect of genetic polymorphisms and Hao et al have only investigated the effect of CYP3A5, which did not fully explain the individual differences in TAC PK. These limitations reduce the accuracy of the models and limit their clinical application. Thus, a simple and accurate TAC concentration prediction model based on pediatric NS is urgently needed to provide a reference for clinicians to make a drug delivery regimen. In recent years, the prediction models based on machine learning have excellent performance in the diagnosis, treatment, and prognosis of diseases.15–17 Tang et al have developed machine-learning models to predict TAC stable dose in renal transplant recipients, and their performance is better than that of traditional statistical methods.18 However, there has been no research on the prediction of the TAC concentration in NS patients using machine learning.
Therefore, the purpose of this study is to investigate the effects of clinical features and genetic polymorphisms on TAC dose/weight-adjusted trough concentration (C0/D) in pediatric patients with refractory NS, and then use machine learning algorithms to develop a simple and accurate TAC C0/D prediction model to provide a powerful tool for the individualized drug therapy of TAC in pediatric patients with refractory NS.
Materials and Methods
Study Design and Patients
We retrospectively included patients who visited Guangzhou Women and Children’s Medical Center from June 2013 to December 2018 as a derivation cohort, which was used to develop the prediction model. We also prospectively collected some patients as a verification cohort to test the validity of the model.
Patients under 16 years of age, who were diagnosed with refractory NS (including steroid-dependent NS, steroid-resistant NS, and frequent relapses NS) and took TAC orally for at least 3 months were included in the study. Patients with steroid-sensitive NS and with poor compliance were excluded. Those receiving medication affecting TAC blood levels (verapamil, ketoconazole, rifampicin, Wuzhi tablet, etc.) were also excluded. All patients received TAC (Prograg™, Astellas, Killorglin, Ireland) and prednisone (Guangdong Huanan Pharmacy Ltd., Dongguan, China). The initial dose of TAC is 0.10–0.15 mg/kg twice daily, and doses were adjusted according to TDM.
This study, designed in accordance with the requirements of the Declaration of Helsinki, was approved by the Ethics Committee of Guangzhou Women and Children Medical Center (No. 201509), and it was registered at ClinicalTrials.gov (NCT02602873). Informed consent was signed by the patients’ parents or guardians. Additionally, the data used in this study were anonymous.
Clinical and Genetic Variables
We collected 82 clinical variables, including demographic data (eg age, gender), hematological characteristics (eg trough concentration, albumin level), urine features (eg urinary protein, urine red blood cells), medication data (eg Wuzhi tablet, ketoconazole), etc. (see Table S1 in Supplementary). Genetic variables, SNPs, were selected based on two criteria: (1) affecting TAC pharmacokinetics (both confirmed and unconfirmed); (2) the minor allele frequency (MAF) was ≥5% for Chinese subjects. As a result, 244 SNPs were selected (see Table S2 in Supplementary).
Concentration Assay
Blood samples for TAC concentration detection and genotyping were collected before taking TAC. The enzyme-multiplied immunoassay technique (Viva-E, Siemens, Germany) was used to determine the whole blood concentration of TAC. The calibration curve range was 2.5–30.0 ng/mL.
Genotyping
DNA for SNP analysis was isolated using the Genome TIANGEN Blood DNA Extraction Kit (DP348, Beijing, China). Polymerase chain reaction-restriction fragment length polymorphism methods were used to determine the CYP3A5 rs776746, MDR1 rs1045642, MDR1 rs1128503, MDR1 rs2032582, and HSD11B1 rs846908, and Agena Bioscience MassARRAY® system (Agena Bioscience, San Diego, CA, USA) was used to determine other SNPs. The Hardy-Weinberg equilibrium test was performed using the chi-square test.
Machine Learning
It is well known that CYP3A5 genotype significantly affects the concentration of TAC. In order to exclude the interference of CYP3A5 genotype, we further divided the patients into CYP3A5 expresser group (CYP3A5*1/*1+CYP3A5*1/*3) and CYP3A5 nonexpresser group (CYP3A5*3/*3), then developed three prediction models separately. The main process of machine learning can be divided into three steps: (1) data preprocessing, (2) feature selection, (3) model generation and validation. The performance of feature selection and model generation was evaluated using five-fold stratified cross-validation. The flowchart of this work is shown in Figure 1. Machine learning was executed in Python 3.6.5 using Scikit-learn 0.19.1, and the main hyperparameters of each machine learning method are as shown in Table S3. GraphPad Prism 8.0.2 and CorelDRAW were used for drawing figures. P-value <0.05 was considered statistically significant.
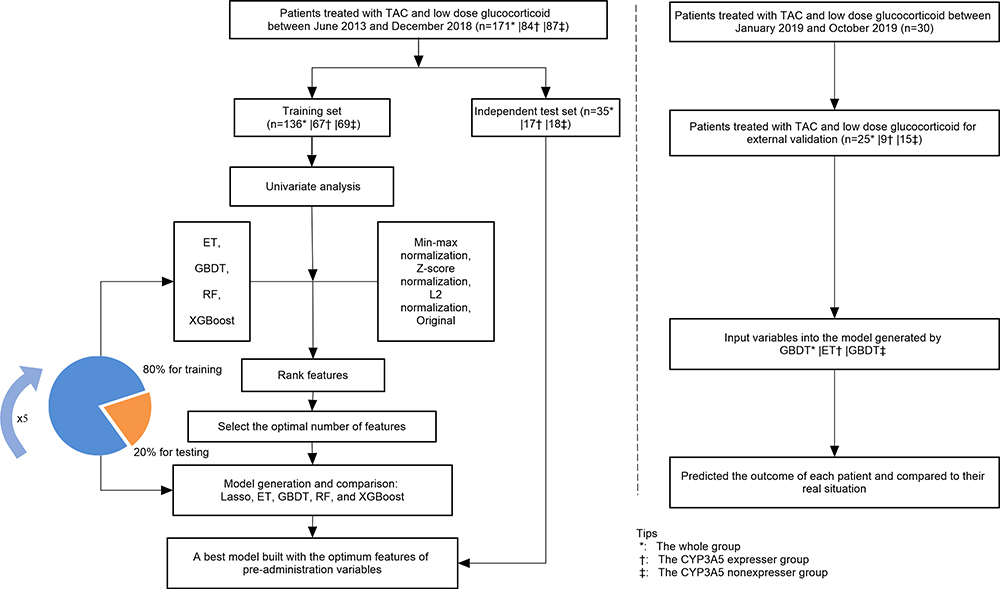 |
Figure 1 The flowchart of model generation and validation. |
Data Preprocessing
Variables with missing rates >10% were removed. The missing values of continuous and categorical variables were filled with the mean and mode values, respectively. Then, the categorical variables were transformed into dummy variables, while continuous variables were normalized by Z-score normalization.
Feature Selection
Univariate analysis was used to assess the association between each variable and TAC C0/D. The variables with p≥0.05 were excluded. Then, data transformation was carried out on the original continuous variables to form other two kinds of data: min-max normalization and L2 normalization. Four algorithms, including eXtreme Gradient Boosting (XGBoost), Extremely Randomized Trees (ET), Random Forest (RF), and Gradient Boosting Decision Tree (GBDT) were selected to develop models based on the above four forms of data (min-max normalization, z-score normalization, L2 normalization, and original, respectively). The important contribution of each variable in 16 models was ranking by the median. Then starting from the most important variable, XGBoost with five-fold cross-validation was used to iteratively generate a new model by adding one variable at a time. The R2 of the model is evaluated until the last variable is added, aiming to select the optimal features.
Model Generation and Validation
The Lasso regression, ET, GBDT, RF, and XGBoost algorithms were used to analyze the final feature set and generate prediction models. During model generation, patients were randomly divided into a training set and a test set according to the ratio of 8:2. Moreover, the five-fold cross-validation method was used for internal validation.
We further recruited 30 patients from January to October 2019 for external validation of the prediction model. Patients with missing data were excluded.
Results
Patient Characteristics
A total of 171 pediatric patients with refractory NS were included in this study, including 128 males and 43 females. The mean age of the children was 5.4±3.5 years, and the mean body weight was 19.5±8.3 kg. Patients were divided into CYP3A5 expresser group (CYP3A5*1/*1+ CYP3A5*1/*3) and CYP3A5 nonexpresser group (CYP3A5*3/*3) based on CYP3A5 genotype. There were 84 patients in the CYP3A5 expresser group, and 87 patients in the CYP3A5 nonexpresser group. The characteristics of patients are shown in Table 1.
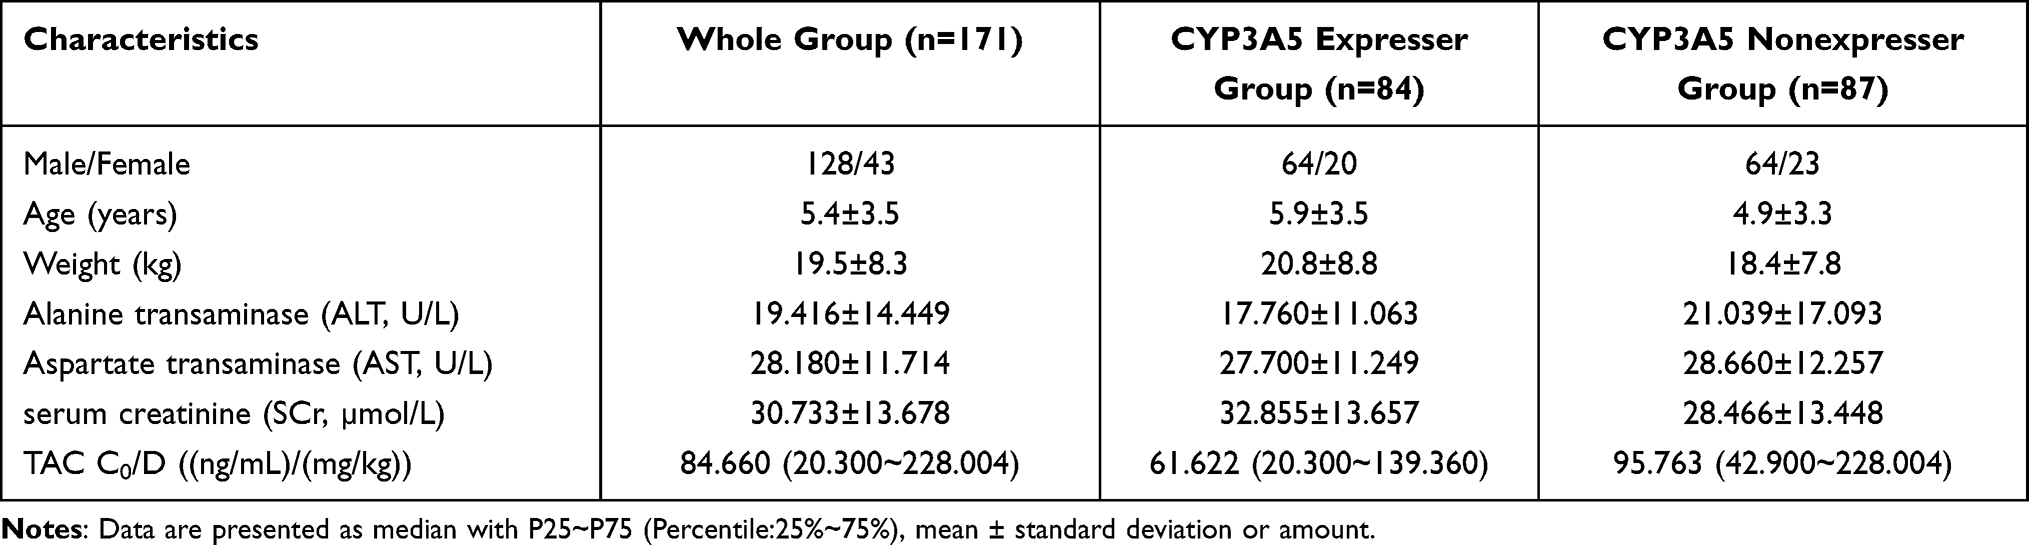 |
Table 1 Demographics and Clinical Characteristics of All Pediatric Patients with Primary Nephrotic Syndrome |
Feature Selection
We performed feature selection in the whole group, CYP3A5 expresser group, and CYP3A5 nonexpresser group separately. After univariate analysis, all variables with p<0.05 were further ranked of the median important contribution by ET, GBDT, RF, and XGBoost algorithms. The median important ranking of each variable is shown in Figure S1a/S2a/S3a in Supplementary.
The smaller the median value, the more important the variable. The process of stepwise forward modeling by XGBoost for the best feature set is shown in Figure S1b/S2b/S3b in Supplementary. From these figures, we see that the R2 of the model based on the test set reaches maximization when the most appropriate variable is incrementally added. Therefore, these variables constitute the best feature set.
In the whole group, five variables constitute the final feature set, including ALB0 (p=0.032), CYP3A5*3/*3 (p<0.001), MYH9 rs2239781_CT (p=0.027), MYH9 rs2239781_CC (p=0.001), and CTLA4 rs4553808_AA (p=0.011). The higher the ALB0, the higher the TAC C0/D. Compared with other genotypes, the patients with CYP3A5*3/*3 had a higher TAC C0/D. The MYH9 rs2239781_CT showed a lower TAC C0/D than other genotypes, whereas the MYH9 rs2239781_CC showed a higher TAC C0/D than other genotypes. The TAC C0/D of patients carrying CTLA4 rs4553808_AA was significantly lower than that of patients with other genotypes (see Figure 2).
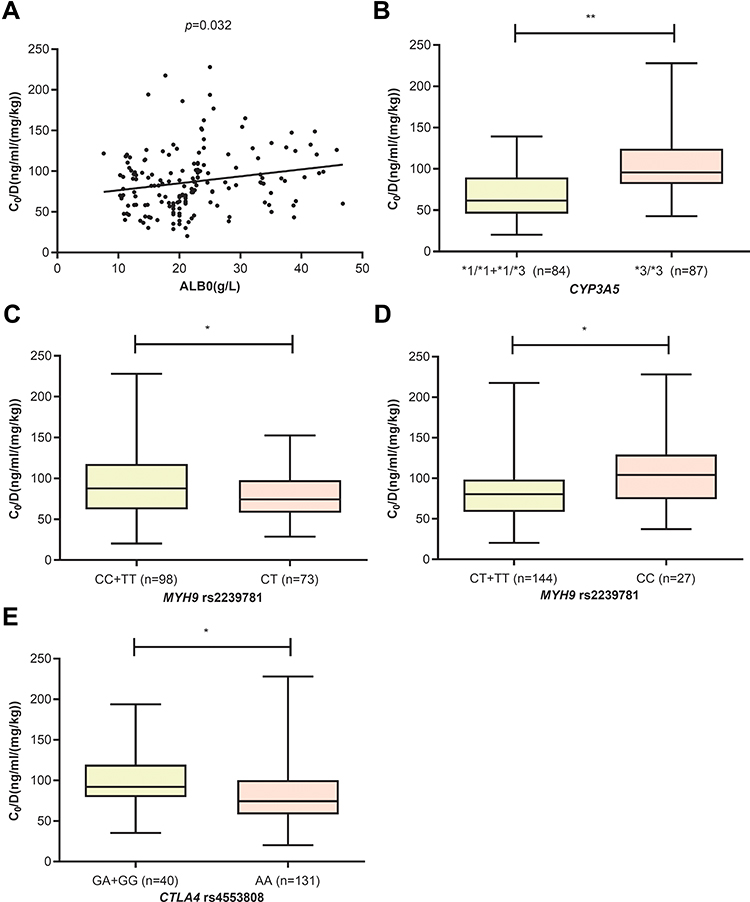 |
Figure 2 The influence of ALB0 (A), CYP3A5 (B), MYH9 rs2239781 (C and D) and CTLA4 rs4553808 (E) on TAC C0/D in whole group (* p<0.05, ** p<0.01). |
In the CYP3A5 expresser group, four variables were included in the final feature set, including AGE0 (p=0.021), MYH9 rs2239781_CC (p=0.005), MAP3K11 rs7946115_CG (p=0.011), and CTLA4 rs4553808_GG (p=0.017). The older the age, the higher the TAC C0/D. The MYH9 rs2239781_CC and CTLA4 rs4553808_GG genotypes were associated with higher TAC C0/D, whereas the MAP3K11 rs7946115_CG genotype was associated with lower TAC C0/D (see Figure 3).
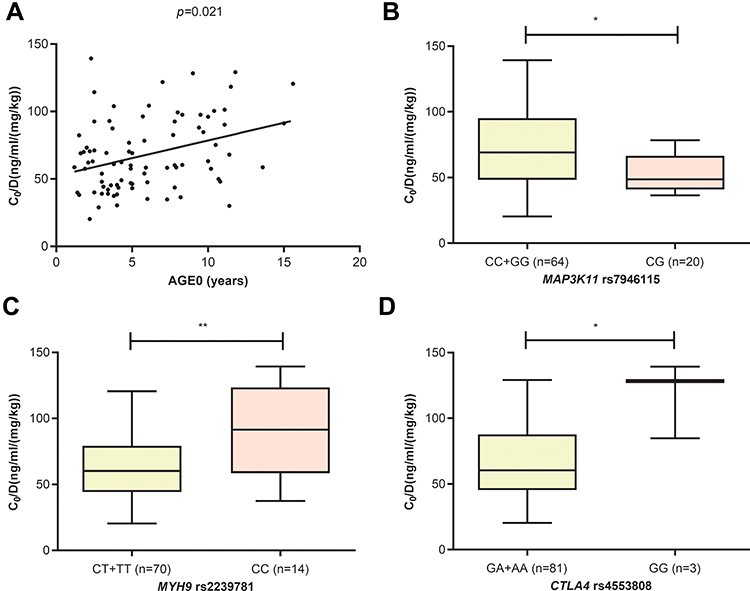 |
Figure 3 The influence of AGE0 (A), MAP3K11 rs7946115 (B), MYH9 rs2239781 (C) and CTLA4 rs4553808 (D) on TAC C0/D in CYP3A5 expressers (* p<0.05, ** p<0.01). |
In the CYP3A5 nonexpresser group, nine variables were included, including GENDER (p=0.033), MYH9 rs2239781_CC (p=0.013), MYH9 rs4821478_AA (p=0.008), ACTN4 rs56113315_CT (p=0.004), INF2 rs1128880_TT (p=0.005), ACTN4 rs3745859_CT (p=0.004), ACTN4 rs62121818_CC (p=0.003), INF2 rs1128880_GT (p=0.040), and IL2RA rs12722489_CT (p=0.013). The heterozygote of MYH9, INF2, and IL2RA were associated with lower TAC C0/D, whereas the heterozygote of ACTN4 was associated with higher TAC C0/D. Gender also affected the TAC C0/D, which was higher in males than in females (see Figure 4).
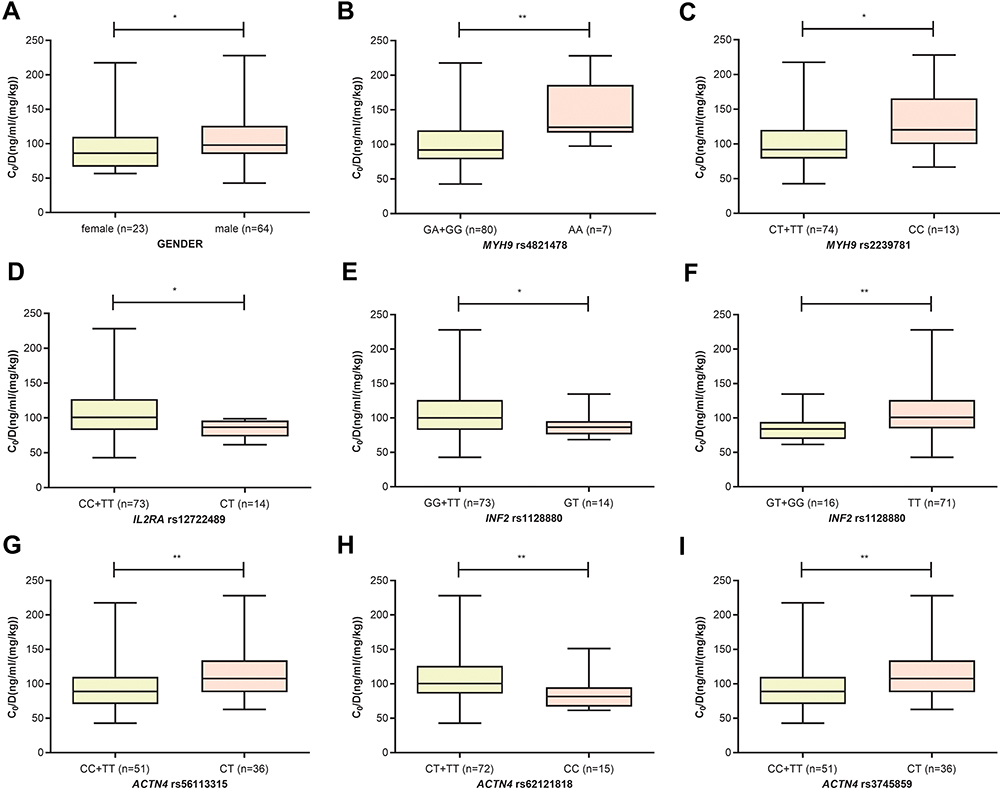 |
Figure 4 The influence of GENDER (A), MYH9 rs4821478 (B), MYH9 rs2239781 (C), IL2RA rs12722489 (D), INF2 rs1128880 (E and F), ACTN4 rs56113315 (G), ACTN4 rs62121818 (H) and ACTN4 rs3745859 (I) on TAC C0/D in CYP3A5 nonexpressers (* p<0.05, ** p<0.01). |
Model Performance and Comparison
We used five algorithms (including XGBoost, ET, RF, GBDT, and Lasso regression) to develop and verify the prediction models in each group based on the final features. The performance of these models of the test set is shown in Table 2. The R2 is between 0.207 and 0.444, and the error values are within the acceptable range. In the whole group, GBDT algorithm has the best performance with the highest R2 of 0.444, and the least MSE, MAE and MedAE of 591.032, 20.782 and 18.980, respectively. In CYP3A5 expresser group, ET algorithm has the highest R2 of 0.380 and the least MSE of 477.948. However, its MAE is relatively small, ranking second (the MAE of XGBoost algorithm is the least), and the MedAE of ET algorithm is relatively large (the MedAE of Lasso algorithm is the least). In CYP3A5 nonexpresser group, GBDT algorithm has the highest R2 of 0.264 and the least MSE and MAE of 1839.459 and 31.257, respectively. In addition, the MedAE is relatively small, ranking second (the MedAE of ET algorithm is the least). The model performance is further analyzed from the perspective of precision and bias,19 which is shown in Table 2. In the whole group, GBDT has the best performance. In CYP3A5 expresser group, ET algorithm has the best performance. However, in CYP3A5 nonexpresser group, the precision of GDBT algorithm is the best, but its bias is relatively poor. The bias of the RF algorithm is the best, but its precision is relatively poor. The contribution of each variable to the outcome in the five models is described in Table S3 of Supplementary. The ALB0 has the greatest contribution to the GBDT model in the whole group. The AGE0 contributes the most important to the ET model in CYP3A5 expresser group, while the most important variable is ACTN4 rs62121818_CC in CYP3A5 nonexpresser group.
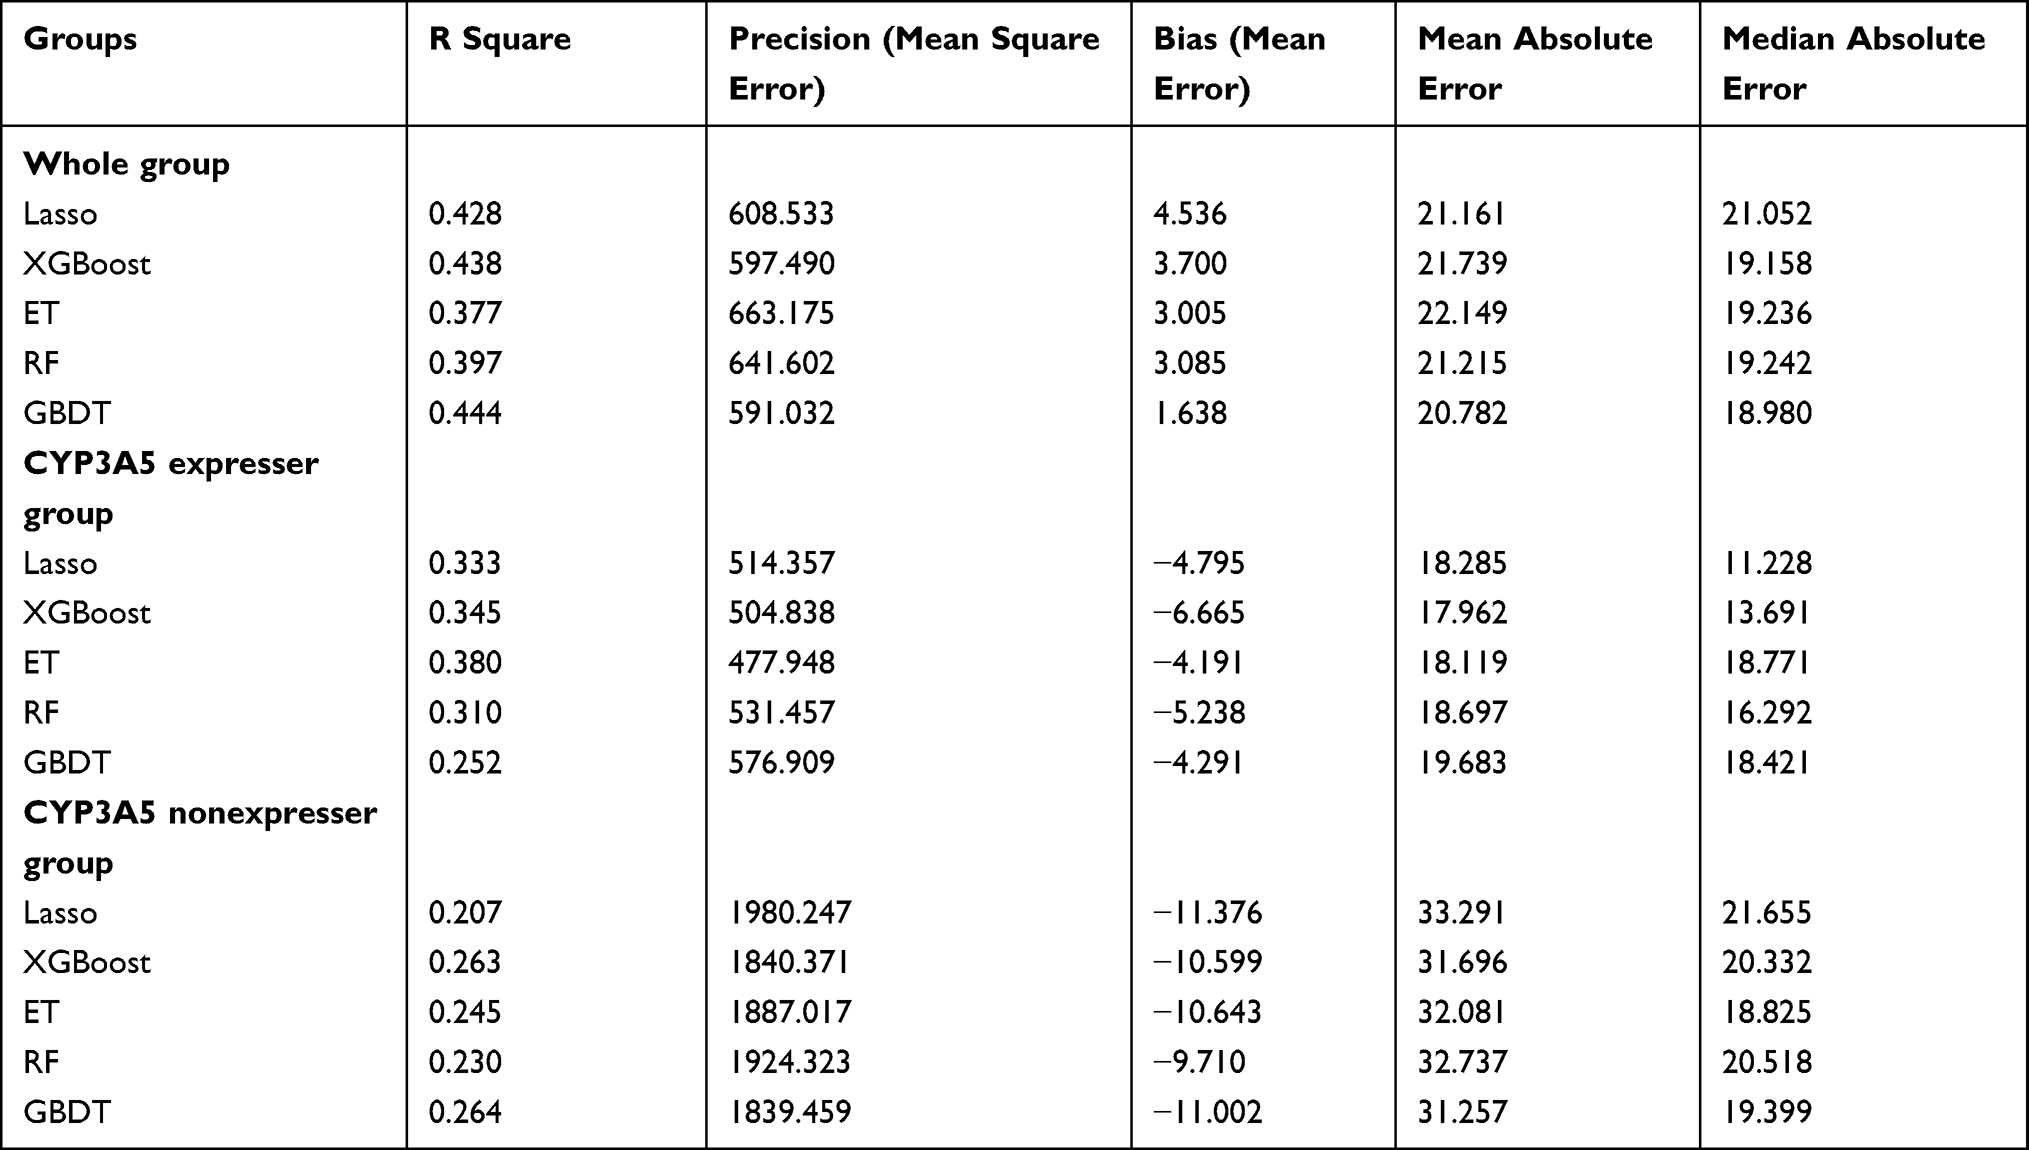 |
Table 2 The Performances Comparison of Five Models in Test Set in Whole Group, CYP3A5 Expresser Group, and CYP3A5 Nonexpresser Group |
External Verification and Clinical Application
We also additionally collected 30 patients for external validation. After excluding patients lost to follow-up and patients with missing data, 25, 9, and 15 patients were finally enrolled into the whole group, CYP3A5 expresser group, and CYP3A5 nonexpresser group separately. The results of external validation are depicted in Figure 5. The predicted C0/D are significantly associated with the observed C0/D whose r values are 0.632, 0.664, and 0.532 (p=0.001, p=0.051, and p=0.041) separately. In clinical practice, we can input patients’ variables into the best model and predict the precision C0/D for them (see Table 3).
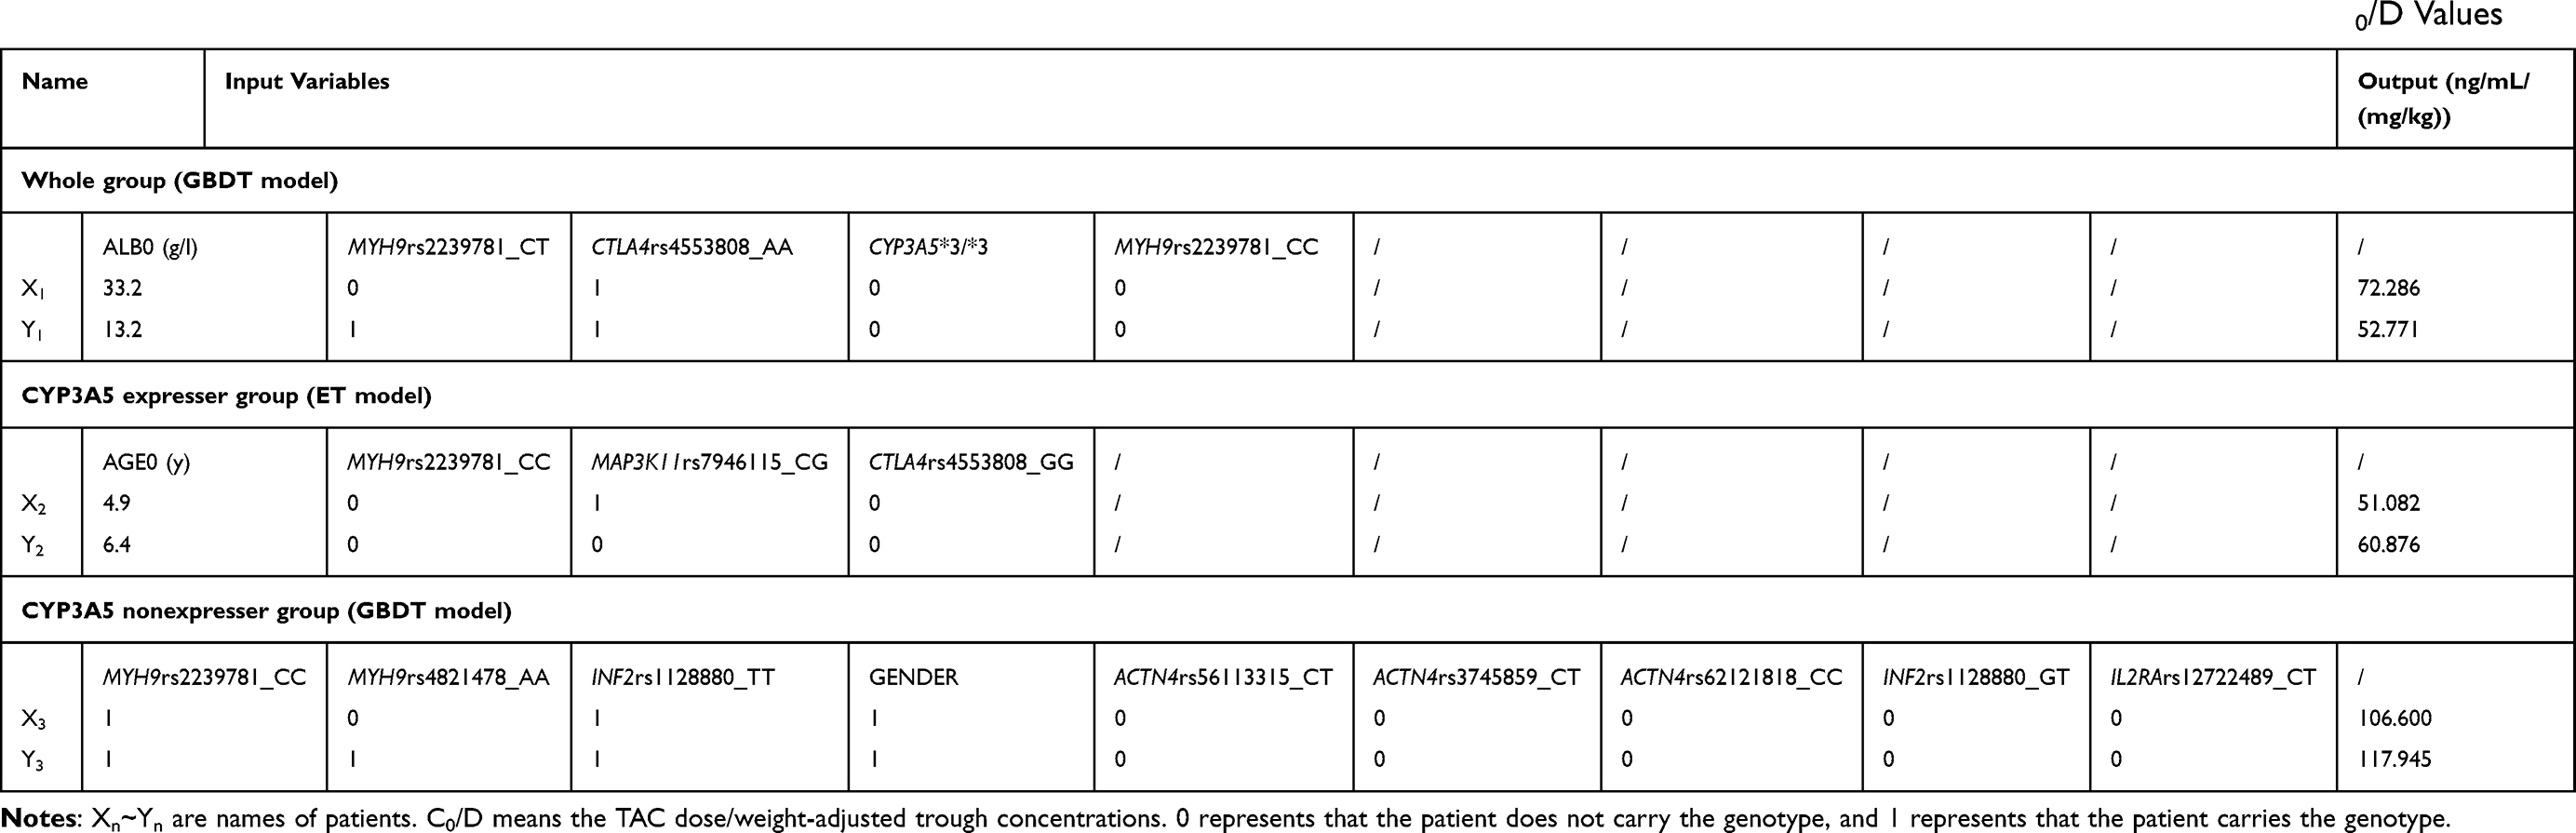 |
Table 3 The Clinical Application of These Prediction Models. After Inputting the Variables into the Predicted Models, These Models Finally Output the Predicted C0/D Values |
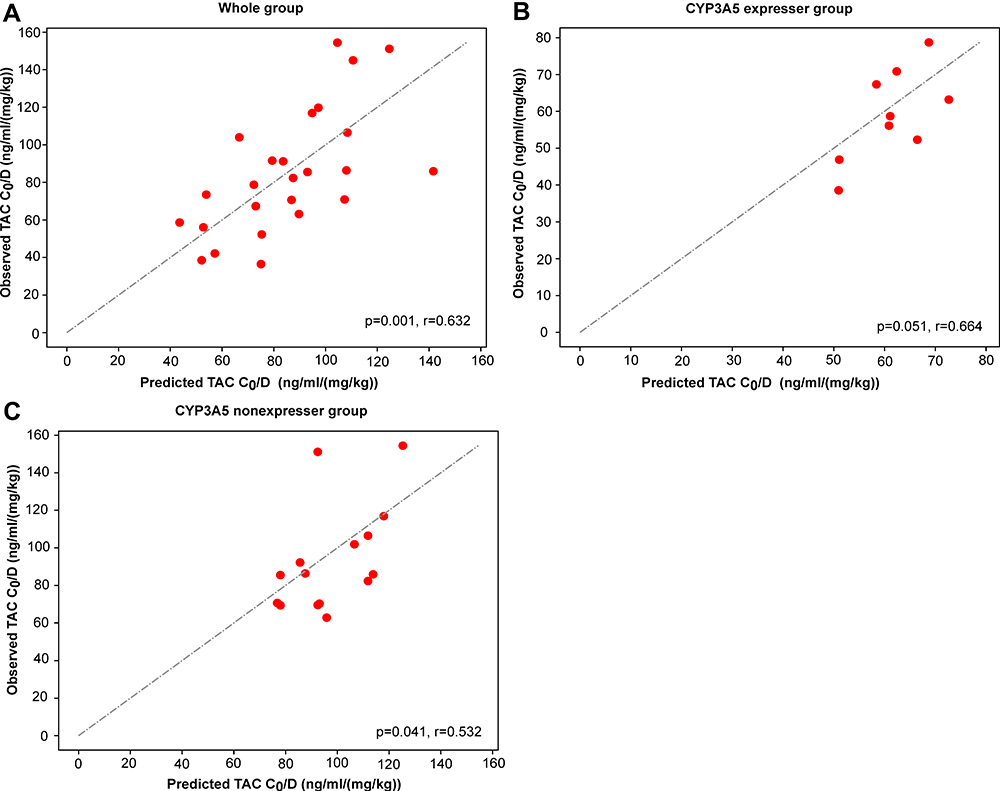 |
Figure 5 Observed and predicted C0/D in the whole group (A), the CYP3A5 expresser group (B), and the CYP3A5 nonexpresser group (C). |
Discussion
To our knowledge, this is the first machine learning-based TAC C0/D prediction model developed for pediatric patients with refractory NS that integrates clinical and genetic variables. Recently, machine learning algorithms have been widely used in the medical field and play an important role.11,15,17,20 Tang et al established a TAC stable dose prediction model based on machine learning algorithms in renal transplant recipients,18 whereas we first used machine learning models to predict TAC C0/D in NS patients. Our results show that models developed by advanced machine learning (RF, ET, GBDT, and XGBoost) perform better than those developed by Lasso regression, which verifies that advanced machine learning algorithms are generally superior to traditional algorithms in model fitting21 (see Table 2). In addition, machine learning can handle complex and high-dimensional variables, so it is particularly suitable for analyzing clinical, genetic, and other complex variables in this study. In the field of NS, Wang et al and Hao et al have established the TAC PPK models in children with NS.13,14 However, the small sample size, complex sampling operations, and incomplete consideration of genetic variables lead to low model prediction performance, which limits the application of these models. In general, the improvement of analysis methods can help us find out the key factors that affect the individual variations in drug concentration more fully and accurately, and establish prediction models with better performance, so as to achieve personalized administration.
In the whole group, five variables were included in the prediction model (see Figure 2). The higher the blood ALB0, the higher the TAC C0/D. TAC is a drug with a high plasma protein binding rate, while the pathophysiology of NS is characterized by hypoproteinemia and proteinuria. A higher blood ALB level mainly means less albumin is lost through the kidney, so we suspect that less TAC is lost with albumin, which leads to higher TAC C0/D. CYP3A5 is the most critical metabolic enzyme of TAC, and CYP3A5 genotype is recognized as an important factor affecting TAC pharmacokinetics. Our results confirmed that patients with CYP3A5*3/*3 genotype had a significantly higher TAC C0/D than patients with other genotypes, which is consistent with the results reported by other studies.6,13,22 We also found that MYH9 rs2239781_CC showed a higher TAC C0/D, whereas MYH9 rs2239781_CT led to a lower TAC C0/D, which was the same as our previous study.11 The MYH9 gene encodes the myosin IIA heavy chain, which is involved in various cell functions (such as cell division, migration, and adhesion). MYH9 mutations are associated with the onset of various diseases including chronic kidney disease.23 Based on our results, we suspect that patients with MYH9 rs2239781_CT had more severe damage to kidney podocytes. Thus, more TAC was lost with plasma protein through the kidney, which resulted in a lower TAC C0/D. However, further verification is needed. Cytotoxic T-lymphocyte-associated protein 4, encoded by the CTLA4 gene, is a crucial negative regulator of the immune system.24 In our study, the TAC C0/D in patients carrying the CTLA4 rs4553808_AA was significantly lower than that with other genotypes in whole group and CYP3A5 expresser group, but we did not find this association in CYP3A5 nonexpresser. However, Liu et al found that the TAC post-operation concentration at 30 days in kidney transplant recipients carrying G allele of CTLA4 rs4553808 was significantly lower than that in the AA genotype in CYP3A5 expressers, while it was higher in the nonexpressers.25 Our results are inconsistent with Liu’s outcomes, which may be caused by different populations, different analysis methods or different time points for concentration determination.
To exclude the interference of CYP3A5, we divided the patients into CYP3A5 expresser group and CYP3A5 nonexpresser group. In CYP3A5 expresser group, we found the older the age, the higher the TAC C0/D (see Figure 3). Similarly, Violette Gijsen et al found that in pediatric heart recipients, younger age was associated with a lower TAC concentration.26 This may be due to the changes in the expression and activity of metabolic enzymes with age, resulting in different metabolism of TAC in children, adolescents, and adults.27–29 As with the results in whole group, MYH9 rs2239781 and CTLA4 rs4553808 were also included in the prediction model of CYP3A5 expresser group. In addition, the TAC C0/D in patients with MAP3K11 rs7946115_CG was lower than that in patients with homozygous genotype. Mitogen-activated protein kinase kinase kinase 11 (encoded by the MAP3K11) is a member of the serine/threonine kinase family. It is a positive regulator of the JNK signaling pathway. TAC can exert immunosuppressive effects by inhibiting the activation of the JNK pathway,30 so MAP3K11 may indirectly affect the pharmacokinetics of TAC.
In CYP3A5 nonexpresser group, we found that the TAC C0/D in males was higher than that in females (see Figure 4). Considering that NS mostly occurs in boys, the gender differences in incidence may also be a partial cause of gender variations in TAC C0/D. However, the underlying mechanism needs to be further explored. Interleukin 2 (IL2) plays an important role in homeostasis and activation of the immune system.31 It can only exert its biological effects by binding to the IL2 receptor, which is composed of IL2 receptor alpha chain (encoded by IL2RA gene), beta chain, and gamma chain.32 Zea et al found that murine podocytes express the IL2R, and activation of IL2R will cause podocyte injury, resulting in increased podocyte apoptosis and diminished filtration barrier function.33 Our data showed that the TAC C0/D in patients with IL2RA rs12722489_CT was lower than that in patients with homozygous genotype. The mutation of IL2RA rs12722489 may affect the binding of IL2 and IL2R, thereby affecting the function of the filtration barrier, and ultimately the TAC C0/D. INF2 encodes a member of the formin family, which plays an important role in remodeling the actin and microtubule cytoskeleton.34 Patients with INF2 rs1128880_TT had a higher TAC C0/D than G allele carriers, whereas INF2 rs1128880_GT showed a lower TAC C0/D than homozygous genotype. INF2 gene is associated with severe pathological subtypes of NS (focal segmental glomerulosclerosis, FSGS).35 We suspect that the mutation of INF2 rs1128880 may affect the integrity of the filtration membrane, thereafter affecting the excretion of TAC. ACTN4 encoded α-actinin 4, which is an important podocyte cytoskeletal protein and plays a critical role in maintaining podocyte structure and function.36 The mutation of ACTN4 gene is associated with FSGS.37 We found that the TAC C0/D in patients with CT genotype of ACTN4 rs56113315 and rs3745859 was higher than that in patients with homozygous genotype. Whereas the ACTN4 rs62121818_CC genotype showed a lower TAC C0/D than T allele carriers, which is consistent with our previous study.11
In addition, we also prospectively recruited 25 children with refractory NS for external validation. The key variables were detected and input into the final models to predict TAC C0/D (see Table 3 and Figure 4). These predicted C0/D correlate linearly with the observed C0/D. This means that these models have a good ability of extrapolation, which can effectively assist doctors and pharmacists in making treatment decisions before administration. This study was limited by the sample size of NS patients and single center. Therefore, we hope to enroll more NS patients to perform multi-center research to test and verify our models. In addition, proteomics and metabolomics can be combined to further explore biomarkers that affect TAC concentration to improve the prediction model’s performance.
Conclusion
In summary, the influence of clinical variables (ALB0, AGE0, and gender) and genetic variables (ACTN4 rs3745859, ACTN4 rs56113315, ACTN4 rs62121818, CTLA4 rs4553808, CYP3A5 rs776746, IL2RA rs12722489, INF2 rs1128880, MAP3K11 rs7946115, MYH9 rs2239781, and MYH9 rs4821478) on TAC C0/D was described, and the association between genetic polymorphisms of INF2, IL2RA, and MAP3K11 and TAC C0/D was first reported. In addition, three machine learning-based TAC C0/D prediction models that integrated clinical and genetic variables were developed, which may support precision dosing of TAC in pediatric patients with refractory NS.
Data Sharing Statement
The data that support the findings of this study are available from the corresponding author upon reasonable request.
Acknowledgments
We thank the physicians and nurses from the division of nephrology for their cooperation.
Author Contributions
All authors made a significant contribution to the work reported, whether that is in the conception, study design, execution, acquisition of data, analysis and interpretation, or in all these areas; took part in drafting, revising or critically reviewing the article; gave final approval of the version to be published; have agreed on the journal to which the article has been submitted; and agree to be accountable for all aspects of the work.
Funding
This research was supported by grants from the Natural Science Foundation of Guangdong Province (No. 2021A1515011308), Guangzhou Municipal Science and Technology Bureau (No. 202102010237), Traditional Chinese Medicine Bureau of Guangdong Province (No. 20201302), “Hospital pharmacy” Research fund of Guangdong Pharmaceutical Association (No. 2021A35), and Guangzhou Institute of Pediatrics/Guangzhou Women and Children’s Medical Center (No. GWCMC2020LH-3-003).
Disclosure
The authors report no conflicts of interest in this work.
References
1. Venkataramanan R, Swaminathan A, Prasad T, et al. Clinical pharmacokinetics of tacrolimus. Clin Pharmacokinet. 1995;29(6):404–430. doi:10.2165/00003088-199529060-00003
2. Evans WE, Relling MV. Pharmacogenomics: translating functional genomics into rational therapeutics. Science. 1999;286(5439):487–491. doi:10.1126/science.286.5439.487
3. Li J-L, Liu S, Fu Q, et al. Interactive effects of CYP3A4, CYP3A5, MDR1 and NR1I2 polymorphisms on tacrolimus trough concentrations in early postrenal transplant recipients. Pharmacogenomics. 2015;16(12):1355–1365. doi:10.2217/pgs.15.78
4. Suetsugu K, Mori Y, Yamamoto N, et al. Impact of CYP3A5, POR, and CYP2C19 polymorphisms on trough concentration to dose ratio of tacrolimus in allogeneic hematopoietic stem cell transplantation. Int J Mol Sci. 2019;20(10):2413. doi:10.3390/ijms20102413
5. Liu X, Li J, Fu Q, et al. Associations of HSD11B1 polymorphisms with tacrolimus concentrations in Chinese renal transplant recipients with prednisone combined therapy. Drug Metab Dispos. 2015;43(4):455–458. doi:10.1124/dmd.114.062117
6. Birdwell KA, Decker B, Barbarino JM, et al. Clinical Pharmacogenetics Implementation Consortium (CPIC) guidelines for CYP3A5 genotype and tacrolimus dosing. Clin Pharmacol Ther. 2015;98(1):19–24. doi:10.1002/cpt.113
7. Feng D, Kumar M, Muntel J, et al. Phosphorylation of ACTN4 leads to podocyte vulnerability and proteinuric glomerulosclerosis. J Am Soc Nephrol. 2020;31(7):1479–1495. doi:10.1681/ASN.2019101032
8. Kaplan JM, Kim SH, North KN, et al. Mutations in ACTN4, encoding alpha-actinin-4, cause familial focal segmental glomerulosclerosis. Nat Genet. 2000;24(3):251–256. doi:10.1038/73456
9. Ghiggeri GM, Caridi G, Magrini U, et al. Genetics, clinical and pathological features of glomerulonephritis associated with mutations of nonmuscle myosin IIA (Fechtner syndrome). Am J Kidney Dis. 2003;41(1):95–104. doi:10.1053/ajkd.2003.50028
10. Pecci A, Ma X, Savoia A, Adelstein RS. MYH9: structure, functions and role of non-muscle myosin IIA in human disease. Gene. 2018;664:152–167. doi:10.1016/j.gene.2018.04.048
11. Mo X, Li J, Liu Y, et al. Kidney podocyte-associated gene polymorphisms affect tacrolimus concentration in pediatric patients with refractory nephrotic syndrome. Pharmacogenomics J. 2020;20(4):543–552. doi:10.1038/s41397-019-0141-x
12. Li M, Xu M, Liu W, Gao X. Effect of CYP3 A4, CYP3 A5 and ABCB1 gene polymorphisms on the clinical efficacy of tacrolimus in the treatment of nephrotic syndrome. BMC Pharmacol Toxicol. 2018;19(1):14. doi:10.1186/s40360-018-0202-9
13. Wang D, Lu J, Li Q, Li Z. Population pharmacokinetics of tacrolimus in pediatric refractory nephrotic syndrome and a summary of other pediatric disease models. Exp Ther Med. 2019;17(5):4023–4031. doi:10.3892/etm.2019.7446
14. Hao G-X, Huang X, Zhang D-F, et al. Population pharmacokinetics of tacrolimus in children with nephrotic syndrome. Br J Clin Pharmacol. 2018;84(8):1748–1756. doi:10.1111/bcp.13605
15. Liang H, Tsui BY, Ni H, et al. Evaluation and accurate diagnoses of pediatric diseases using artificial intelligence. Nat Med. 2019;25(3):433–438. doi:10.1038/s41591-018-0335-9
16. Mo X, Chen X, Li H, et al. Early and accurate prediction of clinical response to methotrexate treatment in juvenile idiopathic arthritis using machine learning. Front Pharmacol. 2019;10:1155. doi:10.3389/fphar.2019.01155
17. Motwani M, Dey D, Berman DS, et al. Machine learning for prediction of all-cause mortality in patients with suspected coronary artery disease: a 5-year multicentre prospective registry analysis. Eur Heart J. 2017;38(7):500–507. doi:10.1093/eurheartj/ehw188
18. Tang J, Liu R, Zhang YL, et al. Application of machine-learning models to predict tacrolimus stable dose in renal transplant recipients. Sci Rep. 2017;7:42192. doi:10.1038/srep42192
19. Sheiner LB, Beal SL. Some suggestions for measuring predictive performance. J Pharmacokinet Biopharm. 1981;9(4):503–512. doi:10.1007/BF01060893
20. Shouval R, Labopin M, Bondi O, et al. Prediction of allogeneic hematopoietic stem-cell transplantation mortality 100 days after transplantation using a machine learning algorithm: a European group for blood and marrow transplantation acute leukemia working party retrospective data mining study. J Clin Oncol. 2015;33(28):3144–3151. doi:10.1200/JCO.2014.59.1339
21. Kruppa J, Ziegler A, König IR. Risk estimation and risk prediction using machine-learning methods. Hum Genet. 2012;131(10):1639–1654. doi:10.1007/s00439-012-1194-y
22. Wang X, Han Y, Chen C, et al. Population pharmacokinetics and dosage optimization of tacrolimus in pediatric patients with nephrotic syndrome. Int J Clin Pharmacol Ther. 2019;57(3):125–134. doi:10.5414/CP203355
23. Kopp JB, Smith MW, Nelson GW, et al. MYH9 is a major-effect risk gene for focal segmental glomerulosclerosis. Nat Genet. 2008;40(10):1175–1184. doi:10.1038/ng.226
24. Walker LSK, Sansom DM. The emerging role of CTLA4 as a cell-extrinsic regulator of T cell responses. Nat Rev Immunol. 2011;11(12):852–863. doi:10.1038/nri3108
25. Liu MZ, He HY, Zhang YL, et al. IL-3 and CTLA4 gene polymorphisms may influence the tacrolimus dose requirement in Chinese kidney transplant recipients. Acta Pharmacol Sin. 2017;38(3):415–423. doi:10.1038/aps.2016.153
26. Gijsen V, Mital S, van Schaik RH, et al. Age and CYP3A5 genotype affect tacrolimus dosing requirements after transplant in pediatric heart recipients. J Heart Lung Transplant. 2011;30(12):1352–1359. doi:10.1016/j.healun.2011.08.001
27. Wallemacq PE, Verbeeck RK. Comparative clinical pharmacokinetics of tacrolimus in paediatric and adult patients. Clin Pharmacokinet. 2001;40(4):283–295. doi:10.2165/00003088-200140040-00004
28. Wallemacq PE, Furlan V, Möller A, et al. Pharmacokinetics of tacrolimus (FK506) in paediatric liver transplant recipients. Eur J Drug Metab Pharmacokinet. 1998;23(3):367–370. doi:10.1007/BF03192295
29. Wrighton SA, Brian WR, Sari MA, et al. Studies on the expression and metabolic capabilities of human liver cytochrome P450IIIA5 (HLp3). Mol Pharmacol. 1990;38(2):207–213.
30. Matsuda S, Shibasaki F, Takehana K, Mori H, Nishida E, Koyasu S. Two distinct action mechanisms of immunophilin-ligand complexes for the blockade of T-cell activation. EMBO Rep. 2000;1(5):428–434. doi:10.1093/embo-reports/kvd090
31. Boyman O, Sprent J. The role of interleukin-2 during homeostasis and activation of the immune system. Nat Rev Immunol. 2012;12(3):180–190. doi:10.1038/nri3156
32. Sharon M, Klausner RD, Cullen BR, Chizzonite R, Leonard WJ. Novel interleukin-2 receptor subunit detected by cross-linking under high-affinity conditions. Science. 1986;234(4778):859–863. doi:10.1126/science.3095922
33. Zea AH, Stewart T, Ascani J, et al. Activation of the IL-2 receptor in podocytes: a potential mechanism for podocyte injury in idiopathic nephrotic syndrome? PLoS One. 2016;11(7):e0157907. doi:10.1371/journal.pone.0157907
34. Chesarone MA, DuPage AG, Goode BL. Unleashing formins to remodel the actin and microtubule cytoskeletons. Nat Rev Mol Cell Biol. 2010;11(1):62–74. doi:10.1038/nrm2816
35. Brown EJ, Schlöndorff JS, Becker DJ, et al. Mutations in the formin gene INF2 cause focal segmental glomerulosclerosis. Nat Genet. 2010;42(1):72–76. doi:10.1038/ng.505
36. Dandapani SV, Sugimoto H, Matthews BD, et al. Alpha-actinin-4 is required for normal podocyte adhesion. J Biol Chem. 2007;282(1):467–477. doi:10.1074/jbc.M605024200
37. Feng D, DuMontier C, Pollak MR. The role of alpha-actinin-4 in human kidney disease. Cell Biosci. 2015;5:44. doi:10.1186/s13578-015-0036-8
 © 2022 The Author(s). This work is published and licensed by Dove Medical Press Limited. The full terms of this license are available at https://www.dovepress.com/terms.php and incorporate the Creative Commons Attribution - Non Commercial (unported, v3.0) License.
By accessing the work you hereby accept the Terms. Non-commercial uses of the work are permitted without any further permission from Dove Medical Press Limited, provided the work is properly attributed. For permission for commercial use of this work, please see paragraphs 4.2 and 5 of our Terms.
© 2022 The Author(s). This work is published and licensed by Dove Medical Press Limited. The full terms of this license are available at https://www.dovepress.com/terms.php and incorporate the Creative Commons Attribution - Non Commercial (unported, v3.0) License.
By accessing the work you hereby accept the Terms. Non-commercial uses of the work are permitted without any further permission from Dove Medical Press Limited, provided the work is properly attributed. For permission for commercial use of this work, please see paragraphs 4.2 and 5 of our Terms.