")
Back to Journals » Clinical, Cosmetic and Investigational Dermatology » Volume 15
Prediction of Diagnostic Gene Biomarkers Associated with Immune Infiltration for Basal Cell Carcinoma
Authors Xie D, Chen X, Wu H, Ning D, Cao X, Wan C
Received 28 September 2022
Accepted for publication 29 November 2022
Published 13 December 2022 Volume 2022:15 Pages 2657—2673
DOI https://doi.org/10.2147/CCID.S390770
Checked for plagiarism Yes
Review by Single anonymous peer review
Peer reviewer comments 2
Editor who approved publication: Dr Jeffrey Weinberg
Dong Xie,* Xiaoxiao Chen,* Hongxuan Wu, Danmei Ning, Xianwei Cao, Chuan Wan
Department of Dermatology, The First Affiliated Hospital of Nanchang University, Nanchang, 330006, People’s Republic of China
*These authors contributed equally to this work
Correspondence: Chuan Wan, Department of Dermatology, The First Affiliated Hospital of Nanchang University, Nanchang, 330006, People’s Republic of China, Tel +86-791-88692799, Email [email protected]
Purpose: Basal cell carcinoma (BCC) is a frequent tumor of the surface layer of skin or its accessories, and ranks first among the prevalence of skin cancer cases. However, its pathogenesis remains unclear. The purpose of this analysis was to scientifically evaluate the role of mRNAs in the occurrence and progression of BCC and further elucidate their underlying potential molecular mechanisms of action.
Methods: Differentially expression genes (DEGs) between nineteen BCC cases and five controls which initiate from the GSE103439 and GSE7553 datasets were identified and the transcriptome sequencing information was obtained. Kyoto Encyclopedia of Genes and Genomes (KEGG) enrichment analyses and Gene Ontology (GO) annotation were performed. Logistic regression (LASSO) and support vector machine (SVM) analyses were performed to identify candidate biomarkers obtained from protein-protein interaction (PPI) analysis. The tumor microenvironment comprising hub genes in BCC was investigated by immune infiltration analysis. The expression of two representative hub genes (KIF23 and NCAPG) was measured by qRT-PCR. Finally, the potential miRNAs and lncRNAs related to the hub genes were analyzed on relevant websites to obtain a ceRNA interaction network.
Results: Twenty-seven DEGs were identified. Fifteen hub genes were screened in the protein-protein interaction network. These showed marked enrichment in the cell cycle and p53 signaling pathway. FGF20, KIF23, and NCAPG were identified as the diagnostic markers of BCC. Immune cell infiltration analysis suggested their significant association with T cells CD4 memory activated, macrophages M1, and natural killer (NK) resting cells. Two miRNAs and twelve lncRNAs were used to construct the lncRNA-miRNA-mRNA ceRNA network.
Conclusion: FGF20, KIF23, and NCAPG are potential diagnostic markers of BCC. Our findings may shed new light on the molecular mechanisms underlying BCC occurrence.
Keywords: basal cell carcinoma, diagnostic biomarkers, immune infiltration, pathogenesis, ceRNA
Introduction
Basal cell carcinoma (BCC) of the skin is the most frequent cutaneous malignancy among humans.1 According to a survey, nearly two million cases are diagnosed with BCC in the USA annually, and the average prevalence rate increases by 4% to 8% every year.2 BCC is initiated from stem cell populations found in the follicle bulge and basal layer of the interfollicular epidermis. Its growth and development are delayed. It damages the adjacent tissues through partial invasion, with very little migration.2,3 Clinically, it is hard to distinguish from some diseases, such as Trichoblastoma.4 The standard treatment for BCC is excision or Mohs surgery. The other treatments include cryosurgery, electrodesiccation and curettage, topical medications and photodynamic therapy.5 BCC is a tumor with the most genetic mutations in the coding DNA. Nearly 75.7% of the “UV labeled mutation”, cyclobutane pyrimidine dimer (CPD), of the coding DNA is attributed to UVB radiation sources. Therefore, ultraviolet radiation is a major cause underlying the growth and development of BCC.2,6 However, the potential molecular mechanisms remain unclear. Additionally, when targeted therapeutic drugs are used to treat locally advanced and metastatic BCC cases, drug resistance and disease progression or attack are ubiquitous. Thus, it is crucial to assess molecular mechanistic details underlying BCC pathogenesis to identify new potential therapeutic targets.
BCC is one of the Non-melanoma skin cancers (NMSCs),7 previous studies8–10 have shown that BCC has a multi-factor and multi-gene basis, and is primarily driven by the Sonic Hedgehog (Hh) pathway. The core components of this pathway include the Shh ligand, PTCH1, SMO, and Gli proteins. Briefly, PTCH1 constitutively inhibits SMO in absence of the Shh ligand. After Shh ligand’s fusion with PTCH1, SMO is released, which in turn activates the GLI family of transcription factors, thus inducing downstream target gene expression.11,12 Additionally, 85% of BCC cases carry mutations in the Hh pathway genes, namely SMO (20%) and PTCH1 (73%).13 Therefore, owing to the inactivating mutation in PTCH1 or the activating mutation in SMO, the activity of the Hh pathway signaling is enhanced. Thus, the pathogenic effects of abnormal signaling by the Hh pathway are crucial in BCC.
mRNA is a single-stranded RNA transcribed using one of the DNA strands as the template; it carries genetic material that specifically guides protein synthesis, thus occupying an important position in heredity dogma.14 mRNA plays a leading role in various human diseases and participates in the development and progression of BCC. For instance, reduced SOX2 mRNA is necessary for BCC cells to maintain attenuated migratory potential15 and FOXC2 mRNA is likely to participate in lesion formation.16 Next-generation sequencing technologies have been used to reveal the mRNA expression profile of BCC clinical samples16,17 Previous research based on mRNA expression mainly focuses on identifying differentially expressed mRNAs (DEMs) in BCC upon comparison with control tissues. However, the molecular mechanisms and the role of mRNA in BCC pathogenesis, are largely elusive, particularly the regulatory functions (ie the function and signaling pathways of target genes) and correlation (ie the networks and channels of target genes). Therefore, it is necessary to systematically evaluate BCC-related mRNAs and study potential genes and their regulation.
Herein, various bioinformatic tools were utilized to systematically analyze the efficacy of mRNAs in BCC. First, data from the GEO database was utilized to select differentially expressed genes (DEGs) and enrichment analyses for their functions and modes were conducted. Based on the protein-protein interaction (PPI) cluster analysis, hub genes were extracted. Finally, the regulatory layouts and functions of mRNAs were elucidated based on entity models. The implication of these findings may clarify the pathogenetic processes of BCC.
Materials and Methods
Downloading and Preprocessing of Data
The GEO query package18 in R software was used to extract the BCC expression datasets, GSE103439,19 GSE7553,20 and GSE42109,21 from the GEO database and corresponding sequencing data from our research group (https://www.ncbi.nlm.nih.gov/geo/) (version 3.6.5, http://r-project.org/). The samples in the dataset were all Homo sapiens. The GPL570 [HG-U133_plus_2] Affymetrix Human Genome U133 Plus 2.0 Array was platform of GSE103439 and GSE7553 datasets; GSE103439 included 4 cases of eyelid BCC and 2 cases of normal epidermal keratinocytes; GSE7553 included 15 cases of BCC and 3 cases with normal skin, and GSE42109 included 11 cases of BCC and 10 cases with normal skin. Transcriptome sequencing data of 10 BCC tissues and 10 para-cancer tissues were collected, and the detailed results are shown in Table 1. The Affy package22 was used to read the raw data, perform background correction, and data normalization to obtain the gene expression matrix for the two datasets. The correction effect between samples is shown in the boxplot drawn using the ggplot2 package.23
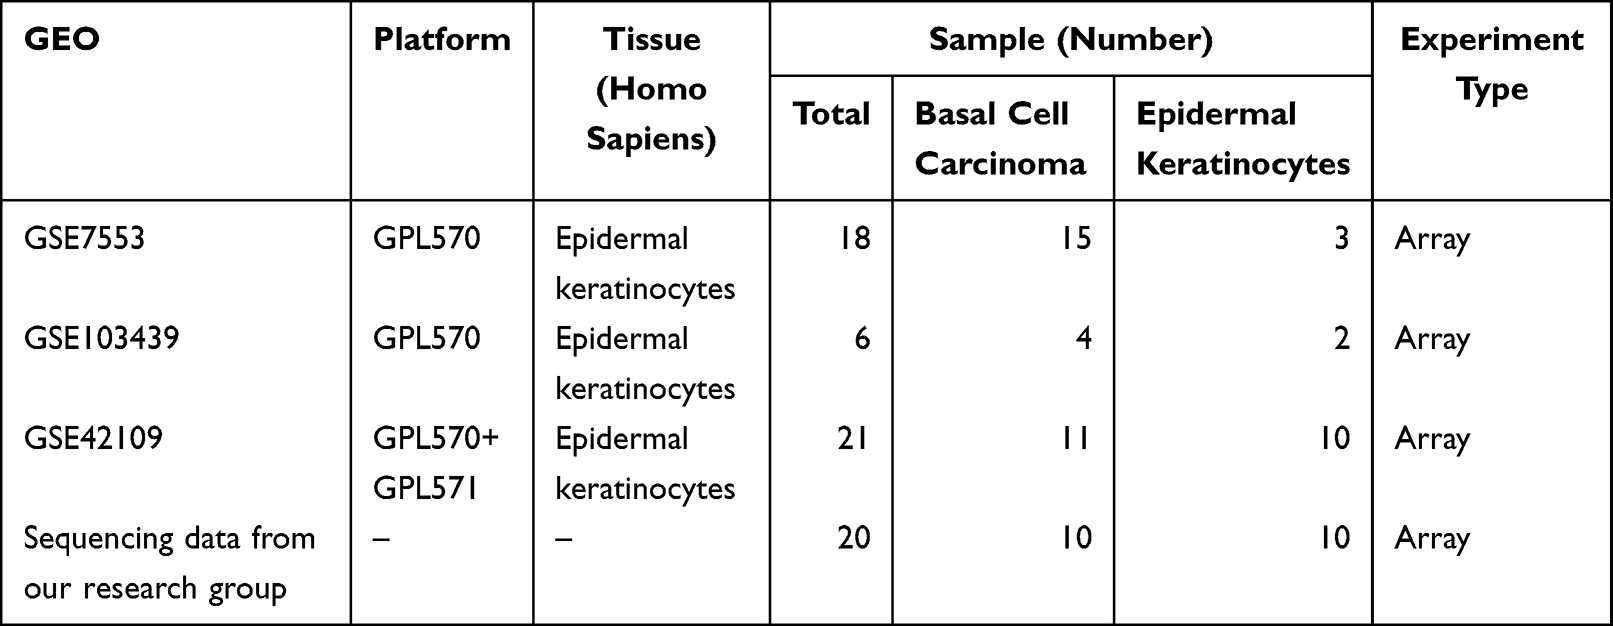 |
Table 1 Summary of GEO Database Sample Information |
DEGs Identification
The limma package24 was utilized to select the DEGs among the datasets, and the pheatmap package25 was used to draw the heatmap to show the differential distribution of DEGs. The ggplot2 package was utilized to plot a volcano map of DEGs with | log2FC | > 1 and adj.p-value < 0.05.
Evaluation of Enriched DEGs
Venn diagrams were drawn to analyze the common DEGs among datasets. The iGraph26 and eshape227 packages were utilized to analyze the association of different genes. The clusterProfiler package28 was used for Gene Ontology (GO) and Kyoto Encyclopedia of Genes and Genomes (KEGG) pathway enrichment analyses for DEGs, whereby adj.p-value < 0.05 indicated statistical significance. Gene set enrichment analysis (GSEA) was performed for the DEGs.
Constructing the PPI Network
In this study, STRING, a web tool, was utilized to predict and construct a PPI network for the selected DEGs (https://string-db.org/).29 Interactions predicted with confidence greater than 0.4 were selected and the network was visualized by Cytoscape (V3.7.2);30 using the Cytohubba31 plug-in, the hub genes were finally screened.
LASSO and SVM Analyses to Construct the Diagnostic Model
Three kinds of machine learning algorithms were used to distinguish BCC patients from the normal population in the GSE42109 dataset. The LASSO entity model was obtained using the glmnet package,32 which determined variables according to the λ with the least classification error. SVM model was obtained using the e1071 package,33 while the random forest (RF) diagnostic model was constructed using the randomForest package.34 pROC package35 was used to draw the ROC curves to assess the diagnostic efficacy based on the calculated AUC values.
Cell Lines and Cell Culture
All cell lines were maintained at 37°C with 5% CO2 in a humidified incubator. The TE354.T cell line was obtained from American Type Culture Collection (ATCC) and cultured in DMEM supplemented with fresh 10% FBS (both procured from Gibco, Thermo Fisher Scientific). The HaCaT cell line was obtained from Procell (Wuhan, China) and cultured in MEM (Gibco, Thermo Fisher Scientific) supplemented with fresh 10% FBS.
RNA Extraction and Quantitative Real-Time PCR (qRT-PCR) Analysis
All reagents were purchased from Vazyme (Nanjing, China) and the manufacturers’ instructions were followed. Table 2 lists the sequences of all qRT-PCR primers used herein. The 2 −ΔΔCt method was utilized to evaluate the relative gene expression. Each analysis was performed in a triplicate.
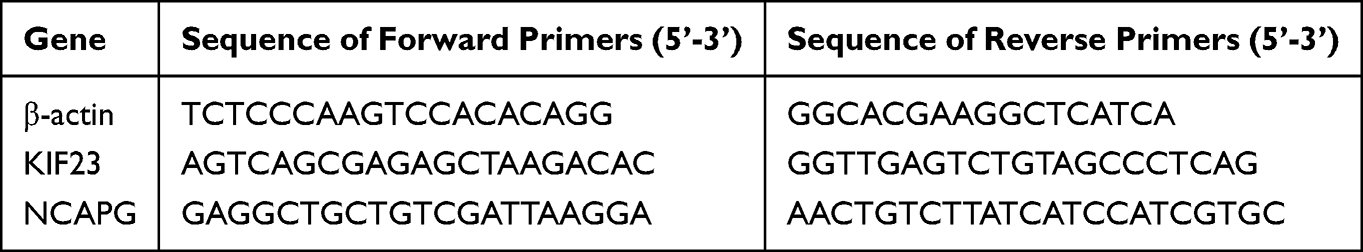 |
Table 2 qRT-PCR Primers |
Evaluation of Immune Cell Infiltration
ssGSEA was performed to assess the correlation between global immune characteristics and gene expression. Single sample quantification of GSVA was based on analysis using the GSVA package. The ConsensusClusterPlus package36 was used to perform a tSNE analysis of the immune subtypes, and the samples were divided into two subclasses. The sample distribution of 28 kinds of immune cells between the subclasses was assessed. The ggpubr package37 was utilized to further compute the correlation coefficient and draw the correlation graph between hub genes and different immune cell infiltrates. The p-value was compared with the threshold value of 0.05. For values less than 0.05, relevant graphs were plotted.
Construction of the ceRNA Network
The human miRNA-target gene interaction data were extracted from DianaTools and TargetScanHuman. TargetScan gives the miRNA gene marker interaction pairs, while miRDb yields miRNA-refseq ID interaction pairs. RefSeq ID was transformed into gene symbols based on hG38 reference annotation. Further, the interaction data conforming to both DE-miRNAs and DE-mRNAs were screened and repeated data were omitted.
Human miRNA-lncRNA interaction data was extracted from Starbase V2.0 (https://starbase.sysu.edu.cn/starbase2/browseNcRNA.php) and DNA tools (https://diana.e-ce.uth.gr/home). StarBase can decode protein-lncRNA, protein-sncRNA, protein-mRNA, protein-pseudogene, miRNA-lncRNA, miRNA-mRNA, miRNA-circRNA, miRNA-pseudogene, miRNA-sncRNA interactions, and ceRNA networks from 108 CLIP-Seq (HITS-CLIP, PAR-CLIP, iCLIP, CLASH) datasets. ‘DNA tools’ was used to screen the interaction data of lncRNAs and DE-miRNAs conforming to the characteristics of the random forest model through a target prediction algorithm (microT V4 and microT-CDS) and miRNA targets (TarBase V7.0 and LncBase) that have been experimentally validated for coding and non-coding RNA. Repeated interactions were deleted.
Statistical Analysis
R software was used for data resolution and analyses (version 4.0.2). For comparing two sets of continuous variables conforming to normal distributions, the Student’s t-test estimates was used to compute statistical significance, else the Mann–Whitney U-test (Wilcoxon rank sum test) was used for continuous variables that did not conform to a normal distribution. Chi-square test or Fisher exact test was used to compare and analyze the statistical significance between the two groups of categorical variables. Pearson correlation analysis was performed to compute the correlation coefficient, r, for different genes. Bilateral p<0.05 indicated a statistically significant difference.
Results
Data Preprocessing and DEG Screening
The overall flow chart of this study is shown in Figure 1. First, the samples of two datasets were combined, balanced, and normalized. The boxplots before and after homogenization are shown (Figure 2A and B). The two groups of samples showed good equilibrium after preliminary data handling. From the gene expression drainage matrix, 438 DEGs were identified as shown in the heat map (Figure 2C) and volcano map (Figure 2D). Further samples were collected for transcriptome sequencing, and the thermal map (Figure 2E) and volcanic map (Figure 2F) of DEGs were drawn. Using the Venn diagram, from the intersection of the three datasets, a total of 27 DEGs were screened (Figure 2G). Subsequently, a genetic correlation analysis was conducted for these DEGs (Figure 2H).
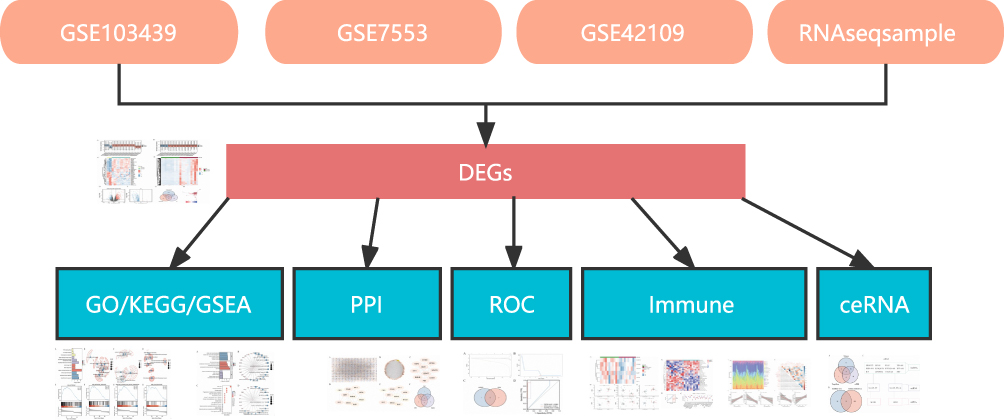 |
Figure 1 Flow diagram of data preparation, processing, and analysis in this study. |
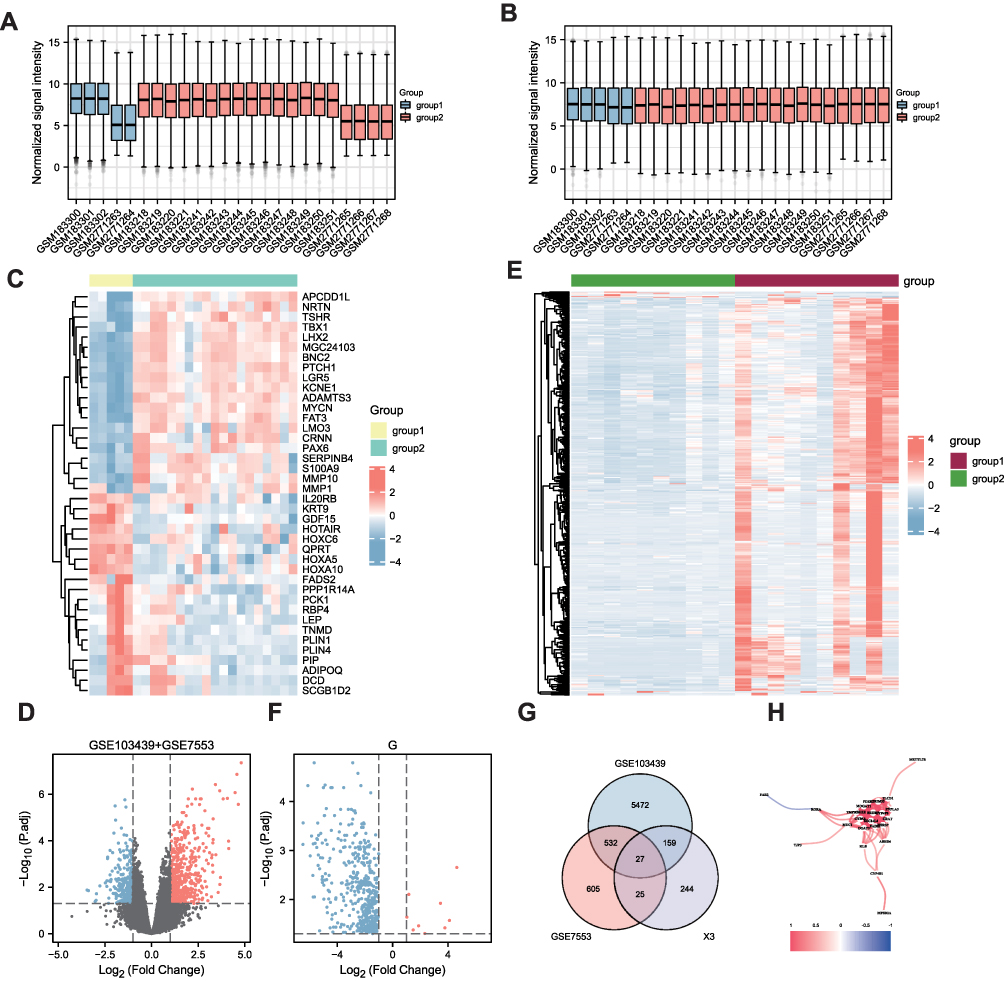 |
Figure 2 Differential analysis for datasets. (A and B) Batch effect correction for GSE103439 and GSE7553 datasets (boxplot), respectively. (C) Heat map for DEGs in GSE103439 and GSE7553 datasets. (D) Volcanic map of DEGs in GSE103439 and GSE7553 datasets. Red represents up-regulated DEGs; green represents down-regulated DEGs, and gray represents genes showing no differential expression. (E) Volcano map for DEGs based on our sequencing dataset. (F) Heat map of DEGs for our sequencing dataset. (G) Venn diagram of DEGs. (H) Correlation network diagram for DEGs. |
Analysis of the Role and Enrichment of DEGs
To analyze the molecular functions of these DEGs, GO and KEGG functional enrichment analyses were conducted (Figure 3A, Table 3); the results indicated enrichment in the embryonic organ development, extracellular structure organization, cartilage development, skeletal system morphogenesis, extracellular matrix organization, and other biological processes (Figure 3B). Simultaneous enrichment in the fibrillar collagen trimer, collagen-containing extracellular matrix, banded collagen fibril, collagen trimer, extracellular matrix component, and other cell components were recorded (Figure 3C). Molecular function enrichment included platelet-derived growth factor binding, extracellular matrix structural constituents, metalloendopeptidase activity, extracellular matrix structural constituents conferring tensile strength, DNA-binding transcription activator activity, and RNA polymerase II-specific (Figure 3D). GSEA mainly involved naba matrisome, naba matrisome associated, reactome extracellular matrix organization, and naba ECM regulators (Figure 3E–H; Table 4).
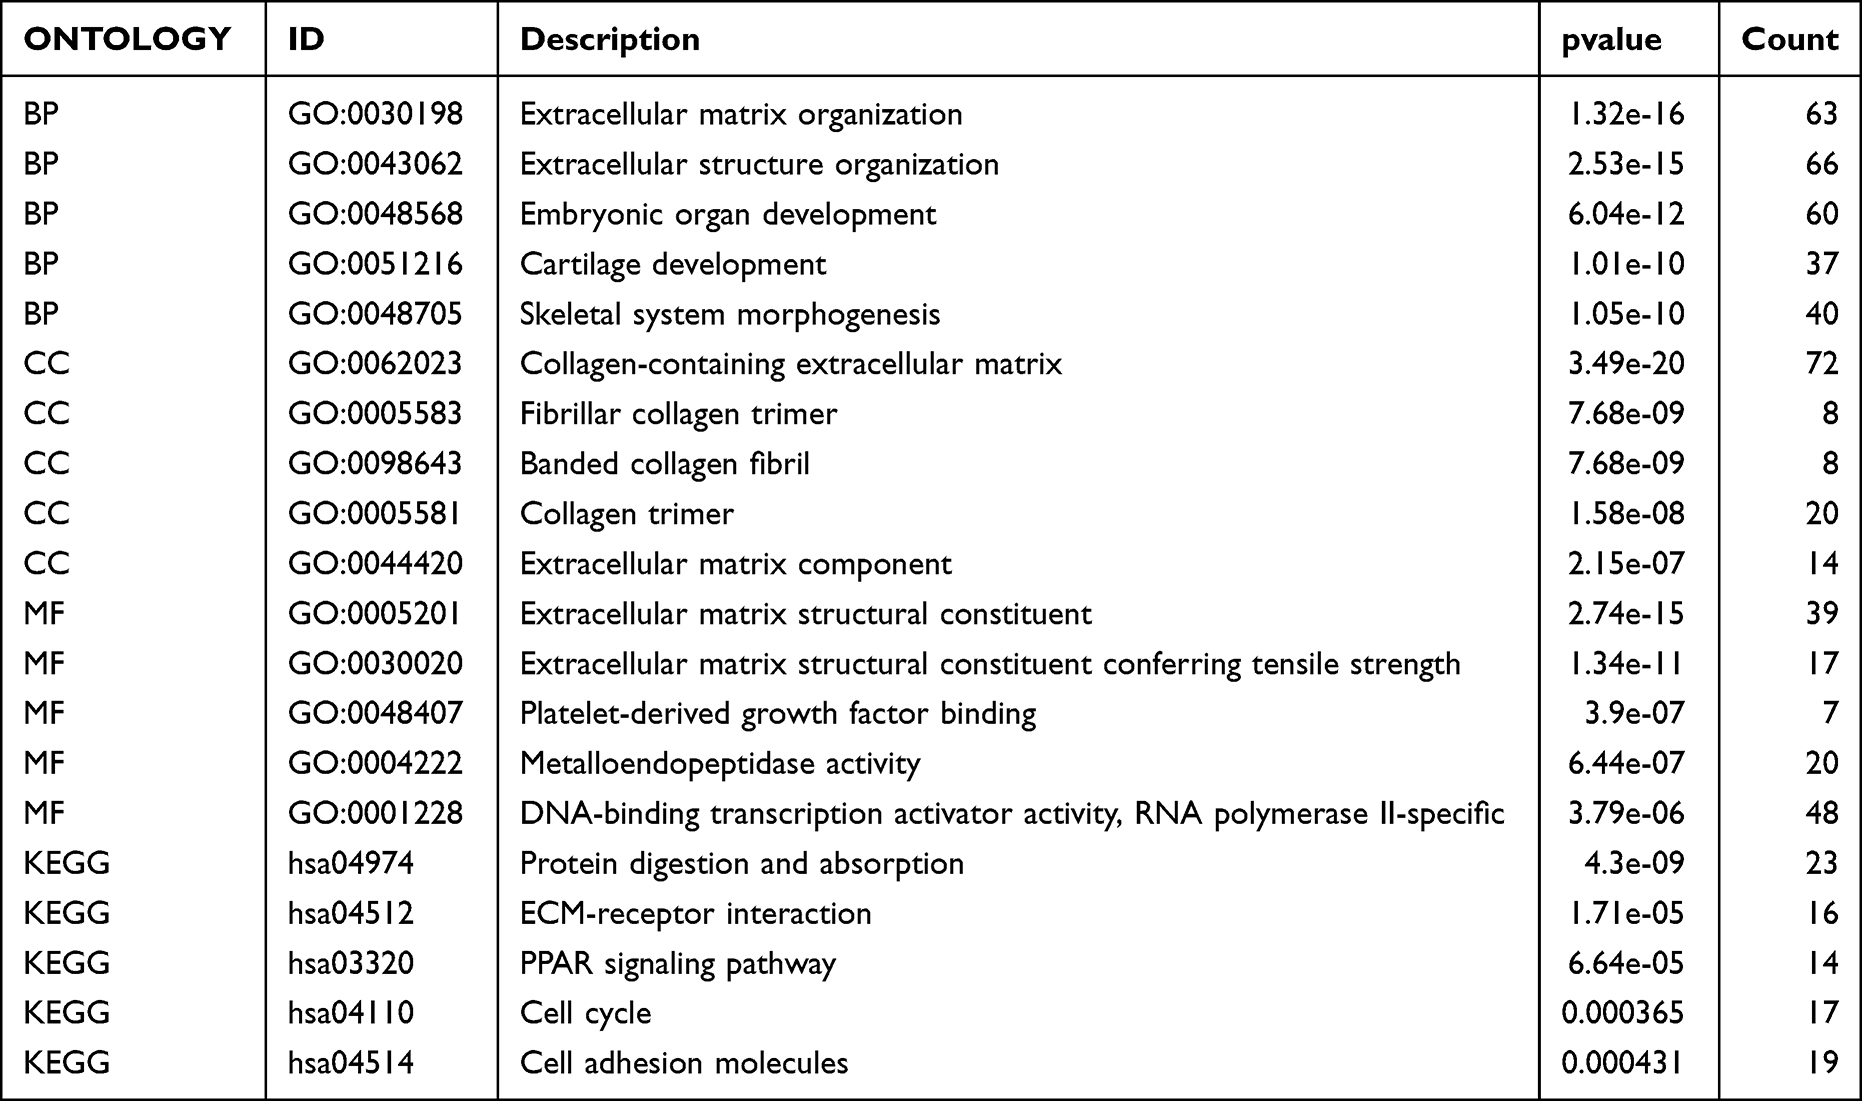 |
Table 3 Analysis of GO and KEGG |
 |
Table 4 Analysis of GSEA |
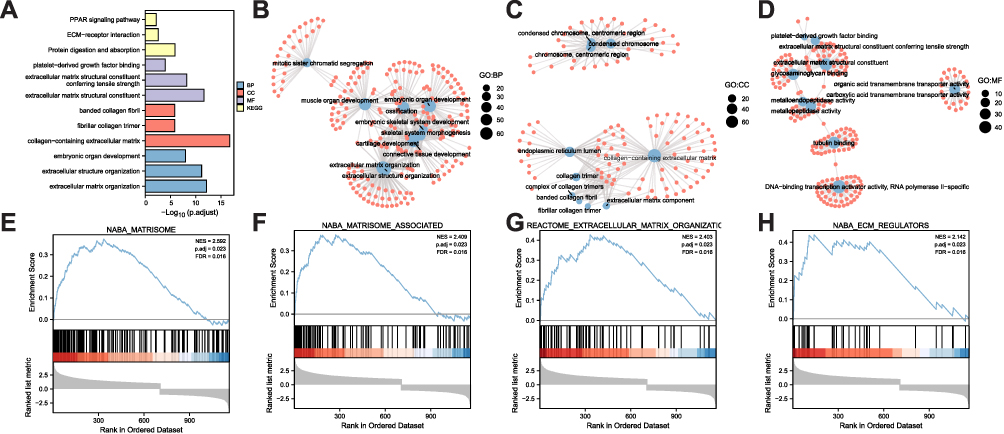 |
Figure 3 Functional correlation analysis for DEGs. (A) GO biological function enrichment analysis, wherein the X-axis represents the proportion of enriched DEGs and the color represents the corrected p-value; the redder the color, the smaller the corrected p-value, while the bluer the color, the greater the p-value after correction. (B) In BP functional enrichment analysis, the sizes of dots represent the number of enriched genes, and their color represents the logFC values. (C) CC functional enrichment analysis. (D) MF functional enrichment analysis. (E–H) GSEA. |
PPI Network Analysis
The protein interactions among DEGs were analyzed using STRING (Figure 4A), MCODE was used to identify hub genes (Figure 4B), and degree, MCC, and MNC algorithms were used to predict the “TOP10” target genes (Figure 4C–E) using Cytohubba. A Venn diagram (Figure 4F) was drawn for the hub genes from the four algorithms a total of 15 intersecting genes, CCNB1, ASPM, KIF11, BUB1, KIF20A, BUB1B, MYC, CDK1, BRCA1, KIF23, CCNB2, PBK, CENPF, NCAPG, and FGF2, were screened.
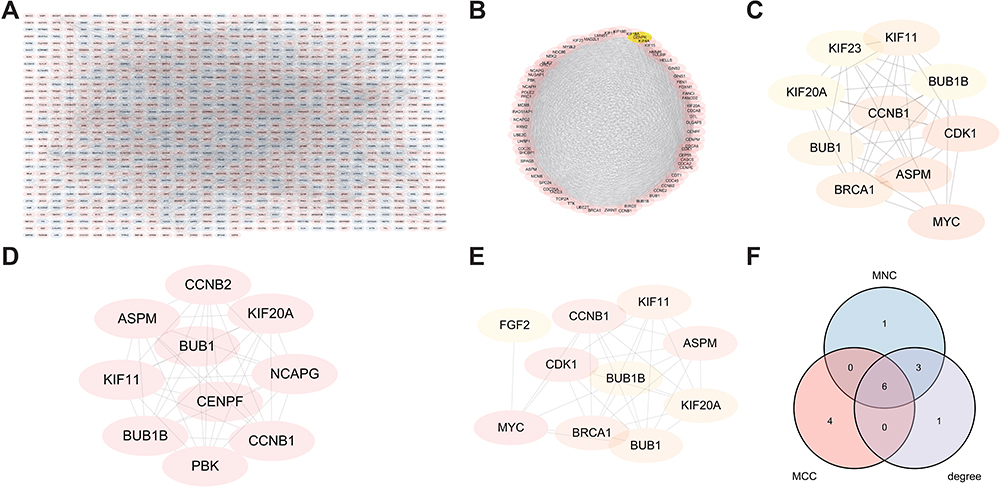 |
Figure 4 Protein-protein interaction network analysis for DEGs. (A) In the PPI network, pink represents a high gene expression, while purple represents a low gene expression. (B) Hub genes’ prediction is shown as a gradual change from yellow to red, and the darker the red, the higher the accuracy of the prediction. (C) Prediction of degree. (D) Prediction of MCC. (E) Prediction of MCN. (F) Union of the results from three algorithms. |
Functional Enrichment Analysis for Hub Genes
GO and KEGG analyses were utilized to further elucidate the potential biological functions of these 15 hub genes (Figure 5). Molecular function terms showed significant enrichment for organelle fission, nuclear division, mitotic sister chromatid segregation, mitotic nuclear division, and mitotic cell cycle checkpoint. Simultaneously, the spindle, condensed chromosome, chromosomal region, and centromeric region were significant among the cellular components. Microtubule motor activity, protein serine/threonine kinase activity, cell cycle, cellular senescence, p53 signaling pathway, and oocyte meiosis were also markedly enriched.
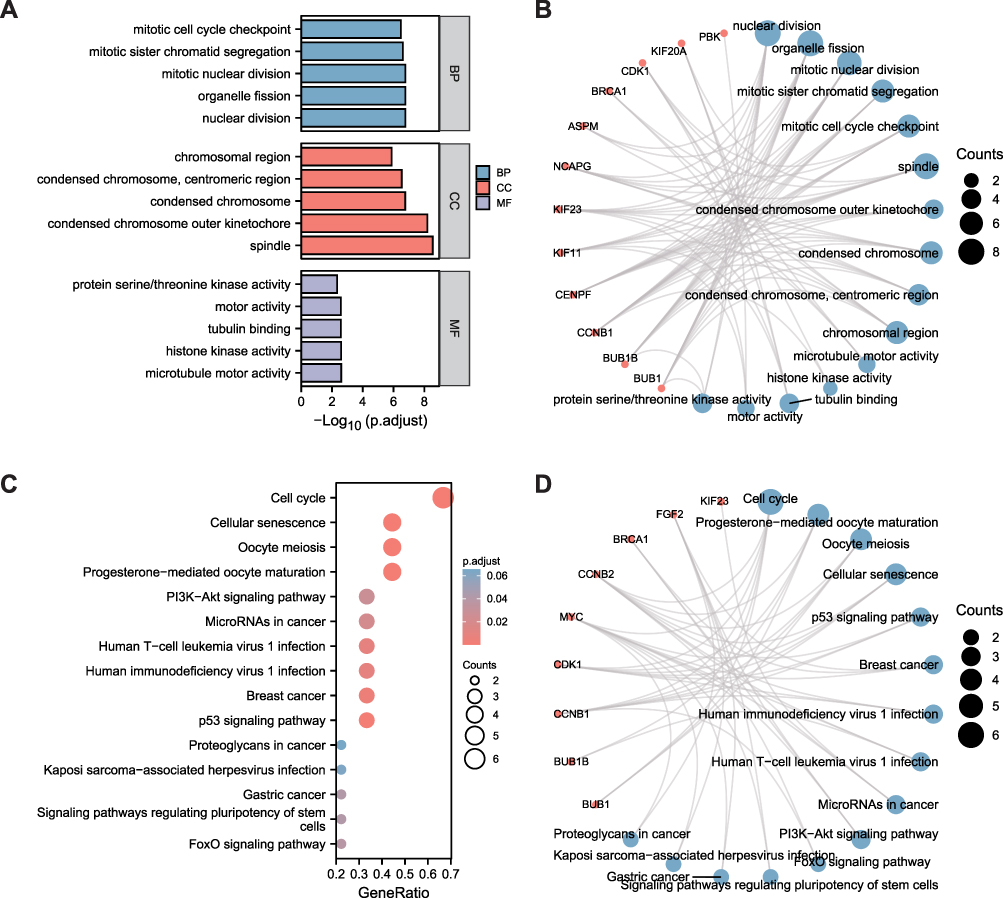 |
Figure 5 Functional correlation among the 15 DEGs. (A) GO functional correlation analysis (BP, CC, and MF histograms). (B) The ring pattern shows the correlation between the molecule and GO function. (C) KEGG functional correlation analysis. (D) The ring pattern shows the correlation between the molecule and KEGG function. |
The heat map of hub genes is shown in Figure 6A. The expression of hub genes, BUB1B, CCNB1, KIF20A, BUB1, ASPM, and KIF11 in GSE42109 was analyzed (Figure 6B–G). By comparing the differences in the expression of genes between the disease and the control groups, significant differences were obtained in KIF20A, BUB1B, and CCNB1 (p < 0.01) expressions, while those of ASPM and KIF11 showed no significant differences (p > 0.05).
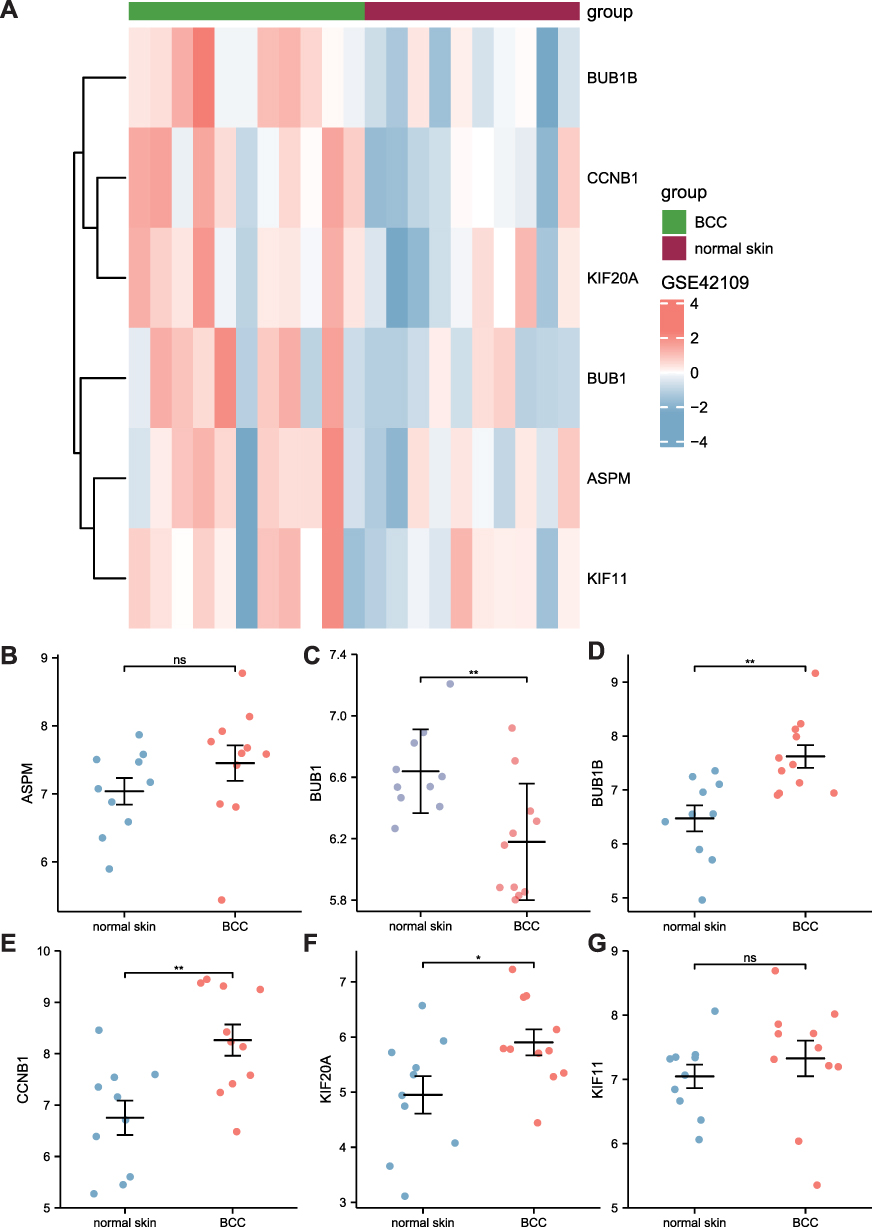 |
Figure 6 Validation of hub genes in the GSE42109 dataset. (A) The heat map for 6 hub genes in the GSE42109 dataset. (B–G) The scatter diagram shows the differential expression of the 6 hub genes, wherein blue and red represent the control and BCC groups, respectively. NS represents no statistical significance. P < 0.05 represents statistical significance. *p < 0.05; **p < 0.01. |
Diagnostic Model
LASSO and SVM algorithms were utilized to develop a diagnostic model using the 15 hub genes in the GSE42109 dataset to distinguish between control and disease groups. In the process of establishing the LASSO regression model (Figure 7A), the number and coefficient of selected characteristics for different λ states decreased with an increase in λ, while the absolute value of the coefficient increased significantly. The SVM model was constructed based on the 15 hub genes (Figure 7B), and the position of the red circle showed the lowest error rate. Subsequently, the Venn diagram (Figure 7C) was drawn to obtain the common genes in the two models, and a total of 8 genes were screened (CCNB2, MYC, KIF23, NCAPG, BRCA1, FGF20, BUB1B, and BUB1). Three representative genes (FGF20, KIF23, and NCAPG) were selected for plotting the ROC curves, and the AUC was computed (0.586, 0.991, and 0.936, respectively; Figure 7D), indicating the predictive ability of the model. KIF23 and NCAPG showed excellent power, while FGF20 was relatively mediocre in performance.
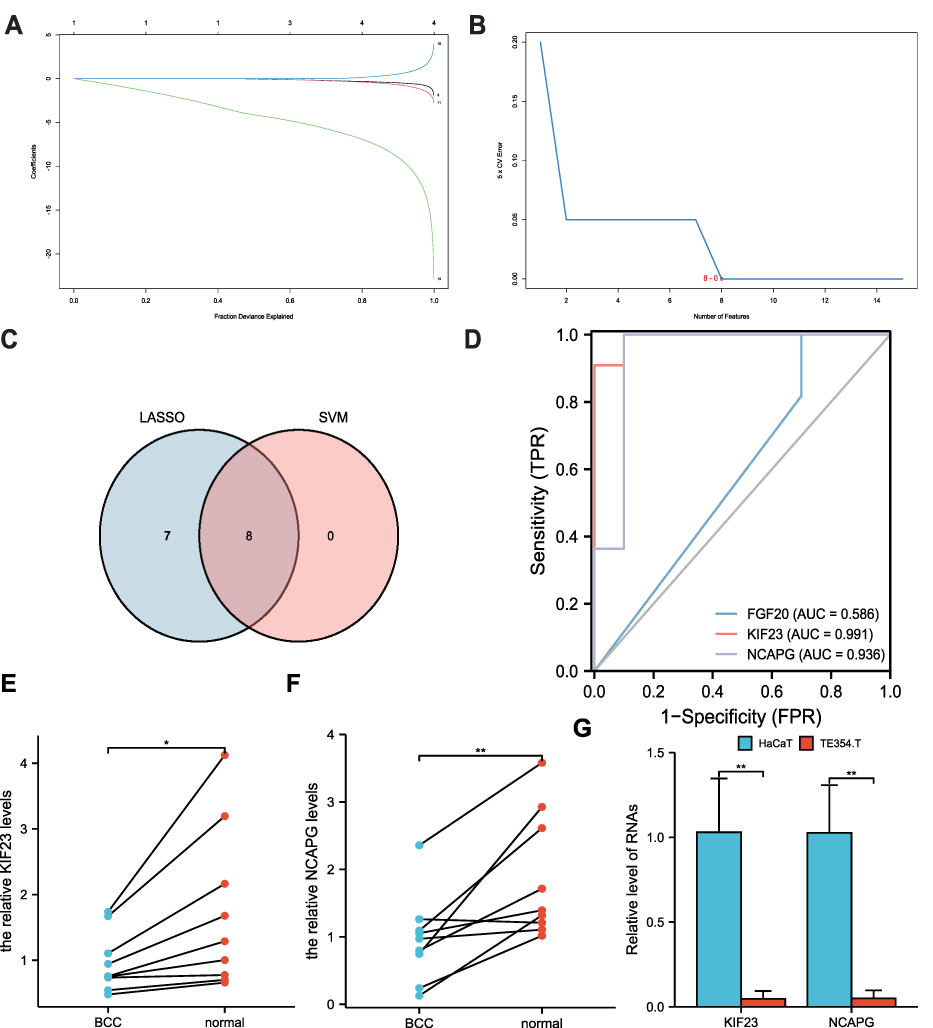 |
Figure 7 LASSO and SVM analyses were performed to develop the diagnostic model. (A) LASSO heat map information for 15 hub genes in the GSE42109 dataset. (B) The LASSO scatter diagram shows the differential expression of the 6 hub genes, wherein blue and red represent the control and BCC groups, respectively. P < 0.05 represents statistical significance. * p < 0.05; * * p< 0.01. (C) The Venn diagram was drawn to obtain the common genes in the two models. (D) The predictive ability of the model. (E and F) qRT-PCR was performed to compare the levels of KIF23 and NCAPG mRNA in BCC tissues and paired-adjacent normal tissues. (G) The levels of KIF23 and NCAPG mRNA in TE354.T and HaCaT cell lines. *p < 0.05; **p < 0.01. The primers used in qRT-PCR were shown in.Table 2. |
Further, the levels of KIF23 and NCAPG mRNA were assessed by RT-qPCR (Supplementary Table 1). We compared the expressions between 9 pairs of BCC tissues and para-cancer tissues. KIF23 and NCAPG showed a low expression in BCC tissues (Figure 7E and F). In TE354.T and HaCaT cell lines, KIF23 and NCAPG showed low expression (Figure 7G). These results indicated that KIF23 and NCAPG may serve as tumor suppressors in BCC.
Analysis and Visualization of Immune Cell Infiltrates
The results of the heat map and PCA clusters for immune cell infiltration showed significant differences between BCC and control samples (Figure 8A and B). The results of 28 immune cell-related subsets (Figure 8C) showed that as compared to genecluster-B, genecluster-A showed higher infiltration of CD56 bright natural killer cells, activated dendritic cells, activated CD4 T cells, CD56 dim natural killer cells, activated B cells, effector memory CD4 T cells, activated CD8 T cells, gamma delta T cells, effector memory CD8 T cells, natural killer cells, natural killer T cells, memory B cells, type 1 T helper cells, regulatory T cells, and neutrophils.
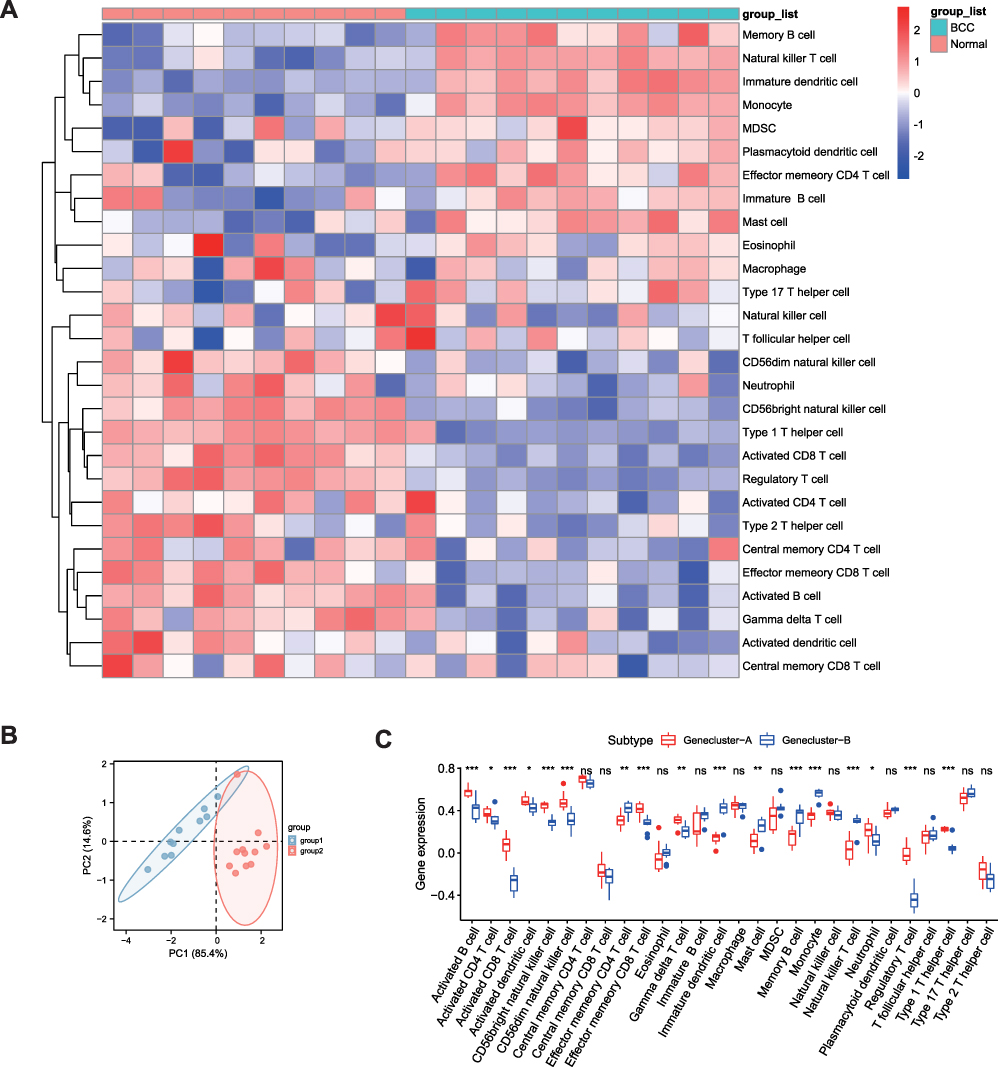 |
Figure 8 Analysis and visualization of immune cell infiltration. (A) Heat map of immune infiltration analysis between BCC and normal tissues. Wherein blue and red represent the BCC and normal tissues, respectively. (B) PCA clustering diagram for immune infiltration analysis between BCC and normal tissues. Red for genecluster-A group and blue for the genecluster-B group. (C) Correlation histogram for infiltration of 28 immune cell types. Red represents the genecluster-A group and blue represents the genecluster-B group; the horizontal coordinate represents different immune cells, and the vertical coordinate represents the gene expression in the immune cells corresponding to different samples. NS represents no statistical significance. P < 0.05 represents statistical significance. *p < 0.05; **p < 0.01; ***p < 0.001. |
CIBERSORT was further utilized to calculate the correlation between hub genes and immunity from the heat map. First, the abundance of each cell type was calculated (Figure 9A). In the barplot, It shows the proportion of the 21 immune cells in each patient, as calculated by CIBERSORT. The correlation heat map of 21 immune cells is shown in Figure 9B. Correlations for FGF20 in macrophages M1 (R = 0.64, P = 0.0017) (Figure 9C), FGF20 in T cells CD4 memory activated (R = 0.54, P = 0.011) (Figure 9D), KIF23 in macrophages M0 (R = 0.46, P = 0.034) (Figure 9E), NCAPG in natural killer (NK) cells resting (R = 0.47, P = 0.032) (Figure 9F), and NCAPG in T cells regulatory (Treg) (R = 0.44, P = 0.044) (Figure 9G) showed statistical significance.
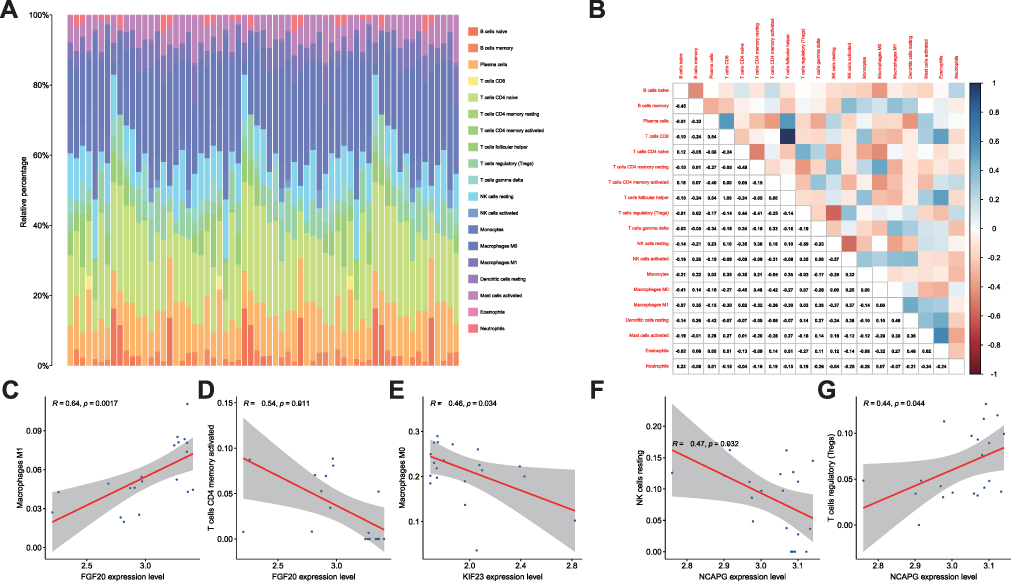 |
Figure 9 CIBERSORT was used to draw the heat map of the correlation between hub genes and immunity. (A) CIBERSORT was used to draw the heat map of the correlation between hub genes and immunity. (B) Correlation heat map for 21 immune cell types. (C) Correlation of FGF20 with Macrophages M1 (R = 0.64, P = 0.0017). (D) Correlation of FGF20 with T cells CD4 memory activated (R = 0.54, P = 0.011). (E) Correlation of KIF23 with Macrophages M0 (R = 0.46, P = 0.034). (F) Correlation of NCAPG with NK cells resting (R = 0.47, P = 0.032). (G) Correlation of NCAPG with T cells regulatory (Treg) (R = 0.44, P = 0.044). |
Construction of the ceRNA Network
DianaTools (http://diana.imis.athena-innovation.gr/DianaTools/index.php?r=tarbase/index), TargetScanHuman (https://www.targetscan.org/vert_72/), and miRDB (http://www.mirdb.org/cgi-bin/search.cgi) were used to extract the potential miRNAs of hub genes, after obtaining the intersection of the three using a Venn diagram (Figure 10A). Two miRNAs (hsa-miR-107 and HSA-miR-103A-3p) were obtained. StarBase V2.0 (https://starbase.sysu.edu.cn/starbase2/browseNcRNA.php) was used to predict the potential lncRNAs of hsa-miR-107 and hsa-miR-103a-3p, and after taking the intersection using a Venn diagram (Figure 10B), 12 lncRNAs (XIST, H19, TP73-AS1, KCNQ1OT1, TTC28-AS1, NEAT1, NUTM2A-AS1, TTN-AS1, HCG18, CROCCP2, LINC00662, and FGD5-AS1) were identified. The molecular relationship in the ceRNA network among mRNAs, miRNAs, and lncRNAs is shown (Figure 10C).
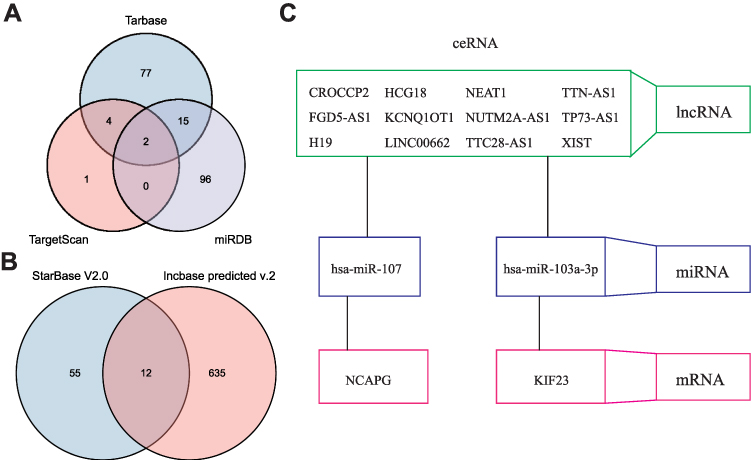 |
Figure 10 ceRNA analysis for hub genes. (A) The Venn diagram shows the potential miRNAs of the hub genes. (B) The Venn diagram shows the potential lncRNAs of hub genes. (C) Construction of the ceRNA model. |
Discussion
BCC is one of the most frequent skin malignancies which grows slowly and rarely metastasizes.38,39 Its occurrence is closely related to the environment, exposure to ultraviolet light, and radiation sources.2 Several studies on the pathogenesis of BCC point to the involvement of genes related to the Hh pathway. However, no systematic report details the role and association of mRNAs in BCC. In this study, GSE103439 (including 4 cases of eyelid BCC and 2 cases of normal epidermal keratinocytes) and GSE7553 (including 15 cases of BCC and 3 normal skin tissue samples) datasets were extracted. Combined with the transcriptomic sequencing results from 10 BCC samples and 10 para-cancer tissues collected by our research group, 27 DEGs were identified. A total of 15 hub genes were screened by PPI network analysis. GO and KEGG functional enrichment analyses were performed to elucidate the potential biological roles underlying the 15 hub genes. A diagnostic model was constructed to determine the predictive ability of hub genes, and the tumor microenvironment in BCC was investigated by immune infiltration analysis. Finally, the potential miRNAs and lncRNAs related to the hub genes were analyzed on relevant websites to obtain the ceRNA interaction network.
The hub genes were found to participate in the p53 signaling pathway and cell cycle. p53 is a major tumor suppressor, which acts on several stress response data signals according to the harmonious and special cellular responses, including cellular senescence, transient cell cycle arrest, and apoptosis, related critically to tumor suppression.40 p53 mutations are present in >50% of all human tumors.41 It is mainly related to the decreased ability of p53 to recognize DNA caused by ultraviolet radiations.42 The cell cycle is a relatively controlled process, which can promote cell growth, copying of genetic information, and cell division. Dysregulation of the cell cycle can lead to cancer.43 Sivrikoz et al report that high cell cycle protein and cyclin D1 levels, along with low Bcl-2 scores are related to aggressive tumors. This conclusion can be used as an explanation to predict and analyze the aggressive behavior of BCC and BSC.44 CDK4/6 inhibitors can be used to target cell cycle proteins in tumor therapy.45 Our findings further confirmed the role of the p53 signaling pathway and cell cycle in BCC.
To distinguish control from the disease group, a diagnostic model was developed for the GSE42109 dataset using LASSO and SVM algorithms for 15 hub genes. Eight hub genes (CCNB2, MYC, KIF23, NCAPG, BRCA1, FGF20, BUB1B, and BUB1) were obtained from the two models. Three representative genes (FGF20, KIF23, and NCAPG) were selected for plotting the ROC curve, whereby KIF23 and NCAPG showed excellent predictive ability, while FGF20 showed relatively mediocre performance. KIF23 belongs to the kinesin family and is crucial for the proliferation and migration of malignant cells. Recent research indicates that as a putative oncogene, KIF23 is associated with the occurrence of breast,46 gastric,47 and colorectal cancers.48 NCAPG is a mitotic-associated chromosomal condensing protein. Multiple studies in recent years have confirmed abnormal NCAPG expression in distinct tumor types. NCAPG promotes anti-apoptosis and cellular proliferation through the activation of the PI3K/AKT/FOXO4 pathway in HCC,49 thus inducing cell proliferation in cardia adenocarcinoma.50 These two genes have not been previously reported in BCC. To further confirm our conclusions, qPCR was performed to detect their expression in 9 BCC and corresponding para-cancer tissue samples. The expression of three representative genes in TE354T and HaCaT cells was also assayed. The results are consistent with our model prediction. Therefore, KIF23 and NCAPG may be potential factors underlying BCC pathogenesis. Our strategy allowed us to concentrate on a small panel of genes with the highest diagnostic yield from a myriad of DEGs in BCC.
Additionally, we systematically examined the association between hub gene expression and immune infiltration degree in BCC. In the cancer microenvironment, immune cell infiltration plays a critical role in the progression and development of cancer.51 FGF20 correlated significantly with Macrophages M1 and T cells CD4 memory activated; KIF23 correlated significantly with Macrophages M0, while NCAPG with NK cells resting and Treg cells. NK cells and macrophages are cells responsible for innate immune responses and participate in tumor suppression either by triggering adaptive immune responses or directly killing tumor cells.52 B and T cells belong to the adaptive immune system; the former plays a major role in humoral immune responses, whereas the latter participates in cell-mediated immune responses.53 Immunotherapy is promising for cancer treatment and has revolutionized the field of tumor immunology. Hedgehog pathway inhibitors (HHIs) are often used as drug targets for patients with advanced BCC; however, some develop resistance.54 Thus, the development of new treatment strategies is necessary. These findings suggest that immunotherapy can be used for BCC in the future.
Increasing evidence suggests that lncRNAs can bind to miRNAs as ceRNAs to influence and regulate the expression of their target genes. The ceRNA network comprising lncRNA-miRNA-mRNA has been widely studied and plays an essential role in several tumors. However, the efficacy of lncRNA-related ceRNAs in controlling BCC is unclear. DianaTools, TargetScanHuman, and miRDB were used to predict the potential miRNAs of hub genes, and 2 miRNAs (hsa-miR-107 and hsa-miR-103a-3p) were finally obtained. Starbase v2.0 was used to predict and analyze the potential lncRNAs of hsa-miR-107 and hsa-miR-103a-3p, and 12 lncRNAs were finally obtained (XIST, H19, TP73-AS1, KCNQ1OT1, TTC28-AS1, NEAT1, NUTM2A-AS1, TTN-AS1, HCG18, CROCCP2, LINC00662, and FGD5-AS1). Recent studies have confirmed our results. H19 is overexpressed in VDR deleted keratinocytes both in cultured cells and epidermis, leading to the formation of skin tumors.55 XIST, a crucial regulator of development and growth, participates in tumor formation and several human diseases, including leukemia, brain tumors, breast cancer, liver cancer, and lung cancer as a ceRNA.56 TP73-AS1 regulates the occurrence and development of tumors as a ceRNA.57 Thus, the role of ceRNA-related genes in BCC needs further confirmation.
Taken together, the combination of three expression datasets (GSE103439, GSE7553, and GSE42109) and our transcriptome sequencing data, a stable comprehensive analysis was performed to study the differential expression of mRNAs related to BCC progression. A total of 27 DEGs and 15 hub genes were evaluated, which may serve as potential oncogenes in BCC. Multiple biomarkers were identified from the diagnostic model, having practical significance for disease diagnosis. Although bioinformatic methods were used to systematically analyze the function and interaction networks of mRNAs in BCC, the study has some limitations. First, direct evidence from rescue and animal experiments showing that mRNAs are likely to harm the growth of BCC is lacking. Second, clinical features, such as pathological classification was not included in our analysis. Finally, the information was downloaded from public repositories and our transcriptome sequencing data were from a relatively small patient cohort.
Conclusions
In summary, FGF20, KIF23, and NCAPG were identified as diagnostic biomarkers of BCC. Moreover, these findings provide a dataset of hub genes/mRNA candidates and their functions and interaction networks were analyzed in detail. Therefore, our research is helpful in further understanding the mRNA regulation underlying the pathogenesis of BCC.
Abbreviations
BCC, basal cell carcinoma; NK, natural killer; CPD, cyclobutane pyrimidine dimer; NMSCs, Non-melanoma skin cancers; Hh, hedgehog; DEMs, differentially expressed mRNAs; DEGs, differentially expressed genes; PPI, protein-protein interaction; HHIs, hedgehog pathway inhibitors; GO, Gene Ontology; KEGG, Kyoto Encyclopedia of Genes and Genomes; GSEA, Gene set enrichment analysis; RF, random forest; ATCC, American Type Culture Collection; qRT-PCR, quantitative real-time PCR.
Data Sharing Statement
The datasets used and/or analyzed during the current study are available from the corresponding author on reasonable request. Gene expression profiles, GSE103439, GSE7553, and GSE42109 are available in the GEO database (https://www.ncbi.nlm.nih.gov/geo/).
Ethics Approval and Consent to Participate
The experiment was approved by the Ethics Committee of the First Affiliated Hospital of Nanchang University (No.2021-57). The research has been carried out in accordance with the World Medical Association Declaration of Helsinki, and that all subjects provided written informed consent.
Acknowledgments
We acknowledge and appreciate our colleagues for their valuable suggestions and technical assistance for this study.
Funding
This work was supported by the National Natural Science Foundation of China (No. 81860484), the Natural Science Foundation of Jiangxi Province of China (No. 20202BABL206107), Science and Technology plan of Health and Family Planning Commission of Jiangxi Province of China (No.20191054).
Disclosure
The authors declare no potential conflicts of interest in this work.
References
1. Whitson RJ, Lee A, Urman NM, et al. Noncanonical hedgehog pathway activation through SRF-MKL1 promotes drug resistance in basal cell carcinomas. Nat Med. 2018;24(3):271–281. doi:10.1038/nm.4476
2. Cameron MC, Lee E, Hibler BP, et al. Basal cell carcinoma: epidemiology; pathophysiology; clinical and histological subtypes; and disease associations. J Am Acad Dermatol. 2019;80(2):303–317. doi:10.1016/j.jaad.2018.03.060
3. Blanpain C, Lowry WE, Geoghegan A, et al. Self-renewal, multipotency, and the existence of two cell populations within an epithelial stem cell niche. Cell. 2004;118(5):635–648. doi:10.1016/j.cell.2004.08.012
4. Cazzato G, Cimmino A, Colagrande A, et al. The multiple faces of nodular trichoblastoma: review of the literature with case presentation. Dermatopathology. 2021;8(3):265–270. doi:10.3390/dermatopathology8030032
5. Naik PP, Desai MB. Basal cell carcinoma: a narrative review on contemporary diagnosis and management. Oncol Ther. 2022;10(2):317–335. doi:10.1007/s40487-022-00201-8
6. Narayanan DL, Saladi RN, Fox JL. Ultraviolet radiation and skin cancer. Int J Dermatol. 2010;49(9):978–986. doi:10.1111/j.1365-4632.2010.04474.x
7. Cives M, Mannavola F, Lospalluti L, et al. Non-melanoma skin cancers: biological and clinical features. Int J Mol Sci. 2020;21(15):5394. doi:10.3390/ijms21155394
8. Briscoe J, Therond PP. The mechanisms of hedgehog signalling and its roles in development and disease. Nat Rev Mol Cell Biol. 2013;14(7):416–429. doi:10.1038/nrm3598
9. Pellegrini C, Maturo MG, Di Nardo L, et al. Understanding the molecular genetics of basal cell carcinoma. Int J Mol Sci. 2017;18(11):2485. doi:10.3390/ijms18112485
10. Jiang J. Hedgehog signaling mechanism and role in cancer. Semin Cancer Biol. 2021;85:107–122. doi:10.1016/j.semcancer.2021.04.003
11. Pak E, Segal RA. Hedgehog signal transduction: key players, oncogenic drivers, and cancer therapy. Dev Cell. 2016;38(4):333–344. doi:10.1016/j.devcel.2016.07.026
12. Qi C, Di Minin G, Vercellino I, et al. Structural basis of sterol recognition by human hedgehog receptor PTCH1. Sci Adv. 2019;5(9):eaaw6490. doi:10.1126/sciadv.aaw6490
13. Bonilla X, Parmentier L, King B, et al. Genomic analysis identifies new drivers and progression pathways in skin basal cell carcinoma. Nat Genet. 2016;48(4):398–406. doi:10.1038/ng.3525
14. Islam MA, Reesor EK, Xu Y, et al. Biomaterials for mRNA delivery. Biomater Sci. 2015;3(12):1519–1533. doi:10.1039/C5BM00198F
15. Ahmadi-Beni R, Vand-Rajabpour F, Ahmadifard M, et al. Decreased Sox2 messenger RNA expression in basal cell carcinoma. Indian J Dermatol. 2020;65(3):178–182. doi:10.4103/ijd.IJD_387_18
16. Zhao H, Cao Y, Wang G, et al. Expression of FOXC2, PinX1, Ki-67 and Cyclin D1 in cutaneous cell carcinoma. Oncol Lett. 2017;14(1):635–638. doi:10.3892/ol.2017.6244
17. Sand M, Bromba A, Sand D, et al. Dicer sequencing, whole genome methylation profiling, mrna and smallrna sequencing analysis in basal cell carcinoma. Cell Physiol Biochem. 2019;53(5):760–773.
18. Judelson HS, Narayan RD, Ah-Fong AM, et al. Gene expression changes during asexual sporulation by the late blight agent Phytophthora infestans occur in discrete temporal stages. Mol Genet Genomics. 2009;281(2):193–206. doi:10.1007/s00438-008-0407-5
19. Yunoki T, Tabuchi Y, Hirano T, et al. Gene networks in basal cell carcinoma of the eyelid, analyzed using gene expression profiling. Oncol Lett. 2018;16(5):6729–6734. doi:10.3892/ol.2018.9484
20. Riker AI, Enkemann SA, Fodstad O, et al. The gene expression profiles of primary and metastatic melanoma yields a transition point of tumor progression and metastasis. BMC Med Genomics. 2008;1:13. doi:10.1186/1755-8794-1-13
21. Ning H, Mitsui H, Wang CQ, et al. Identification of anaplastic lymphoma kinase as a potential therapeutic target in basal cell carcinoma. Oncotarget. 2013;4(12):2237–2248. doi:10.18632/oncotarget.1357
22. Gautier L, Cope L, Bolstad BM, et al. affy--analysis of Affymetrix GeneChip data at the probe level. Bioinformatics. 2004;20(3):307–315. doi:10.1093/bioinformatics/btg405
23. Ginestet C. ggplot2: elegant graphics for data analysis. J R Stat Soc Ser a Stat Soc. 2011;174:245. doi:10.1111/j.1467-985X.2010.00676_9.x
24. Ritchie ME, Phipson B, Wu D, et al. limma powers differential expression analyses for RNA-sequencing and microarray studies. Nucleic Acids Res. 2015;43(7):e47. doi:10.1093/nar/gkv007
25. Kolde R. pheatmap: pretty Heatmaps. R package version 1.0.12; 2019.
26. Csardi G. Nepusz T: the igraph software package for complex network research. Int J Complex Syst. 2006;1695:1–9.
27. Reshaping WH. Data with the reshape Package. J Stat Softw. 2007;21(12):21–22.
28. Yu G, Wang LG, Han Y, et al. clusterProfiler: an R package for comparing biological themes among gene clusters. Omics. 2012;16(5):284–287. doi:10.1089/omi.2011.0118
29. Szklarczyk D, Gable AL, Lyon D, et al. STRING v11: protein-protein association networks with increased coverage, supporting functional discovery in genome-wide experimental datasets. Nucleic Acids Res. 2019;47(D1):D607–D613. doi:10.1093/nar/gky1131
30. Shannon P, Markiel A, Ozier O, et al. Cytoscape: a software environment for integrated models of biomolecular interaction networks. Genome Res. 2003;13(11):2498–2504. doi:10.1101/gr.1239303
31. Chin CH, Chen SH, Wu HH, et al. cytoHubba: identifying hub objects and sub-networks from complex interactome. BMC Syst Biol. 2014;8(Suppl 4):S11. doi:10.1186/1752-0509-8-S4-S11
32. Friedman J, Hastie T, Tibshirani R. Regularization paths for generalized linear models via coordinate descent. J Stat Softw. 2010;33(1):1–22. doi:10.18637/jss.v033.i01
33. Meyer D, Dimitriadou E, Hornik K, et al. Functions of the department of statistics, probability theory group (formerly: E1071), TU Wien. CRAN. 2021;1:7–9.
34. Liaw A, Wiener M. Classification and regression by randomForest. R News. 2002;2:18–22.
35. Robin X, Turck N, Hainard A, et al. pROC: an open-source package for R and S+ to analyze and compare ROC curves. BMC Bioinform. 2011;12:77. doi:10.1186/1471-2105-12-77
36. Wilkerson MD, Hayes DN. ConsensusClusterPlus: a class discovery tool with confidence assessments and item tracking. Bioinformatics. 2010;26(12):1572–1573. doi:10.1093/bioinformatics/btq170
37. Kassambara A. ggpubr: ‘ggplot2’ based publication ready plots. R package version 0.4.0; 2020.
38. Hasan A, Rabie A, Elhussiny M, et al. Recurrent cutaneous basal cell carcinoma after surgical excision: a retrospective clinicopathological study. Ann Med Surg. 2022;78:103877. doi:10.1016/j.amsu.2022.103877
39. Juniat V, Shah P, Vonica O, et al. Periocular basal cell carcinoma recurrence following surgical treatment: safe surveillance time. Eye. 2022. doi:10.1038/s41433-022-02133-z
40. Bieging KT, Mello SS, Attardi LD. Unravelling mechanisms of p53-mediated tumour suppression. Nat Rev Cancer. 2014;14(5):359–370. doi:10.1038/nrc3711
41. Freed-Pastor WA, Prives C. Mutant p53: one name, many proteins. Genes Dev. 2012;26(12):1268–1286. doi:10.1101/gad.190678.112
42. Abu juba B, Şovrea A, Crişan D, et al. Apoptotic markers in photoinduced cutaneous carcinoma. Rom J Morphol Embryol. 2013;54(3 Suppl):741–747.
43. Matthews HK, Bertoli C, de Bruin RAM. Cell cycle control in cancer. Nat Rev Mol Cell Biol. 2022;23(1):74–88. doi:10.1038/s41580-021-00404-3
44. Kandiloğlu ONS. The effects of cyclin D1 and Bcl-2 expression on aggressive behavior in basal cell and basosquamous carcinoma. Iran J Pathol. 2015;10(3):185–191.
45. Suski JM, Braun M, Strmiska V, et al. Targeting cell-cycle machinery in cancer. Cancer Cell. 2021;39(6):759–778. doi:10.1016/j.ccell.2021.03.010
46. Jian W, Deng XC, Munankarmy A, et al. KIF23 promotes triple negative breast cancer through activating epithelial-mesenchymal transition. Gland Surg. 2021;10(6):1941–1950. doi:10.21037/gs-21-19
47. Liang WT, Liu XF, Huang HB, et al. Prognostic significance of KIF23 expression in gastric cancer. World J Gastrointest Oncol. 2020;12(10):1104–1118. doi:10.4251/wjgo.v12.i10.1104
48. Ji Z, Mi A, Li M, et al. Aberrant KIF23 expression is associated with adverse clinical outcome and promotes cellular malignant behavior through the Wnt/β-catenin signaling pathway in Colorectal Cancer. J Cancer. 2021;12(7):2030–2040. doi:10.7150/jca.51565
49. Gong C, Ai J, Fan Y, et al. NCAPG promotes the proliferation of hepatocellular carcinoma through PI3K/AKT signaling. Onco Targets Ther. 2019;12:8537–8552. doi:10.2147/OTT.S217916
50. Zhang X, Wang H, Han Y, et al. NCAPG induces cell proliferation in cardia adenocarcinoma via PI3K/AKT signaling pathway. Onco Targets Ther. 2020;13:11315–11326. doi:10.2147/OTT.S276868
51. Zhang Y, Zhang Z. The history and advances in cancer immunotherapy: understanding the characteristics of tumor-infiltrating immune cells and their therapeutic implications. Cell Mol Immunol. 2020;17(8):807–821. doi:10.1038/s41423-020-0488-6
52. Demaria O, Cornen S, Daëron M, et al. Harnessing innate immunity in cancer therapy. Nature. 2019;574(7776):45–56. doi:10.1038/s41586-019-1593-5
53. Vesely MD, Kershaw MH, Schreiber RD, et al. Natural innate and adaptive immunity to cancer. Annu Rev Immunol. 2011;29:235–271. doi:10.1146/annurev-immunol-031210-101324
54. Doan HQ, Chen L, Nawas Z, et al. Switching Hedgehog inhibitors and other strategies to address resistance when treating advanced basal cell carcinoma. Oncotarget. 2021;12(20):2089–2100. doi:10.18632/oncotarget.28080
55. Bikle DD, Jiang Y, Nguyen T, et al. Disruption of vitamin D and calcium signaling in keratinocytes predisposes to skin cancer. Front Physiol. 2016;7:296. doi:10.3389/fphys.2016.00296
56. Wang W, Min L, Qiu X, et al. Biological function of long non-coding RNA (LncRNA) Xist. Front Cell Dev Biol. 2021;9:645647. doi:10.3389/fcell.2021.645647
57. Chu F, Xue L, Miao H. Long noncoding RNA TP73-AS1 in human cancers. Clinica chimica acta. 2020;500:104–108. doi:10.1016/j.cca.2019.09.024
 © 2022 The Author(s). This work is published and licensed by Dove Medical Press Limited. The full terms of this license are available at https://www.dovepress.com/terms.php and incorporate the Creative Commons Attribution - Non Commercial (unported, v3.0) License.
By accessing the work you hereby accept the Terms. Non-commercial uses of the work are permitted without any further permission from Dove Medical Press Limited, provided the work is properly attributed. For permission for commercial use of this work, please see paragraphs 4.2 and 5 of our Terms.
© 2022 The Author(s). This work is published and licensed by Dove Medical Press Limited. The full terms of this license are available at https://www.dovepress.com/terms.php and incorporate the Creative Commons Attribution - Non Commercial (unported, v3.0) License.
By accessing the work you hereby accept the Terms. Non-commercial uses of the work are permitted without any further permission from Dove Medical Press Limited, provided the work is properly attributed. For permission for commercial use of this work, please see paragraphs 4.2 and 5 of our Terms.