Back to Journals » Neuropsychiatric Disease and Treatment » Volume 16
Prediction of Amyloid Positivity in Mild Cognitive Impairment Using Fully Automated Brain Segmentation Software
Authors Kang KM ![]() , Sohn CH
, Sohn CH ![]() , Byun MS
, Byun MS ![]() , Lee JH, Yi D
, Lee JH, Yi D ![]() , Lee Y, Lee JY
, Lee Y, Lee JY ![]() , Kim YK, Sohn BK
, Kim YK, Sohn BK ![]() , Yoo RE
, Yoo RE ![]() , Yun TJ
, Yun TJ ![]() , Choi SH, Kim J
, Choi SH, Kim J ![]() , Lee DY
, Lee DY ![]()
Received 3 March 2020
Accepted for publication 3 July 2020
Published 22 July 2020 Volume 2020:16 Pages 1745—1754
DOI https://doi.org/10.2147/NDT.S252293
Checked for plagiarism Yes
Review by Single anonymous peer review
Peer reviewer comments 3
Editor who approved publication: Professor Taro Kishi
Koung Mi Kang,1 Chul-Ho Sohn,2 Min Soo Byun,3 Jun Ho Lee,4 Dahyun Yi,3 Younghwa Lee,4 Jun-Young Lee,5 Yu Kyeong Kim,6 Bo Kyung Sohn,7 Roh-Eul Yoo,1 Tae Jin Yun,1 Seung Hong Choi,2 Ji-hoon Kim,1 Dong Young Lee8 On behalf of the KBASE Research Group
1Department of Radiology, Seoul National University Hospital, Seoul, Republic of Korea; 2Department of Radiology, Seoul National University Hospital, Seoul National University College of Medicine, Seoul, Republic of Korea; 3Medical Research Center Seoul National University, Institute of Human Behavioral Medicine, Seoul, Republic of Korea; 4Department of Neuropsychiatry, Seoul National University Hospital, Seoul, Republic of Korea; 5Department of Neuropsychiatry, SMG-SNU Boramae Medical Center, Seoul National University College of Medicine, Seoul, Republic of Korea; 6Department of Nuclear Medicine, SMG-SNU Boramae Medical Center, Seoul National University College of Medicine, Seoul, Republic of Korea; 7Department of Psychiatry, Sanggye Paik Hospital, Inje University College of Medicine, Seoul, Republic of Korea; 8Department of Neuropsychiatry, Seoul National University Hospital, Seoul National University College of Medicine, Seoul, Republic of Korea
Correspondence: Chul-Ho Sohn
Department of Radiology, Seoul National University Hospital, Seoul National University College of Medicine, 101 Daehak-Ro, Jongno-Gu, Seoul 03080, Republic of Korea
Tel +82-2-207203972
Fax +82-2-747-7418
Email [email protected]
Dong Young Lee
Department of Neuropsychiatry, Seoul National University Hospital, Seoul National University College of Medicine, 101 Daehak-Ro, Jongno-Gu, Seoul 03080, Republic of Korea
Tel +82-2-2072-2205
Fax +82-2-744-7241
Email [email protected]
Objective: To assess the predictive ability of regional volume information provided by fully automated brain segmentation software for cerebral amyloid positivity in mild cognitive impairment (MCI).
Methods: This study included 130 subjects with amnestic MCI who participated in the Korean brain aging study of early diagnosis and prediction of Alzheimer’s disease, an ongoing prospective cohort. All participants underwent comprehensive clinical assessment as well as 11C-labeled Pittsburgh compound PET/MRI scans. The predictive ability of volumetric results provided by automated brain segmentation software was evaluated using binary logistic regression and receiver operating characteristic curve analysis.
Results: Subjects were divided into two groups: one with Aβ deposition (58 subjects) and one without Aβ deposition (72 subjects). Among the varied volumetric information provided, the hippocampal volume percentage of intracranial volume (%HC/ICV), normative percentiles of hippocampal volume (HCnorm), and gray matter volume were associated with amyloid-β (Aβ) positivity (all P < 0.01). Multivariate analyses revealed that both %HC/ICV and HCnorm were independent significant predictors of Aβ positivity (all P < 0.001). In addition, prediction scores derived from %HC/ICV with age and HCnorm showed moderate accuracy in predicting Aβ positivity in MCI subjects (the areas under the curve: 0.739 and 0.723, respectively).
Conclusion: Relative hippocampal volume measures provided by automated brain segmentation software can be useful for screening cerebral Aβ positivity in clinical practice for patients with amnestic MCI. The information may also help clinicians interpret structural MRI to predict outcomes and determine early intervention for delaying the progression to Alzheimer’s disease dementia.
Keywords: amyloid, brain segmentation, magnetic resonance imaging, cognitive impairment
Introduction
Mild cognitive impairment (MCI) is an intermediate state between normal and Alzheimer’s disease (AD),1 and amnestic MCI has been considered a prodromal stage of AD dementia.2 However, approximately 40% of amnestic MCI individuals do not show sufficient cerebral amyloid-β (Aβ) deposition for the diagnosis of AD.3–6 Among amnestic MCI subjects, amyloid-positive (Aβ+) subjects were much more likely to develop dementia than were amyloid-negative (Aβ-) subjects (50% vs 19% within 2 years).7 Therefore, for early therapeutic intervention, the detection of high levels of Aβ deposition in MCI subjects is invaluable.
At present, the most well developed in vivo measures of cerebral Aβ deposition are cerebrospinal fluid (CSF) analyses and positron emission tomography (PET).8 However, CSF biomarkers and PET imaging are neither affordable nor widely available in all clinical settings. Therefore, since availability varies across countries, research towards more accessible diagnostic tools for an early AD diagnosis is still needed.9–11
Conversely, structural brain MRI is a completely noninvasive and widely used method to exclude other structural abnormalities and diagnose neurodegeneration in subjects with suspected AD.12 In particular, the association between the regional brain atrophy rate and Aβ load has been reported in MCI.13 Currently, there are several available software packages for brain segmentation and morphometry: FSL,14 FreeSurfer,15 and Statistical Parametric Mapping.16 However, the use of these software programs in routine clinical practice is limited due to their labor-intensive nature.
Recently, a US Food and Drug Administration-approved fully automated brain segmentation software (NeuroQuant, CorTechs Laboratories) has been introduced for clinical use.16 This tool provides absolute and relative volumes of various brain structures and normative percentiles compared with age-appropriate references in 6–8 minutes.17 Several previous studies reported the clinical usefulness of NeuroQuant to aid AD diagnosis or compare MCI converters vs nonconverters.17–19
Therefore, our aim was to assess the predictive ability of regional volume information provided by NeuroQuant for cerebral Aβ positivity in amnestic MCI individuals.
Materials and Methods
Participants
This study is based on the Korean Brain Aging Study for Early Diagnosis and Prediction of Alzheimer’s Disease (KBASE),20 an ongoing, prospective, community-based cohort study. As of February 2017, 130 amnestic MCI subjects were included. MCI diagnosis was established according to the recommendations of the National Institute on Aging-Alzheimer’s Association (NIA-AA) guidelines.21 The inclusion criteria for amnestic MCI were as follows: (a) memory complaints corroborated by the patient, an informant, or clinician; (b) objective memory impairment for age, education, and sex (ie, at least 1.0 standard deviation below the respective age, education, and sex-specific mean for at least one of the four episodic memory tests included in the Korean version of the Consortium to Establish a Registry for Alzheimer’s Disease [CERAD-K] neuropsychological battery [word list memory, word list recall, word list recognition and constructional recall test]); (c) largely intact functional activities; and (d) no dementia. The global clinical dementia rating (CDR) score of all MCI individuals was 0.5. The exclusion criteria were as follows: (a) presence of major psychiatric illness; (b) significant neurological or medical condition or comorbidities that could affect mental function; (c) contraindications to MRI (eg, pacemaker, claustrophobia); (d) illiteracy; (e) presence of significant visual/hearing difficulty; severe communication or behavioral problems that would make a clinical examination or a brain scan difficult; (f) use of an investigational drug; and (g) women who were pregnant or breastfeeding. More detailed information on recruitment of the KBASE cohort was described in our previous report.20 This study protocol was approved by the Institutional Review Boards of Seoul National University Hospital and Seoul National University-Seoul Metropolitan Government Boramae Center, and all subjects provided written informed consent.
Clinical Assessment
All subjects were examined by trained psychiatrists who had advanced training in dementia research using the CERAD-K based on the Korean clinical assessment protocol.20
Image Acquisition
All subjects underwent simultaneous three-dimensional (3D) [11C] Pittsburgh compound B (PiB)-PET and 3D T1-weighted magnetization-prepared rapid acquisition with gradient echo (MPRAGE) sequence MRI scans using a 3.0T Biograph mMR (PET-MR) scanner (Siemens, Washington DC, USA) according to the manufacturer’s approved guidelines. 3D T1-weighted images were acquired in the sagittal orientation, and the acquisition parameters were as follows: repetition time = 1670 ms, echo time = 1.89 ms, field of view = 250 mm, and a 256 × 256 matrix with a 1.0-mm slice thickness. For PiB-PET, a 30-minute emission scan was obtained 40 minutes after intravenous administration of 555 MBq of [11C]PiB (range, 450–610 MBq). The PiB-PET data collected in list mode were processed for routine corrections such as uniformity, UTE-based attenuation, and decay corrections and were reconstructed into a 344 × 344 image matrix using iterative methods (5 iterations with 21 subsets).
Volumetric MRI Analyses
For each subject, a set of T1-weighted MPRAGE images was processed by the NeuroQuant software package (CorTechs Labs) and FreeSurfer software (version 5.3, http://surfer.nmr.mgh.harvard.edu/). NeuroQuant performed the following steps: correction for gradient nonlinearity and B1 field inhomogeneity before skull stripping, removal of the scalp, skull, and meninges; inflation of the brain to a spherical shape; mapping of the spherical brain to a common spherical space shared with the Talairach atlas coordinates; identification of segmented brain regions; and deflation of the brain to its original shape while retaining the identifying information for the segmented brain regions.22 Each brain region volume was corrected for interindividual differences in head size by dividing by the intracranial volume (ICV), and the results are expressed as a volume percentage (%) of ICV.22 A normative percentile value for each volume % of ICV was also provided based on the data of healthy control subjects provided by the software. As a result, the report for each subject included absolute volume, volume % of ICV and normative percentile value of the whole brain, lateral ventricles, thalami, cortical gray matter (GM), cerebral white matter (WM), WM hypointensities, third ventricle, hippocampi and inferior lateral ventricles.
The same T1-weighted MR images were also segmented using the recon-all script of FreeSurfer version 5.3 on each T1-weighted scan.15 FreeSurfer segmentation outputs were each visually inspected by trained image analysts for moderate to severe errors. When errors occurred, trained image analysts performed manual correction of FreeSurfer segmentations. Volumes in each region of interest (ROI) of FreeSurfer’s atlas were obtained from FreeSurfer’s output aseg.stats files. For the evaluation of intermethod reliability, the volumes of various brain regions from the NeuroQuant General Morphometry Report were compared with those from FreeSurfer.
Measurement of Aβ Deposition
The mean regional11C-PiB uptake values from the frontal, posterior cingulate-precuneus, lateral temporal and lateral parietal regions were extracted using the individual AAL116 atlas from T1-coregistered PiB-PET images.23,24 The standardized uptake value ratios (SUVRs) for each ROI were calculated by dividing the mean value for all voxels within each ROI by the mean cerebellar uptake value due to its relatively low Aβ deposition.25 Each subject was classified as Aβ positive if the SUVR was > 1.4 in at least one of the four ROIs or as Aβ negative if the SUVR of all four ROIs was ≤ 1.4.26 Details of [11C] PiB-PET image preprocessing are described in Supplementary Methods S1.
Statistical Analysis
Differences between Aβ+ and Aβ- MCI subjects for demographic and clinical characteristics were described using independent t-tests or chi-square tests. Intermethod reliabilities were measured by calculating interclass correlation coefficients (ICC) using a 2-way mixed model with consistency type.27 ICC values of 0–0.40, 0.40–0.75, or greater than 0.75 indicated poor, fair to good, or excellent reliability.27
To investigate whether a relative regional volume measure (ie, volume % of ICV or its normative percentile value) was associated with Aβ positivity in MCI subjects, two steps of analysis were independently conducted for volume % of ICV and normative percentile value. In the first step, a binary logistic regression with the enter method was applied to each brain region. For the volume % of ICV, age and sex were adjusted for correction, while no covariate was included in the model for normative percentile value. Variance influence factors were calculated to assess multicollinearity between multiple independent variables. Brain regions with P < 0.1 in the first step were selected for the second step. In the second step, multivariate backward logistic regression models were used to determine the independent predictors of Aβ positivity. Receiver operating characteristic (ROC) curve analysis was also performed for significant predictor(s) to evaluate the prediction accuracy. If there were multiple predictors, a prediction score was calculated as the sum of each predictor multiplied by the respective β coefficients from the final logistic regression model. As the optimal cutoff point for predicting Aβ positivity can vary according to the purpose, ie, screening candidates for clinical trials or screening patients who need further evaluation using amyloid PET, we investigated how the sensitivity, specificity, positive predictive value, negative predictive value, and accuracy value change as the relative regional volume measure or prediction score changes instead of determining a single optimal cutoff value. Statistical analysis was performed with commercially available software (SPSS, version 23.0 for Windows; and MedCalc, version 9.3.0.0).
Results
Data on the demographic and clinical characteristics of MCI subjects are presented in Table 1. The mean age of MCI subjects was 73.4 ± 7.0 years (range, 57–90 years), and 66% of the subjects were female. There was no significant difference in age, sex or educational level between the Aβ+ and Aβ- MCI subjects.
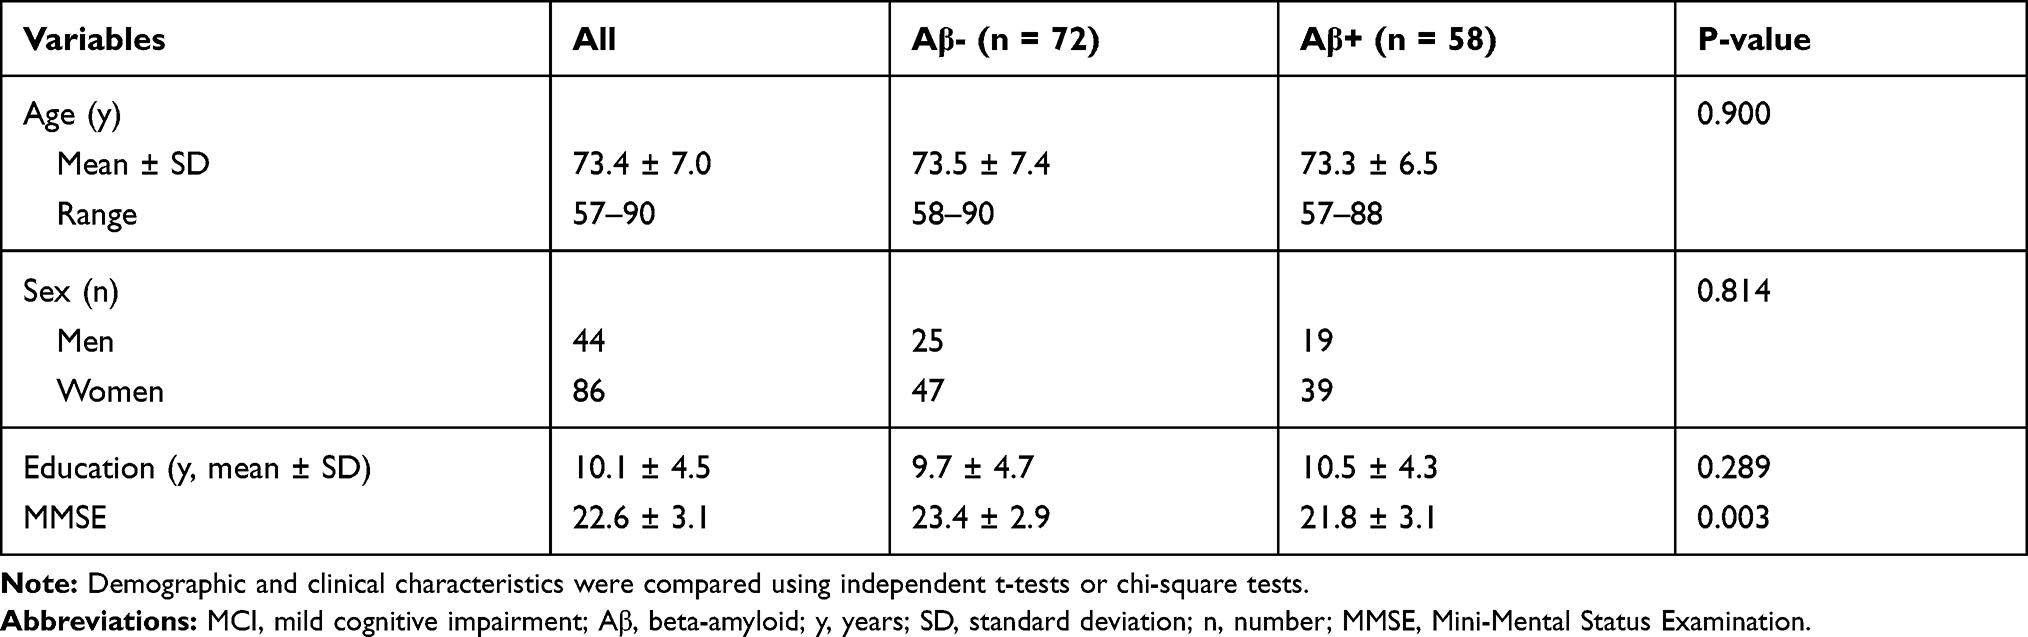 |
Table 1 Demographic and Clinical Characteristics of MCI Subjects |
Intermethod Reliability Between NeuroQuant and FreeSurfer
The intermethod reliability between NeuroQuant and FreeSurfer was excellent in the 14 supratentorial brain regions (ICC = 0.790–0.994) except for the pallidum (ICC = −0.015, Table 2). Absolute volume measures are shown in Supplementary Table 1.
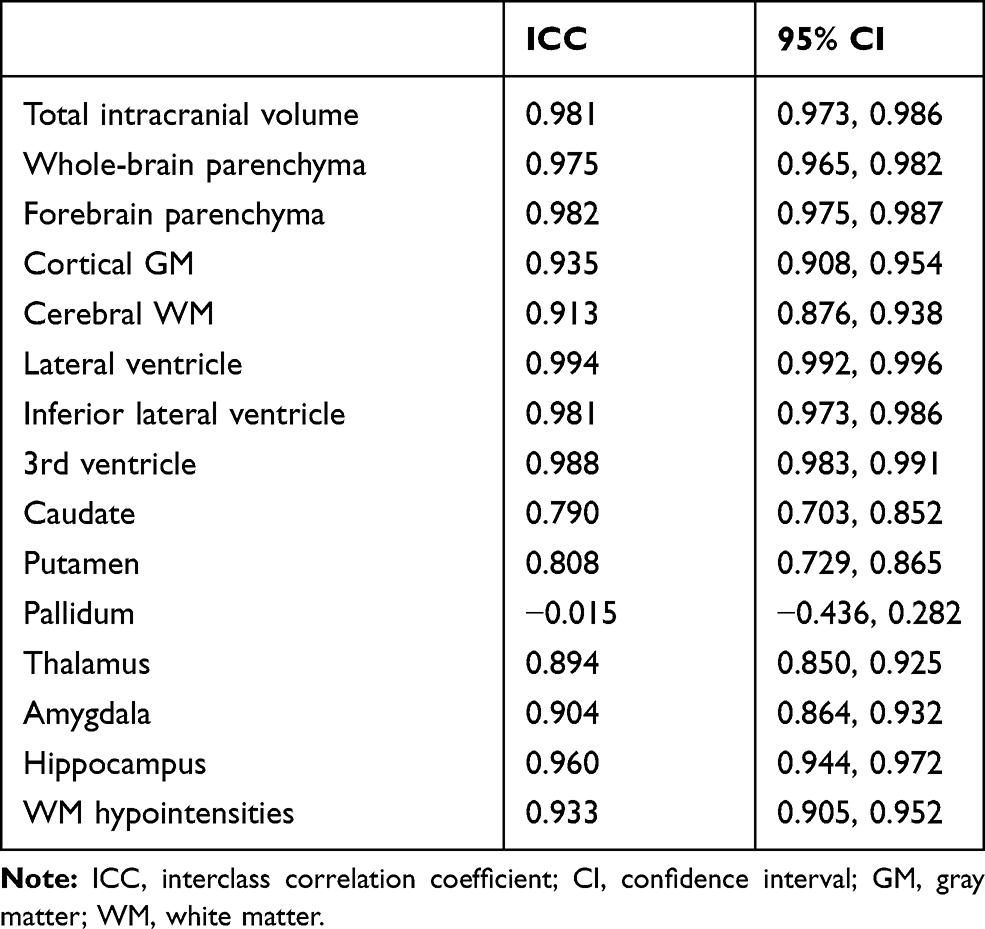 |
Table 2 Intermethod Reliability Between NeuroQuant and FreeSurfer |
Association of Regional Volume Measures Reported by NeuroQuant with Aβ Positivity
There was no significant multicollinearity between the independent variables (variance inflation factor = 1.254–3.839 for the mean volume % of ICV and 1.037–2.635 for the normative percentile, Supplementary Table 2). The mean volume % of ICV and normative percentile of the cortical GM and hippocampus were significantly larger in Aβ- than in Aβ+ MCI subjects (Table 3). The first step of binary logistic regression for volume % of ICV indicated that among various brain regions, the cerebral GM and hippocampus were significantly associated with Aβ positivity after adjusting for age and sex (Table 3). The second-step multivariate logistic regression revealed that age and hippocampal volume % of ICV (%HC/ICV) were independently associated with Aβ positivity (odds ratio, 0.917; 95% CI, 0.858–0.980, P = 0.011 for age; odds ratio per unit of 0.001%, 0.986; 95% CI, 0.979–0.992, P < 0.001 for %HC/ICV). A prediction score (HCage) was calculated using age and %HC/ICV with the respective ß coefficients from the logistic regression models (Y =12.047+ −0.087X1 + −14.192X2, where Y is the prediction score of HCage, X1 is age, and X2 is %HC/ICV).
 |
Table 3 Relative Regional Volumes as a Percentage of ICV and Normative Percentile in Aβ- and Aβ+ MCI Subjects |
Regarding the normative percentile value of each regional volume, the cortical GM, inferior lateral ventricle, and hippocampal values were related to Aβ positivity in the first-step binary logistic regression analyses (Table 3). The second-step multivariate logistic regression analysis showed that only the normative percentile of hippocampal volume (HCnorm) was independently associated with Aβ positivity (odds ratio, 0.977; 95% CI, 0.966–0.988, P < 0.001).
Structural MRI and PiB-PET images for representative cases of Aβ- and Aβ+ MCI subjects are shown in Figures 1 and 2.
 |
Figure 1 Representative 73-year-old woman with MCI. (A–C): Output from analysis with NeuroQuant shows segmentation of regional brain volumes.(D): Age-matched reference chart provided by NeuroQuantshowing the % of ICV and normative percentiles of hippocampal volume are 0.48 and 81, respectively. The prediction score calculated from age and hippocampal % of ICV was −13.16. The normative percentile of the hippocampus was 28.(E): Coronal T1-weighted MR image shows no hippocampal atrophy.(F): Negative amyloid imaging scans with “low” Pittsburgh compound B retention. Abbreviations: MCI, mild cognitive impairment; L, left; R, right; ICV, intracranial volume (Courtesy of CorTechs Laboratories). |
 |
Figure 2 Representative 73-year-old woman with MCI. (A–C): Output from analysis with NeuroQuant shows segmentation of regional brain volumes. (D): Age-matched reference charts provided by NeuroQuant showing % of ICV and normative percentiles of hippocampal volume are 0.23 and 1, respectively. The prediction score calculated from age and hippocampal % of ICV was −9.44.(E): Coronal T1-weighted MR image shows hippocampal atrophy.(F): Positive amyloid imaging scans with “high” Pittsburgh compound B retention. Abbreviations: MCI, mild cognitive impairment; L, left; R, right; ICV, intracranial volume (Courtesy of CorTechs Laboratories). |
Performance of Hippocampal Volume Measures for Aβ Positivity Prediction in MCI
In the ROC curve analysis, the areas under the curve (AUCs) for Aβ positivity prediction of HCage and HCnorm were 0.739 (95% CI: 0.654, 0.812) and 0.723 (95% CI: 0.638, 0.798), respectively (Figure 3). There was no significant difference between the two ROC curves (P = 0.554). Table 4 shows the sensitivity, specificity, positive predictive value, negative predictive value, and accuracy at various cutoff points of HCage and HCnorm.
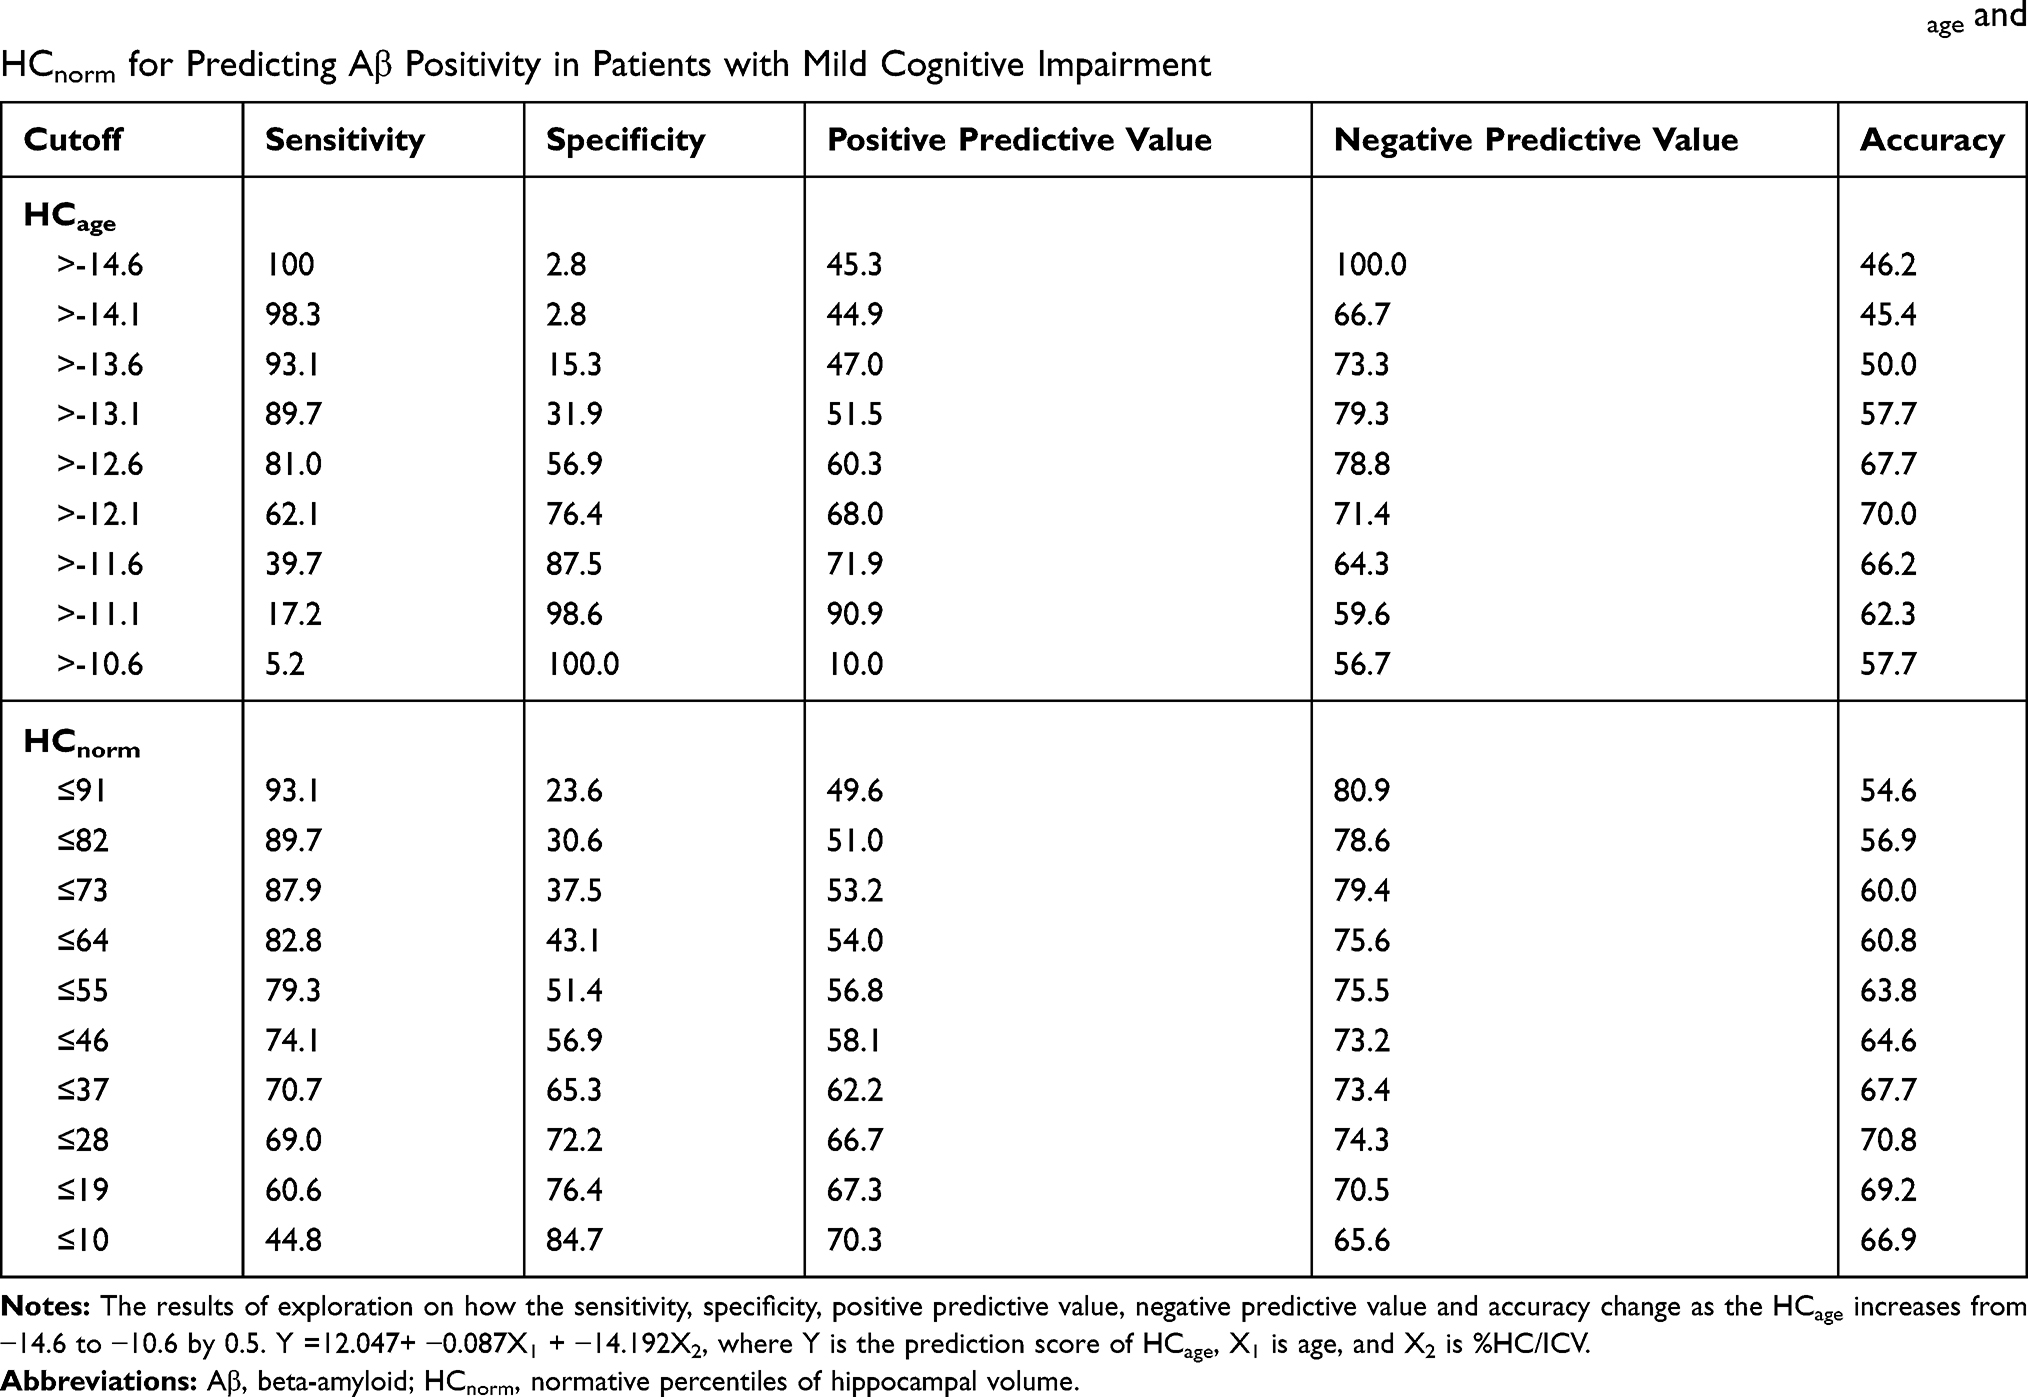 |
Table 4 Sensitivity, Specificity, Positive Predictive Value, Negative Predictive Value, and Accuracy at Various Cutoff Points of HCage and HCnorm for Predicting Aβ Positivity in Patients with Mild Cognitive Impairment |
 |
Figure 3 ROC curves used to predict the presence of high amyloid deposition in patients with MCI. (A) ROC curve for HCage. (B) ROC curve for HCnorm. Abbreviations: MCI, mild cognitive impairment; HCage, a prediction score calculated using age and the hippocampal volume percentage of intracranial volume; HCnorm, normative percentiles of hippocampal volume. |
Discussion
In this study, we investigated the predictive accuracy of the relative regional volume value provided by a commercially available brain volumetric software package for the presence of high Aβ deposition in subjects with MCI. We found that Aβ positivity could be predicted with only relative volume measures of the hippocampus, ie, HCage and HCnorm.
The results of automated volumetric brain assessment and its clinical application have been reported previously.17,28-31 In particular, previous studies have shown that the application of fully automated quantification of regional brain volumes on structural MRI of subjects at risk for AD could improve the detection of focal atrophy of AD17 and predict clinical decline.32,33 Our study found that easily accessible software could not only provide regional brain volumes but also predict the likelihood of Aβ positivity in subjects with MCI in a reasonably short processing time of 6–8 minutes. As Aβ+ MCI subjects were much more likely to progress to dementia than Aβ- MCI subjects,7,34 in vivo detection of high amyloid repositioning in MCI patients with amyloid PET can provide valuable prognostic information. However, its use is limited in routine clinical practice for MCI workup due to its high cost and limited availability. On the other hand, structural MRI is performed far more often than amyloid PET in MCI patients to rule out the second etiology and to find neuronal injury.8 Therefore, our results can be helpful in screening MCI due to AD before an amyloid PET scan is conducted or when it is not available.
GM and hippocampal atrophy are highly validated biomarkers of neuronal injury35 following amyloid deposition in AD.36 In our study, among the multiple regional volume measures provided by NeuroQuant, both cerebral GM and hippocampal measures were associated with Aβ positivity in the first exploratory step of analysis. In the final multivariate analyses, however, Aβ positivity was related only to relative volume measures of the hippocampus, ie, HCage and HCnorm, but not to GM volume. These results are probably due to the well-known phenomenon that earlier atrophic change in AD occurs in the hippocampus, consistent with early episodic memory deficits followed by later atrophic changes in the temporal, parietal and frontal neocortices.37 Hippocampal atrophy is closer in time to amyloid deposition than GM atrophy is.
In contrast to HCnorm, a relative value referring to age-appropriate normative data that are embedded in the NeuroQuant,16 %HC/ICV should be adjusted for age because global and regional brain atrophy are part of normal aging.38 Therefore, we calculated a prediction score, ie, HCage, by using a regression equation including both age and %HC/ICV. However, as it is cumbersome to calculate the prediction score every time and there was no significant difference in the AUC of ROC curves between HCage and HCnorm, HCnorm may be more convenient in daily clinical practice.
We evaluated the intermethod reliability between NeuroQuant and FreeSurfer, a widely used volumetric software with research purposes. The ICC was excellent in the 14 supratentorial brain regions (ICC= 0.790–0.994) except the pallidum (ICC = −0.015). Our results were similar to those of a previous study by Ochs et al,27 which demonstrated that NeuroQuant and FreeSurfer showed good to excellent intermethod reliability in volumetric measurements for all brain regions examined (ICC: 0.62 to 0.99), with the only exceptions being the pallidum (ICC: 0.029) and cerebellar WM (ICC: 0.031). As previously described, the poor reliability for NeuroQuant versus FreeSurfer measurements of the pallidum is probably due to the similar intensities of the pallidum and WM on T1-weighted MRI.34
Some limitations need to be mentioned. First, the prediction of HCage and HCnorm for Aβ positivity in MCI was not highly accurate given that the AUC was 0.723~0.739. This may be an inevitable limitation considering the temporal ordering of AD pathological changes. That is, Aβ deposition begins at the preclinical stage and almost saturates in the cognitively impaired stages of AD, including MCI, while regional neurodegeneration (including hippocampal atrophy) gradually progresses from MCI to AD dementia.39 Second, although we excluded patients with prominent neurological or medical comorbidities, biological factors with the potential to confound the assessment of brain volume changes, such as cardiovascular risk factors, level of hydration, diurnal variations, and alcohol/caffeine use, were not fully considered.40 In addition, we scanned one time for each participant and used only one MRI machine with the same protocol at a single center. Therefore, we could not investigate the intrascan or interscan variability, which may affect the volumetric measurement of the brain in real clinical settings.41,42
Conclusion
Our results suggest that relative hippocampal volume measures provided by NeuroQuant can be used to screen for cerebral Aβ positivity in amnestic MCI individuals in clinical practice. It may also help clinicians obtain additional information about MCI patients and determine early active intervention for delaying the progression to AD dementia.
Abbreviations
%HC, hippocampal volume percentage; 3D, three-dimensional; AD, Alzheimer’s disease; aMCI, amnestic MCI; Aβ, amyloid beta; Aβ+, amyloid positive; Aβ-, amyloid negative; CDR, clinical dementia rating; CERAD-K, Korean version of Consortium to Establish a Registry for Alzheimer’s Disease; GM, gray matter; HCage, prediction score calculated from age and %HC/ICV; HCnorm, normative percentile of hippocampal volume; ICC, interclass coefficient; ICV, intracranial volume; KBASE, Korean brain aging study of early diagnosis and prediction of Alzheimer’s disease; MCI, mild cognitive impairment; MRI, magnetic resonance imaging; NIA-AA, National Institute on Aging-Alzheimer’s Association; NPV, negative predictive value; PiB, Pittsburgh compound B; PET, positron emission tomography; PPV, positive predictive value; ROC, receiver operating characteristic; ROI, region of interest; SUVR, standardized uptake value ratio; WM, white matter; WMH, white matter hyperintensities.
Data Sharing Statement
The datasets used and/or analyzed during the present study are available from the corresponding author on reasonable request.
Ethics Approval and Informed Consent
This study protocol was approved by the Institutional Review Boards of Seoul National University Hospital and Seoul National University-Seoul Metropolitan Government Boramae Center, and all subjects provided written informed consent. The KBASE study is conducted in accordance with the Declaration of Helsinki.
Acknowledgments
The Medical Research Collaborating Center at Seoul National University Hospital kindly provided statistical advice for this manuscript.
Author Contributions
All authors contributed to data analysis, drafting or revising the article, gave final approval of the version to be published, and agree to be accountable for all aspects of the work.
Disclosure
The authors report no conflicts of interest in this work.
References
1. Petersen RC, Smith GE, Waring SC, Ivnik RJ, Tangalos EG, Kokmen E. Mild cognitive impairment: clinical characterization and outcome. Arch Neurol. 1999;56(3):303–308. doi:10.1001/archneur.56.3.303
2. Morris JC. Mild cognitive impairment is early-stage Alzheimer disease: time to revise diagnostic criteria. Arch Neurol. 2006;63(1):15–16. doi:10.1001/archneur.63.1.15
3. Price JC, Klunk WE, Lopresti BJ, et al. Kinetic modeling of amyloid binding in humans using PET imaging and Pittsburgh Compound-B. J Cereb Blood Flow Metab. 2005;25(11):1528–1547. doi:10.1038/sj.jcbfm.9600146
4. Rowe CC, Ng S, Ackermann U, et al. Imaging β-amyloid burden in aging and dementia. Neurology. 2007;68(20):1718–1725. doi:10.1212/01.wnl.0000261919.22630.ea
5. Wolk DA, Price JC, Saxton JA, et al. Amyloid imaging in mild cognitive impairment subtypes. Ann Neurol. 2009;65(5):557–568. doi:10.1002/ana.21598
6. Nordberg A, Carter SF, Rinne J, et al. A European multicentre PET study of fibrillar amyloid in Alzheimer’s disease. Eur J Nucl Med Mol Imaging. 2013;40(1):104–114. doi:10.1007/s00259-012-2237-2
7. Jack Jr CR, Wiste HJ, Vemuri P, et al. Brain beta-amyloid measures and magnetic resonance imaging atrophy both predict time-to-progression from mild cognitive impairment to Alzheimer’s disease. Brain. 2010;133(11):3336–3348. doi:10.1093/brain/awq277
8. McKhann GM, Knopman DS, Chertkow H, et al. The diagnosis of dementia due to Alzheimer’s disease: recommendations from the National Institute on Aging-Alzheimer’s Association workgroups on diagnostic guidelines for Alzheimer’s disease. Alzheimers Dement. 2011;7(3):263–269. doi:10.1016/j.jalz.2011.03.005
9. Engelborghs S, Niemantsverdriet E, Struyfs H, et al. Consensus guidelines for lumbar puncture in patients with neurological diseases. Alzheimers Dement. 2017;8(1):111–126.
10. Lim YY, Maruff P, Getter C, Snyder PJ. Disclosure of positron emission tomography amyloid imaging results: a preliminary study of safety and tolerability. Alzheimers Dement. 2016;12(4):454–458. doi:10.1016/j.jalz.2015.09.005
11. Falgàs N, Tort-Merino A, Balasa M, et al. Clinical applicability of diagnostic bio-markers in early-onset cognitive impairment. Eur J Neurol. 2019;26(8):1098–1104. doi:10.1111/ene.13945
12. Frisoni G, Fox N, Jack JC, Scheltens P, Thompson P. The clinical use of structural MRI in Alzheimer disease. Nat Rev Neurol. 2010;6(2):67–77. doi:10.1038/nrneurol.2009.215
13. Tosun D, Schuff N, Mathis CA, Jagust W, Weiner MW; Initiative AsDN. Spatial patterns of brain amyloid-β burden and atrophy rate associations in mild cognitive impairment. Brain. 2011;134(4):1077–1088. doi:10.1093/brain/awr044
14. Jenkinson M, Beckmann CF, Behrens TE, Woolrich MW, Smith SM. Fsl. Neuroimage. 2012;62(2):782–790. doi:10.1016/j.neuroimage.2011.09.015
15. Fischl B. FreeSurfer. Neuroimage. 2012;62(2):774–781. doi:10.1016/j.neuroimage.2012.01.021
16. Ashburner J, Friston KJ. Unified segmentation. Neuroimage. 2005;26(3):839–851. doi:10.1016/j.neuroimage.2005.02.018
17. Brewer J, Magda S, Airriess C, Smith M. Fully-automated quantification of regional brain volumes for improved detection of focal atrophy in Alzheimer disease. Am J Neuroradiol. 2009;30(3):578–580. doi:10.3174/ajnr.A1402
18. Persson K, Selbæk G, Brækhus A, Beyer M, Barca M, Engedal K. Fully automated structural MRI of the brain in clinical dementia workup. Acta Radiol. 2017;58(6):740–747. doi:10.1177/0284185116669874
19. Tanpitukpongse T, Mazurowski M, Ikhena J, Petrella J; Initiative AsDN. Predictive utility of marketed volumetric software tools in subjects at risk for Alzheimer disease: do regions outside the hippocampus matter? Am J Neuroradiol. 2017;38(3):546–552. doi:10.3174/ajnr.A5061
20. Byun MS, Yi D, Lee JH, et al. Korean brain aging study for the early diagnosis and prediction of Alzheimer’s disease: methodology and baseline sample characteristics. Psychiatry Investig. 2017;14(6):851–863. doi:10.4306/pi.2017.14.6.851
21. Albert MS, DeKosky ST, Dickson D, et al. The diagnosis of mild cognitive impairment due to Alzheimer’s disease: recommendations from the National Institute on Aging-Alzheimer’s Association workgroups on diagnostic guidelines for Alzheimer’s disease. Alzheimers Dement. 2011;7(3):270–279. doi:10.1016/j.jalz.2011.03.008
22. Ross DE, Ochs AL, Seabaugh JM, Shrader CR. Man versus machine: comparison of radiologists’ interpretations and neuroquant® volumetric analyses of brain MRIs in patients with traumatic brain injury. J Neuropsychiatry Clin Neurosci. 2013;25(1):32–39. doi:10.1176/appi.neuropsych.11120377
23. Reiman EM, Chen K, Liu X, et al. Fibrillar amyloid-β burden in cognitively normal people at 3 levels of genetic risk for Alzheimer’s disease. Proc Natl Acad Sci. 2009;106(16):6820–6825. doi:10.1073/pnas.0900345106
24. Tzourio-Mazoyer N, Landeau B, Papathanassiou D, et al. Automated anatomical labeling of activations in SPM using a macroscopic anatomical parcellation of the MNI MRI single-subject brain. Neuroimage. 2002;15(1):273–289. doi:10.1006/nimg.2001.0978
25. Lopresti BJ, Klunk WE, Mathis CA, et al. Simplified quantification of Pittsburgh Compound B amyloid imaging PET studies: a comparative analysis. J Nucl Med. 2005;46(12):1959–1972.
26. Jack CR, Wiste HJ, Weigand SD, et al. Amyloid-first and neurodegeneration-first profiles characterize incident amyloid PET positivity. Neurology. 2013;81(20):1732–1740. doi:10.1212/01.wnl.0000435556.21319.e4
27. Ochs AL, Ross DE, Zannoni MD, Abildskov TJ, Bigler ED. Comparison of automated brain volume measures obtained with NeuroQuant® and FreeSurfer. J Neuroimaging. 2015;25(5):721–727. doi:10.1111/jon.12229
28. Ross DE, Ochs AL, DeSmit ME, Seabaugh JM, Havranek MD. Alzheimer’s disease neuroimaging I. man versus machine part 2: comparison of radiologists’ interpretations and neuroquant measures of brain asymmetry and progressive atrophy in patients with traumatic brain injury. J Neuropsychiatry Clin Neurosci. 2015;27(2):147–152. doi:10.1176/appi.neuropsych.13040088
29. Ross DE, Ochs AL, Seabaugh J, Henshaw T. NeuroQuant® revealed hippocampal atrophy in a patient with traumatic brain injury. J Neuropsychiatr Clin Neurosci. 2012;24(1):E33–E33. doi:10.1176/appi.neuropsych.11020044
30. Farid N, Girard HM, Kemmotsu N, et al. Temporal lobe epilepsy: quantitative MR volumetry in detection of hippocampal atrophy. Radiology. 2012;264(2):542–550. doi:10.1148/radiol.12112638
31. Azab M, Carone M, Ying SH, Yousem DM. Mesial temporal sclerosis: accuracy of NeuroQuant versus neuroradiologist. Am J Neuroradiol. 2015;36(8):1400–1406. doi:10.3174/ajnr.A4313
32. Kovacevic S, Rafii MS, Brewer JB. High-throughput, fully-automated volumetry for prediction of MMSE and CDR decline in mild cognitive impairment. Alzheimer Dis Assoc Disord. 2009;23(2):139. doi:10.1097/WAD.0b013e318192e745
33. Heister D, Brewer JB, Magda S, Blennow K, McEvoy LK; Initiative AsDN. Predicting MCI outcome with clinically available MRI and CSF biomarkers. Neurology. 2011;77(17):1619–1628. doi:10.1212/WNL.0b013e3182343314
34. Fischl B, Salat DH, Busa E, et al. Whole brain segmentation: automated labeling of neuroanatomical structures in the human brain. Neuron. 2002;33(3):341–355. doi:10.1016/S0896-6273(02)00569-X
35. Sperling RA, Aisen PS, Beckett LA, et al. Toward defining the preclinical stages of Alzheimer’s disease: recommendations from the National Institute on Aging-Alzheimer’s Association workgroups on diagnostic guidelines for Alzheimer’s disease. Alzheimers Dement. 2011;7(3):280–292. doi:10.1016/j.jalz.2011.03.003
36. Jack Jr CR, Knopman DS, Jagust WJ, et al. Hypothetical model of dynamic biomarkers of the Alzheimer’s pathological cascade. Lancet Neurol. 2010;9(1):119–128. doi:10.1016/S1474-4422(09)70299-6
37. Frisoni GB, Fox NC, Jack Jr CR, Scheltens P, Thompson PM. The clinical use of structural MRI in Alzheimer disease. Nat Rev Neurol. 2010;6(2):67.
38. Fjell AM, McEvoy L, Holland D, Dale AM, Walhovd KB; Initiative AsDN. What is normal in normal aging? Effects of aging, amyloid and Alzheimer’s disease on the cerebral cortex and the hippocampus. Prog Neurobiol. 2014;117:20–40. doi:10.1016/j.pneurobio.2014.02.004
39. Jack Jr CR. Alzheimer disease: new concepts on its neurobiology and the clinical role imaging will play. Radiology. 2012;263(2):344–361. doi:10.1148/radiol.12110433
40. Zivadinov R, Jakimovski D, Gandhi S, et al. Clinical relevance of brain atrophy assessment in multiple sclerosis. Implications for its use in a clinical routine. Expert Rev Neurother. 2016;16:777–793. doi:10.1080/14737175.2016.1181543
41. Jovicich J, Czanner S, Han X, et al. MRI-derived measurements of human subcortical, ventricular and intracranial brain volumes: reliability effects of scan sessions, acquisition sequences, data analyses, scanner upgrade, scanner vendors and field strengths. Neuroimage. 2009;46(1):177–192. doi:10.1016/j.neuroimage.2009.02.010
42. Ewers M, Teipel SJ, Dietrich O, et al. Multicenter assessment of reliability of cranial MRI. Neurobiol Aging. 2006;27(8):1051–1059. doi:10.1016/j.neurobiolaging.2005.05.032
 © 2020 The Author(s). This work is published and licensed by Dove Medical Press Limited. The
full terms of this license are available at https://www.dovepress.com/terms
and incorporate the Creative Commons Attribution
- Non Commercial (unported, 3.0) License.
By accessing the work you hereby accept the Terms. Non-commercial uses of the work are permitted
without any further permission from Dove Medical Press Limited, provided the work is properly
attributed. For permission for commercial use of this work, please see paragraphs 4.2 and 5 of our Terms.
© 2020 The Author(s). This work is published and licensed by Dove Medical Press Limited. The
full terms of this license are available at https://www.dovepress.com/terms
and incorporate the Creative Commons Attribution
- Non Commercial (unported, 3.0) License.
By accessing the work you hereby accept the Terms. Non-commercial uses of the work are permitted
without any further permission from Dove Medical Press Limited, provided the work is properly
attributed. For permission for commercial use of this work, please see paragraphs 4.2 and 5 of our Terms.