Back to Journals » International Journal of Chronic Obstructive Pulmonary Disease » Volume 20
Prediction of Abnormal Functional Performance in Chronic Obstructive Pulmonary Disease Using Respiratory Models: A Pilot Study
Authors Ribeiro CO ![]() , Lopes AJ
, Lopes AJ ![]() , de Melo PL
, de Melo PL
Received 11 March 2025
Accepted for publication 17 August 2025
Published 22 August 2025 Volume 2025:20 Pages 2945—2965
DOI https://doi.org/10.2147/COPD.S524591
Checked for plagiarism Yes
Review by Single anonymous peer review
Peer reviewer comments 2
Editor who approved publication: Dr Fanny Wai San Ko
Caroline Oliveira Ribeiro,1,* Agnaldo José Lopes,2,* Pedro Lopes de Melo1,3,*
1Biomedical Instrumentation Laboratory - Institute of Biology and Faculty of Engineering, State University of Rio de Janeiro, Rio de Janeiro, Brazil; 2Pulmonary Function Laboratory, State University of Rio de Janeiro, Rio de Janeiro, Brazil; 3BioVasc Research Laboratory - Institute of Biology, State University of Rio de Janeiro, Rio de Janeiro, Brazil
*These authors contributed equally to this work
Correspondence: Pedro Lopes de Melo, Email [email protected]
Introduction: The contribution of respiratory models to understanding and predicting functional capacity abnormalities in chronic obstructive pulmonary disease (COPD) has not yet been investigated.
Purpose: The aims of this study were: (1) To investigate the associations between the extended Resistance-Inertance-Compliance (eRIC) and the fractional-order (FrOr) models with changes in Glittre-ADL and handgrip tests and; (2) To evaluate the accuracy of these models in predicting abnormal functional capacity in COPD.
Patients and Methods: The study was carried out in a group of 40 adults with COPD and a control group of 40 healthy individuals, both evaluated by respiratory oscillometry, spirometry, Glittre-ADL test and handgrip test. eRIC and fractional order models were also used to quantify biomechanical changes and obtain physiological information. The ability of model parameters to predict abnormal functional performance was evaluated by investigating the area under the receiver operating characteristic curve (AUC).
Results: Inverse relationships were observed between central airway resistance from the eRIC model and the handgrip test (p< 0.005), while respiratory compliance (C) was directly related with handgrip strength test and inversely associated with the Glittre-ADL test time (p< 0.05). The FrOr model showed direct associations among respiratory damping (G) and elastance with the Glittre-ADL test (p< 0.02), while significant inverse relationships were observed with the handgrip test (p< 0.05). Modeling parameters (peripheral resistance, total resistance and hysteresivity) achieved high prediction accuracy (AUC> 0.90) in predicting non-normal functional capacity in COPD assessed by the Glittre-ADL test. Considering abnormal changes evaluated by the handgrip test as a reference, C (AUC=0.810) and G (AUC=0.786) obtained the highest predictive accuracies.
Conclusion: Parameters obtained from the eRIC and the fractional order models are associated with non-normal exercise performance in COPD and may help predict poor functional performance in these patients.
Keywords: respiratory system modeling, COPD, forced oscillation technique, respiratory oscillometry, Glittre-ADL, handgrip test
Introduction
Chronic obstructive pulmonary disease (COPD) affects approximately 300 million individuals worldwide and is responsible for more than 3 million deaths annually. Smoking is the main risk factor associated with the development of the disease.1–3 It is a heterogeneous lung condition characterized by chronic respiratory symptoms, such as dyspnea, cough and sputum production, due to abnormalities of the airways and/or alveoli.4 Currently, spirometry is considered the gold standard test for evaluating respiratory obstruction in COPD. However, spirometry requires high cooperation from volunteers and great effort in executing the expiratory maneuver. This may result in a variation in the quality of the test results, temporarily causing changes in bronchomotor tone, which may lead to underdiagnosis.4,5
Respiratory oscillometry, also known as forced oscillation technique, is based on the application of sinusoidal pressure variations through a mouthpiece during spontaneous ventilation, and is able to evaluate the resistance and reactance of the respiratory system in a wide frequency range during spontaneous ventilation.6
The use of electric models in the interpretation of the oscillometric exams allows obtaining detailed information about the respiratory diseases.7,8 Using the mechanical-electric analogy, the respiratory system is modeled as an electric circuit, where respiratory obstruction is equivalent to electrical resistance, the airflow through the airways is interpreted as the flow of electrical current, while the pressure difference across the airways corresponds to the electric voltage.
In this class of models, the extended RIC (eRIC) has been suggested as an improved description of the respiratory characteristics in comparison to the basic RC (Resistance-Compliance) and RIC (Resistance-Inertance-Compliance) models.9 This occurs because the RC model does not describe the influence of inertance and the RIC model is not able to describe changes in peripheral airways.
In the particular case of the respiratory system, fractional order models (FrOr) helps to obtain new insight into the mechanisms associated with peripheral changes in the diseased lung.10 These models can provide information associated with resistive properties and hysteresivity, which reflects increased heterogeneity and changes in lung structure. Information is also provided on the damping factor, associated with parenchymal deformity and elastance.11 Although the use of these models may contribute to expanding our knowledge of COPD pathophysiology, as well as aiding in disease diagnosis,12 further studies are needed to validate the interpretations of parameters obtained through the models, as well as to assess the clinical significance of the changes observed in these parameters.13
Functional tests are used to clinically assess exercise tolerance.14 The Glittre-ADL test is an effective, easy-to-apply, valid and reliable test for evaluating functional capacity in patients with COPD.15 It can be considered more complete than the 6-minute walk test (6MWT) to assess functional capacity, as it involves, in addition to walking, activities such as sitting and getting up from a chair, going up and down steps and arm movements supporting weights.16
The loss of muscle strength is directly linked to physical performance, mobility and functionality. These muscle dysfunctions may also be related to physical inactivity. The decrease in muscle strength can affect peripheral muscles to different degrees, in addition to being associated with a greater risk of mortality for affected patients.17–19 Assessment of physical function is important in patients with COPD, as a decrease in muscle strength occurs more quickly than the loss of muscle mass. The handgrip test proved to be valid in assessing strength and is considered cheap, simple, easy and can be done with a portable measuring tool.19–22
Previous studies have evaluated the association of oscillometric indices with changes in the 6MWT.23 The relationship of oscillometry and changes in exercise capacity following pulmonary rehabilitation was also evaluated.24 Other studies have evaluated the ability of oscillometric parameters to predict exercise tolerance, both assessed by the 6MWT25 and by means of cycle ergometers.26 Our group previously reported significant associations of traditional oscillometric parameters with abnormal functional capacity in COPD. Promising results were also obtained concerning the ability of these parameters to predict exercise limitation.27 However, there are no studies in the literature evaluating the relationships between eRIC and FrOr models and functional performance evaluated by the ADL–Glittre and handgrip tests.
In this context, the main objectives of this study were 1) to investigate the association between the eRIC model and FrOr model parameters and changes in ADL–Glittre and the handgrip test; and (2) evaluate the accuracy of these parameters as a predictor of non-normal functional capacity in COPD.
Materials and Methods
Patients and Study Design
The pulmonary function test evaluations and functional capacity tests were carried out at the Biomedical Instrumentation Laboratory of the State University of Rio de Janeiro (LIB/UERJ) and were approved by the Research Ethics Committee of the Pedro Ernesto University Hospital (HUPE). The work was performed in accordance with The Declaration of Helsinki. Informed consent was obtained from all volunteers before inclusion in the study.
For the COPD group, 40 individuals diagnosed according to the criteria of the Global Initiative for Chronic Obstructive Lung Disease (GOLD)4 and aged over 40 years were studied. No history of respiratory infections in the last thirty days at the time of the exams and no history of cardiovascular or orthopedic diseases. Before carrying out the exams, all patients took their usual medication, except bronchodilators (BD), to avoid interference in the evaluation, as established by the American Thoracic Society/European Respiratory Society (ATS/ERS).28 For the control group, 40 subjects over 40 years old were studied, with no history of smoking, pulmonary, cardiovascular or orthopedic diseases, no history of respiratory infections in the last thirty days before the exams, clinically stable and with spirometric and respiratory oscillometry exams compatible with normality.29,30 None of the studied volunteers had a history of COVID-19.
Spirometry
Spirometric analysis was performed following the standard protocols of the American Thoracic Society/European Respiratory Society.28,31 The parameters analyzed were forced expiratory volume in the first second (FEV1), forced vital capacity (FVC), FEV1/FVC ratio, forced expiratory flow (FEF) between 25% and 75% (FEF25-75%) and its relationship with FVC (FEF/CVF). These parameters were expressed in absolute values and as a percentage of predicted values (% of predicted), and reference values were obtained from the equations of Pereira et al.32 Forced expiratory maneuvers were repeated until three sequential measurements were obtained. The indices studied were obtained by the best curve, which was selected based on the highest FEV1 and FVC values. Lung function data were collected in the post-bronchodilator test.4
Respiratory Oscillometry
Pressure oscillations were applied in the frequency range of 4 to 32 Hz, with an amplitude of approximately 2 cmH2O, produced by a 12” speaker coupled to the respiratory system through an individual mouthpiece.33 The resulting flow and pressure signals were measured near the mouth by a pneumotachograph and a pressure transducer, respectively. These measurements were performed according to international standards.6
During the exams, the volunteers remained seated, with their heads in a neutral position, using a nose clip, maintaining spontaneous breathing through a mouthpiece and firmly supporting their cheeks and chin with both hands in order to minimize shunting. Three acceptable tests of 16 seconds each were conducted, and the mean score was utilized for analysis. To eliminate outlier values, the coefficient of variation of respiratory resistance at the lowest oscillation frequency (4 Hz) for the three measurements was required to be ≤10%. Only examinations with a coherence function ≥0.9 across the entire frequency range were accepted to minimize the influence of spontaneous breathing. A test was deemed acceptable if volunteers maintained stable tidal volumes and rates without pauses. Common artifacts such as swallows, coughs, and leaks were identified by evaluating flow and pressure signals, and data acquisition was repeated until three stable, artifact-free tests were obtained.
Respiratory Models
In the eRIC model (Figure 1A), R is the analogue of central airway resistance, Rp describes peripheral resistance, and I and C are associated with respiratory inertia and compliance, respectively. Rp allows observing the frequency dependence of typical impedance data, which is beyond the capability of the basic RIC model. This additional component describes the resistance presented by the small airways of the respiratory system. We also evaluate total resistance (Rt=R+Rp), which includes the effects of central and peripheral airways.9
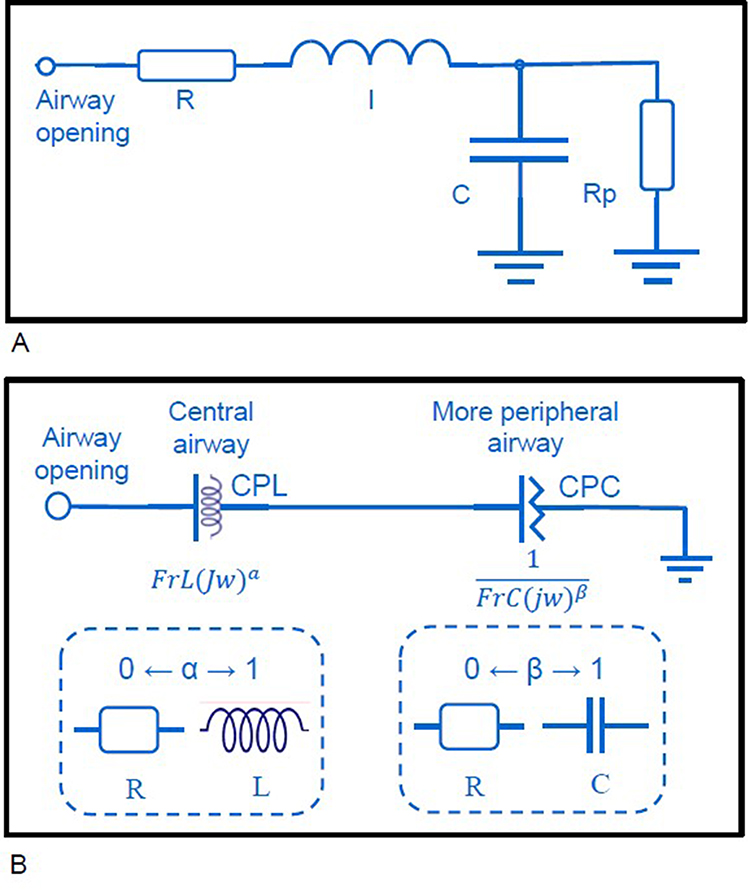 |
Figure 1 Two-compartment integer-order model used to analyze respiratory. Impedance (A). The resistance (R), inductance (I) and capacitance (C) are the analogues of respiratory resistance, inertanceand compliance, respectively. Rprepresents the peripheral resistance. Two compartment fractional-order model evaluated in this study (B). It includes a constant phase inertance (CPL) and a constant phase compliance (CPC) composed by a frequency-dependent fractional inertia (FrL) and a frequency-dependent fractional compliance (FrC). The ability of the fractional terms to describe the resistive and reactive respiratory properties, depending of α and β values, is also described. |
The FrOr model (Figure 1B) is described in Equation 1.13 It includes an element related with more central airways, which is described as a frequency-dependent inertance (CPL) taking into account the ability of the fractional terms to approximate the resistive properties (0≤α≤1). A second component related to more peripheral airways is described as a constant phase compliance (CPC). This element is based on the ability of a fractional compliance to describe resistive properties, where 0 ≤ β ≤ 1.
These results were interpreted physiologically using the damping factor (G), elastance (H) and the hysteresivity coefficient (η), as described in equations 2–40:


The damping factor is associated with the dissipation of energy in the respiratory system, while H reflects the storage of elastic potential energy (elastance). Hysteresivity describes the heterogeneity of pulmonary ventilation.10,11
The model parameters were estimated using the ModeLIB program, also developed at LIB/UERJ. This program employs the Levenberg-Marquardt algorithm to determine the set of model coefficients that best represents the input data established in terms of least squares. Along with the model estimates, this analysis also provides the calculation of the root mean square error value in the real (MSEr) and imaginary (MSEi) components of the impedance.9 Additionally, we assessed the mean relative distance (Rd) between the model and measured resistance and reactance values.34
Handgrip Test
The handgrip test was performed using a handheld hydraulic dynamometer (Saehan, SH 5001). Participants were instructed to sit with their elbows flexed at a 90° angle, using the dynamometer in their hands in a neutral position. They were asked to squeeze the dynamometer with maximum force for up to 3s. At least 60s of rest was allowed between measurements. Three attempts were made with each hand, and the highest value was used for analysis.35 The predicted values were calculated using the formulas described in Novaes et al, 2009.36
Glittre-ADL Test
The ADL–Glittre test was performed as described in Skumlien et. al. 2006.15 The test began with the subjects sitting in a chair. At the starting signal, they got up and walked 5 m, crossed a staircase with 2 steps and walked another 5 m to a 2-shelf support, which was individually adjusted to the shoulder and waist height of each subject. Three weights of 1 kg each, positioned on the top shelf, had to be moved one by one to the bottom shelf, to the floor, back to the bottom shelf and finally to the top shelf again. Subjects then walked back to the starting chair, crossed the 2-step stairs, sat down, and began the next lap by standing up again. Each step of the ladder was 17 cm high and 27 cm deep. Subjects were asked to complete five laps as quickly as possible, and the primary outcome of the test is the time to complete their five laps. They were allowed to rest, if necessary, but were instructed to resume activity when they were able. The stopwatch was not stopped and the subjects carried a backpack containing 2.5 kg (women) or 5.0 kg (men). Heart rate (HR), peripheral oxygen saturation (SpO2) and dyspnea index (Modified Borg Scale)37 were measured at the beginning, at each lap and at the end of the test. No verbal stimuli were offered throughout the test. The results of patients with COPD were compared with reference values.38
Statistical Analysis
The distribution characteristics of the samples were evaluated using the Shapiro–Wilk normality test (OriginPro, Version 2024. OriginLab Corporation, Northampton, MA, USA). For analysis between parametric groups, the Independent t-test or Dependent t-test was used and for non-parametric groups, the Mann–Whitney test or Wilcoxon test was used. Correlations between two numerical variables were evaluated using the GraphPad Prism program (GraphPad Prism 5.03, GraphPad Software, La Jolla, CA, USA). For linear analyzes Pearson’s correlation was used, while for non-linear analyzes Spearman correlation was used. P-values <0.05 (two-sided) were considered statistically significant. Effect Size measures were evaluated by Cohen`s D in comparisons with the same sample sizes and Hedges’ G in cases of different samples sizes. For both Cohen’s D and Hedges’ G, a small effect size was considered around 0.2, a medium effect size around 0.5, and a large effect size around 0.8 or higher.
The accuracy of respiratory model parameters as predictors of exercise tolerance in COPD was assessed using receiver operator characteristic (ROC) analysis. These assessments were performed for the two exercise tolerance outcomes studied. The cut-off value used for the ADL–Glittre test was 210s, where it has previously been shown to be sensitive and specific for distinguishing COPD patients with non-normal and normal functional capacity.16 In the handgrip analysis, we considered cut-off values <30kgf for men and <20kgf for women in the dominant hand to identify muscle weakness in patients with COPD.39,40 We identified optimal prediction cutoff points as those that produce the best compromise between sensitivity and specificity. The area under the curve (AUC) was calculated to estimate the predictive capacity of poor functional performance and muscle function. In this analysis, AUCs>0.70 were considered suitable for predictive use, while values >0.90 were considered in the range of high predictive accuracy.41
Results
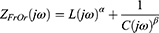
Table 1 describes the anthropometric and spirometric characteristics of the studied groups. Data on age and sex on all participants are described in Table S5. There was no change in age, body mass and body mass index (BMI) between the groups studied, and small effect sizes were observed. We can also observe that in the anthropometric data there was an increase in smoking history (p<0.0001). Spirometric parameters were significantly reduced in individuals with COPD (p<0.001), and presented large effect sizes (>0.8).
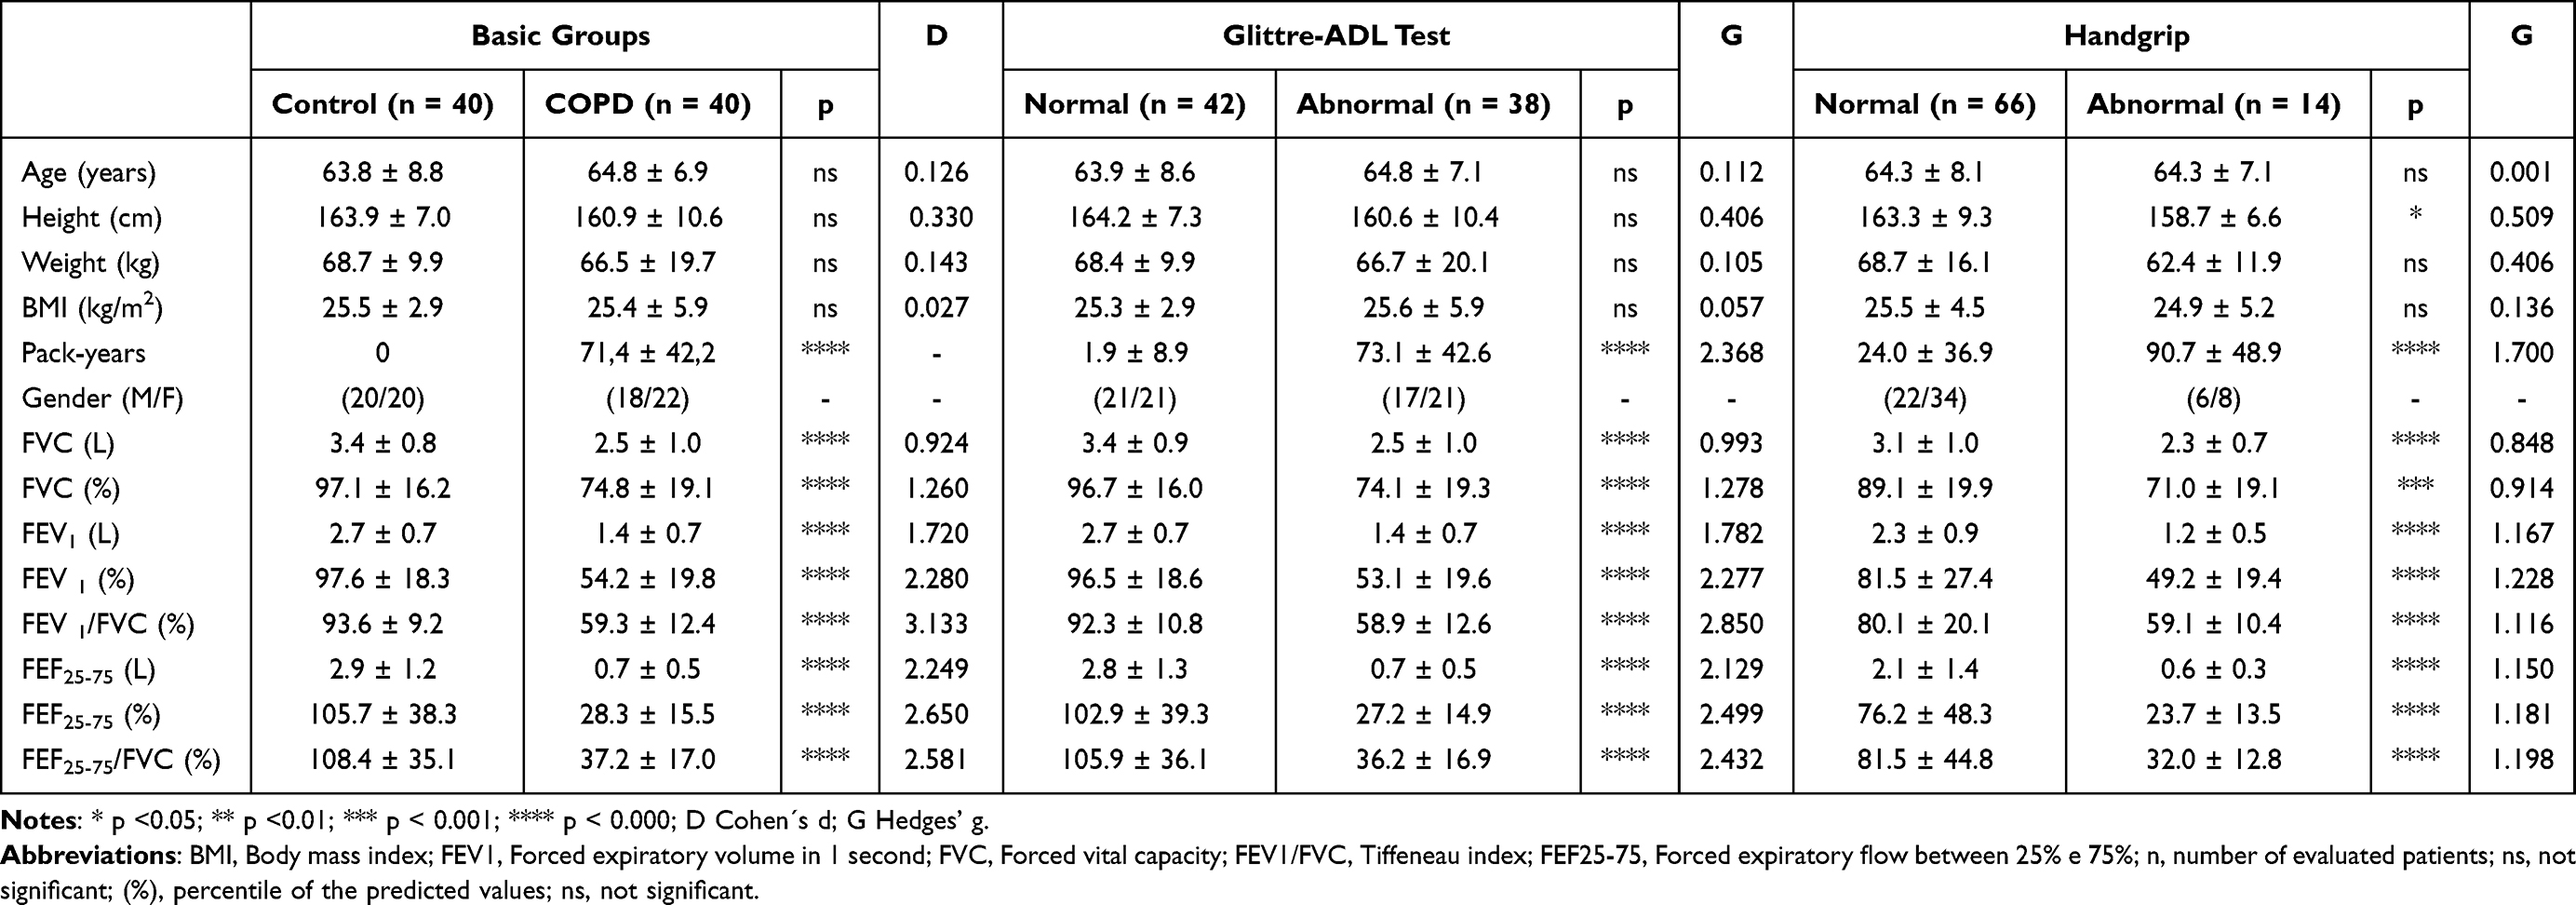 |
Table 1 Subject Demographics and Spirometric Characteristics Considering the Basic Groups of Controls and COPD Volunteers, as Well as Groups Taking the Glittre-ADL Test and Handgrip Strength Normal Values as Reference |
Table 1 also shows the biometric and spirometric characteristics of the groups using the Glittre-ADL test and handgrip strength as references. In addition to the increase in smoking history (p<0.0001, G=1.700), there was a significant increase in height (p<0.05, G=0.509) in the normal group compared to the non-normal group using the handgrip strength test.
Figure 2A shows the predicted and measured values in COPD patients for total Glittre-ADL test time. There was a significant increase in time spent in the COPD group in relation to predicted values (p<0.0001, D=1.928). In similar comparisons, significant reductions in handgrip strength (Figure 2B) were observed for both the dominant hand (p<0.0001, D=0.631) and the non-dominant hand (p<0.001, D=0.485).
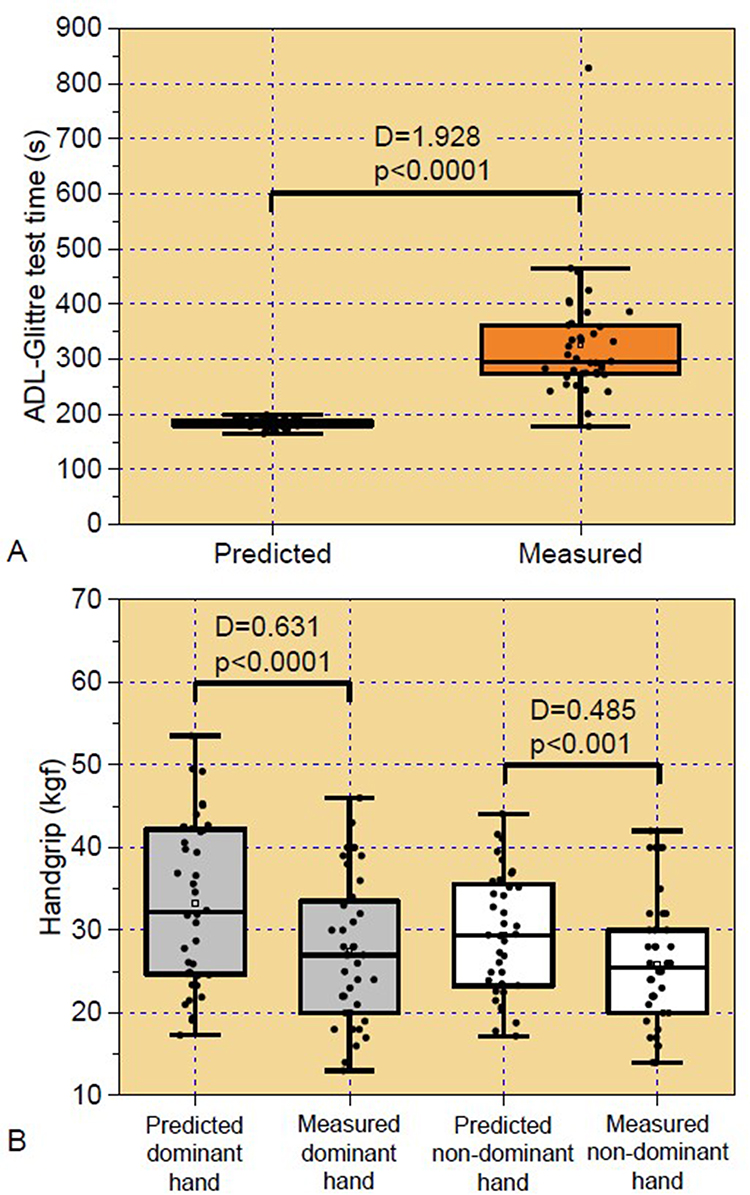 |
Figure 2 Predicted and measured values in tha basic COPD group for the Glittre test time (A) and handgrip analysis (B). |
Table 2 presents the traditional parameters of respiratory oscillometry. All parameters showed significant changes and medium to high effect sizes, revealing increased values in resistive parameters (R4, R12, R20 and R4-R20). In terms of reactive parameters, more negative values were observed in Xm, lower in Cdyn and higher in terms of fr, Ax and Z4 in the group of individuals with COPD. In the groups separated by functional performance analysis, there was no significant difference only in R20 in the handgrip test (p=ns, G=0.355).
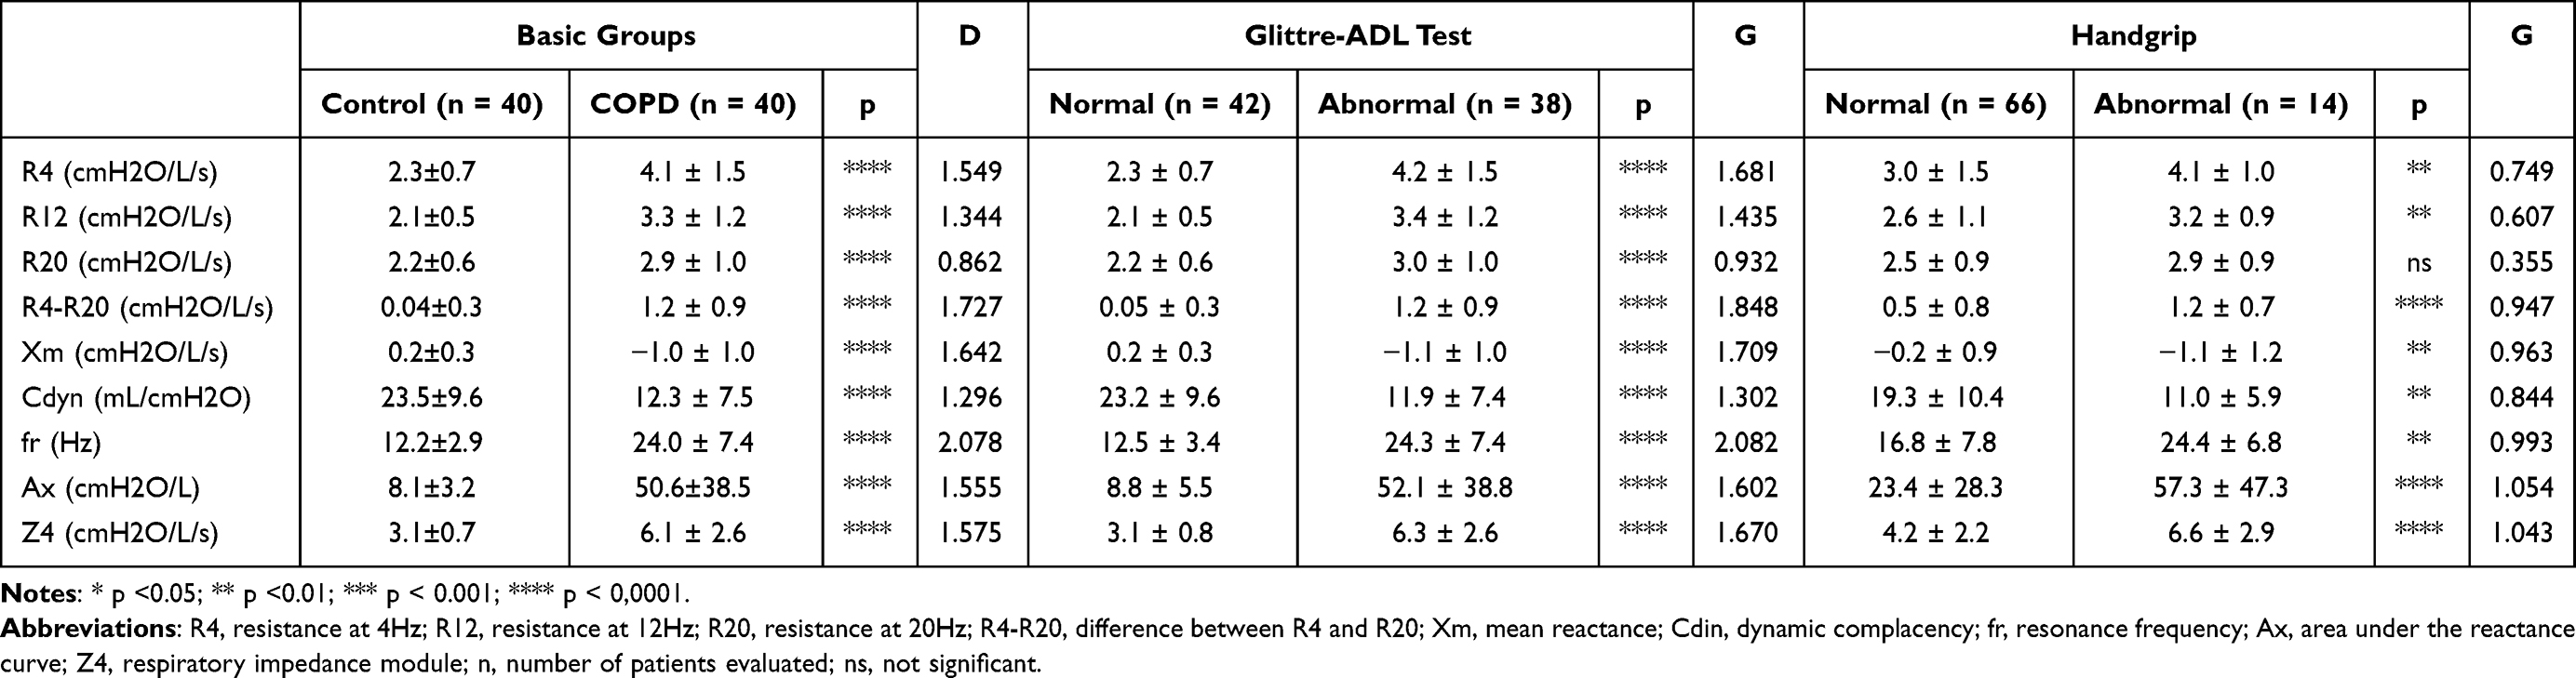 |
Table 2 Traditional Oscillometric Parameters Considering the Basic Group of Controls and COPD Volunteers, and Groups Taking the Glittre-ADL Test and Handgrip Strength as Reference |
Taking the Glittre-ADL test as a reference, Figure 3 describes the results obtained with the eRIC model in the studied groups. R, Rp and Rt values increased in patients with abnormal Glittre-ADL test time when compared to individuals with normal values. Reductions in I and C were also observed in the group with abnormal Glittre-ADL test. These analyses presented medium to large effect sizes.
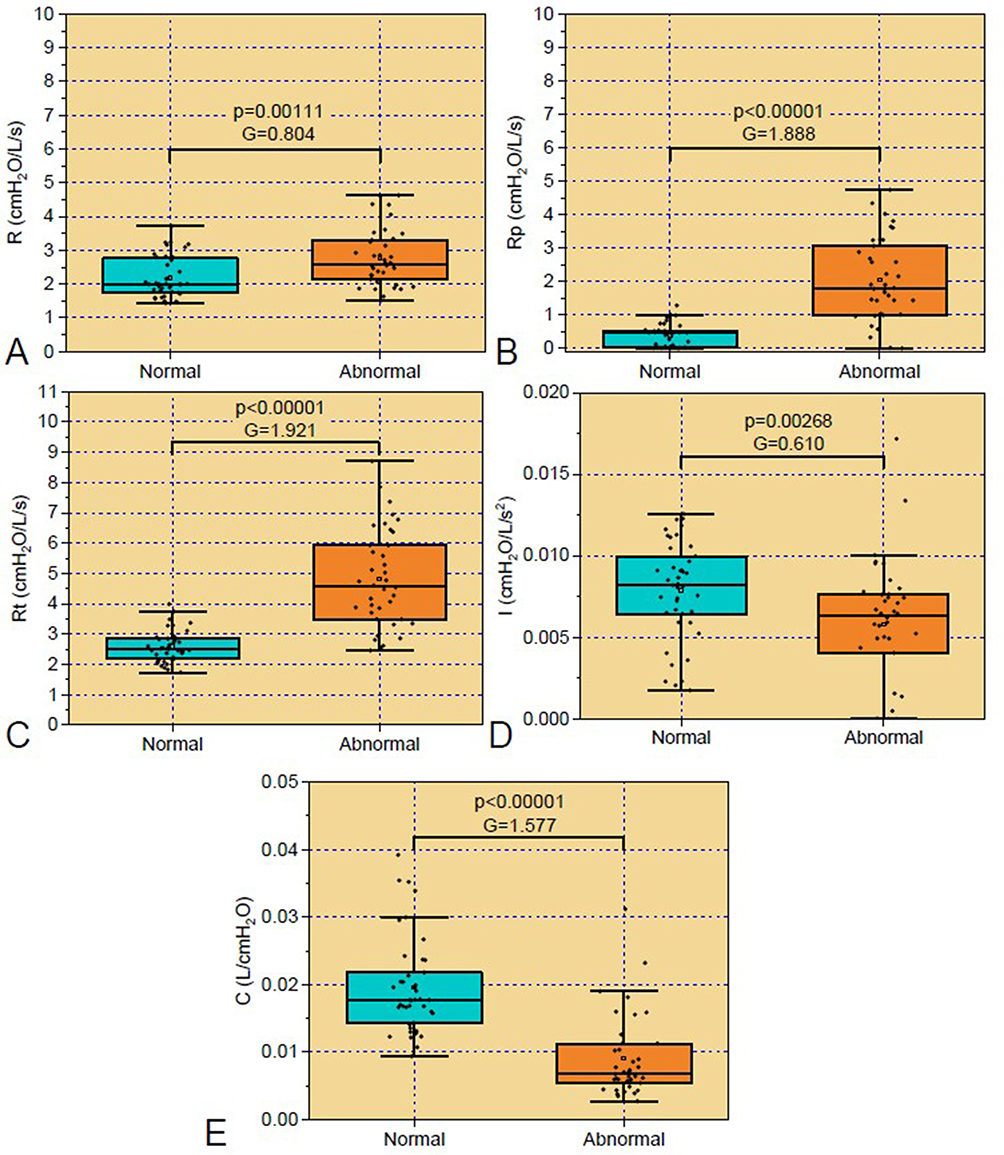 |
Figure 3 Parameters of the eRIC model classified according to the ADL-Glittre test. Abbreviations: (A) R, Central airway resistance; (B) Rp, peripheral resistance; (C) Rt, total resistance; (D) I, pulmonary inertance; (E) C, alveolar compliance. |
Considering the fractional order modeling parameters, patients with abnormal Glittre-ADL test time showed significant increases and large effect sizes in G and η (Figure 4A and C, respectively). H did not show significant changes in these comparisons (Figure 4B).
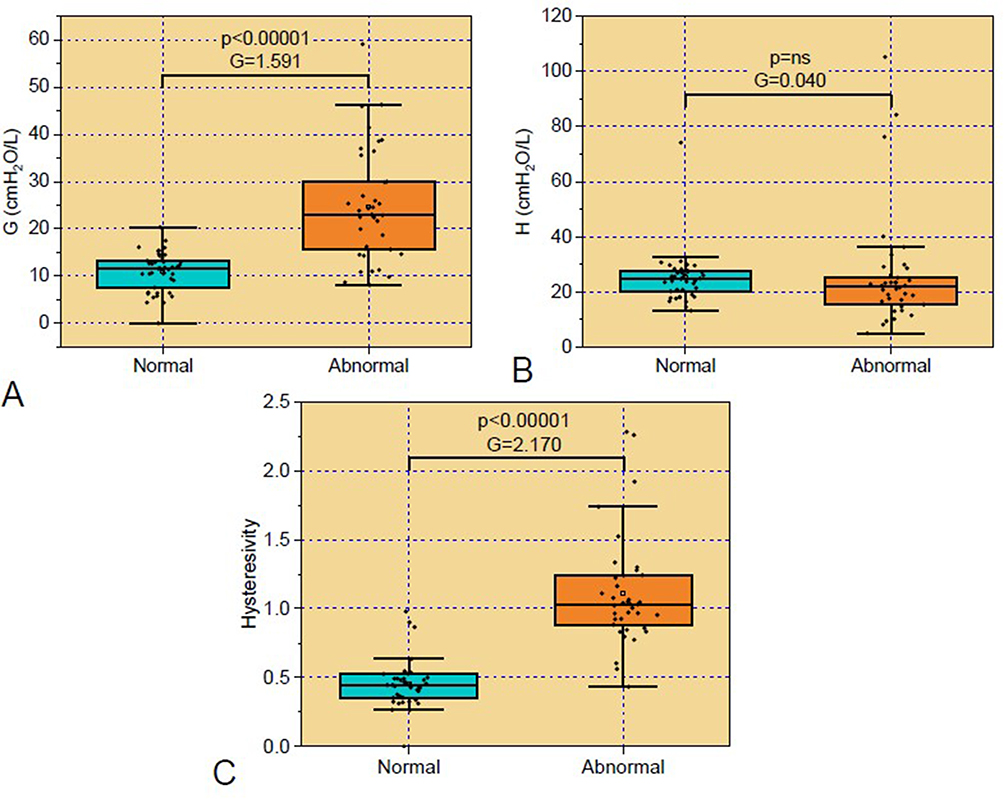 |
Figure 4 Fractional order model parameters classified according to the ADL–Glittre test. Abbreviation: (A) G, damping factor; (B) H, respiratory elastance; (C) η, hysteresivity. |
Taking the handgrip test as a reference, Figure 5 describes the results obtained with the eRIC model in the studied groups. Rp (Figure 5B) and Rt (Figure 5C) values increased and showed large effect sizes in patients with abnormal values of Handgrip analysis when compared to healthy individuals, and a reduction in C (Figure 5E) was also observed in these patients. There were no changes in R (Figure 5A) and I (Figure 5D) between the studied groups.
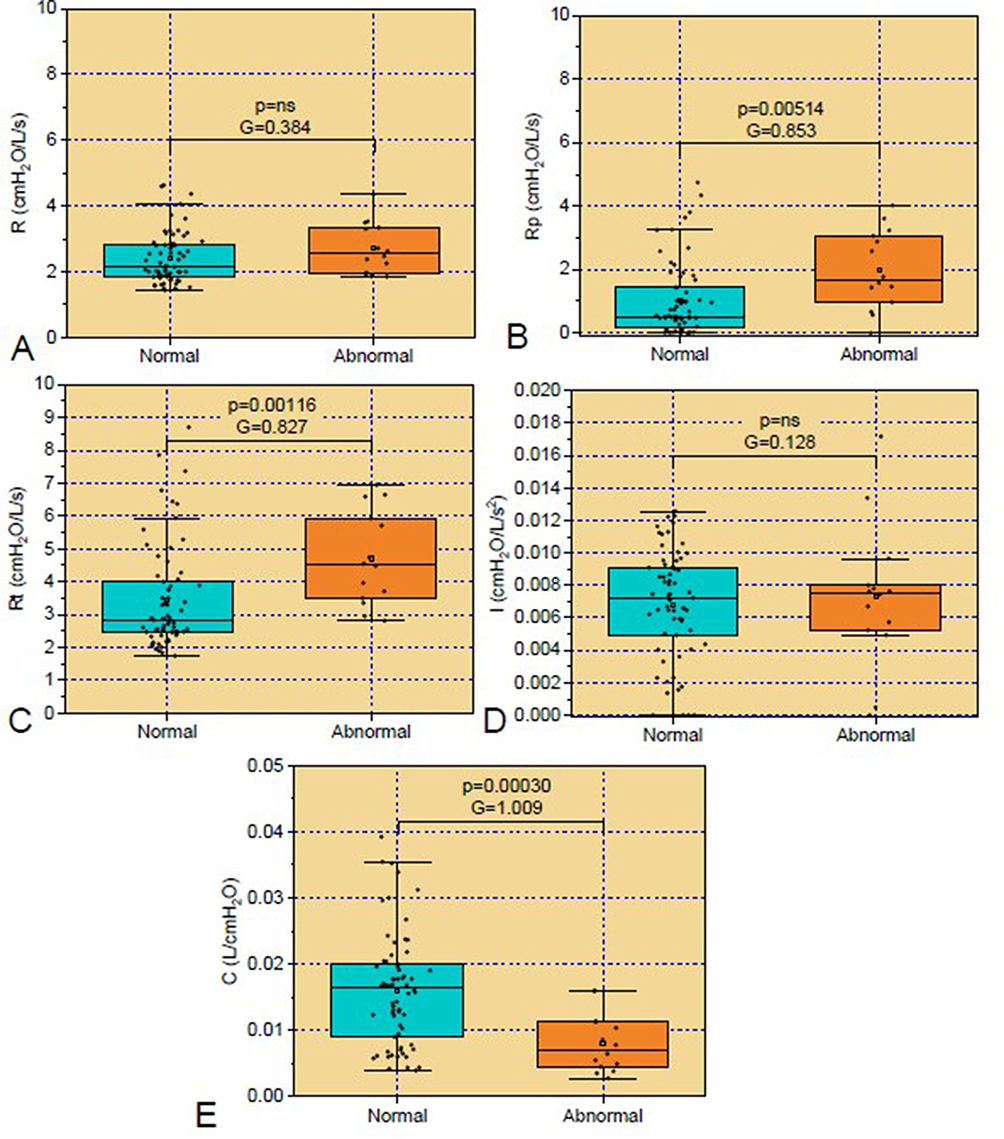 |
Figure 5 Parameters from the eRIC model according to the Handgrip. Abbreviations: (A) R, Central airway resistance; (B) Rp, peripheral resistance; (C) Rt, total resistance; (D) I, pulmonary inertance; (E) C, alveolar compliance. |
In the fractional order modeling parameters (Figure 6), abnormal values of Handgrip analysis introduced significant increases in G (Figure 6A) and η (Figure 6B), while H (Figure 6C) did not show significant changes. Effect sizes in these analyses were medium to large.
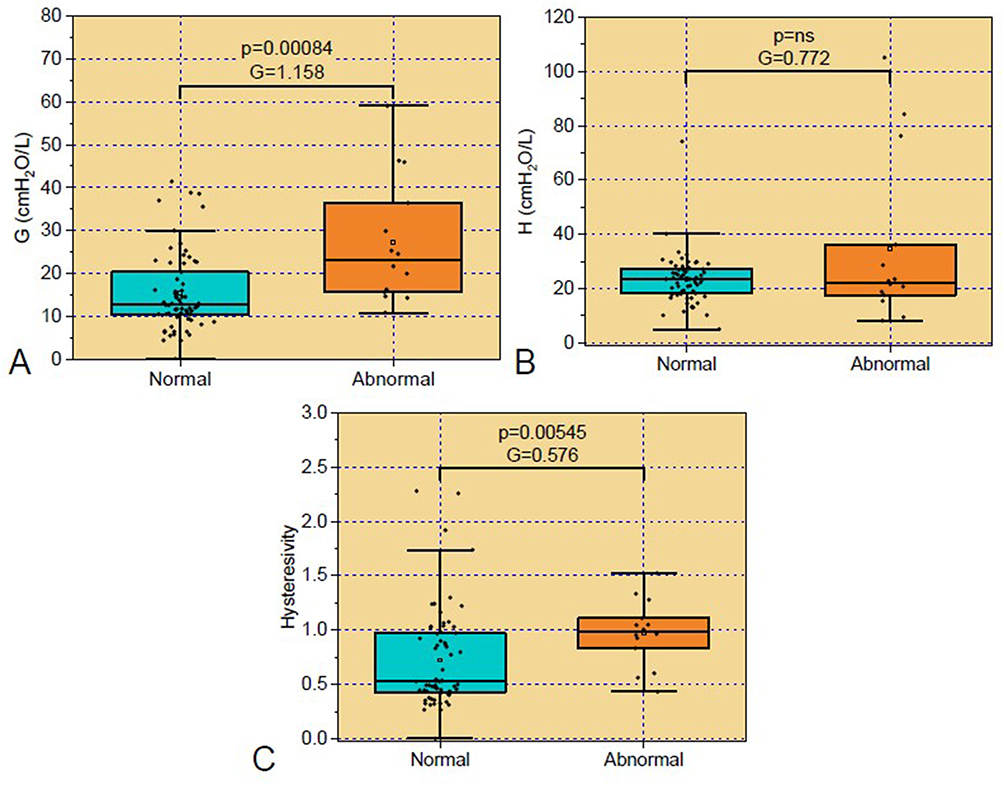 |
Figure 6 Parameters from the fractional order model parameters according to the Handgrip. Abbreviation: (A) G, damping factor; (B) H, respiratory elastance; (C) η, hysteresivity. |
Table 3 presents the error values for both the real and imaginary parts of the impedance, as well as the mean relative distances for the studied models. Considering the basic group, the FrOr model showed significantly reduced MSE values for Xrs in patients with COPD (p<0.0183). A similar reduction was also observed considering the classification based on the ADL Glitre test (p<0.0188). A p value of 0.0821 was obtained considering the relative distance in abnormal volunteers classified according to the Glittre-ADL test, while a p value of 0.0979 was obtained analyzing volunteers classified as normal by handgrip analysis.
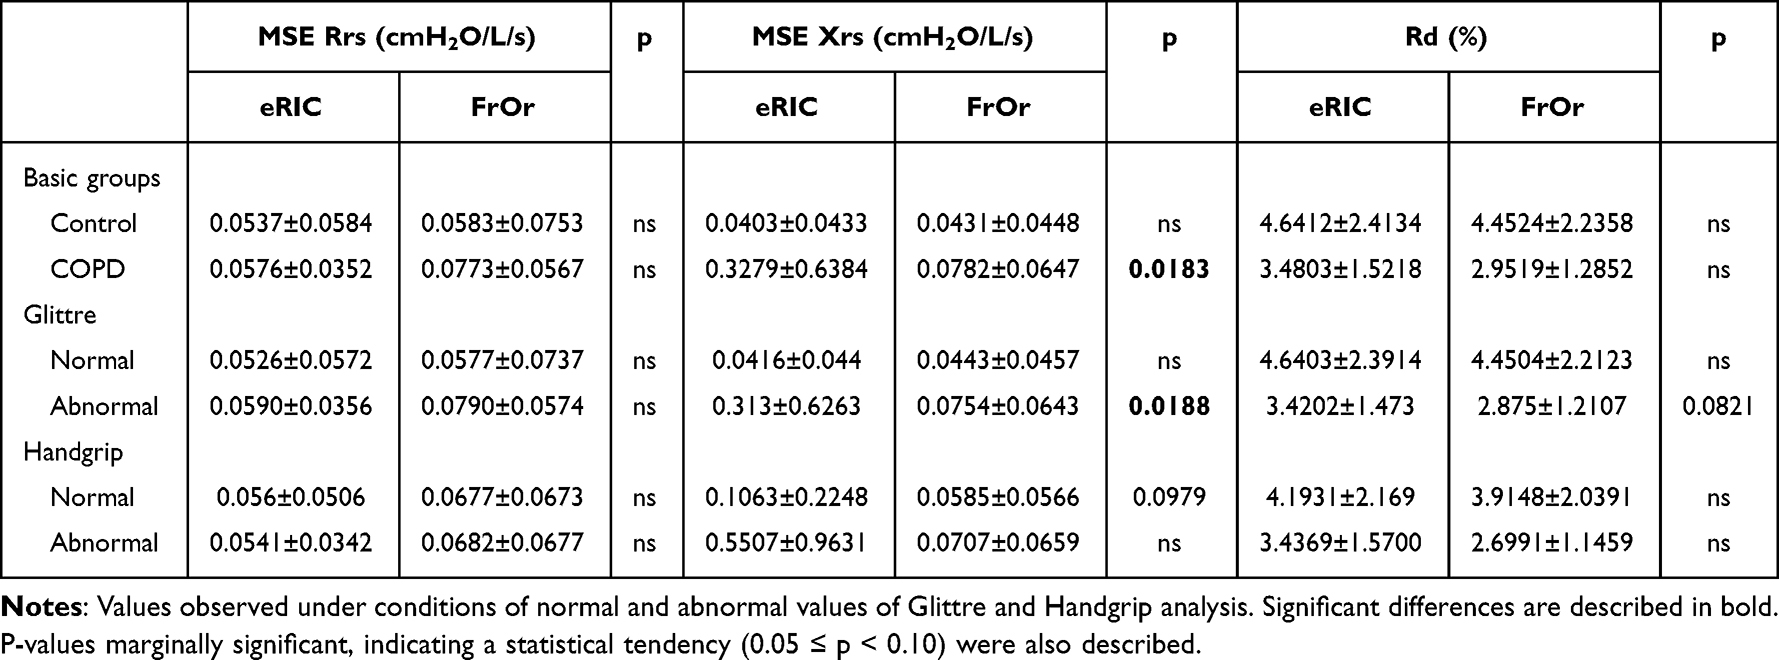 |
Table 3 Mean Square Errors (MSE) and Relative Distance (Rd) in Integer and Fractional Order Models |
The correlations among functional capacity tests and respiratory modeling were carried out considering the group of patients with COPD. As can be seen in Figure 7, R and Rt showed significant inverse correlations (p<0.05) with the handgrip strength test. I also showed a significant inverse association with the handgrip strength test (p<0.05), while C presented a significant direct correlation (p<0.05) with handgrip strength test in both the dominant and non-dominant hand. A significant (p<0.05) inverse relationship was observed between C and the Glittre-ADL test. The interested reader may obtain a detailed description of this analysis in Tables S1 and S2.
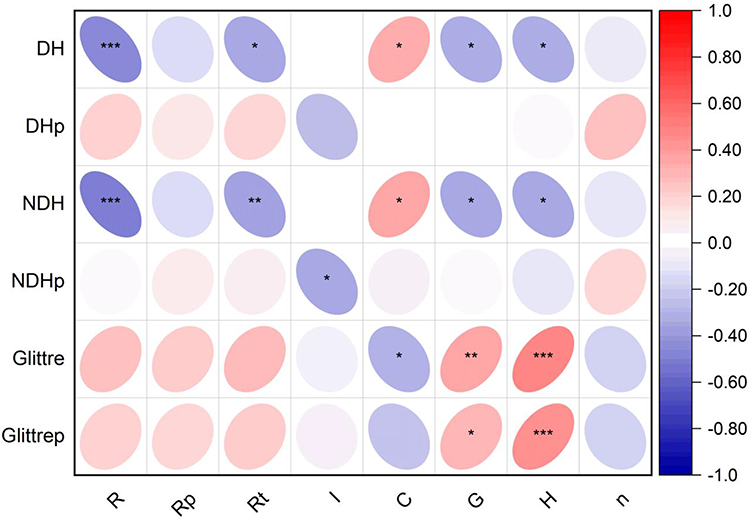 |
Figure 7 Correlation plot in patients with COPD describing the association of integer and fractional-order model parameters with total Glittre-ADL test time and handgrip analysis. Abbreviation: Dominant hand (DH), non-dominant hand (NDH), percentual of the predicted values (p), central airway resistance (R), peripheral resistance (Rp), total resistance (Rt), pulmonary inertance (I), alveolar compliance (C), damping factor (G); respiratory elastance (H) and hysteresivity (n), * p<0.05, ** p<0.02 *** p<0.005. |
In Figure 7 we can also observe the correlations of fractional order modeling parameters and the functional tests. G and H showed significant direct associations (p<0.05) with the Glittre-ADL test. Significant inverse correlations (p<0.05) were observed with the handgrip strength test in the dominant and non-dominant hand.
Figure 8A shows the accuracy and confidence interval for the modeling parameters in predicting non-normal functional capacity in COPD, assessed by the Glittre-ADL test. Healthy individuals and COPD patients were used in this analysis. The interested reader may obtain a detailed description of this analysis in Table S3. Among the studied parameters, Rp, Rt and η were the most accurate, achieving high prediction accuracy (AUC>0.90).
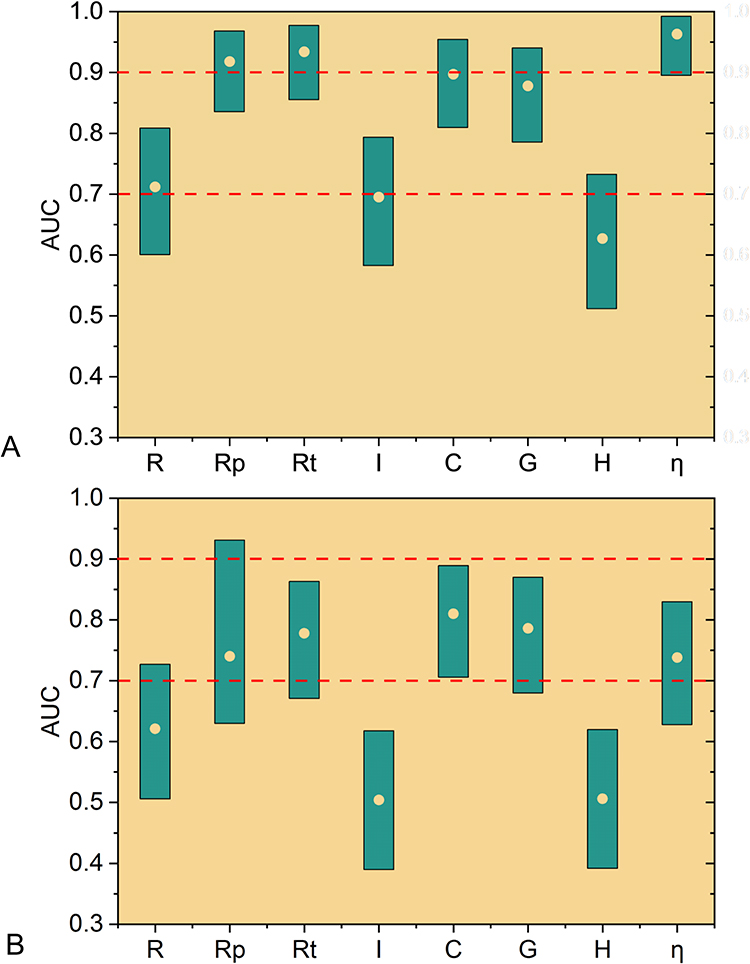 |
Figure 8 Accuracy (point) and 95% confidence interval (bar) of respiratory model parameters in predicting abnormal functional capacity in COPD based on Glittre-ADL Test (A) and Handgrip analysis (B). Red dashed lines describe adequate (AUC>0.7) and highly accurate (AUC>0.9) limits. Central airway resistance (R), peripheral resistance (Rp), total resistance (Rt), pulmonary inertance (I), alveolar compliance (C), damping factor (G); respiratory elastance (H) and hysteresivity (η). |
Figure 8B describes the results obtained considering the handgrip test as a reference. More details of this analysis may be obtained in Table S4. Five parameters studied provided adequate accuracy in predicting non-normal functional capacity in COPD. Among them C (AUC=0.810) and G (AUC=0.786) achieved the highest accuracies.
Discussion
This study investigated the association of the eRIC and FrOr models with exercise tolerance in patients with COPD and evaluated whether these models could predict poor exercise tolerance in these patients. Three key findings were revealed: (1) Alterations in model parameters correlated with functional capacity; (2) The eRIC and FrOr models accurately predicted poor Glittre-ADL test and handgrip strength in COPD and (3) Abnormal functional capacity based on the Glittre-ADL test were predicted by Rp, Rt and η with high accuracy, while abnormalities based on handgrip analysis were accurately predicted by C. These results provide strong evidence that indices from the eRIC and FrOr models are related to physical performance and are helpful in predicting poor exercise tolerance in COPD patients.
Analyzing the anthropometric characteristics (Table 1), no significant differences were observed between the groups, indicating homogeneity among the studied groups. The observed reductions in spirometric parameters were consistent with COPD classification values4 and with previous studies.11,12,27,42
The ADL–Glittre test was developed to meet the need for a more representative and objective assessment of function in people with COPD.43 These tests are able to detect endurance capacity reduction for functional tasks that are important for daily life in people with COPD.44 There was a significant increase in time in the COPD group when compared to predicted values (Figure 2A), demonstrating the decline in the functional capacity of these patients.45 Previous work on COPD patients showed similar results.46,47 COPD is characterized by airway narrowing and expiratory collapse, resulting in expiratory flow limitation, gas trapping, and hyperinflation, functional abnormalities that reduce exercise capacity.24 Individuals with COPD frequently report dyspnea related to daily tasks, resulting primarily from a decreased ability of the respiratory muscles to meet an increased mechanical load.48,49 Dyspnea and exercise limitation are the predominant consequences of COPD in stable condition.50 It is known that dynamic hyperinflation and thoracoabdominal desynchrony potentiate dyspnea and increase ventilatory and metabolic demand in patients with COPD.38 The inclusion of upper limb activities in the ADL–Glittre test makes it more similar to daily activity limitations.43 Activities using the upper limbs, even at lower intensities than activities with the lower limbs, can cause thoracoabdominal desynchrony, dynamic hyperinflation and consequent dyspnea.45
Handgrip strength is used as an important functional marker for maintaining functional independence and quality of life, and reduced levels of grip strength can predict disability in these individuals.51 Results of a meta-analysis indicate that people with COPD have lower functional capacity than healthy controls.52 Handgrip test values were significantly reduced in the COPD group, both in MD and MND (Figure 2B). Handgrip strength is used as a surrogate marker for muscle strength.21 Previous studies have described results similar to ours in patients with COPD.27,53 These results are also consistent with a recent previous study, which showed weakness even in smokers with normal spirometry and preserved ratio-impaired spirometry.54 Decreased handgrip strength in patients with COPD is associated with systemic inflammation originating from the lung and a decrease in muscle mass of the peripheral extremities.20 Peripheral muscles become underused, leading to muscle deconditioning and/or atrophy due to disuse, reducing muscle mass and oxidative capacity, also making them more susceptible to fatigue.18
Traditional respiratory oscillometry measurements are described in Table 2. The observed increases in resistive parameters (R4, R12, R20) are associated with inflammation of the mucous glands due to high tobacco consumption, which results in airway obstruction and decreased caliber.55,56 Increased R4-R20 values reflect ventilation heterogeneity.57 In line with these results, recent studies have shown associations between resistance variations and the degree of morphological abnormalities of the small airways assessed with endobronchial optical coherence tomography in COPD and heavy smokers.58
The more negative reactance (Xm) found in the patient groups reflects the reduction in the homogeneity of the respiratory system and in the dynamic compliance of the subjects under study.12,42 Table 2 also showed a significant reduction in dynamic compliance (Cdyn), which is related to the elastic properties of the respiratory system. This decrease may be associated with changes in lung tissue, chest wall, increased resistance and changes in airway distensibility.59 In agreement with the more negative reactance values (Xm), fr presented higher values in patients.12 Likewise, the observed increase in Ax is related to the elastic properties of the respiratory system, also resulting from the increased degree of obstruction of the peripheral airways.9,12
There was a significant increase in Z4 in the COPD group. This parameter evaluates the absolute value of respiratory impedance, being associated with the work carried out by the respiratory muscles to overcome resistive and elastic, in order to promote air flow in the respiratory system. The observed increase in Zrs is consistent with the clinical changes usually observed in COPD, which include increased dyspnea.12,27,60
Figure 3 describes the results of the eRIC model parameters in patients classified according to the Glittre-ADL test. R increased in abnormal conditions (Figure 3A), which may be related to the increased presence of secretion in the central airways and changes in the lung parenchyma. This increase in resistance may also be related with increased inflammation and decreased radial traction in the airways.4,55 This result agrees with data obtained through spirometry (Table 1), which describes the presence of obstruction in this class of patients.
Rp is theoretically associated with peripheral airways. The increase in Rp observed in the group with reduced functional performance (Figure 3B) is associated with the effects of smoking, which begins in the more peripheral airways due to inflammation and narrowing of these airways, which leads to increased resistance in this region.9 Increased values of Rp were also observed in patients presenting functional limitation according to the handgrip test (Figure 5B). Since skeletal muscle dysfunctions in COPD can arise due to low tissue oxygen levels,61 which may be related with abnormal peripheral ventilation, these results provides additional evidence that eRIC modeling can be useful in identifying changes in peripheral airways.12,27,62
Similarly, Rt increased in COPD patients with reduced functional capacity (Figures 3C and 5C). This resistance corresponds to the amount of obstruction throughout the respiratory system, that is, to the sum of the central and peripheral components. One of the main factors contributing to the development of disability in COPD includes damage to the airways, which triggers dyspnea, resulting in general physical deconditioning and muscle weakness. These elements combined lead to limitation of daily activities and, consequently, the inability to engage in physical exercise adequately, which may explain the obtained results.
Respiratory inertance integrates the inertial properties of the entire respiratory system,10 including the mass of gas that moves during spontaneous ventilation. In the present study, there was a significant decrease in inertance in patients with reduced functional capacity as measured by the Glittre-ADL tst (Figures 3D). This can be explained by the concept of choke points.9,63 COPD causes excessive narrowing and collapse of the airways closer to the alveolus during expiration, known as dynamic compression.64 In these conditions, the respiratory oscillometry signal is prevented from passing through and does not consider the lung beyond these points, so that the measured inertance reflects the airways that are more proximal. Thus, the increase in respiratory obstruction introduces a reduction in the apparent mass of the gas measured by respiratory oscillometry, in the associated pressure necessary for gas acceleration and, consequently, in the measured inertance. Previous work by our group on work-related asthma65 and cystic fibrosis9 showed similar results.
C showed reduced values in the group with impaired functional capacity (Figures 3E and 5E). This behavior may be associated with changes in the architecture and bronchial wall, which result in decreased respiratory system compliance or increased peripheral airway resistance.66 It can also be explained, at least in part, by the concept of apparent compliance, which is similar to that discussed previously in relation to inertance.63
Considering the FrOr model, impaired functional capacity introduced a significant increase in G (Figures 4A and 6A), reflecting increased energy dissipation in the respiratory system.10 This result is consistent with the pathophysiology of COPD, since, during the course of the disease, airway resistance increases due to increased secretion and changes in the lung parenchyma, thus increasing the energy dissipation and work of breathing in volunteers.12,67 Limited functional capacity does not introduce significant changes in H, both in the groups classified by the ADL–Glittre test and those classified by the handgrip test (Figures 4B and 6B).
The increase in η reflects the increase in heterogeneity and changes in the lung structure in conditions of limited functional capacity (Figures 4C and 6C). Changes in bronchial architecture resulting from more severe COPD led to an increase in hysteresis, causing an irregular distribution of ventilation, associated with imbalances in pulmonary time constants.12,68,69 In close agreement with our results, Ionescu et al observed increased hysteresivity using fractional order models in patients with more severe COPD.70
The FrOr model presented the best performance in terms of MSE Xrs in the basic group of patients with COPD and those with reduced functional performance in the ADL-Glitre test (Table 3). It was also interesting to point out the presence of values of p marginally significant (0.05≤p<0.10), indicating a statistical tendency of improved performance of the FrOr model in terms of Rd in patients with abnormal performance in the ADL-Glitre test and MSE Xrs in conditions of normal performance in the Handgrip analysis ADL-Glitre test. While not meeting the conventional criterion for statistical significance, they suggest that there may be an effect worth further investigation. These findings may be explained by the ability of the FrOr models to adjust to fractional values of 20 dB/dec, in contrast with the eRIC model, which is limited to integer multiples of 20 dB/dec.
Inverse associations were observed among the handgrip test analysis and the resistive parameters R and Rt from the eRIC model (Figure 7 and Table S1). Increased values of inertance were associated with reduced force in the nondominant hand, while reduced compliance was related with reduced force in both hands and increased time in the ADL-Glitre test. The results described in Figure 7 are coherent with that obtained by Gulart et al in which moderate and significant associations were observed among the ADL-Glitre test and spirometric parameters.71
Skeletal muscle dysfunction in COPD encompasses a range of changes that impact the muscles used for both locomotion and breathing.61 A characteristic feature of COPD is the change in the normal proportions of skeletal muscle fibers. While aging is generally associated with a decrease in the proportion of type II fibers, patients with COPD tend to present a reduction in the proportion of type I fibers, in favor of type IIx fibers, in the appendicular limbs. These type IIx fibers are glycolytic, fast-twitch and prone to fatigue, adapted mainly for brief activities, while type I fibers are oxidative, slow-twitch and more suitable for prolonged activities. Thus, this change in muscle fiber type observed in COPD patients likely contributes to the exercise intolerance reported in this condition and the subsequent decline in functional capacity. Early leg fatigue, early muscular acidosis and a greater feeling of tiredness in the legs are examples of how this change in the type of muscle fiber can influence exercise intolerance in COPD. Furthermore, the diaphragm also shows a change in fiber type in the opposite direction, with an increase in type I fibers.61 Recent studies provided evidence that genetic factors are significantly associated with functional impairment in COPD.72
Considering the correlation analyzes between the functional capacity exams and the fractional order model (Figure 7 and Table S2), direct and significant relationships were observed between the G and H parameters and the total time of the Glittre-ADL test. Inverse associations were observed with the handgrip test. Oxidative stress, characterized by the imbalance between antioxidants and free radicals, can impair muscle function in patients with COPD, damaging lipids and proteins essential for muscle contraction, affecting cellular respiration in mitochondria and compromising the integrity of cell membranes. Although it is not completely elucidated, there is evidence suggesting that oxidative stress may contribute to the decrease in resistance and muscle contractile capacity in patients with COPD, which may explain the observed associations. Furthermore, it is common to observe a state of low-grade inflammation in patients with stable COPD, which may worsen during acute attacks of the disease. However, the exact source of pro-inflammatory cytokines associated with COPD has not yet been fully understood.61
Figure 8A and Table S3 shows the accuracy, confidence interval, sensitivity, specificity and cutoff point for the modeling parameters in predicting non-normal functional capacity in COPD, as assessed by the Glittre-ADL test. Among the studied parameters, Rt, Rp and η achieved high prediction accuracy (AUC>0.90). This high performance probably reflects the impact of total resistance, ventilation heterogeneity and changes in lung structure in functional performance. All these changes result in abnormalities in gas exchange,4 which may contribute to explain this finding.
Considering the analysis using the handgrip test as a reference, the accuracies and cut-off points of the parameters studied in predicting non-normal functional capacity are presented in Figure 8B and Table S4. eRIC and FrOr parameters provided adequate predictive accuracy, and among them, C and G achieved the highest accuracies. In this sense, C stands out among the model parameters, presenting the highest accuracy for prediction reduced functional performance in COPD.
The prediction accuracy was higher for the Glittre-ADL test (Figure 8A) than for the Handgrip (Figure 8B). The Glittre-ADL test is a more comprehensive assessment of functional capacity, closely related to daily activities, and captures a wider range of physical abilities compared to the more isolated measure of grip strength provided by the Handgrip test. Therefore, we can speculate that this difference may reflect the greater impact of the respiratory system on the functional performance of the human body as a whole, as evaluated by the Glittre-ADL test, compared to its impact on a specific section, as evaluated by the Handgrip test.
A growing body of evidence suggests that respiratory modelling may contribute in the diagnostic73 and management74 of COPD. One of the main criticisms of the clinical use of respiratory modeling has been associated with the interpretation of the obtained parameters. In this sense, the present study shows that these parameters are consistent with the exercise limitations presented by COPD patients and that these imitations can be accurately predicted by the studied model parameters.
Previous studies from our group in a smaller number of subjects investigated the ability of traditional oscillometric parameters to predict exercise limitation in COPD.27 The highest accuracies were AUC=0.906 and AUC=0.779 based on Glittre and Handgrip evaluations, respectively. In the present study using modeling parameters, improved accuracies were obtained considering both Glitre (AUC=0.963) and Handgrip (AUC=0.810) tests as a reference. These results provide additional evidence of the clinical applicability of respiratory models in COPD.
There are several limitations to the present study. First, the number of evaluated subjects is relatively small. This might interfere with the statistical accuracy of the results (including Cohen´s D and Hedges’ G). Further investigations involving a more significant number of subjects are warranted.
Second, COPD includes emphysema and chronic bronchitis, which represent different phenotypes with distinct characteristics. The groups under study did not take these particularities into account. Further research is needed to assess these specific phenotypes individually.
The present study was based on functional performance evaluations based on Glittre-ADL and Handgrip test. One could argue that there are other tests that could be useful, complementing the performed analyses, such as the six-minute walk test75 and the step test.76
One could also argue that more than one of the studied parameters can affect the functional performance and that a more sophisticated analysis is necessary to elucidate these associations. However, the objective of this study is the prediction of abnormal functional performance in COPD, providing simple procedures based on a single parameter. This can be very useful in the clinical setting, where healthcare professionals are often very busy and not able to perform elaborate analyses. Correlation analysis was an intermediate step able to show associations, which provided the basic physiological fundamentals to the results obtained during the evaluation of prediction accuracy. Multivariate analysis and interpretable machine learning methods (IML) may help to provide a detailed description of these intricate associations. Additionally, IML may improve the prediction accuracy, as observed previously in the diagnostic accuracy of respiratory abnormalities in patients with sarcoidosis.77 We are planning to contribute in this direction in the near future.
The use of a single-center Brazilian population restricts the generalizability of our findings. Future multi-center studies are necessary to validate these results across a broader range of patients and increase the applicability of our findings.
There are other models of the respiratory system that could have been studied.8,13 We are planning to do these analyses in the next steps of this research. Despite these limitations, the present analysis significantly contributes to a elucidate the use of eRIC and FrOr models in the evaluation of patients with COPD.
Conclusion
This study evaluated the association of the eRIC and FrOr models with functional capacity in COPD. It was demonstrated that these models adequately described the presence of exercise limitations. This resulted in significant and consistent correlations between these parameters and functional capacity indices. The ROC analysis demonstrated that the Rp, Rt and η parameters achieved high accuracy in predicting limitations in the Glittre-ADL test, while C and G achieved adequate accuracy in predicting limitations in the handgrip strength test. These results support and add new information about the analysis of functional capacity tests, suggesting that integer and fractional order modeling are associated with non-normal exercise performance in COPD and may help predict poor functional performance in these patients.
Acknowledgments
The Brazilian Council for Scientific and Technological Development (CNPq), the Rio de Janeiro State Research Supporting Foundation (FAPERJ) supported this study and in part by the Coordenação de Aperfeiçoamento de Pessoal de Nível Superior-Brasil (CAPES)-Finance Code 001. This paper has been uploaded to ResearchSquare as a preprint: https://www.researchsquare.com/article/rs-4732462/v1.
Disclosure
The authors declare that they have no competing interests in this work.
References
1. Ruvuna L, Sood A. Epidemiology of chronic obstructive pulmonary disease. J Clin Chest Med. 2020;41(3):315–327. doi:10.1016/j.ccm.2020.05.002
2. Maselli DJ, Bhatt SP, Anzueto A, et al. Clinical epidemiology of COPD: insights from 10 years of the COPDGene study. J Chest. 2019;156(2):228–238. doi:10.1016/j.chest.2019.04.135
3. Khan MI, Khan M, Mannino DM. The new epidemiology of COPD. J COPD in the 21st Century Sheffield, European Respiratory Society. 2024;2024:63–80.
4. The Global Strategy for the Diagnosis. Management and prevention of COPD, Global Initiative for Chronic Obstructive Lung Disease (GOLD). 2023. Available from: http://wwwgoldcopdorg.
5. Karkhanis V, Joshi J. Spirometry in chronic obstructive lung disease (COPD). J Associat Phys India. 2012;60 Suppl:22–26.
6. King G, Bates J, Berger K, et al. Technical standards for respiratory oscillometry. Europ resp J. 2020;55(2):1900753. doi:10.1183/13993003.00753-2019
7. Miranda IA, Dias Faria AC, Lopes AJ, Jansen JM, Lopes de Melo P. On the respiratory mechanics measured by forced oscillation technique in patients with systemic sclerosis. J PLoS One. 2013;8(4):e61657. doi:10.1371/journal.pone.0061657
8. Bates JHT. Lung Mechanics: An Inverse Modeling Approach.
9. Lima A, Lopes A, Faria A, Jansen J, Melo P. Forced oscillations and respiratory system modeling in adults with cystic fibrosis. Biomed Eng Online. 2015;14:14. doi:10.1186/s12938-015-0008-6
10. Faria A, Veiga J, Lopes A, Melo P, López-González AA, Aguiló A. Forced oscillation, integer and fractional-order modeling in asthma. Comput Methods Programs Biomed. 2016;126:128. doi:10.1016/j.cmpb.2015.12.010
11. Ribeiro C, Faria A, Lopes A, Melo P. Forced oscillation technique for early detection of the effects of smoking and COPD: contribution of fractional-order modeling. Int J Chron Obstruct Pulmon Dis. 2018;13:3281–3295. doi:10.2147/COPD.S173686
12. Ribeiro C, Lopes A, Melo P, He X, Li T, Chen Y. Oscillation mechanics, integer and fractional respiratory modeling in COPD: effect of obstruction severity. Int J Chronic Obstr. 2020;15:15. doi:10.2147/COPD.S234634
13. Ionescu CM. The Human Respiratory System: An Analysis of the Interplay Between Anatomy, Structure, Breathing and Fractal Dynamics. London: Springer; 2013.
14. José A, Dal Corso S. Reproducibility of the six-minute walk test and Glittre ADL-test in patients hospitalized for acute and exacerbated chronic lung disease. Braz J Phys Ther. 2015;19(n. 3):235. doi:10.1590/bjpt-rbf.2014.0092
15. Skumlien S, Hagelund T, Bjortuft O, Ryg MS. A field test of functional status as performance of activities of daily living in COPD patients. Respir Med. 2006;100(2):316–323. doi:10.1016/j.rmed.2005.04.022
16. Gulart A, Munari A, Klein S, Santos da Silveira L, Mayer A. The Glittre-ADL test cut-off point to discriminate abnormal functional capacity in patients with COPD. COPD. 2018;15(1). doi:10.1080/15412555.2017.1369505
17. Strandkvist V, Backman H, Röding J, Stridsman C, Lindberg A. Hand grip strength is associated with forced expiratory volume in 1 second among subjects with COPD: report from a population-based cohort study. Int J Chron Obstruct Pulmon Dis. 2016;11:2527–2534. doi:10.2147/COPD.S114154
18. Vieira R, Nogueira I, Queiroz N, et al. Peripheral and respiratory muscle strength in chronic obstructive pulmonary disease. Rev Bras Cineantropom Desempenho Hum. 2018;20(2):125–133. doi:10.5007/1980-0037.2018v20n2p125
19. Riviati N, Setiati S, Laksmi P, Abdullah M. Factors related with handgrip strength in elderly patients. Acta Medica Indonesiana. 2017;49(3):215–219.
20. Jeong M, Kang H, Song P, et al. Hand grip strength in patients with chronic obstructive pulmonary disease. Int J Chron Obstruct Pulmon Dis. 2017;12:2385–2390. doi:10.2147/COPD.S140915
21. Albarrati A, Gale N, Enright S, Munnery M, Cockcroft J, Shale D. A simple and rapid test of physical performance in chronic obstructive pulmonary disease. Int J Chron Obstruct Pulmon Dis. 2016;11:1785–1791. doi:10.2147/COPD.S106151
22. Lee S, Kim S, Han Y, Ryu Y, Lee J, Chang J. Hand grip strength and chronic obstructive pulmonary disease in Korea: an analysis in KNHANES VI. Int J Chron Obstruct Pulmon Dis. 2017;12:2313–2321. doi:10.2147/COPD.S142621
23. Zeng G, Chen L, Fan H, et al. The relationship between steps of 6MWT and COPD severity: a cross-sectional study. Int J Chronic Obstr. 2018;14:141–148. doi:10.2147/COPD.S188994
24. Zimmermann S, Thamrin C, Chan A, Bertolin A, Chapman D, King G. Relationships between forced oscillatory impedance and 6-minute walk distance after pulmonary rehabilitation in COPD. Int J Chronic Obstr. 2020;15:157–166. doi:10.2147/COPD.S225543
25. Yamamoto A, Shirai T, Hirai K, et al. Oscillometry as a predictor of exercise tolerance in COPD. COPD. 2020;17(6):647–654. doi:10.1080/15412555.2020.1844176
26. Yamamoto Y, Miki K, Matsuki T, et al. Evaluation of exertional ventilatory parameters using oscillometry in COPD. Int J Chron Obstruct Pulmon Dis. 2020;15:1697–1711. doi:10.2147/COPD.S260735
27. Ribeiro C, Lopes A, de Melo P. Respiratory oscillometry in chronic obstructive pulmonary disease: association with functional capacity as evaluated by adl glittre test and hand grip strength test. Int J Chronic Obstr. 2022;17:1017–1030. doi:10.2147/COPD.S353912
28. Miller M, Hankinson J, Brusasco V, et al. Standardisation of spirometry. Eur Respir J. 2005;26(2):319–338. doi:10.1183/09031936.05.00034805
29. Pereira C. Diretrizes Brasileiras de Espirometria. J Pneumol. 2002;28(3):S1–82.
30. Ribeiro F, Lopes A, Melo P. Reference values for respiratory impedance measured by the forced oscillation technique in adult men and women. Clin Respir J. 2018;12(6):2126–2135. doi:10.1111/crj.12783
31. Graham B, Steenbruggen I, Miller M, et al. Standardization of spirometry 2019 update. An official American thoracic society and European respiratory society technical statement. Am J Respir Crit Care Med. 2019;200(8):e70–e88. doi:10.1164/rccm.201908-1590ST
32. Pereira C, Sato T, Rodrigues S. New reference values for forced spirometry in white adults in Brazil. J Bras Pneumol. 2007;33(4):397–406. doi:10.1590/S1806-37132007000400008
33. de Melo PL, Werneck MM, Giannella-Neto A. New impedance spectrometer for scientific and clinical studies of the respiratory system. Rev Sci Instrum. 2000;71(7):2867–2872. doi:10.1063/1.1150705
34. Lorino AM, Atlan G, Lorino H, Zanditenas D, Harf A. Influence of posture on mechanical parameters derived from respiratory impedance. Eur Respir J. 1992;5(9):1118–1122. doi:10.1183/09031936.93.05091118
35. Mathiowetz V, Weber K, Volland G, Kashman N. Reliability and validity of grip and pinch strength evaluations. J Hand Surg. 1984;9(2):222–226. doi:10.1016/S0363-5023(84)80146-X
36. Novaes RD, Miranda AS, Silva JO, Tavares BVF, Dourado VZ. Reference equations for predicting of handgrip strength in Brazilian middle-aged and elderly subjects. Fisioter Pesq. 2009;16(n. 3):217–222. doi:10.1590/S1809-29502009000300005
37. Borg G. Psychophysical bases of perceived exertion. Med Sci Sports Exercise. 1982;14(5):377–381. doi:10.1249/00005768-198205000-00012
38. Reis C, Karloh M, Fonseca F, Biscaro R, Mazo G, Mayer A. Functional capacity measurement: reference equations for the Glittre Activities of Daily Living test. J Bras de Pneumol. 2018;44(5):370–377. doi:10.1590/s1806-37562017000000118
39. Lauretani F, Russo C, Bandinelli S, et al. Age-associated changes in skeletal muscles and their effect on mobility: an operational diagnosis of sarcopenia. J Appl Physiol. 2003;95(5):1851–1860. doi:10.1152/japplphysiol.00246.2003
40. Elbedewy R, El Said S, Taha R. Indicators of abnormal hand grip strength among older Egyptian adults. J Multidisciplinary Healthcare. 2020;2020:13.
41. Swets J. Measuring the accuracy of diagnostic systems. Science. 1988;240(4857):1285–1293. doi:10.1126/science.3287615
42. Di Mango A, Lopes A, Jansen J, Melo P. Changes in respiratory mechanics with increasing degrees of airway obstruction in COPD: detection by forced oscillation technique. Respir Med. 2006;100(3):399–410. doi:10.1016/j.rmed.2005.07.005
43. Dechman G, Scherer S. Outcome measures in cardiopulmonary physical therapy: focus on the Glittre ADL-test for people with chronic obstructive pulmonary disease. Cardiopulmonary Phys Ther J. 2008;19(4):115–118. doi:10.1097/01823246-200819040-00003
44. Patrícia de Souza Mendes L, Parreira VF, Spencer LM, et al. Glittre endurance test: a new test to assess the functional capacity of individuals with chronic obstructive pulmonary disease. Respir Med. 2022;202:106983. doi:10.1016/j.rmed.2022.106983
45. Gulart A, Santos K, Munari A, Karloh M, Cani K, Mayer A. Relationship between the functional capacity and perception of limitation on activities of daily life of patients with COPD. Fisioter Pesq. 2015;22(2):104–111.
46. Karloh M, Araujo C, Gulart A, Reis C, Steidle L, Mayer A. The Glittre-ADL test reflects functional performance measured by physical activities of daily living in patients with chronic obstructive pulmonary disease. Braz J Phys Ther. 2016;20(3):223–230. doi:10.1590/bjpt-rbf.2014.0155
47. Cavalheri V, Donária L, Ferreira T, et al. Energy expenditure during daily activities as measured by two motion sensors in patients with COPD. Respir Med. 2011;105(6):922–929. doi:10.1016/j.rmed.2011.01.004
48. Laghi F, Tobin M. Disorders of the respiratory muscles. Am J Respir Crit Care Med. 2003;168(1):10–48. doi:10.1164/rccm.2206020
49. Pitta F, Troosters T, Spruit M, Probst V, Decramer M, Gosselink R. Characteristics of physical activities in daily life in chronic obstructive pulmonary disease. Am J Respir Crit Care Med. 2005;171(9):972–977. doi:10.1164/rccm.200407-855OC
50. Perez T, Deslée G, Burgel P, et al. Predictors in routine practice of 6-min walking distance and oxygen desaturation in patients with COPD: impact of comorbidities. Int J Chronic Obstr. 2019;2019:14.
51. Bohannon R, Bear-Lehman J, Desrosiers J, Massy-Westropp N, Mathiowetz V. Average grip strength: a meta-analysis of data obtained with a Jamar dynamometer from individuals 75 years or more of age. J Geriatric PhysTher. 2007;30(1):28–30. doi:10.1519/00139143-200704000-00006
52. Núñez-Cortés R, Padilla-Acevedo P, Vergara-Peña F, et al. Clinical assessment of balance and functional impairments in people with stable chronic obstructive pulmonary disease: a systematic review and meta-analysis. ERJ Open Res. 2022;8(4):00164–2022. doi:10.1183/23120541.00164-2022
53. Gosselink R, Troosters T, Decramer M. Distribution of muscle weakness in patients with stable chronic obstructive pulmonary disease. J Cardiopulmonary Rehabil. 2000;20(6):353–360. doi:10.1097/00008483-200011000-00004
54. Zou RH, Nouraie SM, Rossiter HB, et al. Associations between muscle weakness and clinical outcomes in current and former smokers. Chronic Obstr Pulm Dis. 2023;10(1):112–121. doi:10.15326/jcopdf.2022.0365
55. Bohadana A, Teculescu D, Martinet Y. Mechanisms of chronic airway obstruction in smokers. Respir Med. 2004;98(2):139–151. doi:10.1016/j.rmed.2003.09.005
56. Faria ACD, da Costa AA, Lopes AJ, Jansen JM, De Melo PL. Forced oscillation technique in the detection of smoking‐induced respiratory alterations: diagnostic accuracy and comparison with spirometry. Clinics. 2010;65(12):1295–1304. doi:10.1590/S1807-59322010001200012
57. Oostveen E, MacLeod D, Lorino H, et al. The forced oscillation technique in clinical practice: methodology, recommendations and future developments. Eur Respir J. 2003;22(6):1026–1041. doi:10.1183/09031936.03.00089403
58. Su Z, Guan W, Li S, et al. Significances of spirometry and impulse oscillometry for detecting small airway disorders assessed with endobronchial optical coherence tomography in COPD. Int J Chronic Obstr. 2018;14:13. doi:10.2147/COPD.S157141
59. MacLeod D, Birch M. Respiratory input impedance measurement: forced oscillation methods. Med Biol Eng Comput. 2001;39(5):505–516. doi:10.1007/BF02345140
60. Sá P, Castro H, Lopes A, Melo P. Early diagnosis of respiratory abnormalities in asbestos-exposed workers by the forced oscillation technique. PLoS One. 2016;11(9):e0161981. doi:10.1371/journal.pone.0161981
61. Nici L, ZuWallack R. Chronic Obstructive Pulmonary Disease: Co-Morbidities and Systemic Consequences. Springer; 2011.
62. Stockley JA, Cooper BG, Stockley RA, Sapey E. Small airways disease: time for a revisit? Int J Chron Obstruct Pulmon Dis. 2017;12:2343–2353. doi:10.2147/COPD.S138540
63. Dellacà R, Duffy N, Pompilio P, et al. Expiratory flow limitation detected by forced oscillation and negative expiratory pressure. Europ Resp J. 2007;29(2):363–374. doi:10.1183/09031936.00038006
64. West JB. Pulmonary Pathophysiology - the Essentials. China: Wolters Kluwer; 2013.
65. Tuza F, De sá P, Castro H, Lopes A, De melo P. Combined forced oscillation and fractional-order modeling in patients with work-related asthma: a case-control study analyzing respiratory biomechanics and diagnostic accuracy. Biomed Eng Online. 2020;19(1). doi:10.1186/s12938-020-00836-6
66. Dellacà RL, Santus P, Aliverti A, et al. Detection of expiratory flow limitation in COPD using the forced oscillation technique. Eur Respir J. 2004;23(2):232–240. doi:10.1183/09031936.04.00046804
67. Kaczka DW, Dellaca RL. Oscillation mechanics of the respiratory system: applications to lung disease. Crit Rev Biomed Eng. 2011;39(4):337–359. doi:10.1615/CritRevBiomedEng.v39.i4.60
68. Ionescu C, De Keyser R. Relations between fractional-order model parameters and lung pathology in chronic obstructive pulmonary disease. IEEE Transactions Bio-Med Eng. 2009;56(4):978–987. doi:10.1109/TBME.2008.2004966
69. Amaral JL, Lopes AJ, Jansen JM, Faria AC, Melo PL. Machine learning algorithms and forced oscillation measurements applied to the automatic identification of chronic obstructive pulmonary disease. Comput Methods Programs Biomed. 2012;105(3):183–193. doi:10.1016/j.cmpb.2011.09.009
70. Ionescu C, Derom E, De Keyser R. Assessment of respiratory mechanical properties with constant-phase models in healthy and COPD lungs. Comput Methods Programs Biomed. 2010;97(1):78–85. doi:10.1016/j.cmpb.2009.06.006
71. Gulart AA, Munari AB, Klein SR, Gavenda SG, Sagrillo LM, Mayer AF. Performance in the Glittre-ADL test is associated with the pulmonary function of patients with chronic obstructive pulmonary disease. Copd. 2021;18(6):637–642. doi:10.1080/15412555.2021.2008339
72. Marçalo R, Rodrigues G, Pinheiro M, et al. Functional impairment in COPD can be predicted using genomic-derived data. Thorax. 2025;80(5):283–290. doi:10.1136/thorax-2024-222142
73. Ribeiro CO, Lopes AJ, De Melo PL. Oscillation mechanics, integer and fractional respiratory modeling in COPD: effect of obstruction severity. Int J Chron Obstruct Pulmon Dis. 2020;15:3273–3289. doi:10.2147/COPD.S276690
74. Zaidan MF, Reddy AP, Duarte A. Impedance oscillometry: emerging role in the management of chronic respiratory disease. Curr Allergy Asthma Rep. 2018;18(1):3. doi:10.1007/s11882-018-0757-y
75. ATS Committee on Proficiency Standards for Clinical Pulmonary Function Laboratories. ATS statement: guidelines for the six-minute walk test. Am J Respir Crit Care Med. 2002;166(1):111–117. doi:10.1164/ajrccm.166.1.at1102
76. Starobin D, Kramer MR, Yarmolovsky A, et al. Assessment of functional capacity in patients with chronic obstructive pulmonary disease: correlation between cardiopulmonary exercise, 6 minute walk and 15 step exercise oximetry test. Isr Med Assoc J. 2006;8(7):460–463.
77. Lima AD, Lopes AJ, Amaral JL, Melo PL. Explainable machine learning and respiratory oscillometry for the diagnosis of respiratory abnormalities in sarcoidosis. PLoS One. 2022;2022:1.
 © 2025 The Author(s). This work is published and licensed by Dove Medical Press Limited. The
full terms of this license are available at https://www.dovepress.com/terms
and incorporate the Creative Commons Attribution
- Non Commercial (unported, 4.0) License.
By accessing the work you hereby accept the Terms. Non-commercial uses of the work are permitted
without any further permission from Dove Medical Press Limited, provided the work is properly
attributed. For permission for commercial use of this work, please see paragraphs 4.2 and 5 of our Terms.
© 2025 The Author(s). This work is published and licensed by Dove Medical Press Limited. The
full terms of this license are available at https://www.dovepress.com/terms
and incorporate the Creative Commons Attribution
- Non Commercial (unported, 4.0) License.
By accessing the work you hereby accept the Terms. Non-commercial uses of the work are permitted
without any further permission from Dove Medical Press Limited, provided the work is properly
attributed. For permission for commercial use of this work, please see paragraphs 4.2 and 5 of our Terms.