")
Back to Journals » Risk Management and Healthcare Policy » Volume 16
Predicting the Severity of Esophageal Varices in Patients with Hepatic Cirrhosis Using Non-Invasive Markers
Received 26 April 2023
Accepted for publication 25 July 2023
Published 15 August 2023 Volume 2023:16 Pages 1555—1566
DOI https://doi.org/10.2147/RMHP.S418892
Checked for plagiarism Yes
Review by Single anonymous peer review
Peer reviewer comments 2
Editor who approved publication: Dr Jongwha Chang
Yang-Chun Du,1,2,* Dan Jiang,3,* Ji Wu1
1Department of Ultrasound, The First Affiliated Hospital of Guangxi Medical University, Nanning, 530021, People’s Republic of China; 2Department of Ultrasound, The People’s Hospital of Guangxi Zhuang Autonomous Region & Guangxi Academy of Medical Sciences, Nanning, 530021, People’s Republic of China; 3Department of Gastroenterology, The First Affiliated Hospital of Guangxi Medical University, Nanning, 530021, People’s Republic of China
*These authors contributed equally to this work
Correspondence: Ji Wu, Department of Ultrasound, The First Affiliated Hospital of Guangxi Medical University, No. 6 of Shuangyong Road, Qingxiu District, Nanning, 530021, People’s Republic of China, Tel +86 13978862109, Email [email protected]
Background: The presence and extent of severity of esophageal varices (EV) in patients with liver cirrhosis (LC) are predicted using noninvasive clinical, biochemical, and imaging parameters. The aim of this study was to investigate the accuracy of noninvasive predictors of EV, such as the platelet count-to-spleen diameter ratio (PSR), platelet count-to-spleen volume ratio (PSVR), spleen size (SZ), and a combination of these markers in determining the severity of EV in patients with cirrhosis.
Methods: We recruited 82 inpatients with LC from the Department of Gastroenterology at the First Affiliated Hospital of Guangxi Medical University between January 2018 and December 2019 for this diagnostic investigation. All patients underwent endoscopy, ultrasound, computed tomography, and routine laboratory investigations. For the study, we evaluated and compared the diagnostic accuracy of PSR, PSVR, SZ, and their combinations.
Results: There were significant differences in the area under the receiver operating characteristic (ROC) curve (AUC) in the prediction of severe and moderate/severe EV for all the variables. PSR+PSVR had the highest AUC at 0.735 (95% CI: 0.626– 0.826) and 0.765 (95% CI: 0.659– 0.852) for predicting severe and moderate/severe EV, respectively. There were statistically significant differences in the AUCs (95% CI) for PSR, PSVR, and PSR+PSVR in predicting the existence of EV. As per the overall model quality chart, the combination of PSR+PSVR was the best indicator for detecting the presence of EV (AUC, 0.696; 95% CI: 0.584– 0.792).
Conclusion: In our study, we found that these noninvasive parameters could predict the extent of severity of EV in patients with LC. We anticipate the use of a combination of PSR + PSVR to emerge as the superior indicator as studies progress.
Keywords: esophageal varices, liver cirrhosis, noninvasive predictors, platelet count-to-spleen diameter ratio, platelet count-to-spleen volume ratio, spleen size
Background
Liver cirrhosis (LC) often causes portal hypertension by changing the structure of hepatic tissue and blood flow in the liver.1 There are numerous collateral vessels between the portal vein and the vena cava. When there is high pressure in the portal vein to allow blood to flow back from the congested portal vein system, these collateral vessels open up in large numbers to establish collateral circulation. One of the main collateral circulations is the variances between the lower part of the esophagus and the gastric fundus veins. Portal hypertension is strongly associated with esophageal varices (EV).2 Hence, patients with chronic liver disease often have EV.3 The incidence of progression to EV is approximately 7% per year.4 It is estimated that 20% to 40% of patients with EV will have at least one episode of hemorrhaging as a result of a ruptured varix.5,6 A major cause of death in patients with cirrhosis is esophageal variceal bleeding (EVB). The EVB-related mortality rate at six weeks has been reported to be as high as 15% to 20%.4
The gold standard for the screening and diagnosis of EV and EVB is endoscopy.7–9 However, it is an invasive technique and unpleasant for patients, while also being expensive and time-consuming.9 Additionally, the majority of patients with LC have small varices, which carry a very low risk of bleeding, and up to 50% of patients with LC may not have developed EV 10 years later.9 Hence, endoscopy need not be used in every patient with hepatic cirrhosis to screen for EV. Various noninvasive methods, including clinical, biochemical, and imaging parameters, have been used to predict the existence and severity of EV in patients with LC.
Due to differences in the study population and pathogenesis of LC, various identified predictors of the presence of EV have been identified; therefore, there is no predictive model that can be extensively applied currently. However, there have been several studies focused on exploring noninvasive methods of assessing EV so as to identify patients with low-risk varices who do not need to undergo endoscopy and to predict the presence of high-risk varices, indicating the need for prophylaxis for primary bleeding.10–14 Therefore, the use of simple, noninvasive markers to identify the presence and severity of EV is essential.
In this study, we prospectively evaluated and compared the platelet count-to-spleen diameter ratio (PSR), platelet count-to-spleen volume ratio (PSVR), spleen size (SZ), and the combinations of these values (PSR + PSVR, PSR + SZ, PSR + PSVR + SZ, and PSVR + SZ) for their ability to noninvasively predict severe, moderate/severe, and the presence of EV in patients with LC.
Materials and Methods
Study Design
For this diagnostic study, we recruited 82 inpatients with LC from the Department of Gastroenterology at the First Affiliated Hospital of Guangxi Medical University between January 2018 and December 2019. LC was diagnosed based on clinical signs, symptoms, laboratory investigations, and imaging results. A liver biopsy was performed in the case of patients with an uncertain diagnosis of compensated cirrhosis. All patients enrolled in the study underwent routine clinical, biological, and laboratory investigations, imaging examinations, and upper gastrointestinal (GI) endoscopy for evaluation of EV.
We excluded patients with severe renal, cerebral, or cardiopulmonary dysfunction; liver cancer; or portal vein thrombosis; and patients who were unwilling to undergo endoscopy. Patients who previously underwent injection sclerotherapy, band ligation or surgery, or beta blocker therapy for EV were also excluded. We obtained informed consent from all participants as per the guidelines of the 2013 amended version of the Declaration of Helsinki. This study was reviewed and approved by the Clinical Research Ethics Committee of the First Affiliated Hospital of Guangxi Medical University (Approval Number: 2021(KY-E-244)).
Data Collection and Definition
We collected details pertaining to clinical characteristics, laboratory investigations, imaging examinations, and endoscopy data from the medical records of patients included in the study.
Clinical Characteristics
The clinical characteristics included age, gender, etiology, course of the disease, Child-Pugh class, presence of ascites, and presence of hepatic encephalopathy.
Laboratory Investigations
The laboratory investigation data collected for this study included white blood cell count, platelet count (PC), levels of total bilirubin (TBil), albumin (Alb), alanine aminotransferase (ALT), aspartate aminotransferase (AST), and prothrombin time.
Imaging Examinations
Patients underwent routine ultrasound (US) and computed tomography (CT) imaging. The US examination was performed with the patient positioned in the supine position after fasting for 4 hours or more prior to the imaging. All the patients underwent US of the abdomen to determine the liver size and echotexture, assess the grade of ascites, measure the length and thickness of the spleen (Figure 1A), and calculate the SZ (mm2), which was determined by multiplying half the spleen length by its thickness.15 The spleen volume in all enrolled patients was measured on images obtained using 64-slice spiral CT (Figure 1B and C). An experienced radiologist performed all the US and CT examinations.
 |
Figure 1 Ultrasound and CT images of the spleen. Ultrasound of spleen and measuring method of spleen length (red arrow) and thickness (yellow arrow) (A). The spleen contours are manually outlined on the CT (B) and 3-D spleen image (C). |
Endoscopy
All patients underwent upper GI endoscopy to assess the severity of EV (graded as absent, mild, moderate, or severe) (Figure 2). The endoscopic grading of EV is determined using the guidelines “The General rules for recording endoscopic findings of esophageal varices”, which were published by the Japanese Research Society for Portal Hypertension.16 An experienced endoscopist who was blinded to all other information about the patients performed the upper GI endoscopies for all the patients. The primary end point was the determination of PSR, PSVR, and SZ, which were calculated as follows:
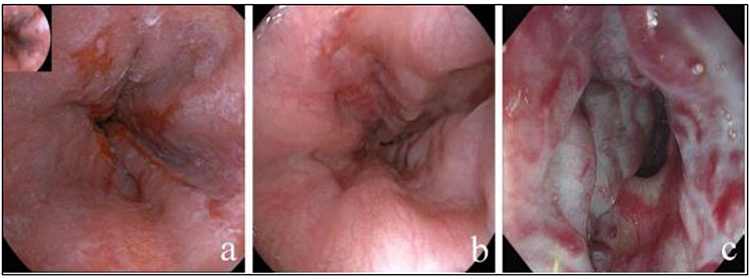 |
Figure 2 Endoscopic performance for the degree of EV. Mild EV (a). Moderate EV (b). Severe EV (c). |
PSR = PC (109/L) / spleen length (mm).
PSVR = PC (10 9/L) / spleen volume (cm3).
SZ = ½ × spleen length (mm) × spleen thickness (mm).
Statistical Analysis
Data were entered into the Statistical Package for the Social Sciences software (SPSS version 23.1; IBM Corporation, Armonk, NY, USA), which was then used to review, double check, manage, and analyze the data using inbuilt range checks with automatic error prompts. We described continuous variables with a normal distribution using the mean ± standard deviation (SD), and non-normally distributed variables were represented using the median (quartile). Categorical variables were expressed as frequencies and percentages. We used Student’s t-test for normally distributed data and the Mann–Whitney U-test for non-normally distributed data. We compared quantitative variables using the independent-sample t-test and categorical data using a chi-square (χ2) test. We used Fisher’s exact test when the expected frequency was < 5.
We plotted receiver-operating characteristic (ROC) curves using the sensitivity as the ordinate and 1-specificity as the abscissa. We calculated the area under the receiver operating characteristic (ROC) curve (AUC) and determined the best cutoff value based on the Youden index. We assessed the diagnostic performance of noninvasive markers using the sensitivity, specificity, positive predictive value (PPV), negative predictive value (NPV), positive likelihood ratio (LR+), and negative likelihood ratio (LR–). We constructed overall model quality charts and set the threshold at 0.5. Those with values exceeding 0.5 were relatively better markers, while a value of less than 0.5 indicated that the parameter was no better than a random prediction. We considered a P value of < 0.05 to be statistically significant.
Results
We included 82 patients with LC in this study. The baseline characteristics showed that there were 65 men (79.3%) and 17 women (20.7%), with an average age of 52.65 ± 10.84 years. The most common etiology was hepatitis B virus (HBV) infection in 36 patients (43.9%), followed by alcohol consumption in 26 patients (31.7%), and other etiologies in 20 patients (24.4%). The median (quartile) course of the disease was 11.5 (1.0–36.0) months. Among the 82 patients with LC, only one patient had hepatic encephalopathy. Nine of the patients who did not have EV did not have any gastric varices (GV). Two of the seven patients who had mild EV had GV. GV was present in 4 of the 17 patients with moderate EV. However, GV were present in 36 of the 49 patients with severe EV (Table 1).
 |
Table 1 Baseline Characteristics of the Study Population (82 Cirrhotic Patients) |
The PSVR and PSR decreased with increasing severity of EV, and the SZ increased with increasing EV grade. There were significant differences among the median (quartile) PSVR, PSR, and SZ in their ability to detect severe and moderate/severe EV (P < 0.05) (Table 2). However, there were no differences among the median (quartile) PSVR, PSR, and SZ in their ability to detect the presence of EV (P > 0.05) (Table 2).
 |
Table 2 Baseline Characteristics of PSVR, PSR, SZ to Detect the Severe, Moderate/Severe and Present EV |
PSR, PSVR, SZ, and their combinations performed better than random chance in predicting severe and moderate/severe EV. In particular, the combined parameters had exceptionally good predictive performance. The AUCs (95% confidence intervals, CI) of all variables were statistically significant (Table 3). Results of the pairwise comparisons revealed significant differences in the AUCs (95% CI) among all parameters of SZ, PSR + PSVR, PSR + SZ, PSVR + PSR + SZ, and PSVR + SZ compared with PSR and PSVR (P < 0.05) (Table 3). Pairwise comparisons revealed that there were no significant differences in the AUCs among SZ, PSR + PSVR, PSR + SZ, PSR + PSVR + SZ, and PSVR + SZ (P > 0.05) (Table 3). Comparing the AUCs of PSR and PSVR, the difference was statistically significant for the prediction of severe EV (P < 0.05) but not for the prediction of moderate/severe EV (P > 0.05). PSR + PSVR had the largest AUC among all the variables evaluated for predicting severe and moderate/severe EV, with values of 0.735 (95% CI: 0.626–0.826) and 0.765 (95% CI: 0.659–0.852), respectively. The best cutoff values and sensitivity (%), specificity (%), PPV (%), NPV (%), LR+, and LR-, were 0.744, 42.86, 96.97, 95.5, 53.3, 14.14, 0.59, and 0.869, 56.06, 93.75, 97.4, 34.1, 8.97, 0.47, respectively (Table 3, Figures 3 and 4).
 |
Table 3 Performance of PSR, PSVR, SZ, and Their Combination in the Prediction of the Severe, Moderate/Severe and Present EV |
 |
Figure 3 ROC of non-invasive predictors for the prediction of severe EV. PSR (a); PSVR (b); SZ (c); PSVR+PSR (d); PSR+SZ (e); PSVR+PSR+SZ (f); PSVR+SZ (g). |
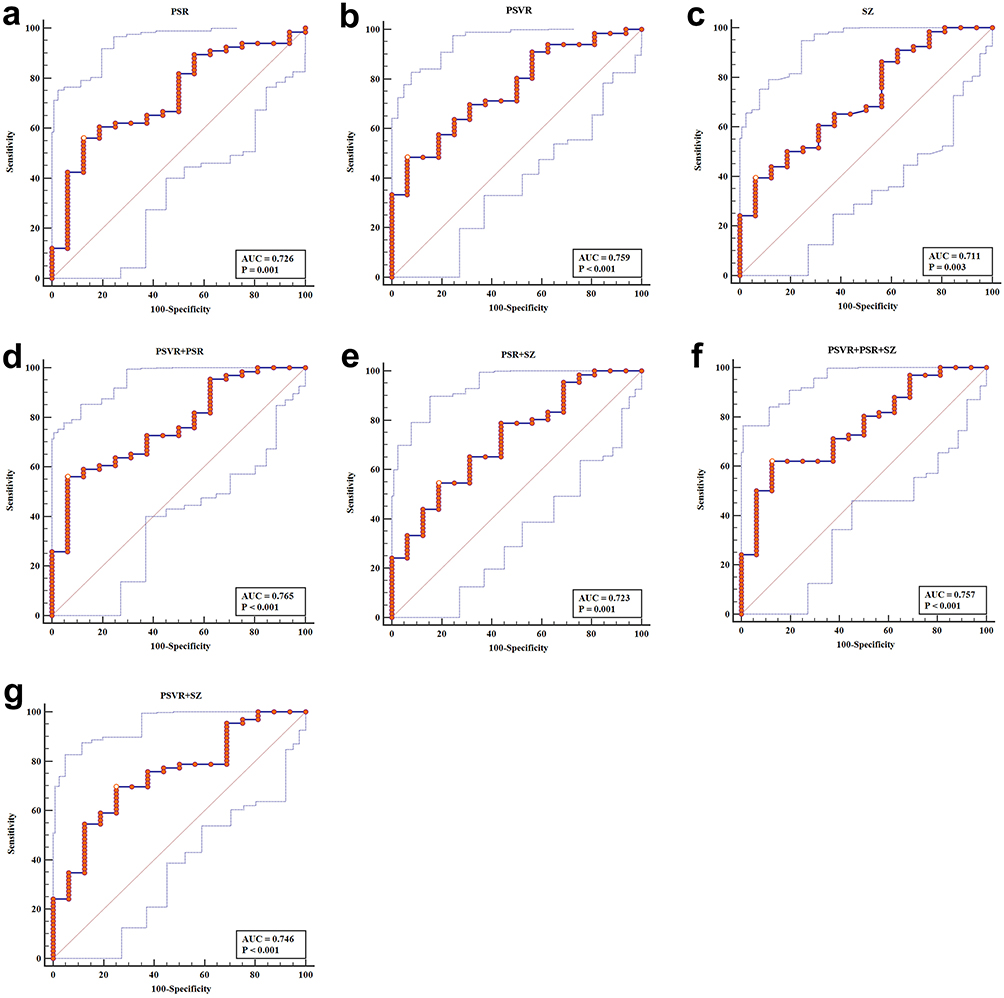 |
Figure 4 ROC of non-invasive predictors for the prediction of moderate/severe EV. PSR (a); PSVR (b); SZ (c); PSVR+PSR (d); PSR+SZ (e); PSVR+PSR+SZ (f); PSVR+SZ (g). |
Three variables (PSR, PSVR, and PSR + PSVR) showed significant differences in the AUCs (95% CI) for predicting the presence of EV. The combination of PSR+PSVR was more effective in predicting EV than individual variables. Pairwise comparisons showed no significant difference between the AUC for the PSR and PSVR (P > 0.05). The AUCs of PSR and PSVR both significantly differed from those of PSR + PSVR (P < 0.05). The PSR + PSVR combination had the maximum AUC (95% CI) value of 0.696 (95% CI: 0.584–0.792). The best cutoff values and sensitivity (%), specificity (%), PPV (%), NPV (%), and LR- were 0.896, 52.05, 100, 100, 20.5, and 0.48, respectively (Table 3 and Figure 5).
 |
Figure 5 ROC of non-invasive predictors for the prediction of present EV. PSR (a); PSVR (b); PSVR+PSR (c). |
Based on the overall model quality chart, all parameters other than PSR and PSVR were relatively better predictors of severe and moderate/severe EV (Figure 6A and B). The combination of PSR+PSVR was a relatively better predictor of the presence of EV (Figure 6C).
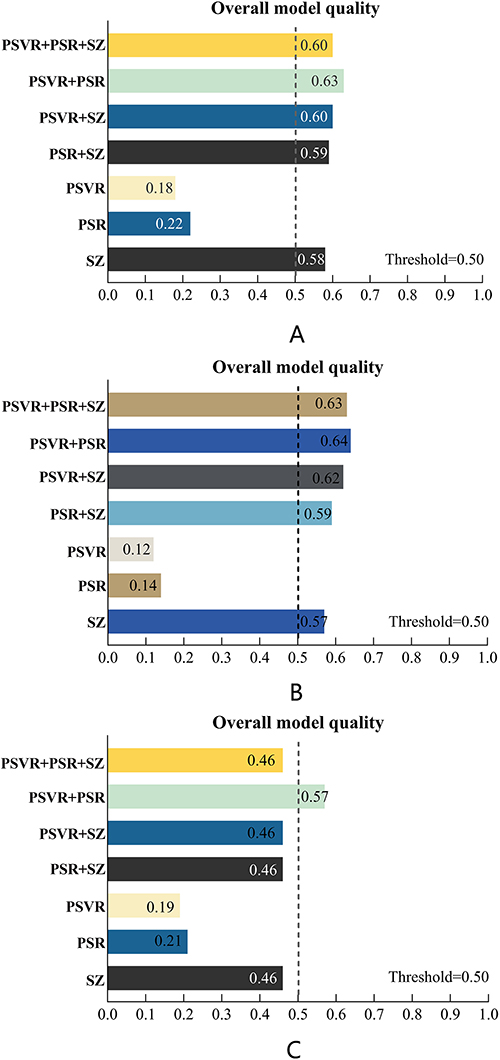 |
Figure 6 The overall model quality diagram of non-invasive predictors for the severe EV (A), moderate/severe EV (B) and present EV (C). |
Discussion
In the present study, we investigated the diagnostic accuracy of noninvasive predictors of EV, namely, PSR, PSVR, and SZ, and a combination of these. We found that a combination of markers, particularly PSR + PSVR, were good indicators of the presence of EV. Additionally, PSR + PSVR could better predict severe and moderate/severe EV in patients with liver cirrhosis.
EV can be identified in at least two-thirds of cirrhotic patients during their lifetime.17 It is crucial to detect EV at high risk of hemorrhage, and patients with such EV require prophylactic treatment. The current gold standard for identifying EV continues to be endoscopy. However, endoscopy is an invasive procedure that is expensive, time-consuming, and often uncomfortable for the patient, and repeated endoscopies are associated with adverse effects such as aspiration, perforation, and bacteremia.18 Therefore, it is essential to develop novel, reliable, and noninvasive methods such as the use of clinical, imaging, and biochemical parameters either alone or in combination to determine the presence and severity of EV and the risk of hemorrhage. These predictors include the AST-to-platelet ratio index (APRI), AST-to-ALT ratio, fibro-index, fibrosis-4 score (Fib-4), and the PSR.19–22 To date, the PSR is considered a better predictor of EV,17 although its sensitivity and specificity have been found to vary substantially across studies, ranging from 57.8% to 100% and from 40% to 89%, respectively.1,12,23–25 In our study, we found that the PSR had the best sensitivity (93.88%) for the prediction of severe EV and the best specificity (100%) for detecting the presence of EV.
Patients with advanced LC develop common complications such as thrombocytopenia and splenomegaly. These complications are directly or indirectly linked to portal hypertension. Hypersplenism due to splenomegaly caused by portal hypertension can result in reduced PC.25 Therefore, the spleen plays an important role in the prediction of cirrhosis and its complications. Most studies on patients with cirrhosis have relied on measuring the diameter of the spleen to reflect the state of EV.
To date, only a few studies have used spleen volume and spleen size to predict EV. Therefore, in this study, we evaluated the volume and size of the spleen in addition to its diameter. We used PSR, PSVR, and SZ and also introduced combinations of these variables, namely, PSR + PSVR, PSR + SZ, PSVR + SZ, and PSR + PSVR + SZ, for predicting severe, moderate/severe EV and the presence of EV in patients with LC. In this cohort of patients with LC, the PSR, PSVR, and SZ values were significantly correlated with severe and moderate/severe EV (Table 2). Moreover, these predictors can be readily obtained using routine laboratory investigations, US, and CT, and do not require specialized equipment or additional biochemical investigations.
In the current study cohort of patients with LC, we found that the PSR, PSVR, and SZ and the combinations of those variables could effectively predict severe EV, moderate/severe EV, and the overall presence of EV risk. Further, we found that a combination of these variables was more effective than individual variables at predicting the severity of EV in patients with LC. In particular, the combination of PSR + PSVR proved to be the best predictor as per our data in the current study; however, this result requires to be verified through further exploration on a larger sample size. However, we also found that the sensitivity values obtained in this research were lower than those reported in other studies. In a meta-analysis of 3063 patients, a pooled sensitivity of 92% was noted for PSR, but there was significant heterogeneity.26 In another meta-analysis comprising 1169 patients, the pooled sensitivity of PSR was 89%; however, the quality of the included studies was relatively low, and the heterogeneity was substantial.27
The study design and small sample size of this study are the limitations of this research effort. It is likely that the sampling procedure could have generated selection bias even though we only enrolled patients who fulfilled the inclusion criteria. In the subsequent stages of this investigation, we intend to use larger samples and obtain more information, including the size of the varices, red wale signs, stages of hepatic fibrosis, and hepatic venous pressure gradient, all of which may improve the prediction of the risks of EV and EVB. Additionally, we also propose to analyze subdivisions within the population based on factors such as etiological classification and the concomitant presence of GV, to minimize the likelihood of selection bias.
Conclusions
In conclusion, our preliminary results showed that PSR, PSVR, SZ, and their combinations were good predictors of the severity of EV in patients with hepatic cirrhosis. We anticipate that, in subsequent phases of this study with an increase in the sample size, PSR + PSVR will likely emerge as the best indicator of the severity of EV in patients with LC. Although these methods cannot yet replace endoscopy, patients who cannot tolerate or afford endoscopy, especially outpatients with LC who require long-term and frequent follow-ups, can benefit from these noninvasive techniques being used as a screening tool. Predicting EV using noninvasive parameters can help physicians reduce the use of endoscopy.
Abbreviations
Alb, albumin; ALT, alanine aminotransferase; APRI, aspartate aminotransferase-to-platelet ratio index; AST, aspartate aminotransferase; AUROC, area under the receiver-operating characteristic curve; CI, confidence interval; CT, computed tomography; EV, esophageal varices; EVB, esophageal variceal bleeding; Fib-4, fibrosis-4 score; GI, gastrointestinal; GV, gastric varices; LC, liver cirrhosis; LR+, positive likelihood ratio; LR-, negative likelihood ratio; NPV, negative predictive value; PC, platelet count; PPV, positive predictive value; PSR, platelet count-to-spleen diameter ratio; PSVR, platelet count-to-spleen volume ratio; ROC, receiver-operating characteristic; SD, standard deviation; SZ, spleen size; TBil, total bilirubin; US, ultrasound.
Ethics Approval and Consent to Participate
This study was reviewed and approved by the Clinical Research Ethics Committee of the First Affiliated Hospital of Guangxi Medical University (Approval Number: 2021(KY-E-244). Informed consents were obtained from all participants in accordance with the principles of the 2013 Amendment of the Declaration of Helsinki.
Acknowledgments
We are particularly grateful to all the people who have given us help on our article.
Funding
This work was funded by the Self-financed Research Program of Health and Family Planning Commission of Guangxi Zhuang Autonomous Region [Grant Number: Z 20180899]. The funder was not involved in the study design, collection, analysis, interpretation of data, the writing of this article or the decision to submit it for publication.
Disclosure
The authors declare that they have no competing interests in this work.
References
1. Colli A, Gana JC, Yap J, et al. Platelet count, spleen length, and platelet count-to-spleen length ratio for the diagnosis of oesophageal varices in people with chronic liver disease or portal vein thrombosis. Cochrane Database Syst Rev. 2017;4(4):Cd008759. doi:10.1002/14651858.CD008759.pub2
2. Shibata S, Umemura T, Yamazaki T, et al. Liver stiffness-spleen size-to-platelet ratio risk score identifies esophageal varices in Japanese patients with chronic hepatitis C. Hepatol Res. 2016;46(9):884–889. doi:10.1111/hepr.12631
3. O’Brien J, Triantos C, Burroughs AK. Management of varices in patients with cirrhosis. Nat Rev Gastroenterol Hepatol. 2013;10(7):402–412. doi:10.1038/nrgastro.2013.51
4. Garcia-Tsao G, Bosch J. Management of varices and variceal hemorrhage in cirrhosis. N Engl J Med. 2010;362(9):823–832. doi:10.1056/NEJMra0901512
5. González-Ojeda A. Platelet count/spleen diameter ratio to predict esophageal varices in Mexican patients with hepatic cirrhosis. World J Gastroenterol. 2014;20(8):2079–2084. doi:10.3748/wjg.v20.i8.2079
6. Hassan EM, Omran DA, El Beshlawey ML, Abdo M, El Askary A. Can transient elastography, Fib-4, forns index, and lok score predict esophageal varices in HCV-related cirrhotic patients? Gastroenterol Hepatol. 2014;37(2):58–65. doi:10.1016/j.gastrohep.2013.09.008
7. Cardey J, Le Gall C, Michaud L, et al. Screening of esophageal varices in children using esophageal capsule endoscopy: a multicenter prospective study. Endoscopy. 2019;51(1):10–17. doi:10.1055/a-0647-1709
8. de Franchis R, Dell’Era A. Invasive and noninvasive methods to diagnose portal hypertension and esophageal varices. Clin Liver Dis. 2014;18(2):293–302. doi:10.1016/j.cld.2013.12.002
9. Thabut D, Moreau R, Lebrec D. Noninvasive assessment of portal hypertension in patients with cirrhosis. Hepatology. 2011;53(2):683–694. doi:10.1002/hep.24129
10. Petta S, Sebastiani G, Bugianesi E, et al. Non-invasive prediction of esophageal varices by stiffness and platelet in non-alcoholic fatty liver disease cirrhosis. J Hepatol. 2018;69(4):878–885. doi:10.1016/j.jhep.2018.05.019
11. Cherian JV, Deepak N, Ponnusamy RP, Somasundaram A, Jayanthi V. Non-invasive predictors of esophageal varices. Saudi J Gastroenterol. 2011;17(1):64–68. doi:10.4103/1319-3767.74470
12. Mattos ÂZ, Schacher FC, John Neto G, Mattos AA. Screening for esophageal varices in cirrhotic patients – non-invasive methods. Ann Hepatol. 2019;18(5):673–678. doi:10.1016/j.aohep.2019.06.003
13. Moctezuma-Velazquez C, Saffioti F, Tasayco-Huaman S, et al. Non-invasive prediction of high-risk varices in patients with primary biliary cholangitis and primary sclerosing cholangitis. Am J Gastroenterol. 2019;114(3):446–452. doi:10.1038/s41395-018-0265-7
14. Berzigotti A, Seijo S, Arena U, et al. Elastography, spleen size, and platelet count identify portal hypertension in patients with compensated cirrhosis. Gastroenterology. 2013;144(1):102–111.e101. doi:10.1053/j.gastro.2012.10.001
15. Maruyama H, Kobayashi K, Kiyono S, et al. Incidence and hemodynamic feature of risky esophageal varices with lower hepatic venous pressure gradient. Int J Med Sci. 2019;16(12):1614–1620. doi:10.7150/ijms.37040
16. Tajiri T, Yoshida H, Obara K, et al. General rules for recording endoscopic findings of esophagogastric varices. Dig Endosc. 2010;22(1):1–9. doi:10.1111/j.1443-1661.2009.00929.x
17. Elalfy H, Elsherbiny W, Abdel Rahman A, et al. Diagnostic non-invasive model of large risky esophageal varices in cirrhotic hepatitis C virus patients. World J Hepatol. 2016;8(24):1028–1037. doi:10.4254/wjh.v8.i24.1028
18. Ben-Menachem T, Decker GA, Early DS, et al. Adverse events of upper GI endoscopy. Gastrointest Endosc. 2012;76(4):707–718. doi:10.1016/j.gie.2012.03.252
19. Morishita N, Hiramatsu N, Oze T, et al. Liver stiffness measurement by acoustic radiation force impulse is useful in predicting the presence of esophageal varices or high-risk esophageal varices among patients with HCV-related cirrhosis. J Gastroenterol. 2014;49(7):1175–1182. doi:10.1007/s00535-013-0877-z
20. Crisan D, Radu C, Lupsor M, et al. Two or more synchronous combination of noninvasive tests to increase accuracy of liver fibrosis assessement in chronic hepatitis C; results from a cohort of 446 patients. Hepat Mon. 2012;12(3):177–184. doi:10.5812/hepatmon.853
21. European Association for the Study of the Liver. EASL-ALEH clinical practice guidelines: non-invasive tests for evaluation of liver disease severity and prognosis. J Hepatol. 2015;63(1):237–264. doi:10.1016/j.jhep.2015.04.006
22. Hukkinen M, Kivisaari R, Lohi J, et al. Transient elastography and aspartate aminotransferase to platelet ratio predict liver injury in paediatric intestinal failure. Liver Int. 2016;36(3):361–369. doi:10.1111/liv.12887
23. Esmat S, Omarn D, Rashid L. Can we consider the right hepatic lobe size/albumin ratio a noninvasive predictor of oesophageal varices in hepatitis C virus-related liver cirrhotic Egyptian patients? Eur J Intern Med. 2012;23(3):267–272. doi:10.1016/j.ejim.2011.11.010
24. Sharma P, Kirnake V, Tyagi P, et al. Spleen stiffness in patients with cirrhosis in predicting esophageal varices. Am J Gastroenterol. 2013;108(7):1101–1107. doi:10.1038/ajg.2013.119
25. Giannini E, Botta F, Borro P, et al. Platelet count/spleen diameter ratio: proposal and validation of a non-invasive parameter to predict the presence of oesophageal varices in patients with liver cirrhosis. Gut. 2003;52(8):1200–1205. doi:10.1136/gut.52.8.1200
26. Ying L, Lin X, Xie ZL, Hu YP, Shi KQ. Performance of platelet count/spleen diameter ratio for diagnosis of esophageal varices in cirrhosis: a meta-analysis. Dig Dis Sci. 2012;57(6):1672–1681. doi:10.1007/s10620-012-2058-y
27. Chawla S, Katz A, Attar BM, et al. Platelet count/spleen diameter ratio to predict the presence of esophageal varices in patients with cirrhosis: a systematic review. Eur J Gastroenterol Hepatol. 2012;24(4):431–436. doi:10.1097/MEG.0b013e3283505015
 © 2023 The Author(s). This work is published and licensed by Dove Medical Press Limited. The full terms of this license are available at https://www.dovepress.com/terms.php and incorporate the Creative Commons Attribution - Non Commercial (unported, v3.0) License.
By accessing the work you hereby accept the Terms. Non-commercial uses of the work are permitted without any further permission from Dove Medical Press Limited, provided the work is properly attributed. For permission for commercial use of this work, please see paragraphs 4.2 and 5 of our Terms.
© 2023 The Author(s). This work is published and licensed by Dove Medical Press Limited. The full terms of this license are available at https://www.dovepress.com/terms.php and incorporate the Creative Commons Attribution - Non Commercial (unported, v3.0) License.
By accessing the work you hereby accept the Terms. Non-commercial uses of the work are permitted without any further permission from Dove Medical Press Limited, provided the work is properly attributed. For permission for commercial use of this work, please see paragraphs 4.2 and 5 of our Terms.