Back to Journals » Cancer Management and Research » Volume 13
Predicting Response to Total Neoadjuvant Treatment (TNT) in Locally Advanced Rectal Cancer Based on Multiparametric Magnetic Resonance Imaging: A Retrospective Study
Authors Ouyang G ![]() , Yang X, Deng X, Meng W, Yu Y, Wu B, Jiang D, Shu P, Wang Z, Yao J, Wang X
, Yang X, Deng X, Meng W, Yu Y, Wu B, Jiang D, Shu P, Wang Z, Yao J, Wang X
Received 17 March 2021
Accepted for publication 19 June 2021
Published 13 July 2021 Volume 2021:13 Pages 5657—5669
DOI https://doi.org/10.2147/CMAR.S311501
Checked for plagiarism Yes
Review by Single anonymous peer review
Peer reviewer comments 2
Editor who approved publication: Dr Kenan Onel
Ganlu Ouyang,1 Xibiao Yang,2 Xiangbing Deng,3 Wenjian Meng,3 Yongyang Yu,3 Bing Wu,2 Dan Jiang,4 Pei Shu,1 Ziqiang Wang,3 Jin Yao,2 Xin Wang1
1Department of Radiation Oncology/Abdominal Oncology, Cancer Center, West China Hospital, Sichuan University, Chengdu, 610041, People’s Republic of China; 2Department of Radiology, West China Hospital, Sichuan University, Chengdu, 610041, People’s Republic of China; 3Department of Gastrointestinal Surgery, West China Hospital, Sichuan University, Chengdu, 610041, People’s Republic of China; 4Department of Pathology, West China Hospital, Sichuan University, Chengdu, 610041, People’s Republic of China
Correspondence: Xin Wang
Department of Radiation Oncology/Abdominal Oncology, Cancer Center, West China Hospital, Sichuan University, No. 37 of Wainan Guoxue Lane, Wuhou District, Chengdu, 610041, People’s Republic of China
Tel +86 18980602291
Email [email protected]
Purpose: To investigate the potential value of magnetic resonance imaging (MRI) in predicting response relevance to total neoadjuvant treatment (TNT) in locally advanced rectal cancer.
Methods: We analyzed MRI of 71 patients underwent TNT from 2015 to 2017 retrospectively. We categorized the response of TNT as CR (complete response) vs non-CR, and high vs moderate vs low sensitivity. Logistic regression analysis was used to identify the best predictors of response. Diagnostic performance was assessed using receiver operating characteristic curve analysis.
Results: Post-ICT (induction chemotherapy) ∆TL (tumor length), post-CRT (concurrent chemoradiotherapy) ∆LNN (the numbers of lymph node metastases), post-CCT (consolidation chemotherapy) ∆SDWI (maximum cross-sectional area of tumor on diffusion-weighted imaging), post-CCT ADCT (the mean apparent diffusion coefficient values of tumor) and post-CCT ∆LNV (volume of lymph node) were the best CR predictors. Post-ICT ∆TL, post-CRT EMVI (extramural vascular invasion) and post-CCT ∆ST2 (S on T2-weight) were the best significant factors for high sensitivity.
Conclusion: Post-ICT ∆TL may be an early predictor of CR and high sensitivity to TNT. Dynamic analysis based on MRI between baseline and post-CCT could provide the most valuable prediction of CR. The grouping modality of CR vs non-CR may be more suitable for treatment response prediction than high vs moderate vs low sensitivity.
Keywords: rectal cancer, total neoadjuvant treatment, MRI, response, TRG
Introduction
The standard treatment for patients with locally advanced rectal cancer (LARC) is neoadjuvant concurrent chemoradiotherapy, followed by surgical resection with total mesorectal excision (TME).1 In fact, these patients have significant heterogeneity. Besides, the standard neoadjuvant therapy provided no better the overall survival (OS) and the disease-free survival (DFS) rates compared with surgery and adjuvant chemoradiotherapy.2 It is inappropriate to adopt the same therapeutic modality for all LARC patients. Recently, the National Comprehensive Cancer Network (NCCN) recommended total neoadjuvant treatment (TNT), which is an extensive and optimized therapeutic modality, as an acceptable treatment strategy for LARC. In the Phase II clinical trial of TNT,3 patients received induction chemotherapy (ICT) followed by neoadjuvant concurrent chemoradiotherapy (CRT). After that, consolidation chemotherapy (CCT) were delivered. Some studies2–5 demonstrated that TNT might improve the pathological complete response (pCR) rate and clinical complete response (cCR) rate ranging from 14% to 36% in the patients with LARC. However, there are still some patients who have poor sensitivity to neoadjuvant chemoradiotherapy.6,7 It is of great significance to predict the response before or during treatment since the process of TNT is time-consuming. With the response predicted results, we would provide more precise and personalized treatment for patients. If the patients have good response to TNT and achieve cCR, Wait & See strategy might be implemented. While those have not good response, we would implement other precision treatment programs that are more suitable for patients. We could establish the different treatment strategies according to tumor response.
Magnetic resonance imaging (MRI) is an important method for accurate staging and evaluation of efficacy routinely. It provides parameters to reflect the characteristics of tumors. Some studies reported that MRI parameters such as T2 tumor volume change, relative T2 signal intensity, standardized index of shape, diffusion-weighted imaging (DWI), apparent diffusion coefficient (ADC) values, tumor volume, decreased lymph node sizes and extramural vascular invasion (EMVI) may be related to predicting response.8–12 However, the conclusions of various studies were inconsistent. There is still a lack of optimal MRI prediction parameters. Additionally, TNT is a new optimization strategy for LARC. There are few relevant studies that exploring the correlation between MRI parameters and response of TNT so far. Therefore, we need to make further exploration in order to provide new evidence for precision treatment and accurate prediction of the response to neoadjuvant CRT, especially to TNT. The objective of this study was to investigate the potential value of MRI in predicting response relevance to TNT in LARC.
Materials and Methods
Patient Selection
This is a retrospective study. And the study was approved by the Ethics Committee on Biomedical Research, West China Hospital of Sichuan University (2020–903).
Patients with LARC who received TNT at our institution were retrospectively analyzed, including the patients who were enrolled in the phase II trial of TNT (ChiCTR-OIN-17012284).3 The inclusive criteria were as follows. 1) Patients had histopathologically confirmed rectal cancer and diagnosed with stage II–III rectal cancer on MRI. 2) Patients must have completed TNT. 3) MRI scans were performed before TNT (baseline), after the end of ICT (post-ICT), CRT (post-CRT) and after CCT (post-CCT), respectively. Patients must have at least two MRI images including MRIbaseline.
TNT Strategy
Chemotherapy
One to three cycles of induction CAPOX were followed by pelvic intensity-modulated radiotherapy (IMRT)/volumetric modulated arc therapy (VMAT) and two cycles of concurrent CAPOX. Then, three cycles of consolidation CAPOX were delivered after radiotherapy. Induction and consolidation CAPOX consisted of oxaliplatin 130 mg/m2 on day 1, capecitabine 1000 mg/m2 twice a day on day 1–14, every 3 weeks. Concurrent CAPOX consisted of oxaliplatin 130 mg/m2 on day 1 and 22, capecitabine 825 mg/m2 twice a day, 5 days per week for 25–28 days. Patients who received neoadjuvant pelvic radiotherapy and at least 4 cycles of neoadjuvant chemotherapy could be included in this study. No adjuvant treatment was allowed after surgery in this study.
Radiotherapy
In order to decrease the geometric uncertainty of the clinical target volume (CTV), patients were instructed to empty their bladder and then drink 500 mL of water 1 hour before CT simulation and each treatment, and were also instructed to move their bowels and to have an empty rectum every day. All patients were treated in the supine or prone position and immobilized with abdominal body thermoplastic masks. CT simulation was performed using a helical CT scan at 3 mm slice thickness, with intravenous contrast. Scanning range: The upper edge including the L2 vertebra lower edge, the lower edge is the middle femoral lower edge. The gross tumor volume (GTV) was including primary tumor and positive lymph nodes. Primary tumor, mesorectal lymph nodes, presacral lymph nodes, internal iliac lymph nodes and obturator lymph nodes were included in CTV. The planning target volume (PTV) was created by extending the CTV using a margin of 0.7–1 cm. Radiation techniques used for the patients were IMRT or VMAT. Radiation dose to planning target volume (PTV) is 50Gy/25f or 50.4Gy/28f.
Surgery
Surgery was performed 2–3 weeks after consolidation chemotherapy. Surgery should be done according to the TME principles. All patients were recommended to receive TME. If patients reached cCR and rejected surgery, watch and see approach would be conducted.
MR Technique
All MR imaging were performed at a 3T Magnetom Skyra MR scanner (Siemens Healthcare). A standard T2-weighted imaging (T2WI) was required by turbo spin-echo in sagittal, oblique coronal (parallel to the rectum) planes, and oblique axial (perpendicular to the rectum)13,(Supplementary Figure 1). The oblique axial acquisition was performed using the following parameters: Repetition time (TR)/echo time (TE), 6890/100; Field of view (FOV), 236×260 mm; matrix, 313 × 384; and slice thickness= 3 mm. We used the multishot echo planar imaging (EPI) performed with a reduced TE and encoding time for DWI (Supplementary Figure 2). TR/TE, 5500/61; slice thickness= 4.5 mm; slice gap= 0.5 mm; FOV, 216×216 mm; matrix, 128 × 128; b values of 0, 600, and 1000 s/mm2; echo spacing= 0.4 ms; number of readout segments= 3. The ADC map was automatically generated during image reconstruction (DWI: b values of 0 and 1000 s/mm2) (Supplementary Figure 3).
Data Collection
We reviewed and collected MRI parameters, including distance of tumor (DIS), tumor length (TL), mesorectal fascia (MRF), EMVI, anal canal invasion (A), tumor stage (T stage), the mean apparent diffusion coefficient values of tumor (ADCT), T2 adjusted values of tumor (T2a), maximum cross-sectional area of tumor on diffusion-weighted imaging (SDWI) and T2-weight (ST2), tumor thickness on DWI (TTDWI) and T2-weight (TTT2), tumor volume on T2-weight (TV), the numbers of lymph node metastases (LNN), the longest diameter of the biggest lymph node (LND), the mean ADC values of the biggest lymph node (ADCLN), and volume of all lymph nodes on T2-weight (LNV), which were measured together by two experienced readers (two radiologists experience over ten years). If two readers have disagreement with each other, the discussion method will be adopted, and we recorded their consensus conclusion of the results. And the changes in MRI parameters relative to baseline were calculated including percentage change in some parameters between baseline and post-ICT/CRT/CCT MRI (∆DIS, ∆TL, ∆ADCT, ∆T2a, ∆SDWI, ∆ST2, ∆TTDWI, ∆TTT2, ∆TV, ∆LNN, ∆LND, ∆ADCLN and ∆LNV), the downstage in other MRI parameters between baseline and post-ICT/CRT/CCT MRI (DMRF, DEMVI, DA and DT stage) (Supplementary File). The DIS that was defined as the distance from the anal verge to the inferior border of the tumor measured on sagittal T2WI. The TL was the distance from the upper edge of the tumor to the lower edge of the tumor on sagittal T2WI. Maximum cross-sectional area of tumor was considered as the product of largest diameters and its perpendicular diameters. EMVI was scored according to Smith et al14 The EMVI status was determined by the pattern of tumor margin, the size of vessel, the location of vessel relative to the tumor, and caliber of vessel. EMVI 0–2 were defined as negative, and EMVI 3 and 4 were defined as positive. We referred to Chand et al’s suggestion to differentiate the post-CRT and post-CCT EMVI and fibrous bands.15 A positive lymph node was defined according to irregular borders, heterogeneous signal intensity, and round shape by Horvat et al.13 LNN was considered as the longest diameter of the biggest lymph node on oblique axial MRI scan. A maximum cross-sectional slice of tumor/lymph node was chosen as ROI which entire range delineated was used to measure the ADC value three times, and calculate the mean ADC value.16 When tumor was not observed after treatment, we will set the tumor and lymph node parameters (such as number of lymph node, length and diameter) to zero. And the ROIs were drawn on the slices of rectal wall at the same site of the previous tumor on T2WI and ADC maps.17 TV and LNV were delineated on every axial slice of the CT scans, then the volume was automatically calculated by the radiotherapy planning system (pinnacle software). One radiation physician (experience 5 years) outlined ROIs and another radiation physician (experience over ten years) reviewed them. T2a = T2 values of tumor/T2 values of gluteus maximus muscle.
Response Evaluation
We categorized the response of TNT as complete response (CR) group vs non-CR group, and high sensitive group vs moderate sensitive group vs low sensitive group.
The pCR was defined as ypT0N0. The pCR and patients sustained cCR for 12 months or longer while under non-operative surveillance represented CR,4 whereas the rest were non-CR.
The high sensitive group (H group) included tumor regression grade (TRG) 0 and TRG 1. The moderate sensitive group (M group) defined as ether TRG 2 or patients with TRG 3 and tumor volume of MRI decreased by at least 20% from baseline.11,18 The low sensitive group (L group) were considered as TRG 3 and tumor volume of MRI did not decrease by 20% from baseline. The system used for TRG as recommended by the AJCC cancer Staging Manual, 8th Edition and the CAP Guidelines is that as modified from Ryan et al19 It defined TRG 0, 1, 2, 3 as no remaining viable cancer cells, only small clusters or single cancer cells remaining, residual cancer remaining but with predominant fibrosis, minimal or no tumor kill in the primary lesion but regardless of lymph node status.
Statistical Analysis
Continuous variables were expressed as mean ± standard deviation and median (range). Categorical variables were expressed as a number (percentage). DIS, TL, ADCT, T2a, SDWI, ST2, TTDWI, TTT2, LNN, LND, TV, LNV, ADCLN and the percentage changes in MRI parameters between baseline and post-ICT/CRT/CCT MRI were compared between independent response subgroups using Wilcoxon’s rank sum test. MRF, EMVI, A, T stage, and the downstage in other MRI parameters between baseline and post-ICT/CRT /CCT MRI between independent response groups were compared using Fisher’s Exact test. Logistic regression analysis was used to identify the best predictors of response. Diagnostic performance of the best predictors were assessed using receiver-operating characteristic (ROC) curve analysis, and the sensitivity, specificity, the optimal cut-off, negative predictive value (NPV), and positive predictive value (PPV) was calculated. The significance level was P < 0.05. Statistical analysis was conducted using PASW Statistics (version 25; SPSS, IBM Corp).
Results
Patients
Patients with LARC who underwent TNT before operation in our hospital from 2015 to 2017 were included. Table 1 and Supplementary Table 1–3 demonstrated characteristics of patients. The search yielded 71 patients who had baseline MR images. Median cycles of ICT, CRT and CCT were 2 cycles (range 0–5 cycles), 1 cycle (range 1–3 cycles) and 3 cycles (range 0–5 cycles), respectively. The majority of these patients had MRICRT and MRICCT (55 (77.46%) and 49 (69.02%), respectively), 15 (21.13%) had MRIICT. There were 24 patients (33.80%) who achieved CR. In those CR patients, 23 (32.39%) underwent surgery. Six (8.45%) patients without cCR refused surgery after TNT. Only one person (1.41%) sustained CR for 12 months and received Wait & See. Among the 71 patients in the TNT cohort, the pathological TRG was TRG 0 in 24 (37.50%) patients, TRG 1 in 14 (21.88%), TRG 2 in 16 (25.00%) and TRG 3 in 10 (15.63%). According to TRG, 38 (59.38%) patients were classified as H group, 26 (40.63%) were classified as the M group, and no patients was L group. Figure 1 shows the Distribution of CR vs non-CR and H group vs M group in the MRIICT, MRICRT and MRICCT. There was a patient who was TRG 0 but ypN1. Therefore, we believe that he belongs to the high sensitive group and non-pCR group.
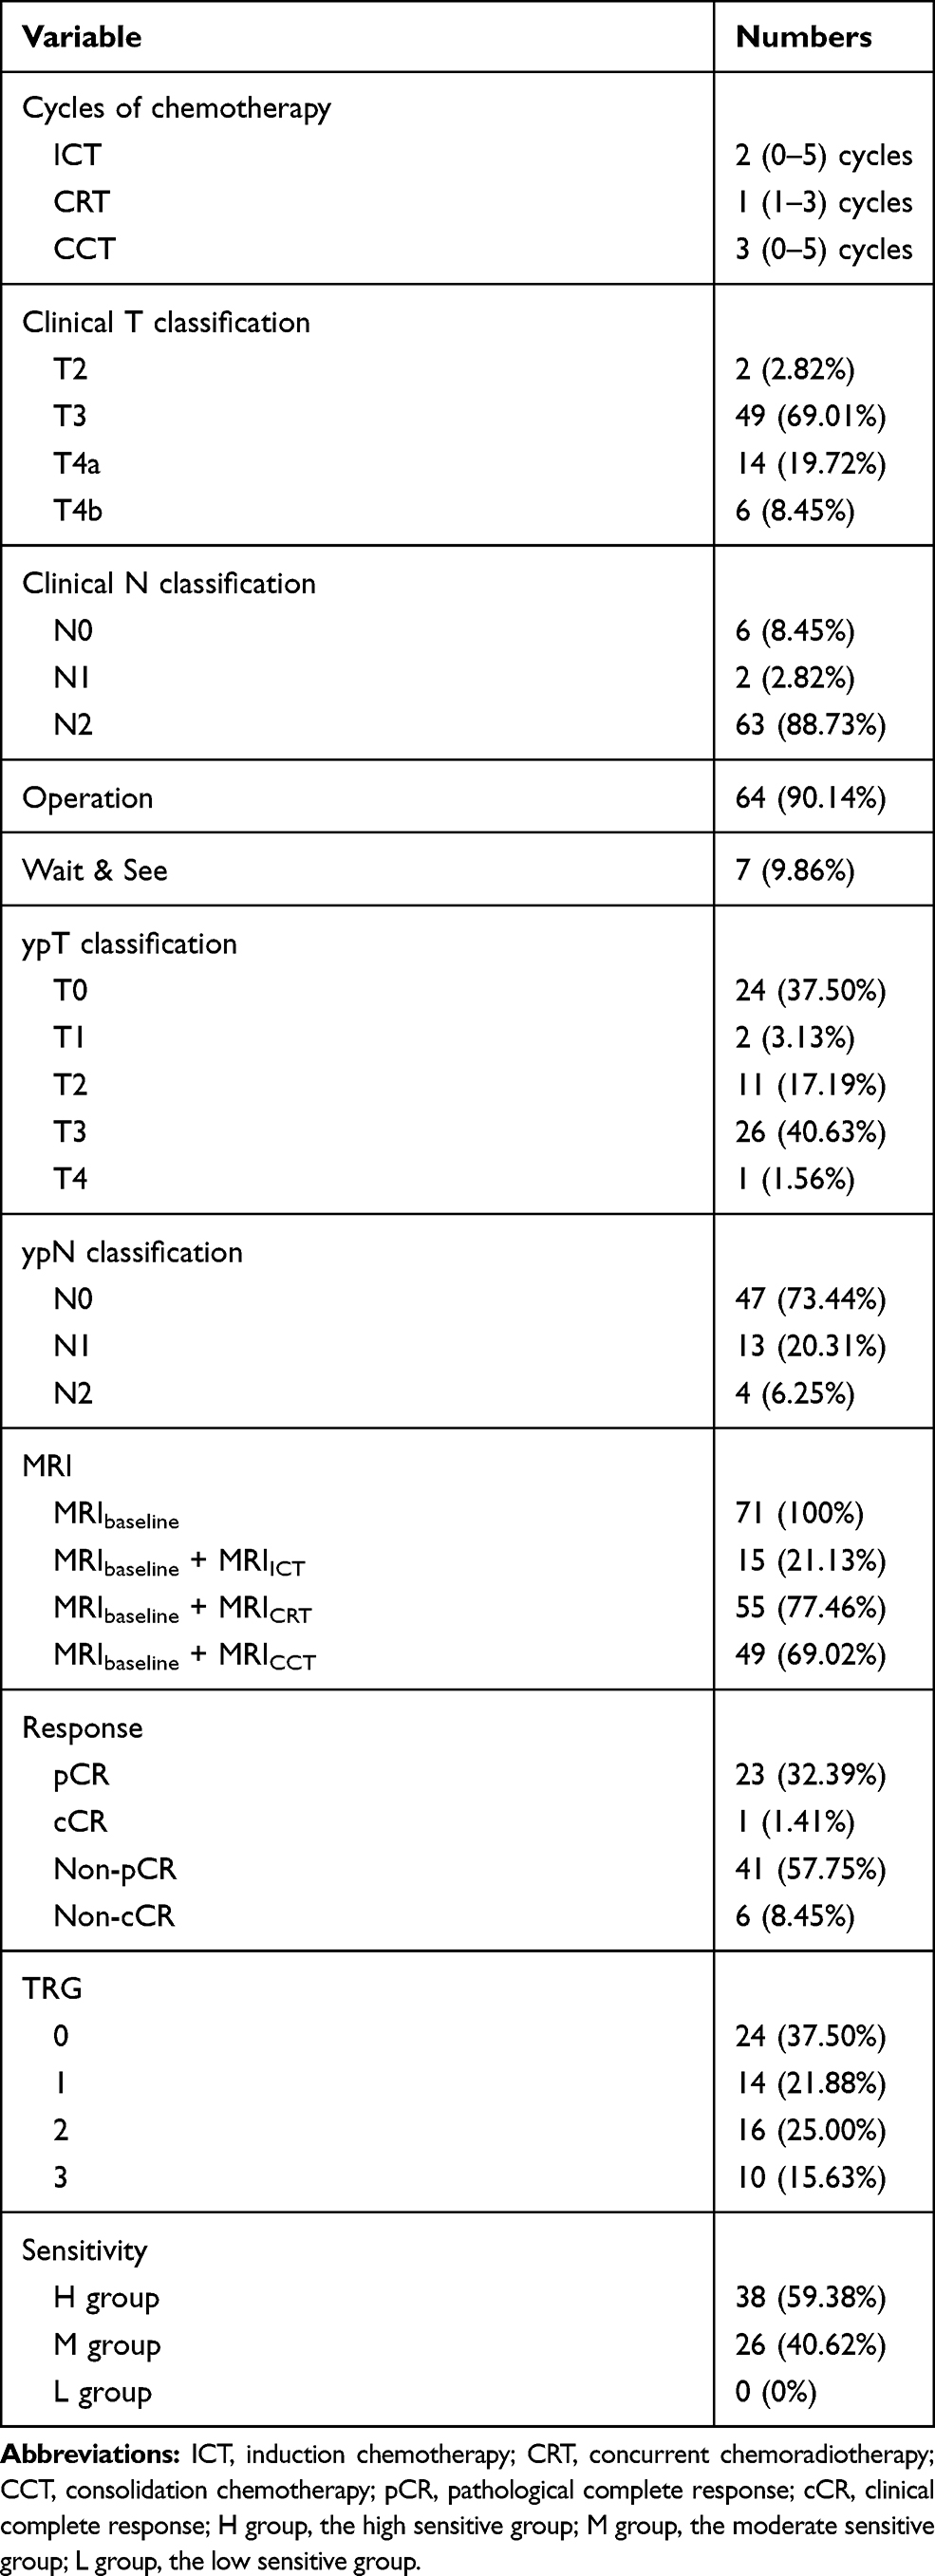 |
Table 1 Patient Characteristics |
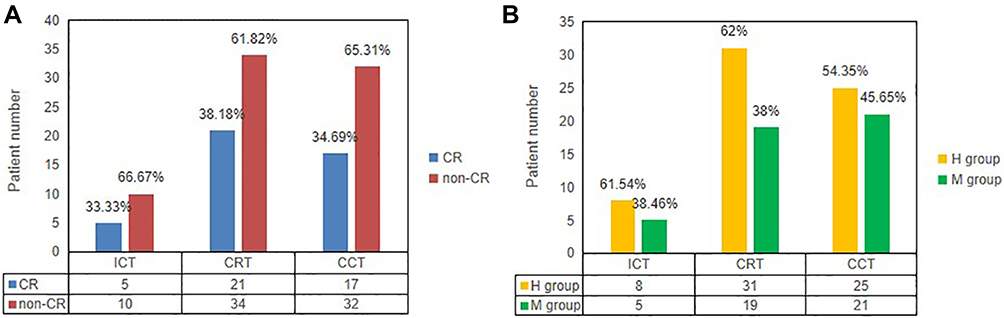 |
Figure 1 (A) Distribution of CR vs non-CR in the MRIICT, MRICRT and MRICCT. (B) Distribution of the high sensitive group (H group) vs the moderate sensitive group (M group) in the MRIICT, MRICRT and MRICCT. |
Correlation Between MRI Parameters and Response to TNT
No significant correlation was noted between response and baseline MRI parameters. Correlations between CR and post-ICT ∆TL (p = 0.008), post-ICT ∆LND (p = 0.019) and post-ICT ∆LNV (p = 0.019) were found. Post-ICT ∆TL was also correlated with high sensitivity to TNT with the p value 0.01 (Table 2).
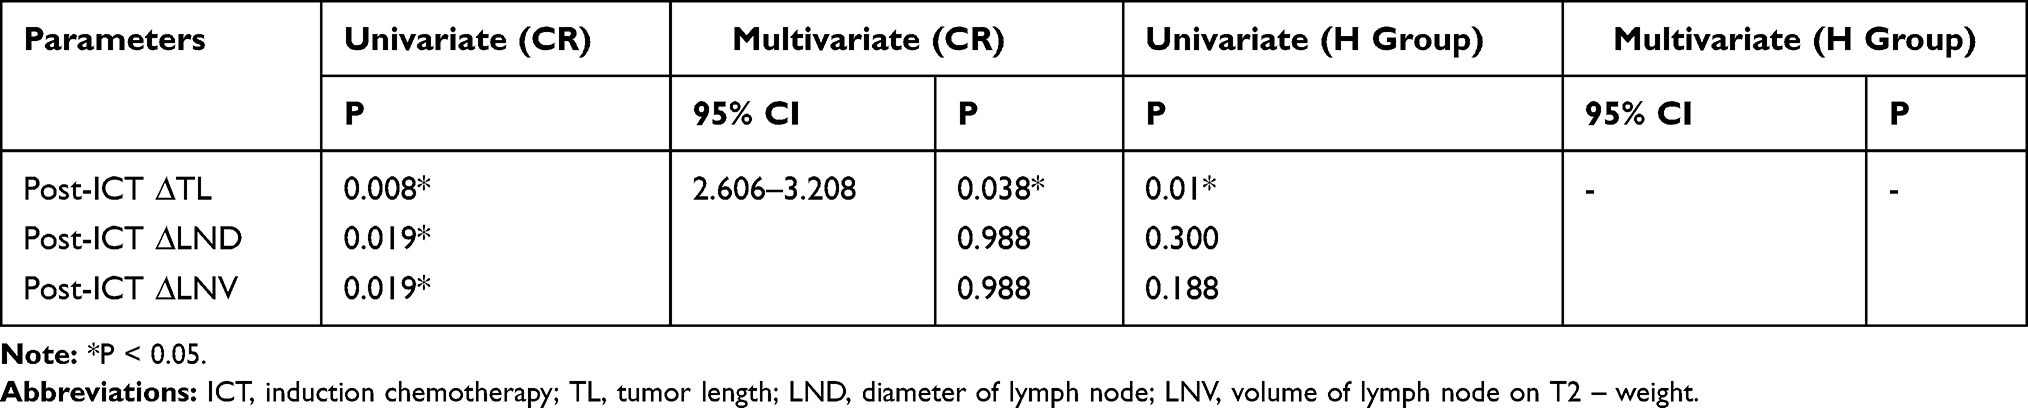 |
Table 2 Logistic Regression Analysis of Post-ICT Predictive Factors of CR and High Sensitivity to TNT |
There were significant correlations between CR and post-CRT EMVI (p = 0.002), post-CRT LNN (p = 0.004), post-CRT LND (p = 0.021), post-CRT ∆LNN (p = 0.002) and post-CRT ∆LND (p = 0.021). Only post-CRT EMVI was correlated with high sensitivity of LARC to TNT (p = 0.013) (Table 3).
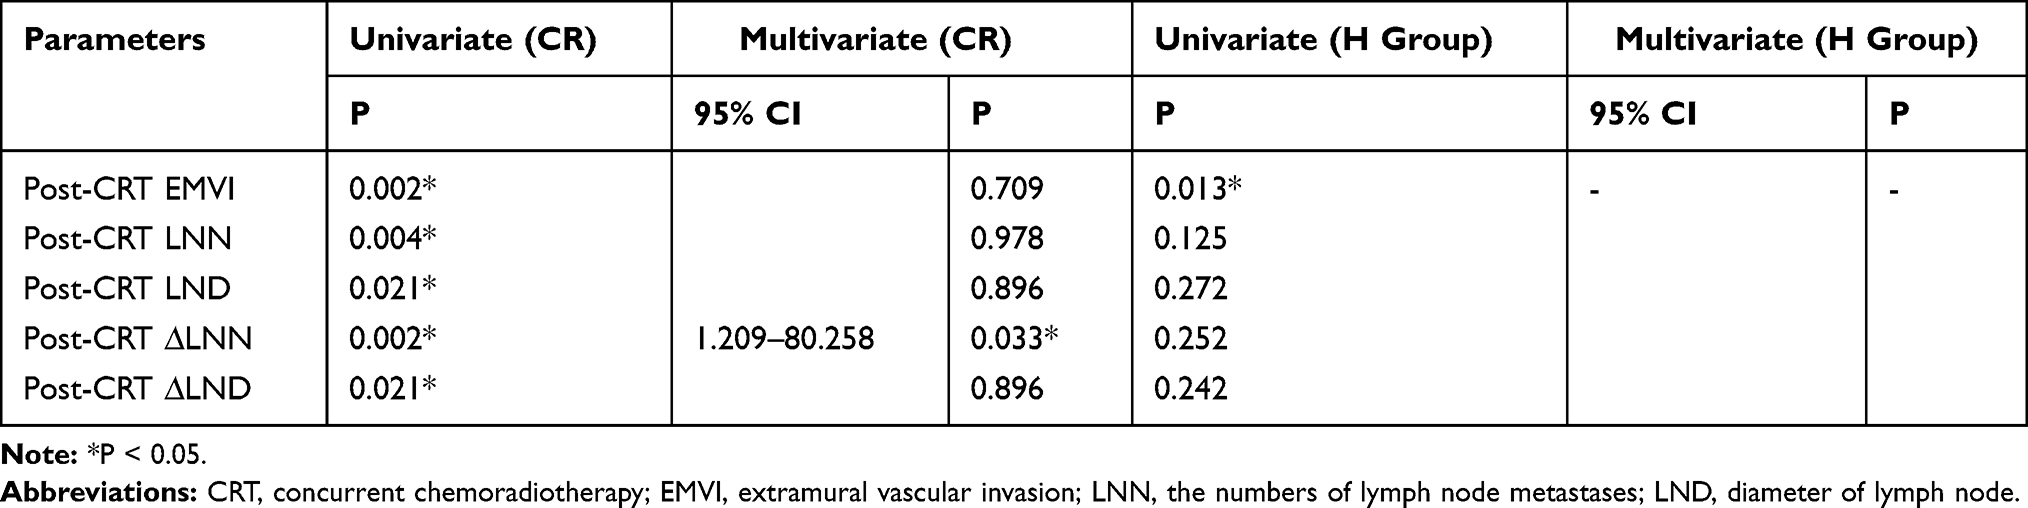 |
Table 3 Logistic Regression Analysis of Post-CRT Predictive Factors of CR and High Sensitivity to TNT |
The following parameters of post-CCT MRI which were significant correlations between CR were evaluated: post-CCT ADCT (p = 0.008), post-CCT TTDWI (p = 0.031), post-CCT LNV (p = 0.003), post-CCT LNN (p = 0.016), post-CCT ∆SDWI (p = 0.001), post-CCT ∆ST2 (p = 0.006), post-CCT ∆TTDWI (p = 0.029), post-CCT ∆LNN (p = 0.008), post-CCT ∆LND (p = 0.046) and post-CCT ∆LNV (p = 0.002). There were many post-CCT MRI parameters had significant correlations between high sensitivity to TNT: post-CCT TL (p = 0.005), post-CCT SDWI (p = 0.036), post-CCT ST2 (p = 0.008), post-CCT TTDWI (p = 0.037), post-CCT TTT2 (p = 0.009), post-CCT LNV (p = 0.044), post-CCT ∆TL (p = 0.004), post-CCT ∆SDWI (p = 0.009), post-CCT ∆ST2 (p = 0.001), post-CCT ∆TTT2 (p = 0.009), post-CCT ∆TV (p = 0.007), post-CCT ∆LNN (p = 0.016), post-CCT ∆LNV (p = 0.019) and post-CCT DT stage (p = 0.022) (Table 4).
 |
Table 4 Logistic Regression Analysis of Post-CCT Predictive Factors of CR and High Sensitivity to TNT |
Based on the results of above analysis, ultimately we selected using the method of binary logistic regression to build the response early predicting models. In the binary logistic regression analysis, post-ICT ∆TL (95% CI: 2.606–3.208, p = 0.038), post-CRT ∆LNN (95% CI: 1.209–80.258, p = 0.033), post-CCT ∆SDWI (95% CI: 6.374–40.883, p = 0.01), post-CCT ADCT (95% CI: 27.517–52.047, p = 0.003) and post-CCT ∆LNV (95% CI: 35.108–61.120, p = 0.017) were found to be the best predictors for CR. Moreover, post-ICT ∆TL (95% CI: 2.720–3.121, p = 0.001), post-CRT EMVI (95% CI: 1.55–52.266, p = 0.013) and post-CCT ∆ST2 (95% CI: 0.004–0.392, p = 0.006) were the best significant factors for high sensitivity to TNT (Tables 2–4). Figure 5 showed post-ICT ∆TL of CR vs non – CR and H group vs M group for each patient.
Prediction Performances of MRI Parameters for Response
Based on logistic regression model, ROC curve analysis was used to explore the role of the best predictors. Figure 2 presents ROC curve results for MRI parameters differentiating CR from non-CR. Besides, ROC curve results are reported that MRI parameters predicting H group in Figure 3. Corresponding data are provided in Table 5. In terms of individual parameter prediction response, post-ICD ∆TL was selected as the best predictor of CR by logistic regression model (AUC 0.92, specificity 80%, sensitivity 100%, NPV 100%, PPV 71.4%, ACC 86.7%, p = 0.01). ROC analysis also showed that post-ICT ∆TL had a moderate predicting performance in identifying H group (AUC 0.84, specificity 100%, sensitivity 75%, NPV 70.4%, PPV 96%, ACC 82.7%, p = 0.001). In particular, the combination of post-CCT ∆SDWI, post-CCT LNV and post-CCT ADCT had best predicting performance of CR, with AUC 0.94, a sensitivity of 94.1%, and a specificity of 90.6% (Figure 4).
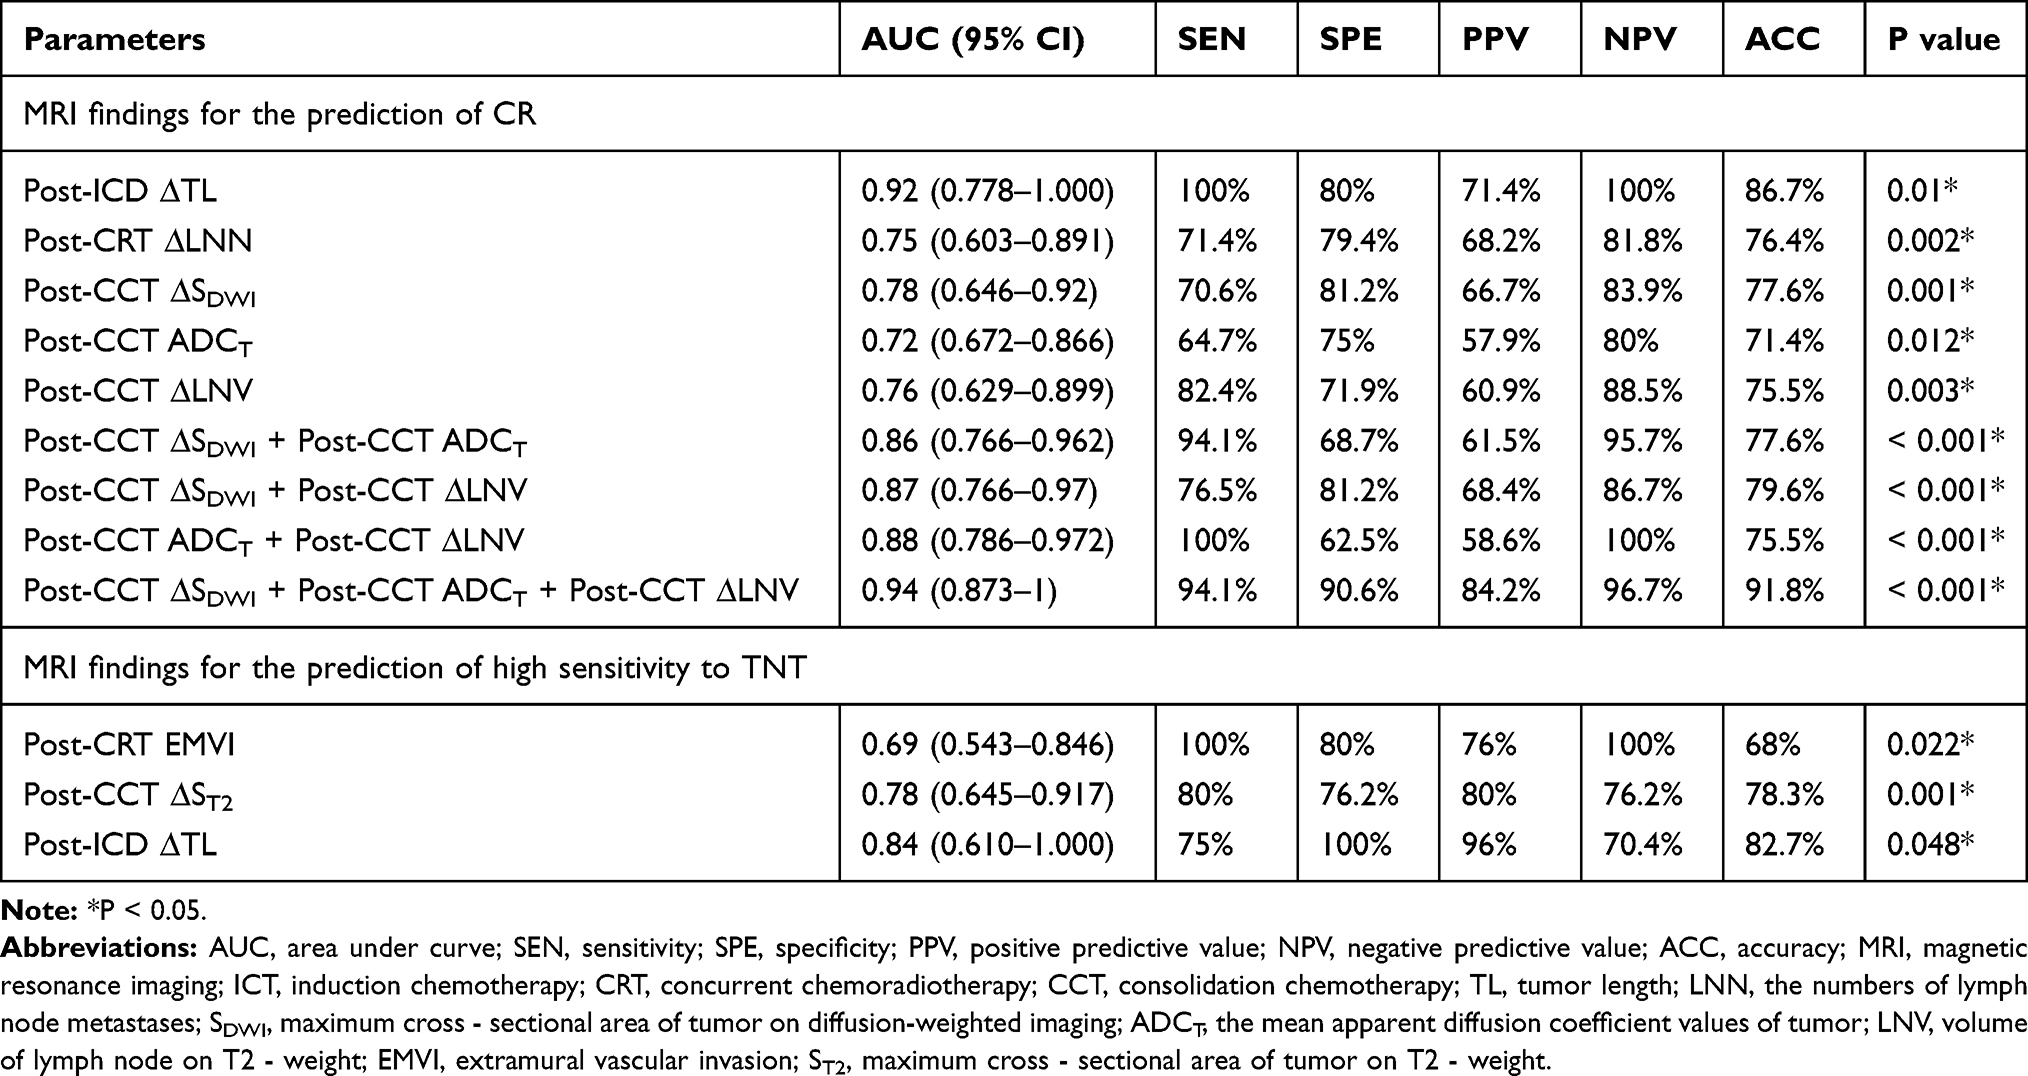 |
Table 5 Multivariate Analysis Results About Magnetic Resonance Imaging (MRI) Findings for the Prediction of CR and High Sensitivity to TNT |
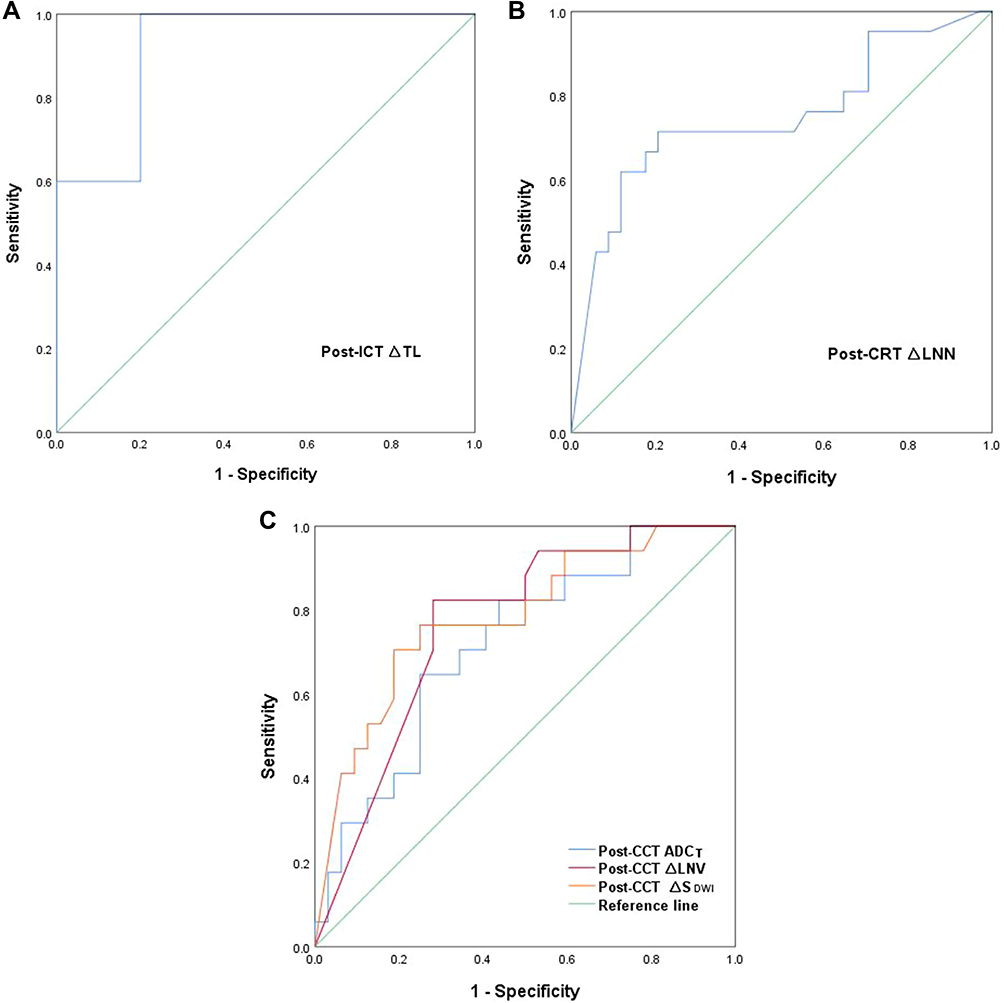 |
Figure 2 (A) ROC curves of predicting CR in the post-ICT MRI cohorts. (B) ROC curves of predicting CR in the post-CRT MRI cohorts. (C) ROC curves of predicting CR in the post-CCT MRI cohorts. |
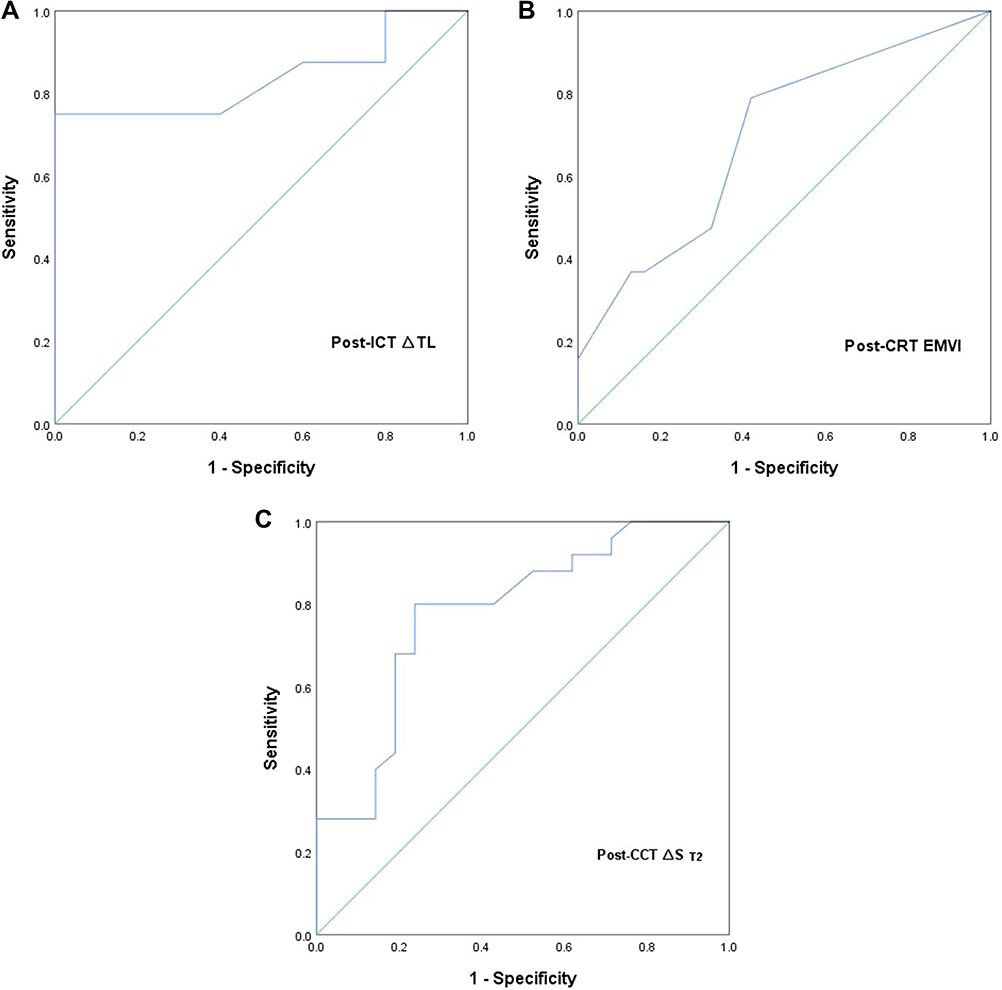 |
Figure 3 (A) ROC curves of predicting the high sensitive group (H group) in the post-ICT MRI cohorts.(B) ROC curves of predicting the high sensitive group (H group) in the post-CRT MRI cohorts. (C) ROC curves of predicting the high sensitive group (H group) in the post-CCT MRI cohorts. |
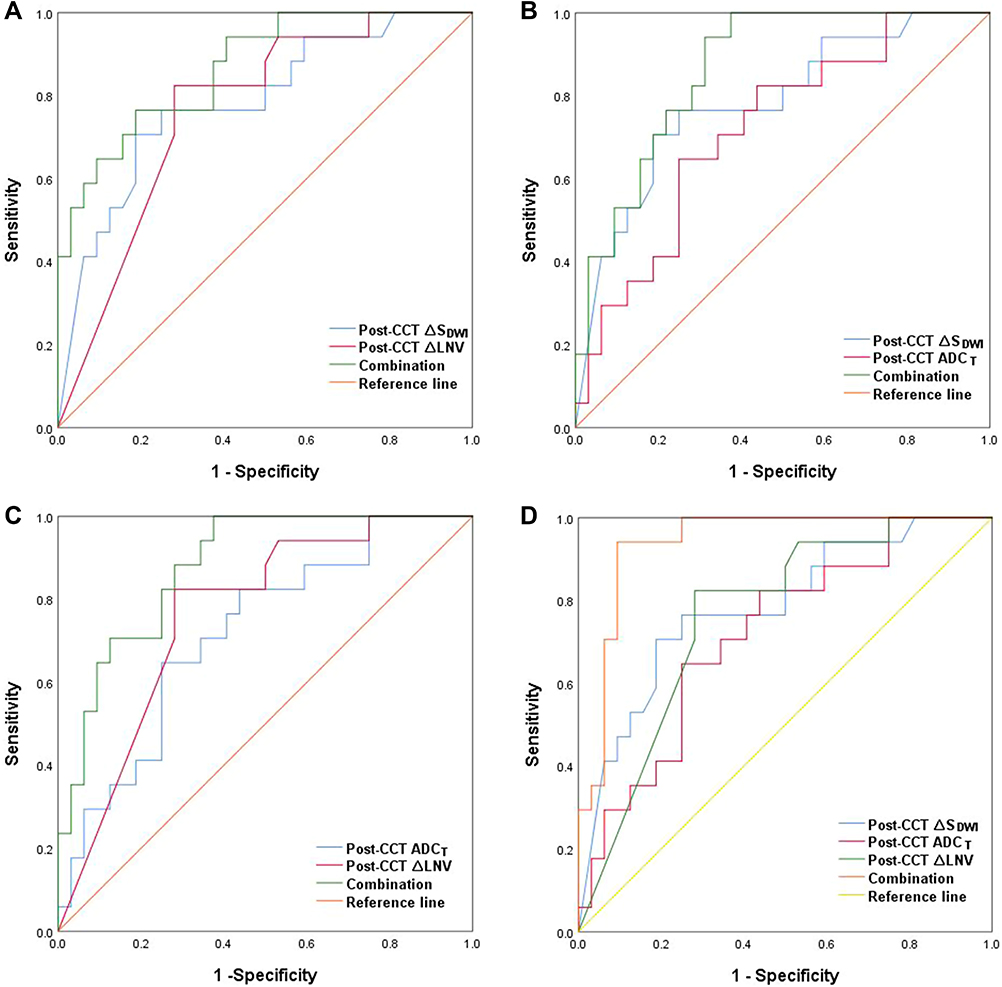 |
Figure 4 (A) ROC curves of predicting CR (combination of post-CCT ∆SDWI and post-CCT ∆LNV). (B) ROC curves of predicting CR (combination of post-CCT ∆SDWI and post-CCT ADCT). (C) ROC curves of predicting CR (combination of post-CCT ADCT and post-CCT ∆LNV). (D) ROC curves of predicting CR (combination of post-CCT ∆SDWI, post-CCT ADCT and post-CCT ∆LNV). |
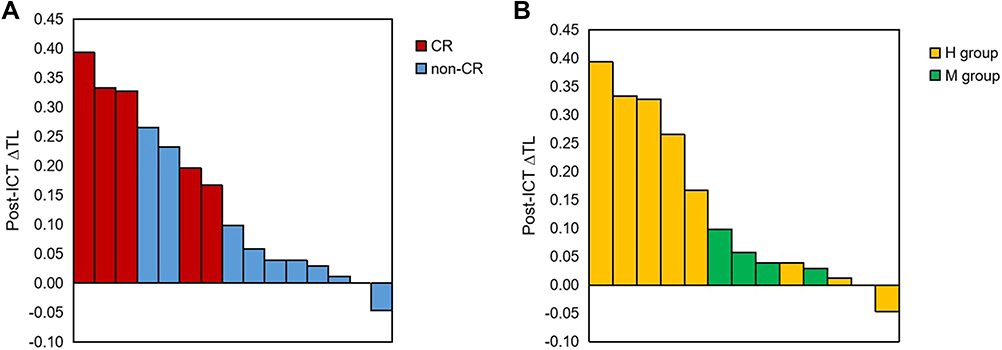 |
Figure 5 (A) Post - ICT ∆TL of CR vs non – CR for each patient. (B) Post - ICT ∆TL of the high sensitive group (H group) vs the moderate sensitive group (M group) for each patient. |
Discussion
In the present study, MRI parameters of TNT patients in three different neoadjuvant treatment phases were used to predict response. It is the first study that using MRI parameters to predict response of TNT. Most studies have used good responder and poor responder according to TRG as an evaluation method.9,20,21 Actually, TRG is subjective.22 The sensitivity to TNT was grouped according to tumor volume reduction rate on MRI and TRG of LARC following treatment with TNT. In this study, there was no L group but only H group and M group, which may be because TNT is the strongest neoadjuvant therapy. More studies3,23–25 have reported that patients could achieve a high rate of CR. We used two modalities to describe the response to TNT, CR vs non-CR group and high sensitive vs moderate sensitive vs low sensitive group. And our results revealed that MRI parameters could predict CR. So the grouping modality of CR vs non-CR may be more suitable for treatment response prediction.
We found post-ICT ∆TL offered the good results for the detection of patients with a CR and high sensitivity after TNT. Currently, there are very few researches that have described MRI parameters of post-ICT ∆TL for predicting a CR and high sensitivity. The smaller post-nCRT tumor length predicted an increased pCR rate in the previous studies.20,26,27 FOWARC analyzed MRI images of 403 patients and found that baseline TL was a significant factor for predicting pCR probability and patients with TL (>3 cm) may have a lower pCR probability.28 In our study, there was significant difference of post-ICT ∆TL in predicting CR and high sensitivity. Although our sample size is only 15 cases, integrating the result and practice experience we may conclude that the larger the post-ICT ∆TL predicted the more the tumor regression and the higher the probability of CR and high sensitivity. Post-ICT ∆TL might be an early prediction parameter of CR and high sensitivity. It has important reference value to help predict the response of neoadjuvant chemoradiotherapy and adjust the treatment plan as soon as possible.
Unlike other studies, we explored that post-CRT EMVI had a great predicting performance in identifying H group. When the post-CRT EMVI status was negative, sensitivity of patients to TNT was higher than positive. In previous literature by Lee et al,12 post-CRT EMVI was the only significant MRI factor in DFS. Long-term results from the GEMCAD 0801 trial29 and Meng et al30 considered baseline mrEMVI positivity was an independent prognostic indicator for DFS. Most previous studies have explored the relationship between EMVI and prognosis, yet we explored the correlation between EMVI and response and obtained good positive results. This maybe because radiation was effective in wiping out pathways of vascular spread in the pelvis.29
Regarding the definition of lymph node, we defined the positive lymph node according to Horvat et al.13 In the study, the more post-CRT ∆LNN and post-CCT ∆LNV provoked more chance of CR and high sensitivity to TNT in our study. At this point, patients who had post-CRT ∆LNN ≥ 70% would be more easier to achieve CR. Bustamante-Lopez et al31 found only pCR showed a significant association with <12 baseline LN. However, none of the previous studies had indicated correlation between post-CRT ∆LNN or post-CCT ∆LNV and response so far. It may be associated with the definition of positive lymph node is different and subjective.
DWI is increasingly incorporated in clinical rectal MRI exams worldwide.32 Moreover, the DWI-derived ADC values can be used for quantitative analysis of tumorous cellular density and extracellular space.16 ADC values are mainly negatively related to cell density and positively related to extracellular space.16,20,21 After consolidation chemotherapy, some tumor tissue was replaced by fibrous tissue. Post-CCT ADCT reflects the tissue density after TNT rather than only the tumor cell. Fibrotic tissue generally has low ADC.21 Consequently, Post-CCT ADCT may be a useful parameter for discriminating between CR and non-CR. Several articles focused on post-CRT ADC and post-CRT ∆ADC.33–35 However, we found ADCT of post-CCT MRI was associated with response. This differs from above studies.
Post-CCT MRI, which was performed after all neoadjuvant treatment, was mainly used for the diagnosis of cCR or pCR. We did not evaluate the accuracy of diagnosis of cCR using post-CCT MRI, and tried to avoid inconsistencies between cCR and pCR. In the study, we also performed a dynamic analysis based on baseline and post-ICT/CRT/CCT MRI. And post-CCT ∆SDWI, post-CCT ADCT and post-CCT ∆LNV were found to be the best predictors for CR. Post-CCT ∆ST2 were the best significant factors for high sensitivity to TNT. Moreover, the combination of post-CCT ∆SDWI, post-CCT LNV and post-CCT ADCT had best predicting performance of CR, which improved the diagnostic performance of CR and treatment response comparing the single MRI parameter. Of those parameters, post-CCT ∆SDWI, post-CCT ∆LNV and post-CCT ∆ST2, calculated by parameters of baseline MRI and post-CCT MRI, were dynamic parameters. Therefore, our results revealed that dynamic analysis based on MRI between baseline and post-CCT could provide the most valuable prediction of CR. In addition, combining the multiple MRI parameters improved the diagnostic performance of CR and treatment response comparing with the single MRI parameter.
There were a few limitations in the study that must be considered. Firstly, our study was a retrospective analysis with a small sample size collected from a single center, thus we can further enlarge sample size and get data from multicenter to validate the results. In addition, we did not compare the same parameter of post-ICT MRI, post-CRT MRI and post-CCT MRI to confirm that it can better reflect the response at a certain phase. Because many patients may have only two phases of treatments. Thirdly, we assessed SDWI and ST2 by measuring manually its long diameter and short diameter, and the area measured may be not accurate. Use of the image processing software may increase the accuracy.
Conclusions
Consequently, post-ICT ∆TL, post-CRT ∆LNN, post-CCT ∆SDWI, post-CCT ADCT and post-CCT ∆LNV were related to CR. Post-ICT ∆TL, post-CRT EMVI and post-CCT ∆ST2 were correlated with high sensitivity to TNT. Post-ICT ∆TL may be an early predictor of CR and high sensitivity. In addition, the combination of post-CCT ∆SDWI, post-CCT LNV and post-CCT ADCT had best predicting performance of CR. Dynamic analysis based on MRI between baseline and post-CCT could provide the most valuable prediction of CR. Moreover, radiomics17,36–38 and deep learning methods39–41 could be used as good tools for image data mining. Therefore, on the one hand, further studies based on artificial intelligence are indicated to explore the best predictor of response. On the other hand, in the future, we can enlarge sample size and get data from multicenter to validate the results.
Ethical Approval
This is a retrospective study. And the study was approved by the Ethics Committee on Biomedical Research, West China Hospital of Sichuan University (2020-903). Patient consent was not required. The reasons for the waiver were as follows. Firstly, this is a retrospective study. There was no additional risk to patients. In the process of ethical approval, we have submitted to the ethics committee the application for exemption from informed consent of patients. Additionally, we abided by the Declaration of Helsinki. We collected de-identified data of patients. And the final results of the study would be anonymity.
Acknowledgments
Supported by grants from the National Natural Science Foundation of China (82073338), grants from Science and Technology bureau of Chengdu of China (2019-YF05-00771-SN), grants from the 1·3·5 Project for Disciplines of Excellence – Clinical Research Incubation Project, West China Hospital, Sichuan University (2020HXFH002).
Disclosure
The authors report no conflicts of interest in this work.
References
1. Sauer R, Becker H, Hohenberger W, et al. Preoperative versus postoperative chemoradiotherapy for rectal cancer. N Engl J Med. 2004;351(17):1731–1740. doi:10.1056/NEJMoa040694
2. Petrelli F, Trevisan F, Cabiddu M, et al. Total neoadjuvant therapy in rectal cancer: a systematic review and meta-analysis of treatment outcomes. Ann Surg. 2020;271(3):440–448. doi:10.1097/SLA.0000000000003471
3. Wang X, Yu Y, Meng W, et al. Total neoadjuvant treatment (CAPOX plus radiotherapy) for patients with locally advanced rectal cancer with high risk factors: a Phase 2 trial. Radiother Oncol. 2018;129(2):300–305. doi:10.1016/j.radonc.2018.08.027
4. Cercek A, Roxburgh CSD, Strombom P, et al. Adoption of total neoadjuvant therapy for locally advanced rectal cancer. JAMA Oncol. 2018;4(6):e180071. doi:10.1001/jamaoncol.2018.0071
5. Hu YH, Wei JW, Chang H, et al. The high pCR rate of sandwich neoadjuvant treatment in locally advanced rectal cancer may translate into a better long-term survival benefit: 5-year outcome of a Phase II clinical trial. Cancer Manag Res. 2018;10:4363–4369. doi:10.2147/CMAR.S168573
6. Garcia-Aguilar J, Chow OS, Smith DD, et al. Effect of adding mFOLFOX6 after neoadjuvant chemoradiation in locally advanced rectal cancer: a multicentre, phase 2 trial. Lancet Oncol. 2015;16(8):957–966. doi:10.1016/S1470-2045(15)00004-2
7. Bujko K, Wyrwicz L, Rutkowski A, et al. Long-course oxaliplatin-based preoperative chemoradiation versus 5 x 5 Gy and consolidation chemotherapy for cT4 or fixed cT3 rectal cancer: results of a randomized Phase III study. Ann Oncol. 2016;27(5):834–842. doi:10.1093/annonc/mdw062
8. Gollub MJ, Blazic I, Bates DDB, et al. Pelvic MRI after induction chemotherapy and before long-course chemoradiation therapy for rectal cancer: what are the imaging findings? Eur Radiol. 2019;29(4):1733–1742. doi:10.1007/s00330-018-5726-2
9. Petrillo A, Fusco R, Granata V, et al. Assessing response to neo-adjuvant therapy in locally advanced rectal cancer using intra-voxel incoherent motion modelling by DWI data and standardized index of shape from DCE-MRI. Ther Adv Med Oncol. 2018;10:1758835918809875. doi:10.1177/1758835918809875
10. Kim S, Han K, Seo N, et al. T2-weighted signal intensity-selected volumetry for prediction of pathological complete response after preoperative chemoradiotherapy in locally advanced rectal cancer. Eur Radiol. 2018;28(12):5231–5240. doi:10.1007/s00330-018-5520-1
11. Palmisano A, Esposito A, Di Chiara A, et al. Could early tumour volume changes assessed on morphological MRI predict the response to chemoradiation therapy in locally-advanced rectal cancer? Clin Radiol. 2018;73(6):555–563. doi:10.1016/j.crad.2018.01.007
12. Lee ES, Kim MJ, Park SC, et al. Magnetic resonance imaging-detected extramural venous invasion in rectal cancer before and after preoperative chemoradiotherapy: diagnostic performance and prognostic significance. Eur Radiol. 2018;28(2):496–505. doi:10.1007/s00330-017-4978-6
13. Horvat N, Carlos Tavares Rocha C, Clemente Oliveira B, Petkovska I, Gollub MJ. MRI of rectal cancer: tumor staging, imaging techniques, and management. Radiographics. 2019;39(2):367–387. doi:10.1148/rg.2019180114
14. Smith NJ, Barbachano Y, Norman AR, Swift RI, Abulafi AM, Brown G. Prognostic significance of magnetic resonance imaging-detected extramural vascular invasion in rectal cancer. Br J Surg. 2008;95(2):229–236. doi:10.1002/bjs.5917
15. Chand M, Swift RI, Tekkis PP, Chau I, Brown G. Extramural venous invasion is a potential imaging predictive biomarker of neoadjuvant treatment in rectal cancer. Br J Cancer. 2014;110(1):19–25. doi:10.1038/bjc.2013.603
16. Li J, Wang J, Pang J, Cao S, Chen J, Xu W. Optimized parameters of diffusion-weighted MRI for prediction of the response to neoadjuvant chemoradiotherapy for locally advanced rectal cancer. Biomed Res Int. 2019;2019:9392747. doi:10.1155/2019/9392747
17. Liu Z, Zhang XY, Shi YJ, et al. Radiomics analysis for evaluation of pathological complete response to neoadjuvant chemoradiotherapy in locally advanced rectal cancer. Clin Cancer Res. 2017;23(23):7253–7262. doi:10.1158/1078-0432.CCR-17-1038
18. Xiao J, Tan Y, Li W, et al. Tumor volume reduction rate is superior to RECIST for predicting the pathological response of rectal cancer treated with neoadjuvant chemoradiation: results from a prospective study. Oncol Lett. 2015;9(6):2680–2686. doi:10.3892/ol.2015.3101
19. Ryan R, Gibbons D, Hyland JM, et al. Pathological response following long-course neoadjuvant chemoradiotherapy for locally advanced rectal cancer. Histopathology. 2005;47(2):141–146. doi:10.1111/j.1365-2559.2005.02176.x
20. Phongkitkarun S, Tohmad U, Larbcharoensub N, Sumbunnanondha K, Swangsilpa T, Sirachainan E. DCE-MRI-derived parameters as predictors of response to neo-adjuvant chemoradiation treatment of rectal carcinoma. J Med Assoc Thai. 2016;99(3):338–347.
21. Bakke KM, Hole KH, Dueland S, et al. Diffusion-weighted magnetic resonance imaging of rectal cancer: tumour volume and perfusion fraction predict chemoradiotherapy response and survival. Acta Oncol. 2017;56(6):813–818. doi:10.1080/0284186X.2017.1287951
22. Nagtegaal ID, Glynne-Jones R. How to measure tumour response in rectal cancer? An explanation of discrepancies and suggestions for improvement. Cancer Treat Rev. 2020;84:101964. doi:10.1016/j.ctrv.2020.101964
23. Perez K, Safran H, Sikov W, et al. Complete neoadjuvant treatment for rectal cancer: the Brown University oncology group CONTRE Study. Am J Clin Oncol. 2017;40(3):283–287. doi:10.1097/COC.0000000000000149
24. Gao YH, An X, Sun WJ, et al. Evaluation of capecitabine and oxaliplatin administered prior to and then concomitant to radiotherapy in high risk locally advanced rectal cancer. J Surg Oncol. 2014;109(5):478–482. doi:10.1002/jso.23516
25. Marco MR, Zhou L, Patil S, et al. Consolidation mFOLFOX6 chemotherapy after chemoradiotherapy improves survival in patients with locally advanced rectal cancer: final results of a multicenter Phase II Trial. Dis Colon Rectum. 2018;61(10):1146–1155. doi:10.1097/DCR.0000000000001207
26. Martens MH, van Heeswijk MM, van den Broek JJ, et al. Prospective, multicenter validation study of magnetic resonance volumetry for response assessment after preoperative chemoradiation in rectal cancer: can the results in the literature be reproduced? Int J Radiat Oncol Biol Phys. 2015;93(5):1005–1014. doi:10.1016/j.ijrobp.2015.09.008
27. Zhang C, Ye F, Liu Y, Ouyang H, Zhao X, Zhang H. Morphologic predictors of pathological complete response to neoadjuvant chemoradiotherapy in locally advanced rectal cancer. Oncotarget. 2018;9(4):4862–4874. doi:10.18632/oncotarget.23419
28. Ren DL, Li J, Yu HC, et al. Nomograms for predicting pathological response to neoadjuvant treatments in patients with rectal cancer. World J Gastroenterol. 2019;25(1):118–137. doi:10.3748/wjg.v25.i1.118
29. Patel UB, Brown G, Machado I, et al. MRI assessment and outcomes in patients receiving neoadjuvant chemotherapy only for primary rectal cancer: long-term results from the GEMCAD 0801 trial. Ann Oncol. 2017;28(2):344–353. doi:10.1093/annonc/mdw616
30. Meng Y, Wan L, Zhang C, et al. The predictive value of pre-/postneoadjuvant chemoradiotherapy MRI characteristics for patient outcomes in locally advanced rectal cancer. Acad Radiol. 2019.
31. Bustamante-Lopez LA, Nahas CSR, Nahas SC, et al. Pathologic complete response implies a fewer number of lymph nodes in specimen of rectal cancer patients treated by neoadjuvant therapy and total mesorectal excision. Int J Surg. 2018;56:283–287. doi:10.1016/j.ijsu.2018.07.001
32. Schurink NW, Lambregts DMJ, Beets-Tan RGH. Diffusion-weighted imaging in rectal cancer: current applications and future perspectives. Br J Radiol. 2019;92(1096):20180655. doi:10.1259/bjr.20180655
33. Chen YG, Chen MQ, Guo YY, Li SC, Wu JX, Xu BH. Apparent diffusion coefficient predicts pathology complete response of rectal cancer treated with neoadjuvant chemoradiotherapy. PLoS One. 2016;11(4):e0153944. doi:10.1371/journal.pone.0153944
34. Blazic IM, Lilic GB, Gajic MM. Quantitative assessment of rectal cancer response to neoadjuvant combined chemotherapy and radiation therapy: comparison of three methods of positioning region of interest for ADC measurements at diffusion-weighted MR Imaging. Radiology. 2017;282(2):418–428. doi:10.1148/radiol.2016151908
35. Bassaneze T, Goncalves JE, Faria JF, Palma RT, Waisberg J. Quantitative aspects of diffusion-weighted magnetic resonance imaging in rectal cancer response to neoadjuvant therapy. Radiol Oncol. 2017;51(3):270–276. doi:10.1515/raon-2017-0025
36. Lovinfosse P, Polus M, Van Daele D, et al. FDG PET/CT radiomics for predicting the outcome of locally advanced rectal cancer. Eur J Nucl Med Mol Imaging. 2018;45(3):365–375. doi:10.1007/s00259-017-3855-5
37. Nie K, Shi L, Chen Q, et al. Rectal cancer: assessment of neoadjuvant chemoradiation outcome based on radiomics of multiparametric MRI. Clin Cancer Res. 2016;22(21):5256–5264. doi:10.1158/1078-0432.CCR-15-2997
38. Jeon SH, Song C, Chie EK, et al. Delta-radiomics signature predicts treatment outcomes after preoperative chemoradiotherapy and surgery in rectal cancer. Radiat Oncol. 2019;14(1):43. doi:10.1186/s13014-019-1246-8
39. Bibault J-E, Giraud P, Housset M, et al. Deep learning and radiomics predict complete response after neo-adjuvant chemoradiation for locally advanced rectal cancer. Sci Rep. 2018;8:1.
40. Shi L, Zhang Y, Nie K, et al. Machine learning for prediction of chemoradiation therapy response in rectal cancer using pre-treatment and mid-radiation multi-parametric MRI. Magn Reson Imaging. 2019;61:33–40. doi:10.1016/j.mri.2019.05.003
41. Xu Y, Hosny A, Zeleznik R, et al. Deep learning predicts lung cancer treatment response from serial medical imaging. Clin Cancer Res. 2019;25(11):3266–3275. doi:10.1158/1078-0432.CCR-18-2495
 © 2021 The Author(s). This work is published and licensed by Dove Medical Press Limited. The
full terms of this license are available at https://www.dovepress.com/terms
and incorporate the Creative Commons Attribution
- Non Commercial (unported, 3.0) License.
By accessing the work you hereby accept the Terms. Non-commercial uses of the work are permitted
without any further permission from Dove Medical Press Limited, provided the work is properly
attributed. For permission for commercial use of this work, please see paragraphs 4.2 and 5 of our Terms.
© 2021 The Author(s). This work is published and licensed by Dove Medical Press Limited. The
full terms of this license are available at https://www.dovepress.com/terms
and incorporate the Creative Commons Attribution
- Non Commercial (unported, 3.0) License.
By accessing the work you hereby accept the Terms. Non-commercial uses of the work are permitted
without any further permission from Dove Medical Press Limited, provided the work is properly
attributed. For permission for commercial use of this work, please see paragraphs 4.2 and 5 of our Terms.