Back to Journals » Journal of Pain Research » Volume 13
Predicting EQ-5D-5L Utility Scores from the Oswestry Disability Index and Roland-Morris Disability Questionnaire for Low Back Pain
Received 1 November 2019
Accepted for publication 7 March 2020
Published 26 March 2020 Volume 2020:13 Pages 623—631
DOI https://doi.org/10.2147/JPR.S236957
Checked for plagiarism Yes
Review by Single anonymous peer review
Peer reviewer comments 2
Editor who approved publication: Professor E Alfonso Romero-Sandoval
Thomas G Poder,1– 3 Nathalie Carrier3
1School of Public Health, Department of Management, Evaluation and Health Policy, University of Montreal, Montreal, QC, Canada; 2Centre de recherche de l’Institut universitaire en santé mentale de Montréal, CIUSSS de l’Est-de-l’Île-de-Montréal, Montreal, QC, Canada; 3Centre de recherche du CHUS, CIUSSS de l’Estrie-CHUS, Sherbrooke, QC, Canada
Correspondence: Thomas G Poder
School of Public Health, Department of Management, Evaluation and Health Policy, University of Montreal, Montreal, QC, Canada
Email [email protected]
Background: Cost utility analysis is important for measuring the impact of chronic disease and helps clinicians and policymakers in patient management and policy decisions, but generic preference-based measures are not always considered in clinical studies.
Objective: To evaluate if health-related quality-of-life (HRQoL)-specific questionnaires used in chronic low back pain (CLBP) can predict EQ-5D-5L utility scores.
Methods: The data come from an online survey on low back pain conducted between October 2018 and January 2019. Health utility scores for EuroQol Five Dimensions Five Levels (EQ-5D-5L) were calculated with the recommended model of Xie et al. The EQ-5D-5L health states ranged from − 0.148 for the worst (55555) to 0.949 for the best (11111). Univariate and multivariate linear regression were performed to predict EQ-5D-5L with Oswestry Disability Index (ODI), Roland-Morris Disability Questionnaire (RMDQ) and clinical variables.
Results: Analyses were performed in 408 subjects who completed the questionnaires EQ-5D-5L, ODI or RMDQ. Median (range) of EQ-5D-5L was 0.622 (− 0.072 to 0.905). There was high correlation between EQ-5D-5L and ODI (r=− 0.78, p< 0.001), while it was moderate with RMDQ (r=− 0.62, p< 0.001). The multivariate model to predict EQ-5D-5L with ODI explained 67.6% of variability, and the correlation between actual and predicted EQ-5D-5L was 0.82. Principal predictors were ODI, duration of LBP, invalidity, health satisfaction (0– 10 cm), life satisfaction (0– 10 cm), and intensity of pain today (0– 10 cm).
Conclusion: Data from this study demonstrated that individual correlation between ODI and EQ-5D-5L was high, but moderate with RMDQ. Correlations between actual and predicted EQ-5D-5L from multivariate models were higher and very high. Considering these results, the multivariate model can be used in similar studies for patient with CLBP to estimate the utility scores from the ODI when the EQ-5D-5L was not measured.
Keywords: low back pain, EQ-5D-5L, utility score, QALY, health-related quality of life
Introduction
Low back pain (LBP) is a major cause of disability. It is estimated that about 80% of people will experience at least one form of back pain (pain and disability) during their lifetime1–3 and that chronic low back pain (CLBP) affects between 20% and 30% of the population according to several studies.4–8 Pain is considered chronic if it lasts for more than 3 to 6 months.7,9
Health-related quality of life (HRQoL) is important for measuring the impact of chronic disease and help clinicians and policymakers in patient management and policy decisions.10 Several instruments can be used to measure HRQoL, some are specific to the disease while others are generic preference-based measures, each having its strengths and weaknesses.10 The Oswestry Disability Index (ODI) and Roland-Morris Disability Questionnaire (RMDQ) are specific instruments commonly used to measure the disability related to LBP.11,12 Also, there are several generic preference-based measures to evaluate the HRQoL such as the EuroQol Five Dimensions (EQ-5D) and the Short Form Six Dimensions (SF-6D). These instruments allow to calculate utility scores and belong to the family of the Quality-Adjusted Life-Year (QALY) questionnaires. The EQ-5D and SF-6D have been used and validated in different LBP populations.13–16 To date, it is recommended to use several instruments to measure HRQoL10 but not always done, especially in clinical studies. It is also worthwhile to note that the EQ-5D is available in two versions: EuroQol Five Dimensions Three Levels (EQ-5D-3L) and EuroQol Five Dimensions Five Levels (EQ-5D-5L). The difference is that the EQ-5D-5L uses the same dimensions as the EQ-5D-3L but allows 5 levels of answers instead of only 3. This leads the EQ-5D-5L to generate more health states and then to provide a higher level of sensitivity when evaluating HRQoL.
The correlation between EQ-5D and ODI in the literature varies from moderate17–19 to high correlation.14 To our knowledge, only one study analyzed the correlation between RMDQ and EQ-5D and found a moderate correlation.20 Carreon et al computed a regression model to estimate EQ-5D-3L with ODI and other measures, but they did not use EQ-5D-5L and their conclusion was that the EQ-5D cannot be accurately estimated from the ODI.18 Other authors used mapping to predict EQ-5D-3L and did not consider ODI as instrument.20,21 Some authors correlated EQ-5D-5L with ODI and other measures, but did not perform regression models to predict EQ-5D-5L.14,15
The purpose of this study is thus to evaluate if two current specific questionnaires used in CLBP (ODI and RMDQ) can be used to predict EQ-5D-5L utility scores and EuroQol Visual Analog Scale (EQ-VAS). If so, we will define the predictors of the EQ-5D-5L and establish a predictive equation.
Methods
Data
The data come from an online survey on low back pain conducted between October 2018 and January 2019. The Quebec Association of Chronic Pain distributed the survey by email to its members and posters were also publicized at different places in our hospital. No monetary compensation was allocated to complete the survey. The inclusion criteria were to be a Quebec resident, had at least 18 years, suffer from LBP and able to read and understand either French or English. Subject with LBP for less than 3 months or unable to complete alone or accompanied an online questionnaire were excluded.
Survey
The primary purpose of the survey was to identify patient preferences for non-surgical treatment for low back pain using a discrete choice experiment.22 Variables used in this study were mainly from the sociodemographic characteristics, the duration of participants’ LBP, intensity of pain on a numerical rating scale from 0 (no pain) to 10 (worst possible pain), and health and life satisfaction scores measured with a numerical rating scale from 0 (not at all satisfied) to 10 (fully satisfied). The questionnaire ends with 4 HRQoL questionnaires administered in a random order, ie, two generic preference-based measures (EQ-5D-5L and SF-6D) and two specific questionnaires (ODI and RMDQ).
Oswestry Disability Index
The ODI is a specific instrument used to measure disability in patients with LBP.11 It includes 10-item scale (pain intensity, personal care, lifting, walking, sitting, standing, sleeping, work, social life and traveling) with 6 levels from 0 to 5. A total score is calculated by adding the 10 items to obtain a partial score from 0 to 50. The score is transformed to obtain a 0–100 scale. The total score could be categorised in minimal disability (0–20), moderate disability (21–40), severe disability (41–60), crippled (61–80) and bed-bound or exaggerating their symptoms (81–100).
Rolland-Morris Disability Questionnaire
The RMDQ is a specific instrument used to measure disability related to LBP. It includes 24 questions that describe some of the challenges of doing daily physical activity directly related to lower back pain.23 All questions are yes/no and a total score is calculated from 0 to 24 by adding the number of yes responses. A higher score reflects more disability.
EQ-5D-5L
The EQ-5D-5L questionnaire includes 6 questions. The 5 first questions correspond to 5 dimensions (mobility, self-care, usual activities, pain/discomfort, and anxiety/depression) with 5 levels each from no problem to extreme problem. The last question is a vertical visual analog scale (VAS) with 100 on the top representing the “best imaginable health state” and 0 at the bottom representing the “worst imaginable health state.” Health utility scores were calculated with the value set developed by Xie et al24 and using their recommended model. The health utilities elicited ranged from −0.148 for the worst (55555) to 0.949 for the best (11111) EQ-5D-5L health states. Indeed, since health utility scores were calculated with a linear model, worst and best states were different than 0 and 1.
Statistical Analysis
Sociodemographic and clinical characteristics were presented with frequency and percentage for categorical variables and mean, standard deviation and range for continuous variables. Histograms were used to evaluate normality distributions. Results are presented with median (interquartile range (IQR)) for EQ-5D-5L and with mean (95% confidence interval (CI)) for EQ-VAS, ODI and RMDQ. Ceiling and floor effect were calculated for each utility instrument. Ceiling effect was the proportion of respondents reporting “no problems” for all dimensions and floor effect was the proportion of respondents reporting the worst level for all dimensions. Specific and generic preference-based measures were compared according to ODI categories with ANOVA or Kruskal–Wallis. Spearman correlations were computed with EQ-5D-5L and Pearson correlations with other variables. Univariate and Multivariate linear regression models were performed to predict EQ-5D-5L and EQ-VAS. One first model was performed with clinical variables easily available (gender, age, duration of LBP, invalidity yes/no). Other models performed with other significant variables in univariate analysis (health satisfaction, life satisfaction and intensity of pain). Since the EQ-5D-5L was not normally distributed, the model was applied on inverse logarithm utility score transformation (log (x-1)), the best transformation among the ones tested to obtain normal distribution. Therefore, the estimates of the models must be interpreted in the opposite direction. Pearson correlations were computed to evaluate the association between transformed EQ-5D-5L and predicted values from multivariate linear regressions. The interpretation of correlation coefficient was very high between 0.9 and 1, high between 0.7 and 0.9, moderate between 0.5 and 0.7, and low between 0.3 and 0.5.25,26 As the EQ-5D-5L and specific questionnaires were at the end of the survey, and as the subjects were obliged to answer the questions to go on to the next question, the subjects with values for EQ-5D-5L, ODI and RMDQ answered all the previous questions. So no imputation was done for missing data. Normality of residues was validated. Analyses were computed with SAS software (version 9.4; SAS Institute Inc., Cary, NC, USA) and graph with GraphPad Prism version 7.00 for Windows. A p-value less than 0.05 was considered significant.
Ethical Approval
This project was approved by the institutional ethics committee (Comité d’éthique de la recherche of the CIUSSS de l’Estrie – CHUS #2019-2929). The subject’s consent was obtained by clicking on the start button at the end of the explanatory letter. All questionnaires were anonym and the data were stored on a protected network at our institution to ensure confidentiality and protection of the respondents.
Results
Sample Characteristics
Between October 2018 and January 2019, 610 subjects responded to the survey. Reasons of exclusion were low back pain for less than 3 months (n=8) and do not begin the survey (n=33). Analyses were performed only in 408 subjects who completed the questionnaires EQ-5D-5L, ODI or RMDQ. Subjects who did not complete the EQ-5D-5L and the specific HRQoL questionnaires were older, had a slightly lower BMI, were more widowers, more retired, had more osteoporosis, and did less aerobic activity. No difference was observed for education, income, pain, treatments, health status, life or health satisfaction (Supplementary Table 1). For subjects who went to the end of the survey, the median time to complete the questionnaire was 34 mins. Subject’s characteristics are presented in Table 1. The mean (range) age was 55 (20–87) years and majority was women (79.3%). The pain intensity was not so high, but their health and life satisfaction were low.
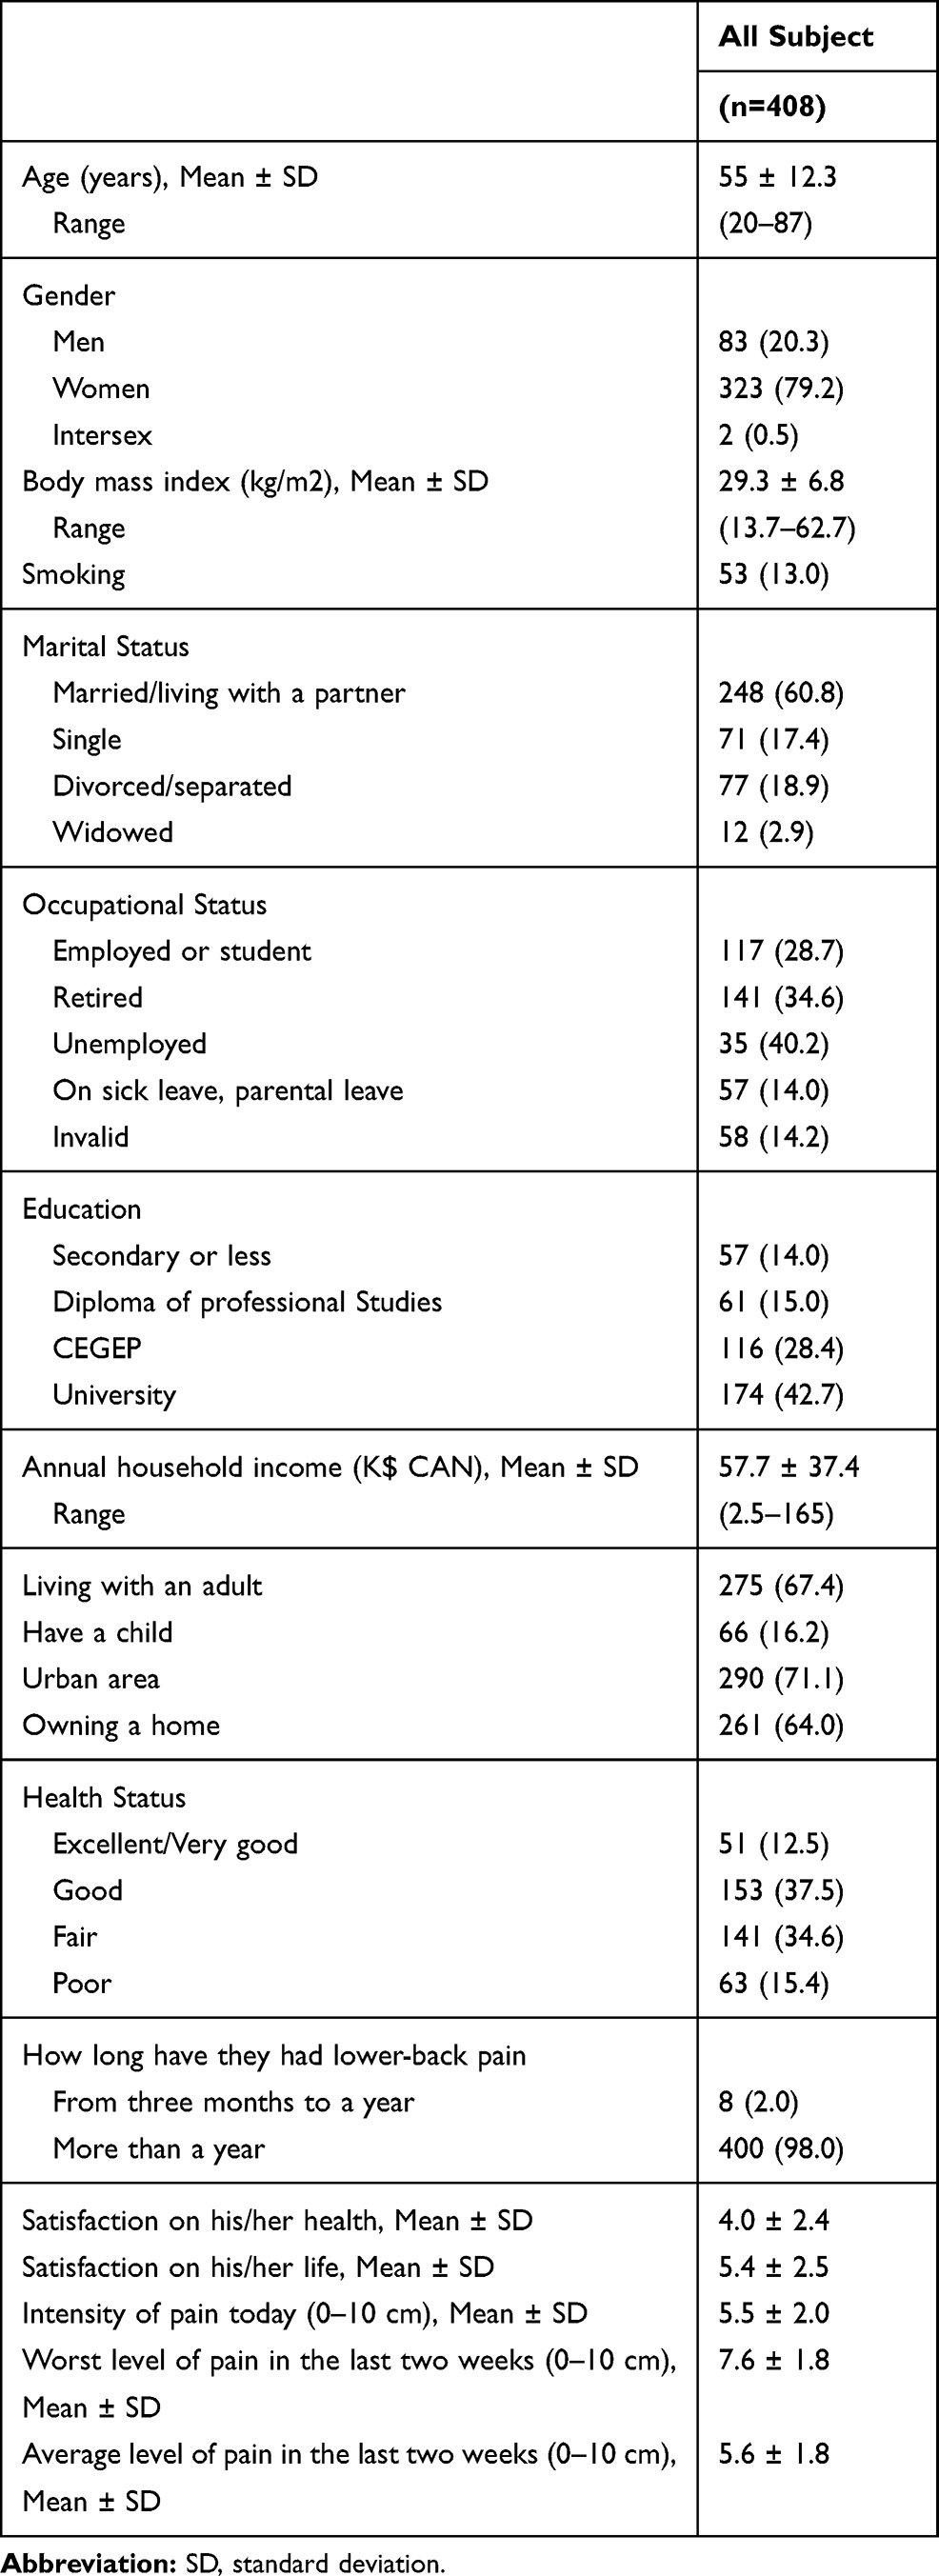 |
Table 1 Sociodemographic and Clinical Characteristics |
Descriptive Statistics and Correlations Between QALY and HRQoL Questionnaires
Only the EQ-5D-5L was not normally distributed (Figure 1). No ceiling and floor effect was observed for EQ-5D-5L. For EQ-VAS, only one ceiling effect and 4 floor effects were observed. Table 2 presents the descriptive statistics of the outcomes. More detailed information about the ODI is also presented in Supplementary Table 2. It is clear that EQ-5D-5L and EQ-VAS decreased when ODI increased (all p<0.001). ODI and RMDQ were correlated at various degrees (from high to low) with EQ-5D-5L and EQ-VAS, but more with EQ-5D-5L (r=−0.777, p<0.001 and r=−0.621, p<0.001, respectively) than EQ-VAS (r=−0.526, p<0.001 and r=−0.451, p<0.001, respectively) (Figure 2). Similar results were observed in univariate linear regression. Although both specific questionnaires were very significant in predicting the utility score and EQ-VAS, the variability explained by ODI was higher than RMDQ to predict EQ-5D-5L (R2=0.603 vs 0.387, respectively) and EQ-VAS (R2=0.276 vs 0.204, respectively) (Table 3 and Supplementary Tables 3 and 4). In addition, as shown earlier, ODI was better to predict the EQ-5D-5L than EQ-VAS.
 |
Table 2 Descriptive Statistics of EQ-5D-5L, EQ-VAS and Specific HRQoL Questionnaires |
 |
Table 3 Univariate and Multivariate Linear Regression Models to Predict EQ-5D-5L |
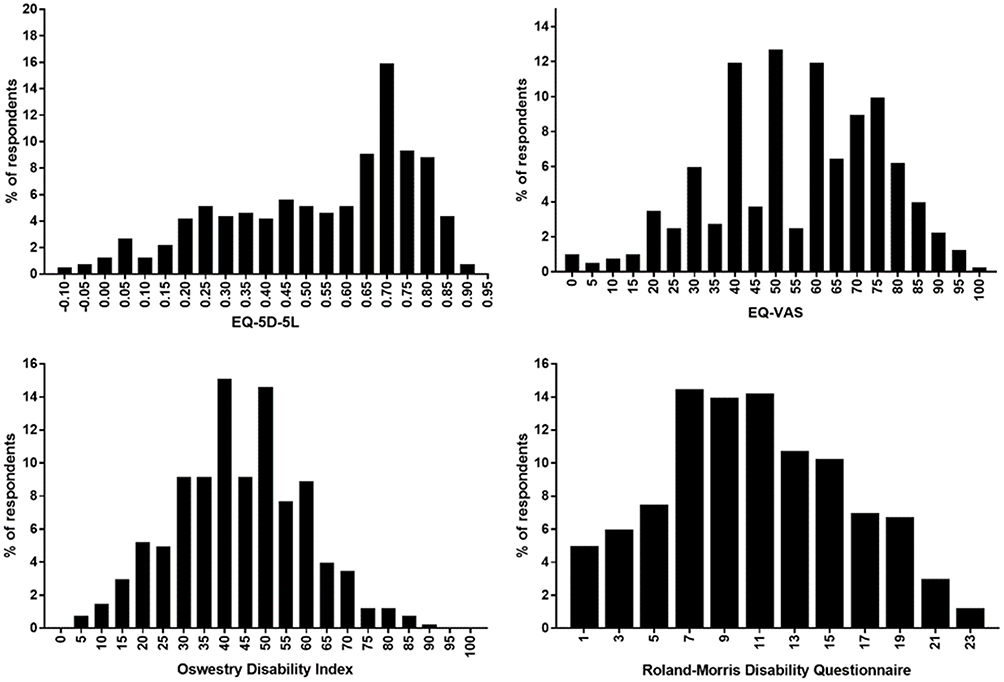 |
Figure 1 Distribution of EQ-5D-5L, EQ-VAS, Oswestry Disability Index and Roland-Morris Disability Questionnaire. |
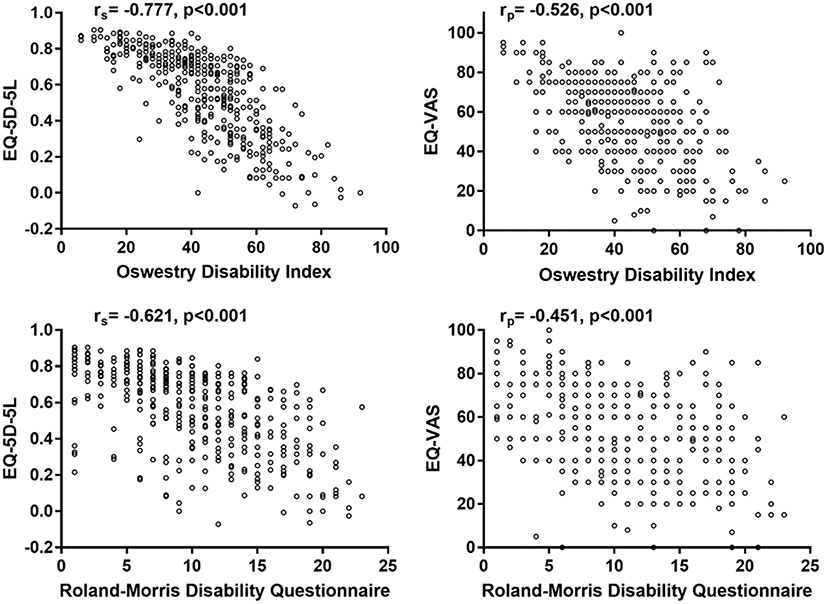 |
Figure 2 Correlations between EQ-5D-5L and EQ-VAS with Oswestry Disability Index and Roland-Morris Disability Questionnaire. |
Predictors of Utility Score
Multivariate linear regression models by outcome were performed to evaluate predictors of utility score (Table 3 and Supplementary Tables 3 and 4). Since EQ-5D-5L values were transformed with inverse logarithm to obtain a normal distribution of residues, the estimates must be interpreted in the opposite. In all models, ODI or RMDQ were the highest predictor and were significantly associated with lower EQ-5D-5L and lower EQ-VAS, but the variability explained by the models was always higher with ODI than RMDQ. In all full models, health or life satisfaction increased the health utility score and pain reduced the health utility score. Subjects with invalidity decreased the EQ-5D-5L, but had no impact on EQ-VAS. When each item of ODI was included separately in EQ-5D-5L models, a majority were significantly associated with lower health utility score except lifting, sitting and standing (Supplementary Table 3). A fewer number of ODI sections were significantly associated with EQ-VAS (Supplementary Table 4). For EQ-5D-5L and EQ-VAS, the highest ODI predictor was pain intensity. In model 3, the intensity of pain today (0–10 cm) was not significant, but the effect was probably captured by the pain item of ODI. When each item of RMDQ was analysed, only items with p<0.1 in model 1 were presented and used in models 2 and 3 (Supplementary Table 3). The RMDQ items with the highest coefficients negatively associated with EQ-5D-5L were staying at home most of the time, not doing any jobs that I usually do around the house, painful almost all of the time, and can only walk short distances. Other predictors were invalidity, health and life satisfaction, and intensity of pain today. In model 3 for EQ-VAS, no items of RMDQ stayed significant. Only health and life satisfaction, and intensity of pain today predicted EQ-VAS.
The correlation between actual and predicted EQ-5D-5L using the univariate model with ODI was 0.78. The correlation stayed at 0.79 in model 2 and increased to 0.82 with model 3 including ODI (Figure 3). For EQ-5D-5L predicted by RMDQ, correlations were 0.62, 0.65 and 0.75 for model 1 to 3, respectively (Figure 3). Adding health and life satisfaction, and intensity of pain today increased the predictive capacity of the model. Similar results were observed for EQ-VAS (Supplementary Table 4). On the other hand, the variability explained by the models was lower, being invalid is not a predictor of EQ-VAS and many fewer ODI items were significant.
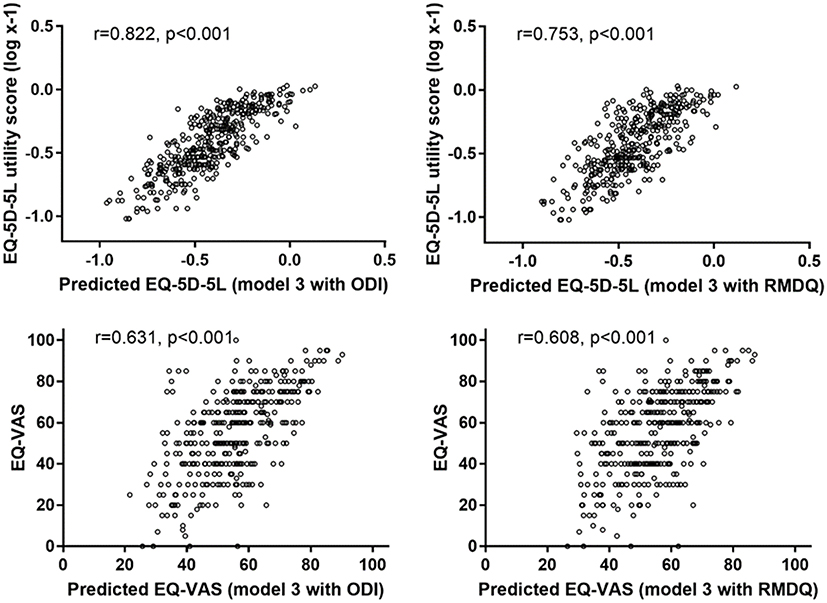 |
Figure 3 Predicted and actual EQ-5D-5L and EQ-VAS considering the model 3 with Oswestry Disability Index (ODI) and Roland-Morris Disability Questionnaire (RMDQ). |
Discussion
The main purpose of this study was to evaluate if ODI and RMDQ can be used to predict utility scores. Data from this study demonstrate that EQ-5D-5L is highly correlated with ODI and only moderately with RMDQ. Correlations with the EQ-VAS were also significant but lower than with the EQ-5D-5L. Since correlations generated interesting results, we constructed regression models to predict these outcomes. The correlation was high between the EQ-5D-5L and the predicted values from the full model (model 3), which shows that the regression model predicts the EQ-5D-5L very well. Indeed, in all models with ODI the correlations between actual and predicted EQ-5D-5L were high (0.7–0.9), while they were moderate (0.5–0.7) with RMDQ in models 1 and 2, and high in model 3. Consequently, we recommend using the full model to convert answers to ODI and RMDQ questionnaires into utility scores. However, if some variables used in the full model are not available, it should be better to use only answers from the ODI than from the RMDQ to predict utility scores. The lower correlation we observed between the EQ-5D-5L and RMDQ may be explained by the lower range of values generated by the RMDQ despite it has more questions than the ODI. Since the EQ-5D-5L describes 3125 possible health states it may better correlate with a questionnaire using a higher range of values (0–24 vs 0–100). Also, the dimensions described in the ODI may be considered as closer to that of the EQ-5D-5L.
This finding is consistent with two studies that found similar correlation between EQ-5D-5L and ODI.14,15 Ye et al found a higher correlation (r=−0.828) and Cheung et al found exactly the same correlation (r=−0.770). On the other hand, we have a better correlation than other studies that had only moderate correlations around 0.5.17,19 For the studies that had moderate correlations, they mainly used the EQ-5D-3L, which may explain the lower correlation since the EQ-5D-3L has less sensitivity than the EQ-5D-5L. This indicates that the EQ-5D-5L is potentially better correlated with HRQoL questionnaires in patients with LBP.
A strength of our study is that, to our knowledge, no study has built a prediction model for the EQ-5D-5L, but some were created for EQ-5D-3L.18,20,21 Ye et al and Cheung et al used the EQ-5D-5L, but did not construct predictive models.14,15 In addition, the variability explained by our model is very high and our results and distribution of utility scores and specific questionnaires are similar than other cohorts with the same problematic, even if it is in other regions.14,15 Another strength is that no ceiling effect was observed in our cohort for EQ-5D-5L as in the study by Ye et al where the ceiling effect is very small (0.4%)14 but different from Cheung et al study who have 14% for EQ-5D-5L.15
One limitation for calculating EQ-5D-5L utility scores is that there no value set for the Quebec population, so that we used a value set from Canada where other provinces were disproportionately represented. Another limitation is that women are over-represented in our cohort, although it is recognized that LBP is more prevalent among women. However, women generally represent two-third of LBP8,27,28 and not the three quarters as in our survey, this indicating that women may be more inclined to respond to such surveys. The number of subjects for a survey is quite high and is more than other study analyzing the EQ-5D-5L, but it is maybe not enough to have a representative cohort of the Quebec population with LBP. This may limit the generalization of the results. Another limitation is that the subjects who did not complete the survey until the EQ-5D-5L and the HRQoL-specific questionnaire were older which may underrepresent this population in utility scores. It is also possible that this clientele had more difficulty to complete the online questionnaire and left it before the end.
Conclusion
Despite the high correlation between ODI and EQ-5D-5L, these ones are not interchangeable, as well as for the RMDQ where the correlation was only moderate. Given the high correlation between the values predicted by the regression model and the utility scores, the full model can be used in similar studies for patients with CLBP to estimate the EQ-5D-5L scores from the ODI.
Acknowledgments
We would like to thank all those who participated in this study, particularly members of the Association québécoise de la douleur chronique (AQDC). We also thank the HB-HTA unit of the CIUSSS de l’Estrie-CHUS for its support. TGP is member of the FRQS-funded Centre de recherche de l’Institut universitaire de santé mentale de Montréal.
Funding
This work was supported by the HB-HTA unit of the CIUSSS de l’Estrie – CHUS.
Disclosure
The authors report no conflicts of interest in this work.
References
1. Badley EM, Millstone DB, Perruccio AV. Back pain and co-occurring conditions: findings from a nationally representative sample. Spine. 2018;43(16):E935–E941. doi:10.1097/BRS.0000000000002590
2. Dunn KM, Hestbaek L, Cassidy JD. Low back pain across the life course. Best Pract Res Clin Rheumatol. 2013;27(5):591–600. doi:10.1016/j.berh.2013.09.007
3. Andersson GB. Epidemiological features of chronic low-back pain. Lancet. 1999;354(9178):581–585. doi:10.1016/S0140-6736(99)01312-4
4. Schopflocher D, Taenzer P, Jovey R. The prevalence of chronic pain in Canada. Pain Res Manag. 2011;16(6):445–450. doi:10.1155/2011/876306
5. Moulin DE, Clark AJ, Speechley M, Morley-Forster PK. Chronic pain in Canada–prevalence, treatment, impact and the role of opioid analgesia. Pain Res Manag. 2002;7(4):179–184. doi:10.1155/2002/323085
6. van Hecke O, Torrance N, Smith BH. Chronic pain epidemiology and its clinical relevance. Br J Anaesth. 2013;111(1):13–18. doi:10.1093/bja/aet123
7. Pagé MG, Fortier M, Ware MA, Choinière M. As if one pain problem was not enough: prevalence and patterns of coexisting chronic pain conditions and their impact on treatment outcomes. J Pain Res. 2018;11:237–254. doi:10.2147/JPR
8. Maher C, Underwood M, Buchbinder R. Non-specific low back pain. Lancet. 2017;389(10070):736–747. doi:10.1016/S0140-6736(16)30970-9
9. Allegri M, Montella S, Salici F, et al. Mechanisms of low back pain: a guide for diagnosis and therapy. F1000Res. 2016;5:E679–86. doi:10.12688/f1000research
10. Guyatt GH, Feeny DH, Patrick DL. Measuring health-related quality of life. Ann Intern Med. 1993;118(8):622–629. doi:10.7326/0003-4819-118-8-199304150-00009
11. Fairbank JC, Pynsent PB. The oswestry disability index. Spine. 2000;25(22):2940–2952. doi:10.1097/00007632-200011150-00017
12. Sheahan PJ, Nelson-Wong EJ, Fischer SL. A review of culturally adapted versions of the Oswestry Disability Index: the adaptation process, construct validity, test-retest reliability and internal consistency. Disabil Rehabil. 2015;37(25):2367–2374. doi:10.3109/09638288.2015.1019647
13. Oksuz E. Prevalence, risk factors, and preference-based health states of low back pain in a Turkish population. Spine. 2006;31(25):E968–972. doi:10.1097/01.brs.0000247787.25382.3c
14. Ye Z, Sun L, Wang Q. A head-to-head comparison of EQ-5D-5 L and SF-6D in Chinese patients with low back pain. Health Qual Life Outcomes. 2019;17(1):57. doi:10.1186/s12955-019-1137-6
15. Cheung PWH, Wong CKH, Cheung JPY. Differential psychometric properties of EuroQoL 5-dimension 5-level and short-form 6-dimension utility measures in low back pain. Spine. 2019;44(11):E679–86. doi:10.1097/BRS.0000000000002939
16. Finch AP, Dritsaki M, Jommi C. Generic preference-based measures for low back pain: which of them should be used? Spine. 2016;41(6):E364–374. doi:10.1097/BRS.0000000000001247
17. Johnsen LG, Hellum C, Nygaard ØP, et al. Comparison of the SF6D, the EQ5D, and the oswestry disability index in patients with chronic low back pain and degenerative disc disease. BMC Musculoskelet Disord. 2013;14(1):148. doi:10.1186/1471-2474-14-148
18. Carreon LY, Bratcher KR, Das N, Nienhuis JB, Glassman SD. Estimating EQ-5D values from the Oswestry Disability Index and numeric rating scales for back and leg pain. Spine. 2014;39(8):678–682. doi:10.1097/BRS.0000000000000220
19. Suarez-Almazor ME, Kendall C, Johnson JA, Skeith K, Vincent D. Use of health status measures in patients with low back pain in clinical settings. Comparison of specific, generic and preference-based instruments. Rheumatology. 2000;39(7):783–790. doi:10.1093/rheumatology/39.7.783
20. Soer R, Reneman MF, Speijer BLGN, Coppes MH, Vroomen PCAJ. Clinimetric properties of the EuroQol-5D in patients with chronic low back pain. Spine J. 2012;12(11):1035–1039. doi:10.1016/j.spinee.2012.10.030
21. Madan J, Khan KA, Petrou S, Lamb SE. Can mapping algorithms based on raw scores overestimate QALYs Gained by treatment? A comparison of mappings between the Roland-Morris disability questionnaire and the EQ-5D-3L based on raw and differenced score data. Pharmacoeconomics. 2017;35(5):549–559. doi:10.1007/s40273-016-0483-z
22. Poder TG, Beffarat M, Benkhalti M, Ladouceur G, Dagenais P. A discrete choice experiment on preferences of patients with low back pain about non-surgical treatments: identification, refinement and selection of attributes and levels. Patient Prefer Adherence. 2019;13:933–940. doi:10.2147/PPA.S201401
23. Roland M, Morris R. A study of the natural history of back pain. Part I: development of a reliable and sensitive measure of disability in low-back pain. Spine. 1983;8(2):141–144. doi:10.1097/00007632-198303000-00004
24. Xie F, Pullenayegum E, Gaebel K, et al. A time trade-off-derived value set of the EQ-5D-5L for Canada. Med Care. 2016;54(1):98–105. doi:10.1097/MLR.0000000000000447
25. de Vet HCW, Terwee CB, Mokkink LB, Knol DL. Measurement in Medicine: a Practical Guide. London: Cambridge University Press; 2011.
26. Ratner B. The correlation coefficient: its values range between +1/−1, or do they? J Target Meas Anal Mark. 2009;17(2):139–142. doi:10.1057/jt.2009.5
27. D’Astolfo CJ, Humphreys BK. A record review of reported musculoskeletal pain in an Ontario long term care facility. BMC Geriatr. 2006;6(1):5. doi:10.1186/1471-2318-6-5
28. Konstantinou K, Dunn KM, Ogollah R, Vogel S, Hay EM. ATLAS study research team. Characteristics of patients with low back and leg pain seeking treatment in primary care: baseline results from the ATLAS cohort study. BMC Musculoskelet Disord. 2015;16(1):332. doi:10.1186/s12891-015-0787-8
 © 2020 The Author(s). This work is published and licensed by Dove Medical Press Limited. The
full terms of this license are available at https://www.dovepress.com/terms
and incorporate the Creative Commons Attribution
- Non Commercial (unported, 3.0) License.
By accessing the work you hereby accept the Terms. Non-commercial uses of the work are permitted
without any further permission from Dove Medical Press Limited, provided the work is properly
attributed. For permission for commercial use of this work, please see paragraphs 4.2 and 5 of our Terms.
© 2020 The Author(s). This work is published and licensed by Dove Medical Press Limited. The
full terms of this license are available at https://www.dovepress.com/terms
and incorporate the Creative Commons Attribution
- Non Commercial (unported, 3.0) License.
By accessing the work you hereby accept the Terms. Non-commercial uses of the work are permitted
without any further permission from Dove Medical Press Limited, provided the work is properly
attributed. For permission for commercial use of this work, please see paragraphs 4.2 and 5 of our Terms.