Back to Journals » Cancer Management and Research » Volume 18

Pre-Treatment HBV Activation Modulates Circulating Immune Markers in Hepatocellular Carcinoma Patients Undergoing TACE Plus ICIs and Anti-VEGF Antibodies/TKIs
Authors Qin L, Zhu L, Wang Y, Yang H, Shen J ![]() , Zhu X
, Zhu X
Received 15 September 2025
Accepted for publication 9 December 2025
Published 16 February 2026 Volume 2026:18 563546
DOI https://doi.org/10.2147/CMAR.S563546
Checked for plagiarism Yes
Review by Single anonymous peer review
Peer reviewer comments 4
Editor who approved publication: Dr Chien-Feng Li
Lihao Qin,1,* Linzhou Zhu,2,* Yu Wang,1,* Hao Yang,1 Jian Shen,1 Xiaoli Zhu1
1Department of Interventional Radiology, The First Affiliated Hospital of Soochow University, Suzhou, 215006, People’s Republic of China; 2Department of Epidemiology and Biostatistics, School of Public Health, Medical College of Soochow University, Suzhou, 215021, People’s Republic of China
*These authors contributed equally to this work
Correspondence: Xiaoli Zhu, Department of Interventional Radiology, The First Affiliated Hospital of Soochow University, Suzhou, 215006, People’s Republic of China, Email [email protected]
Objective: To evaluate the impact of pre-treatment hepatitis B virus (HBV) activation on peripheral immune status and treatment response in unresectable hepatocellular carcinoma (uHCC) patients undergoing transarterial chemoembolization (TACE) combined with immune checkpoint inhibitors (ICIs) and anti-vascular endothelial growth factor (anti-VEGF) antibodies or tyrosine kinase inhibitors (TKIs), and to explore the underlying immunological basis.
Methods: This single-center retrospective study included uHCC patients treated with TACE plus ICIs and anti-VEGF antibodies or TKIs between July 2019 and September 2024. Patients were categorized into inactive and active HBV infection groups based on pre-treatment HBV DNA levels. A 1:2 propensity score matching (PSM) was used to minimize confounding. The primary outcome was overall survival (OS), and secondary outcomes included progression-free survival (PFS), objective response rate (ORR), and disease control rate (DCR). Peripheral immune markers were assessed at baseline (Cycle0), Cycle2, and Cycle4. Intergroup comparisons and regression analyses were performed to examine associations among HBV activation, immune changes, and objective response (OR).
Results: A total of 70 patients were enrolled, and 53 were retained after PSM (26 with inactive and 27 with active HBV infection). Median follow-up was 16.6 months; median OS and PFS were 30.1 and 10.6 months, respectively. At Cycle0, serum IgA levels were higher in the active HBV infection group [3.38 (2.72– 4.60) vs 2.70 (2.21– 3.32) g/L, P = 0.018], and HBV DNA showed a linear association with baseline IgA (P = 0.042). IgA increased significantly from Cycle0 to Cycle2 in the inactive HBV infection and OR groups but not in their counterparts. ΔIgA (Cycle2–Cycle0) was independently associated with OR (OR = 0.446, P = 0.041), while baseline IgA independently predicted ΔIgA (β = – 0.260, P = 0.011). No significant OS or PFS differences were observed between HBV activation groups overall, although a trend toward worse OS appeared in the nOR subgroup (P = 0.058).
Conclusion: Pre-treatment HBV activation is linked to altered baseline immune profiles, particularly elevated IgA, and influences early IgA dynamics. Early IgA changes independently predict early treatment response, supporting the integration of IgA-based immune profiling into personalized strategies for HBV-related uHCC.
Keywords: hepatocellular carcinoma, hepatitis B virus, TACE, prognosis, immune microenvironment
Introduction
Hepatocellular carcinoma (HCC) is a leading cause of cancer-related mortality worldwide, with particularly high incidence in China, where chronic hepatitis B virus (HBV) infection accounts for over 60% of cases.1 HBV contributes to hepatocarcinogenesis through genomic instability, chronic inflammation, and immune dysregulation.2,3 In recent years, transarterial chemoembolization (TACE) combined with immune checkpoint inhibitors (ICIs) and anti-angiogenic agents—such as anti-vascular endothelial growth factor (anti-VEGF) or multi-target tyrosine kinase inhibitors— has become a first-line treatment for unresectable HCC (uHCC), offering synergistic benefits.4 However, treatment response varies significantly among patients, likely due in part to heterogeneity in baseline immune status.5 Understanding the determinants of pre-treatment immune profiles is therefore critical for optimizing immunotherapy outcomes.
Recent clinical and translational studies have shown that, in patients with uHCC treated with ICIs-based combinations, including TACE plus ICIs and anti-VEGF antibodies/TKIs, the host immune milieu is a major determinant of treatment efficacy.6–8 Peripheral immune biomarkers, such as lymphocyte subsets, neutrophil-to-lymphocyte ratio, circulating immunoglobulins, and cytokines (eg, interleukin-6), together with composite immune signatures derived from these parameters, have been associated with baseline prognosis, early objective response, and survival in this setting.6,7 Moreover, dynamic on-treatment changes in these peripheral markers are increasingly recognized as convenient, minimally invasive indicators of sensitivity or resistance to ICIs-based combination therapy in uHCC.8
HBV activation refers to the resurgence of viral replication activity following a prior state of chronic infection or low-level viral replication, typically manifested as a detectable or rising HBV DNA level.9 This phenomenon may occur during immunosuppressive therapy or may already be present in an “active state” prior to the initiation of treatment.10 Accumulating evidence indicates that HBV activation not only amplifies virus-associated inflammatory responses but may also remodel both peripheral and tumor-infiltrating immune profiles.11 These alterations may ultimately lower the threshold for effective immune activation and compromise the foundation for immunotherapy efficacy in patients receiving ICIs and anti-VEGF agents.
Although these mechanisms have been increasingly elucidated, there is still a lack of systematic clinical studies assessing whether pre-treatment HBV activation status exerts a quantifiable impact on the immune status of HCC patients undergoing TACE in combination with immune and anti-angiogenic therapies. In particular, dynamic assessments integrating clinical parameters, HBV viral load, and peripheral immune profiling remain scarce. Furthermore, it remains unclear whether HBV activation leads to specific immune marker alterations or whether these changes are associated with subsequent treatment response.
To address this gap, the present study employed a propensity score matching (PSM) approach to construct a clinically balanced cohort of HCC patients with and without HBV activation prior to treatment. All patients received TACE combined with ICIs and Anti-VEGF Antibodies/TKIs therapy. This study aims to clarify whether HBV activation constitutes an immunomodulatory factor affecting immune homeostasis and treatment preparedness, thereby providing a theoretical basis and biological rationale for immunotherapy evaluation and precision management in HBV-related HCC.
Materials and Methods
Patient Selection
This retrospective study was approved by both the Institutional Review Board and the Ethics Committee. Due to the retrospective design, the requirement for informed consent was waived. Between July 1, 2019, and September 1, 2024, patients diagnosed with HCC who received TACE in combination with ICIs and anti-VEGF antibodies or TKIs were enrolled. The inclusion criteria were as follows: (1) HCC diagnosis established histologically or clinically based on the guidelines of the American Association for the Study of Liver Diseases (AASLD); (2) Barcelona Clinic Liver Cancer (BCLC) stage B or C; (3) Child-Pugh liver function classification A or B, without signs of uncontrolled ascites or hepatic encephalopathy; (4) an Eastern Cooperative Oncology Group (ECOG) performance status score of 0 or 1; and (5) receipt of combination therapy consisting of TACE, ICIs, and anti-VEGF antibodies/TKIs.
Patients were excluded if they met any of the following criteria: (1) a confirmed diagnosis of intrahepatic cholangiocarcinoma (ICC), combined hepatocellular-cholangiocarcinoma, sarcomatoid HCC, or the fibrolamellar variant of hepatocellular carcinoma; (2) presence of other concurrent malignancies besides HCC; (3) prior exposure to any systemic anti-cancer therapy for HCC before initiation of the index TACE plus ICIs and anti-VEGF antibodies/TKIs regimen (including, but not limited to, immune checkpoint inhibitors, anti-VEGF therapies, tyrosine kinase inhibitors); (4) incomplete hematologic or immunologic data that precluded outcome evaluation or the analysis of longitudinal immune marker changes; (5) follow-up duration of less than three months after initiation of combination therapy.
Propensity Score Matching
To reduce baseline confounding and achieve covariate balance between groups, a 1:2 PSM approach was employed to construct a clinically comparable cohort of HCC patients with and without HBV activation prior to treatment.12 Propensity scores were estimated using a logistic regression model based on a comprehensive set of clinically relevant variables (variables were selected based on clinical relevance and previous literature),13–15 including age, sex, body mass index (BMI), Child–Pugh score, Eastern Cooperative Oncology Group performance status (ECOG PS), presence of liver cirrhosis, and laboratory indicators including total bilirubin (T-BIL), alanine aminotransferase (ALT), aspartate aminotransferase (AST), albumin (ALB), international normalized ratio (INR), serum creatinine (Cr), alpha-fetoprotein (AFP), albumin–bilirubin (ALBI) score, and model for end-stage liver disease (MELD) score. Other covariates included lactate dehydrogenase (LDH), alkaline phosphatase (ALP), diabetes mellitus, Barcelona Clinic Liver Cancer (BCLC) stage, extrahepatic spread, macrovascular invasion, and tumor morphology (nodular vs massive type). Nearest-neighbor matching without replacement was performed using a 1:2 ratio (inactive HBV infection: active HBV infection) and a caliper width of 0.2 standard deviations of the logit of the propensity score, a commonly recommended threshold to minimize residual bias while retaining adequate matched pairs. Post-matching balance was evaluated by comparing baseline characteristics between groups, confirming that all covariates were well matched with no significant residual differences.
TACE Procedure
All TACE procedures were conducted by two senior interventional radiologists, each with more than ten years of professional experience. To minimize operator-dependent variability and enhance embolization accuracy, a unified precision TACE protocol was adopted.16 Additional TACE sessions were administered on an “as-needed” basis, guided by dynamic fluctuations in tumor biomarkers and imaging assessments. TACE treatment was discontinued upon meeting any of the following criteria: (1) deterioration to Child-Pugh class C, indicated by complications such as treatment-resistant ascites, marked jaundice, hepatic encephalopathy, or hepatorenal syndrome; (2) an ECOG performance status greater than 2; or (3) persistent progression of target lesions following three consecutive TACE procedures, as evaluated by the modified Response Evaluation Criteria in Solid Tumors (mRECIST).17
ICIs and Anti-VEGF Antibodies/TKIs Administration
All patients enrolled in this study received combination therapy comprising immune checkpoint inhibitors (ICIs) together with either anti-VEGF monoclonal antibodies or tyrosine kinase inhibitors (TKIs), all of which were approved by the National Medical Products Administration and routinely used in clinical practice in China. The ICIs administered in this cohort included camrelizumab and sintilimab. Anti-VEGF therapy consisted of bevacizumab, which was given concurrently with ICIs. For patients receiving oral TKIs, including lenvatinib and sorafenib, treatment was temporarily suspended for 2–3 days before and after each TACE session to reduce the risk of procedure-related complications. All medications were administered at standard dosages and intervals in accordance with national treatment guidelines and institutional protocols. The combined regimen of ICIs and anti-angiogenic agents was continued until radiologic confirmation of disease progression or the development of intolerable adverse effects.
Follow-Up and Data Collection
The primary outcome was overall survival (OS), while secondary outcomes included progression-free survival (PFS), objective response rate (ORR), and disease control rate (DCR), with tumor response assessed at the first treatment evaluation based on mRECIST criteria.17 Following the initiation of combination therapy, patients were monitored every 6 to 9 weeks. Each follow-up visit included imaging assessments—such as contrast-enhanced abdominal magnetic resonance imaging (MRI) and non-contrast-enhanced chest and abdominal computed tomography (CT)—along with a comprehensive panel of laboratory investigations. These tests encompassed complete blood counts, serum biochemistry, tumor marker profiling, HBV-DNA quantification, cytokine measurements, immune status assessment, chest pain panels, and thyroid function testing.
ICIs were administered every three weeks, with each administration defined as one treatment cycle. Prior to each cycle, patients underwent laboratory evaluations that included hematologic, biochemical, and immunologic parameters, as well as assessments for chest-related symptoms and thyroid function. The baseline, second, and fourth cycles were referred to as Cycle0, Cycle2, and Cycle4, respectively. Immune and biochemical data were collected at Cycle0, Cycle2, Cycle4, the first radiological evaluation time point, and—if applicable—at the time of disease progression (PD), and were subsequently used for longitudinal analyses.
Peripheral Immune Markers
Peripheral blood samples were collected before TACE and every three weeks before ICI treatment. Immune profiling involved the analysis of lymphocyte subsets, including the proportions of CD3+ T cells, CD3+CD4+ helper T cells, CD3+CD8+ cytotoxic T cells, CD3−CD16+56+ natural killer (NK) cells, and CD3−CD19+ B cells, as well as the CD4+/CD8+ ratio. Additional immunological markers assessed included immunoglobulin λ (Igλ) and κ (Igκ), complement components C3 and C4, and immunoglobulin classes M (IgM), A (IgA), and G (IgG), along with complement factor B (CFB). The neutrophil-to-lymphocyte ratio (NLR) is also included.
Peripheral blood mononuclear cells (PBMCs) were isolated by density gradient centrifugation using the Ficoll-Paque technique and resuspended at a final concentration of 1×10⁶ cells/mL. Flow cytometric analysis was conducted on a FACScan Caliber system (Becton Dickinson, Franklin Lakes, NJ, USA). Serum levels of immunoglobulins and complement proteins were quantified via immune turbidimetric assays. The neutrophil-to-lymphocyte ratio (NLR) was derived from standard complete blood count data.
Relevant Definitions
The criteria for initiating combination therapy were defined as the administration of the first dose of ICIs either concurrently with the initial TACE procedure or within a 1-month interval. TKIs were required to be administered concurrently with either TACE or ICIs. Patients were required to receive a minimum of four cycles of ICI therapy (with one cycle defined as a 3-week interval) following the initial TACE session. Survival data were updated through January 2025. OS was calculated from the date of diagnosis to the date of death from any cause or the last follow-up, while PFS was defined as the duration from diagnosis to either documented disease progression or death, whichever occurred first. Treatment response was evaluated according to the Mrecist at the fourth treatment cycle or approximately three months after therapy initiation.17 This first radiologic assessment typically occurred at the third-month mark or the fourth ICI cycle. Based on the initial treatment response, patients were stratified into PD, stable disease (SD), or objective response (OR) groups, the latter including complete response (CR) and partial response (PR). All enrolled HCC patients had chronic HBV infection as the underlying etiology. Clinically meaningful HBV activation was defined as a serum HBV DNA level exceeding 60 IU/mL in the presence of hepatitis B surface antigen (HBsAg) positivity. In clinical practice, HBV activation or high viral replication activity is typically manifested as a detectable or rising HBV DNA level. In the present study, because historical HBV DNA data were not uniformly available for all patients, we operationally defined “HBV activation” as a pre-treatment HBV DNA level ≥ 60 IU/mL, and “inactive HBV infection” as HBV DNA < 60 IU/mL.
Statistical Analysis
All analyses were performed using SPSS version 23.0 (IBM Corp., Armonk, NY, USA) and R software (version 4.3.0; R Foundation for Statistical Computing, Vienna, Austria). Propensity score matching was conducted using the MatchIt package (version 4.6.0), and survival analyses—including Kaplan–Meier estimation and Cox proportional hazards modeling—were performed using the survival package (version 3.7–0) and survminer package (version 0.4.9). Continuous variables were expressed as means with 95% confidence intervals, and categorical variables as counts and percentages. The Shapiro–Wilk test was used to assess data normality. For normally distributed variables, differences were analyzed using the chi-square test or two-tailed paired Student’s t-test. For non-normally distributed data, the Kruskal–Wallis test or Mann–Whitney U-test was applied. Overall survival was estimated using the Kaplan–Meier method, and differences between survival curves were compared using the Log rank test. Simple linear regression was used to evaluate changes in immune indicators across treatment timepoints. PSM was used to balance baseline characteristics between HCC patients with and without HBV activation. Statistics were judged to be significant when p values were less than 0.05.
Results
Patient Selection
From July 1, 2019, to September 1, 2024, a total of 168 patients undergoing TACE plus ICIs and anti-VEGF antibodies/TKIs were screened for eligibility. Patients were excluded for the following reasons: histologically confirmed intrahepatic cholangiocarcinoma, mixed hepatocellular carcinoma, sarcomatoid HCC, or fibrolamellar HCC (n = 5); coexistence of other malignancies (n = 5); prior systemic therapy (n = 11); incomplete hematological or immunological data, resulting in insufficient follow-up information (n = 73); and follow-up duration of less than 3 months after initiation of combination therapy (n = 4). After applying these criteria, 70 patients with complete clinical and follow-up data were included in the final analysis.
Efficacy and Safety
As of the last follow-up on January 1, 2025, the median follow-up duration was 16.6 months (interquartile range [IQR]: 10.1–29.1). The median OS for the cohort was 30.1 months (95% confidence interval [CI]: 18.3–32.1), and the median PFS was 10.6 months (95% CI: 8.3–12.7). At the first treatment assessment, the ORR was 51.4%, and DCR reached 87.1%. Among the 70 patients evaluated, 9 were classified as having PD, 25 as having SD, 35 achieved a PR, and 1 achieved a CR. According to the best overall response achieved during the entire treatment course, 4 patients reached CR, 43 achieved PR, 18 maintained SD.
Adverse events observed during the study were generally mild and manageable, with no treatment-related deaths recorded. The overall incidence of adverse events was 57.1% (40 out of 70 patients), with the most common events being fever (54.3%), abdominal pain (44.3%), liver function abnormalities (18.6%), hand-foot skin reaction (21.4%), hypertension (14.3%), thrombocytopenia (7.1%), proteinuria (15.7%), and immune-related myocarditis (1.4%).
Characteristics of the Population
A total of 70 patients with chronic HBV infection were included, comprising 41 with inactive HBV infection and 29 with active HBV infection prior to PSM. Before matching, the active HBV infection group had a significantly higher proportion of patients with diabetes (51.7% vs 24.4%, P = 0.035), and elevated liver transaminases, including ALT (median 44.1 vs 31.3 U/L, P = 0.026) and AST (median 53.6 vs 41.7 U/L, P = 0.031). No significant differences were observed in other clinical variables (all P > 0.05). After 1:2 PSM, 53 patients were included in the matched cohort, comprising 26 with inactive HBV infection and 27 with active HBV infection. All baseline characteristics were comparable between the two groups, with no statistically significant differences observed across any clinical variables (all P > 0.05), indicating successful baseline balancing following PSM (Table 1).
Survival Assessment
Kaplan–Meier analysis revealed no significant difference in OS between patients with active and inactive HBV infection in the total matched cohort (P = 0.790). Subgroup analysis showed that in the OR group, OS did not differ between the two HBV infection statuses (P = 0.950). However, in the non-objective response (Non-OR) group, a trend toward worse survival was observed in patients with active HBV infection compared to those with inactive HBV infection, although the difference did not reach statistical significance (P = 0.058, Figure 1).
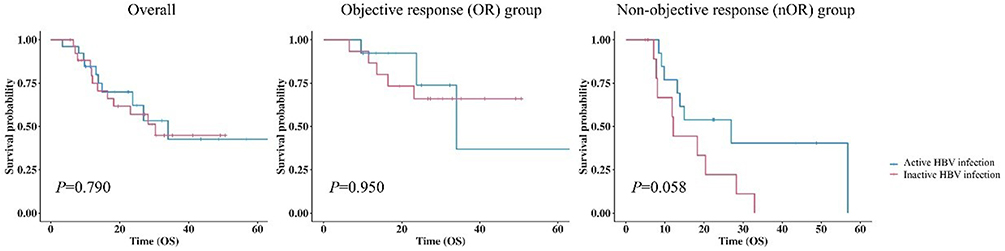 |
Figure 1 Kaplan-Meier curves for inactive HBV infection and active HBV infection patients after propensity score matching. |
Comparison of Peripheral Immune Profiles Between Patients with Inactive and Active HBV Infection
After PSM, peripheral immune profiles were compared between patients with active and inactive HBV infection at Cycle0, Cycle2, and Cycle4. A significantly higher IgA level was observed in the active HBV infection group at Cycle0 [3.38 (2.72, 4.60) vs 2.70 (2.21, 3.32) g/L, P = 0.018]. No significant differences were detected at subsequent treatment cycles (all P>0.05). In addition, no statistically significant differences were found in any of the other peripheral immune markers across all time points between the two groups (all P>0.05, Table 2).
Association Between Serum IgA Levels and Pre-Treatment HBV Viral Load: Linear Regression and Sensitivity Analyses
Linear regression analysis revealed a statistically significant positive correlation between baseline serum IgA levels and HBV DNA level (Figure 2A, P = 0.0418). A similar trend was observed when HBV DNA levels were log-transformed, yielding a regression equation of IgA = 2.10 + 0.44*Log10 (HBV DNA), with P = 0.0478 and modest explanatory power (Figure 2B). To evaluate robustness, sensitivity analysis was conducted by sequentially removing extreme values. The association lost statistical significance when two or more outliers were excluded, and the R2 value decreased markedly (Table 3), suggesting that the observed relationship is sensitive to the influence of high-leverage data points.
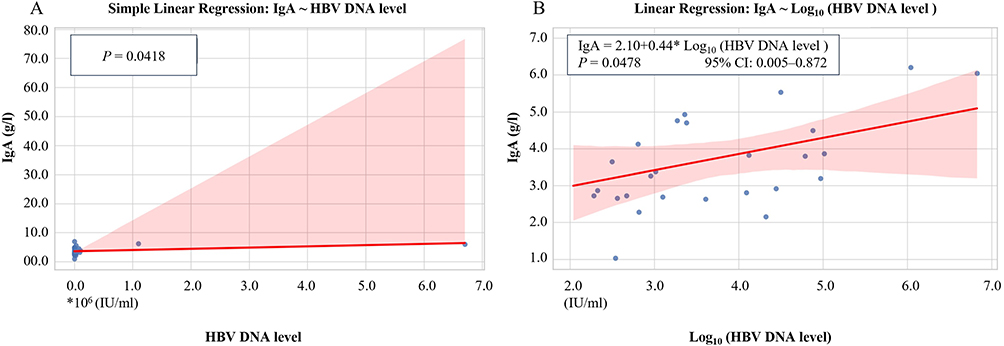 |
Figure 2 Linear Regression Between Serum IgA Levels and HBV DNA Load Before Treatment in HCC Patients After Propensity Score Matching. (A) Simple linear regression between serum IgA levels and raw HBV DNA Levels (IU/mL). (B) Linear regression model using log-transformed HBV DNA levels to address the scale disparity between viral load and IgA concentration. Logarithmic transformation was applied to normalize data distribution and improve model interpretability. Shaded areas represent the 95% confidence interval of the regression line. A significant positive association was observed between log10 (HBV DNA) and IgA levels (P = 0.0478). |
Treatment-Related Dynamic Alterations in Peripheral Immune Markers Stratified by HBV Activation and Therapeutic Response
Among the 15 immune markers analyzed, a significant difference in IgA variation (Cycle2 – Cycle0) was observed between groups: the inactive HBV infection group showed a greater increase in IgA levels compared to the active HBV infection group [1.08 (0.74, 1.64) vs 0.49 (0.01, 1.25) g/L, P = 0.0382]. No other immune marker exhibited significant intergroup differences during either Cycle2–Cycle0 or Cycle4–Cycle2 (all P > 0.05, Table 4).
Among patients with inactive HBV infection, those who achieved an OR exhibited a significantly greater increase in IgA levels from Cycle0 to Cycle2 compared to non-OR (SD + PD) patients [1.23 (0.92, 1.39) vs 0.18 (−0.01, 0.81) g/L, P = 0.014]. However, no significant differences in baseline IgA or its early changes (Cycle2-Cycle0) were observed between OR and non-OR subgroups within the active HBV infection group (P = 0.856 and P = 0.150, respectively, Table 5).
Linear regression analysis further confirmed distinct trends in IgA elevation from Cycle0 to Cycle2 across subgroups. A significant upward trend in IgA was observed in the inactive HBV group (P = 0.023), but not in the active HBV group (P = 0.079). Similarly, patients with an OR exhibited a significant increase in IgA levels over time (P = 0.001), whereas no significant change was observed in the non-OR group (P = 0.294, Figure 3).
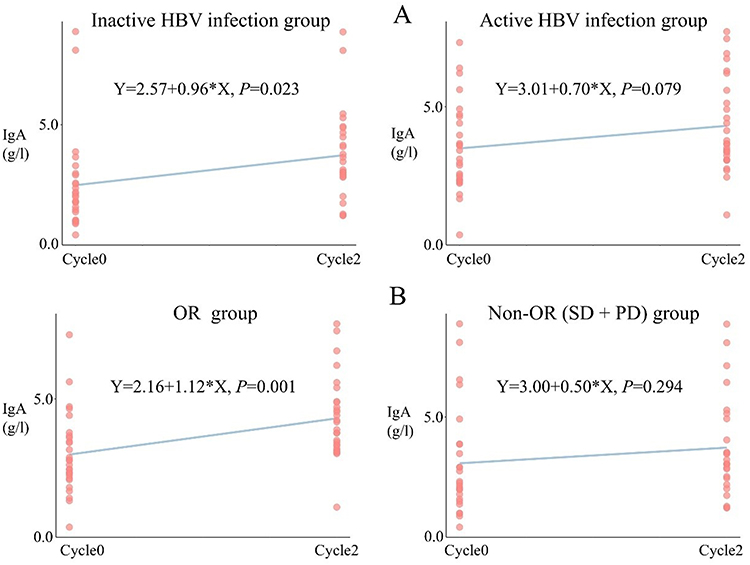 |
Figure 3 Linear Trend of Serum IgA Levels From Cycle0 to Cycle2 Stratified by HBV Infection Status and Treatment Response. (A) Linear change in serum IgA levels between Cycle0 and Cycle2 in patients with inactive versus active HBV infection. (B) Linear change in IgA levels from Cycle0 to Cycle2 in OR group versus Non-OR group, including SD and PD. Cycle0 is the baseline; Cycle2 and Cycle4 are the second and fourth treatment cycles. Abbreviations: IgA, immunoglobulin A; OR, objective response; Non-OR, non-responders; PD, progressive disease; SD, stable disease. |
Associations Between Immune Marker Changes and Treatment Response
From Cycle0 to Cycle2, patients in the OR group exhibited significant decreases in CD3⁺CD19⁺ cells (P = 0.0099), alongside significant increases in Igλ (P = 0.0046), Igκ (P = 0.0103), IgA (P = 0.0014), and IgG (P = 0.0089) levels. In contrast, none of these markers showed statistically significant changes in the non-OR (SD + PD) group over the same period (Table 6).
Predictive Significance and Upstream Influences of Early IgA Changes
Univariate logistic regression analysis showed that both ΔIgA (Cycle2 − Cycle0; OR = 0.43, 95% CI: 0.12–0.83, P = 0.022) and AFP ≥ 400 μg/L (OR = 3.25, 95% CI: 1.04–10.90, P = 0.047) were significantly associated with treatment response, while multivariate analysis further identified only ΔIgA as an independent predictive factor (OR = 0.47, 95% CI: 0.21–0.91, P = 0.041, Table 7).
Multivariate linear regression was performed to identify factors associated with ΔIgA (Cycle2 − Cycle0). Baseline IgA was the only variable significantly correlated with ΔIgA (Estimate = −0.2599, P = 0.011), while all other variables were not significant (all P > 0.05, Table 8). Figure 4 illustrates the impact of HBV infection status on IgA distribution and tumor response to TACE in combination with ICIs and anti-VEGF antibodies/TKIs.
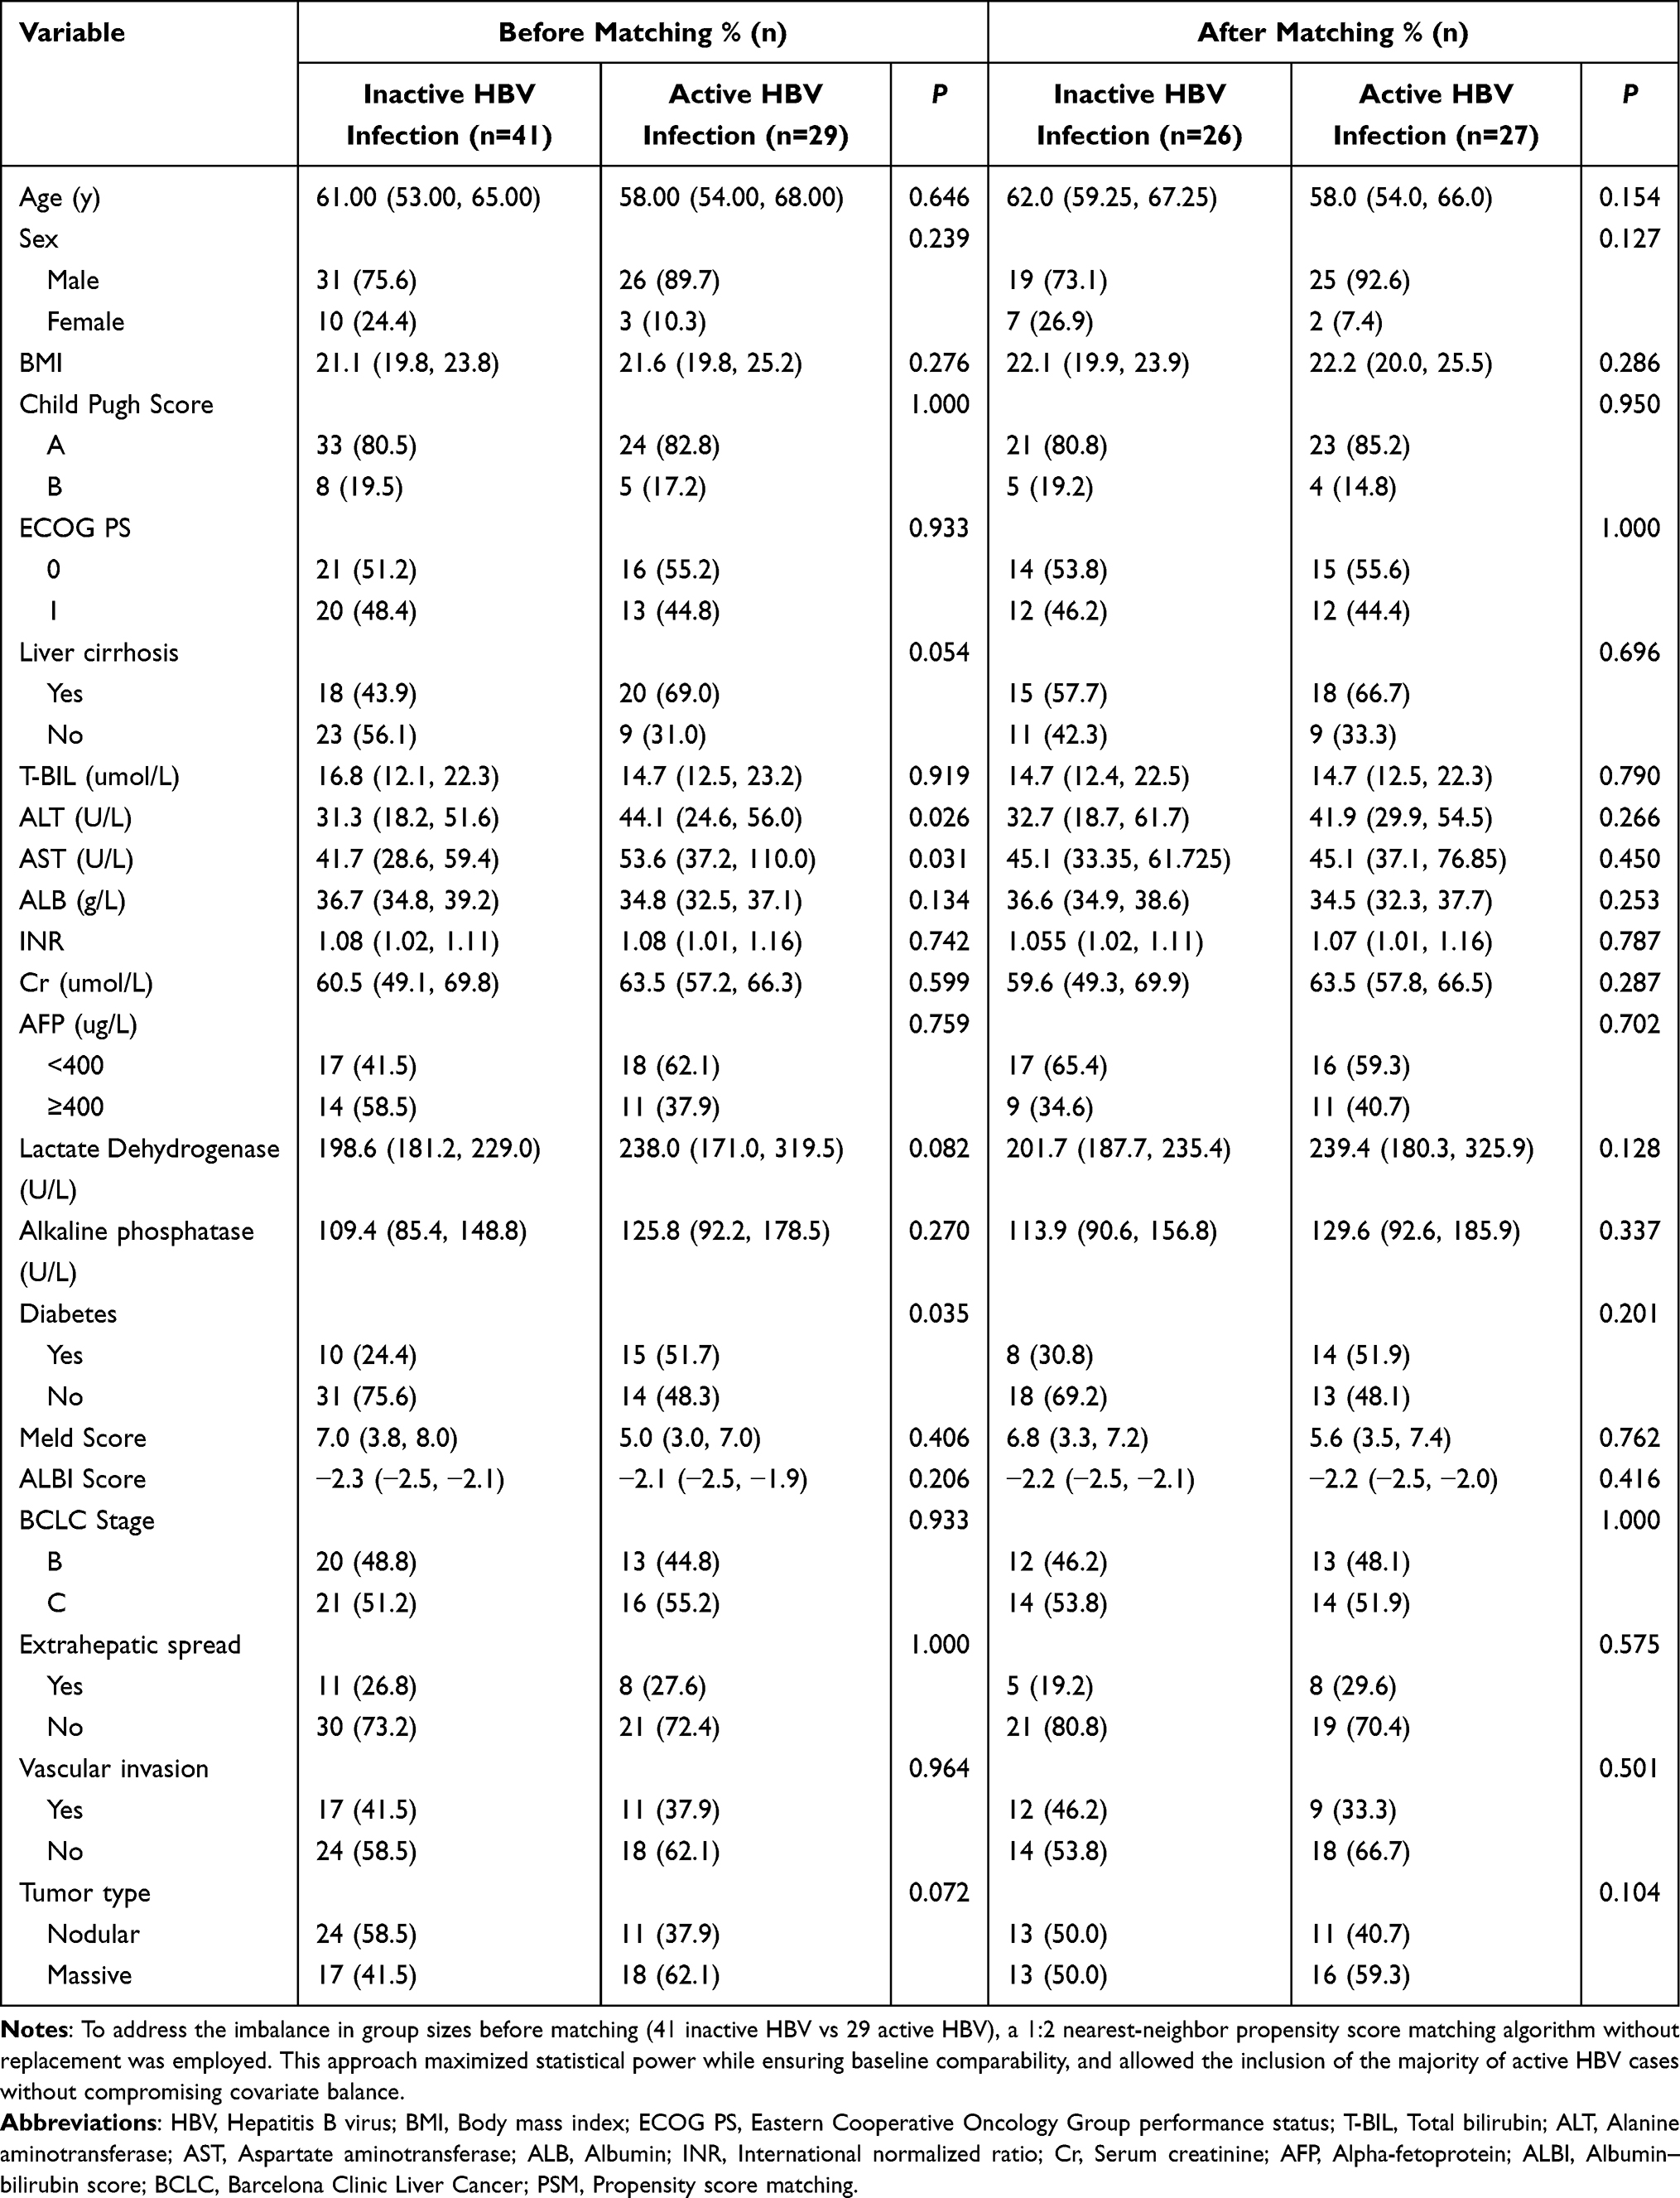 |
Table 1 Characteristics of Active HBV Infection and Inactive HBV Infection Patients Before and After PSM |
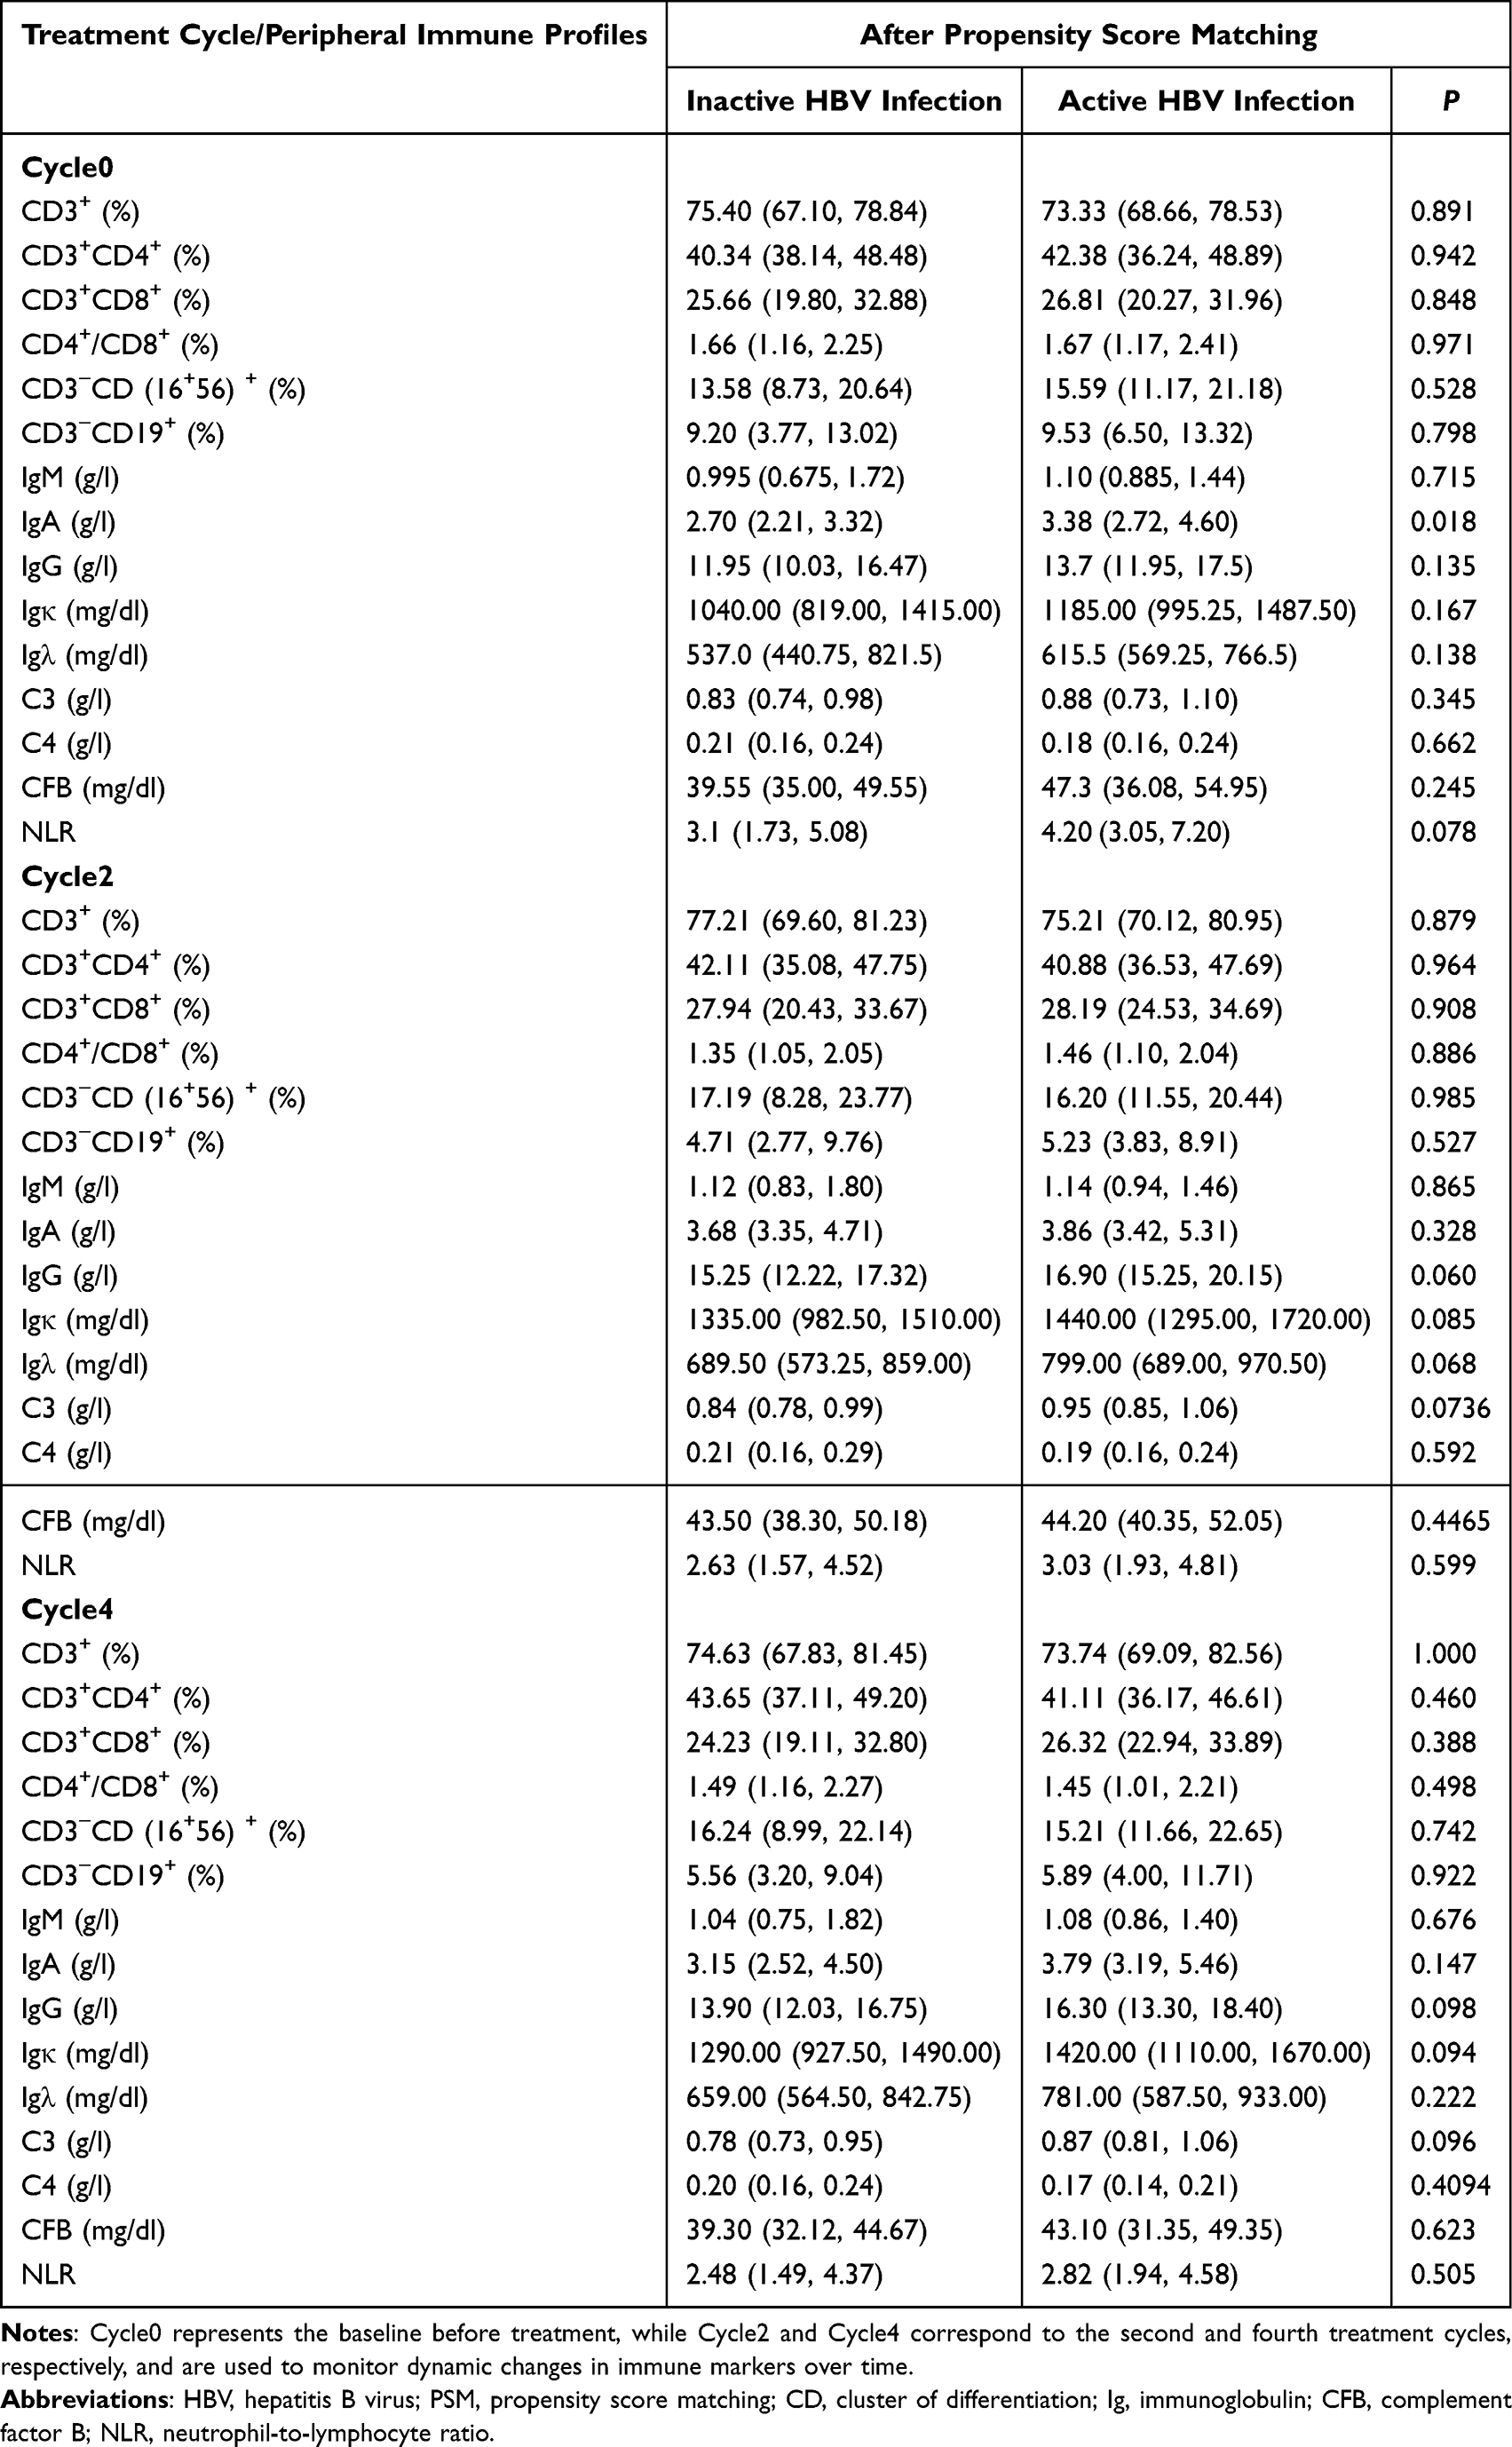 |
Table 2 Immune Differences Between Active and Inactive HBV Infection Following PSM |
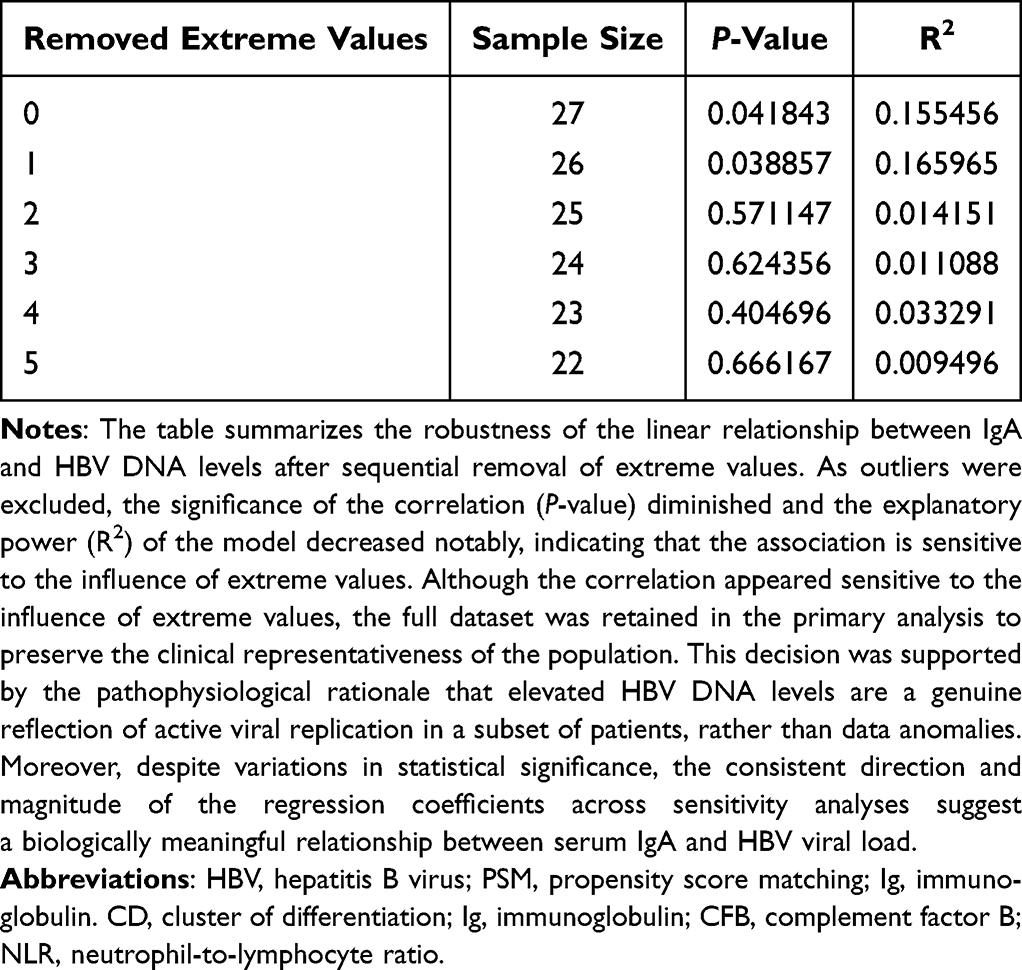 |
Table 3 Sensitivity Analysis of Simple Linear Regression (IgA~ HBV DNA Level) |
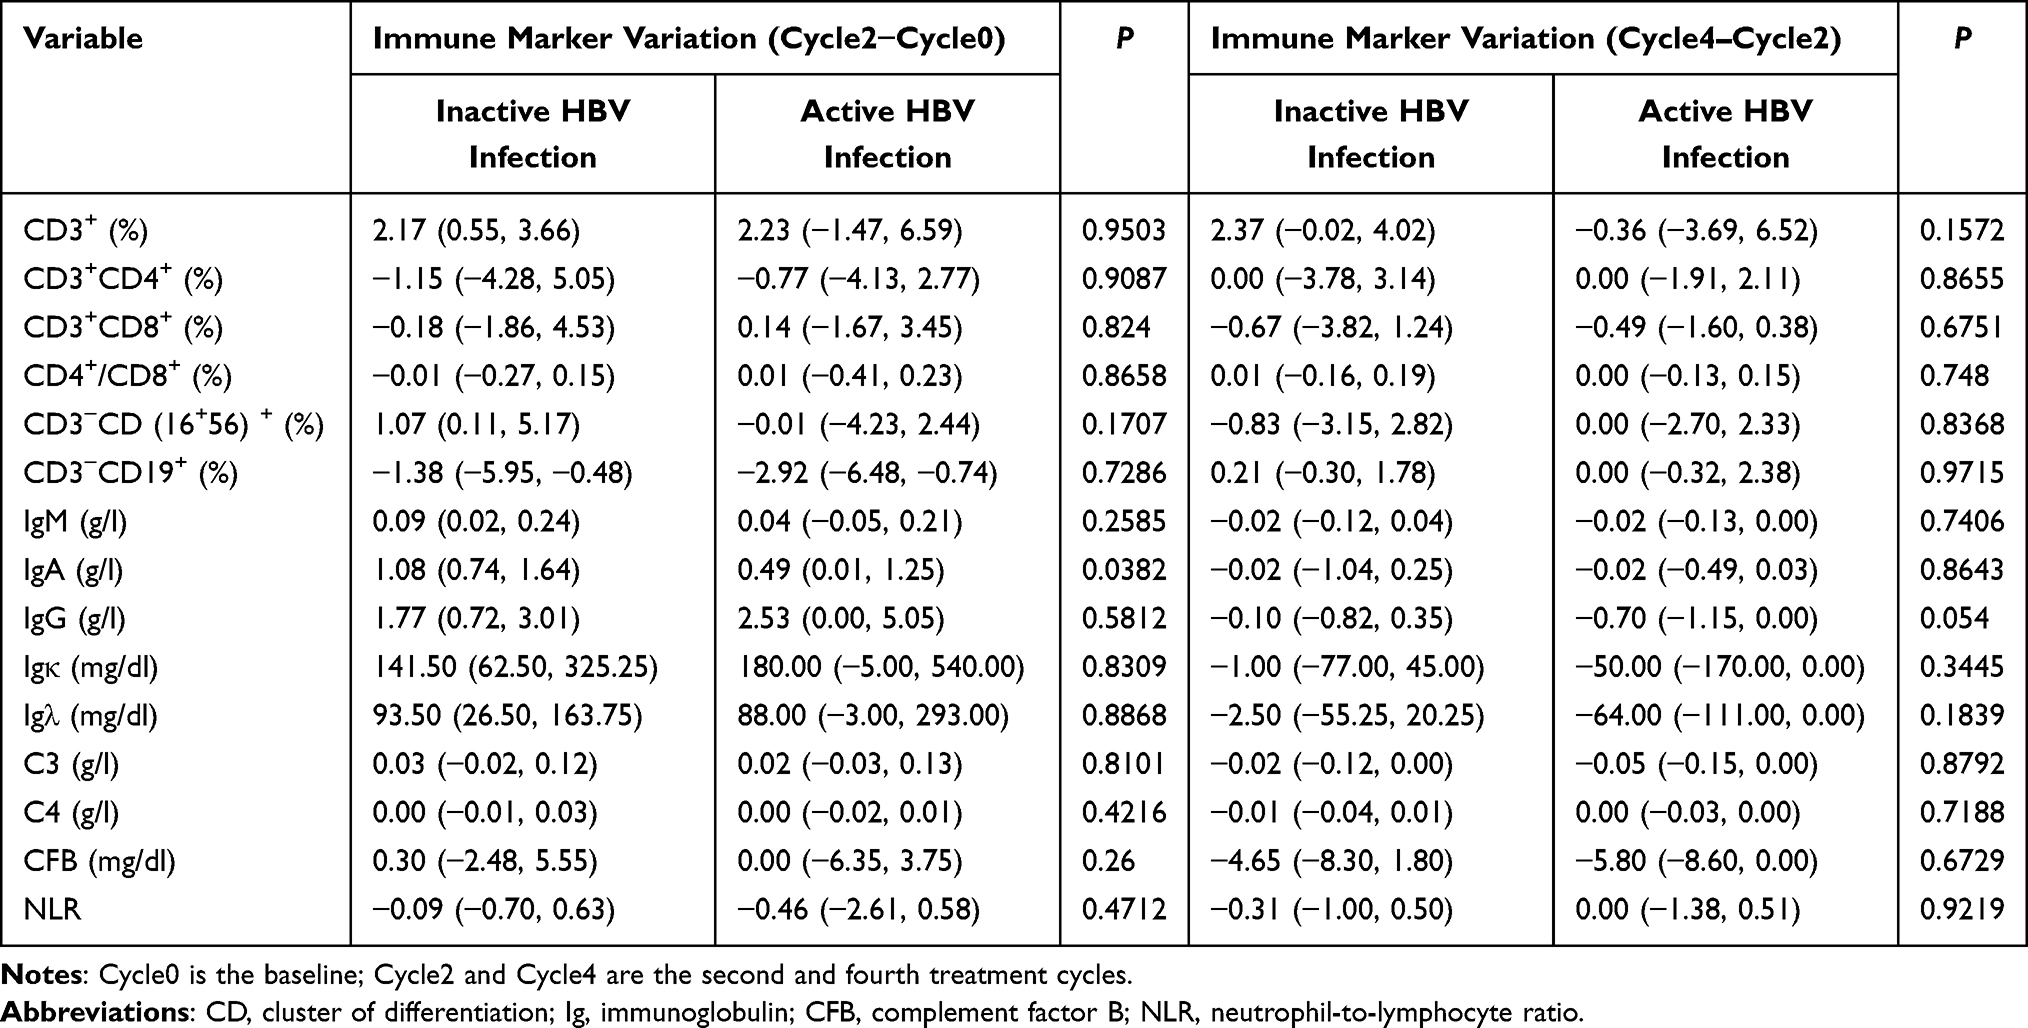 |
Table 4 Comparison of Peripheral Immune Marker Variations Between Active and Inactive HBV Infection Groups During Cycle2–Cycle0 and Cycle4–Cycle2 |
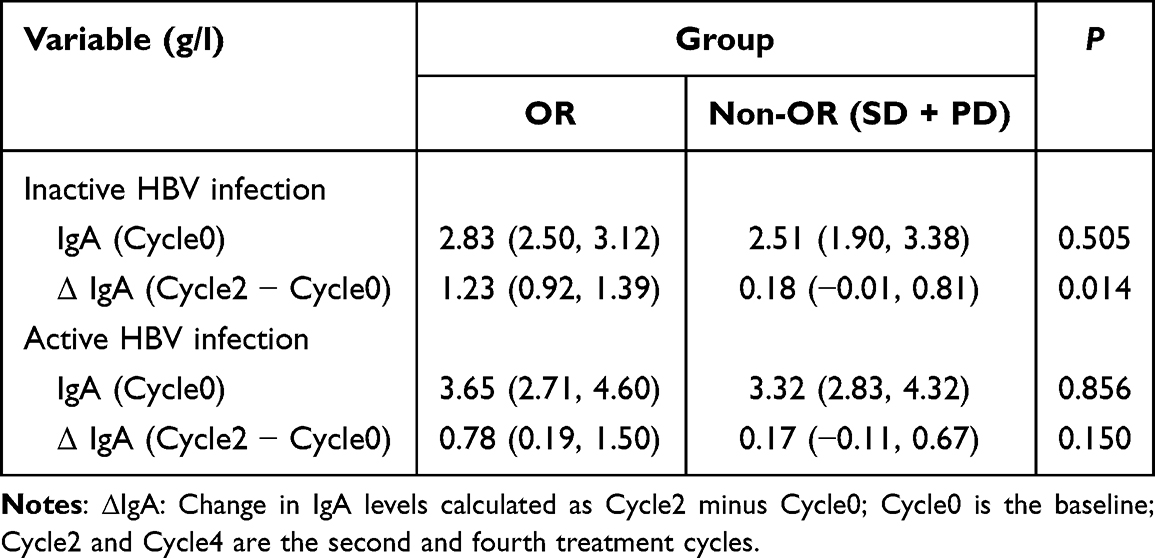 |
Table 5 Comparison of Baseline IgA Levels and Early Changes (Cycle2 − Cycle0) Between OR and Non-OR Patients in Inactive and Active HBV Infection Groups |
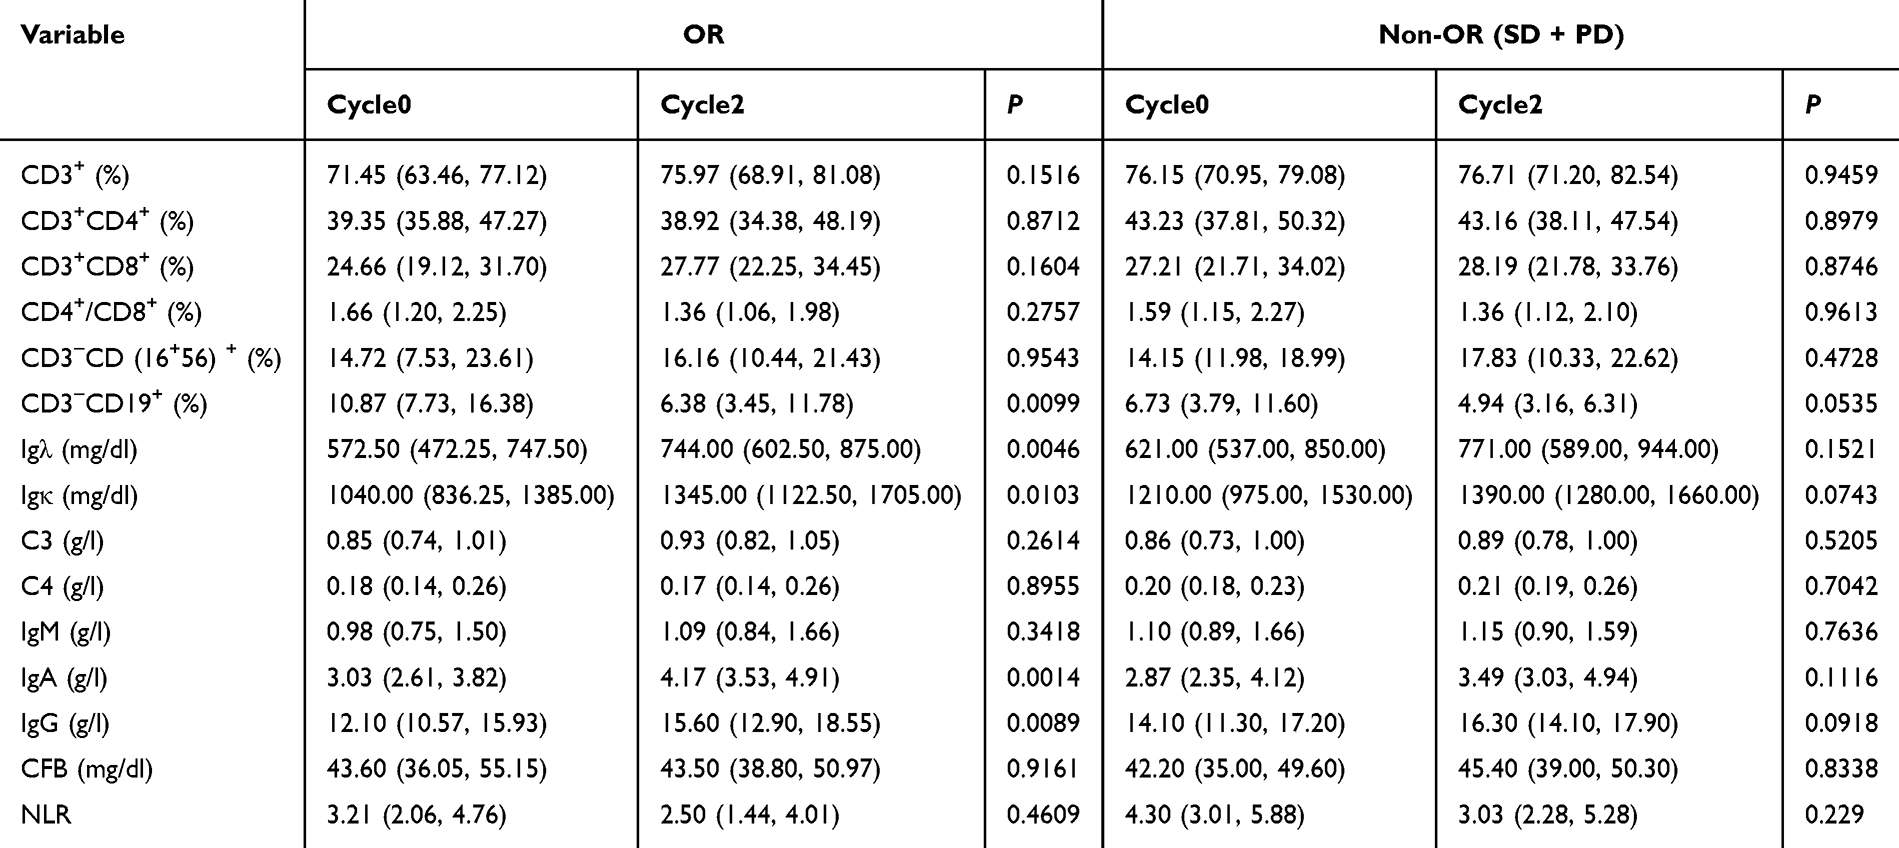 |
Table 6 Differential Immune Marker Changes in OR and Non-OR Groups Between Cycle0 and Cycle2 |
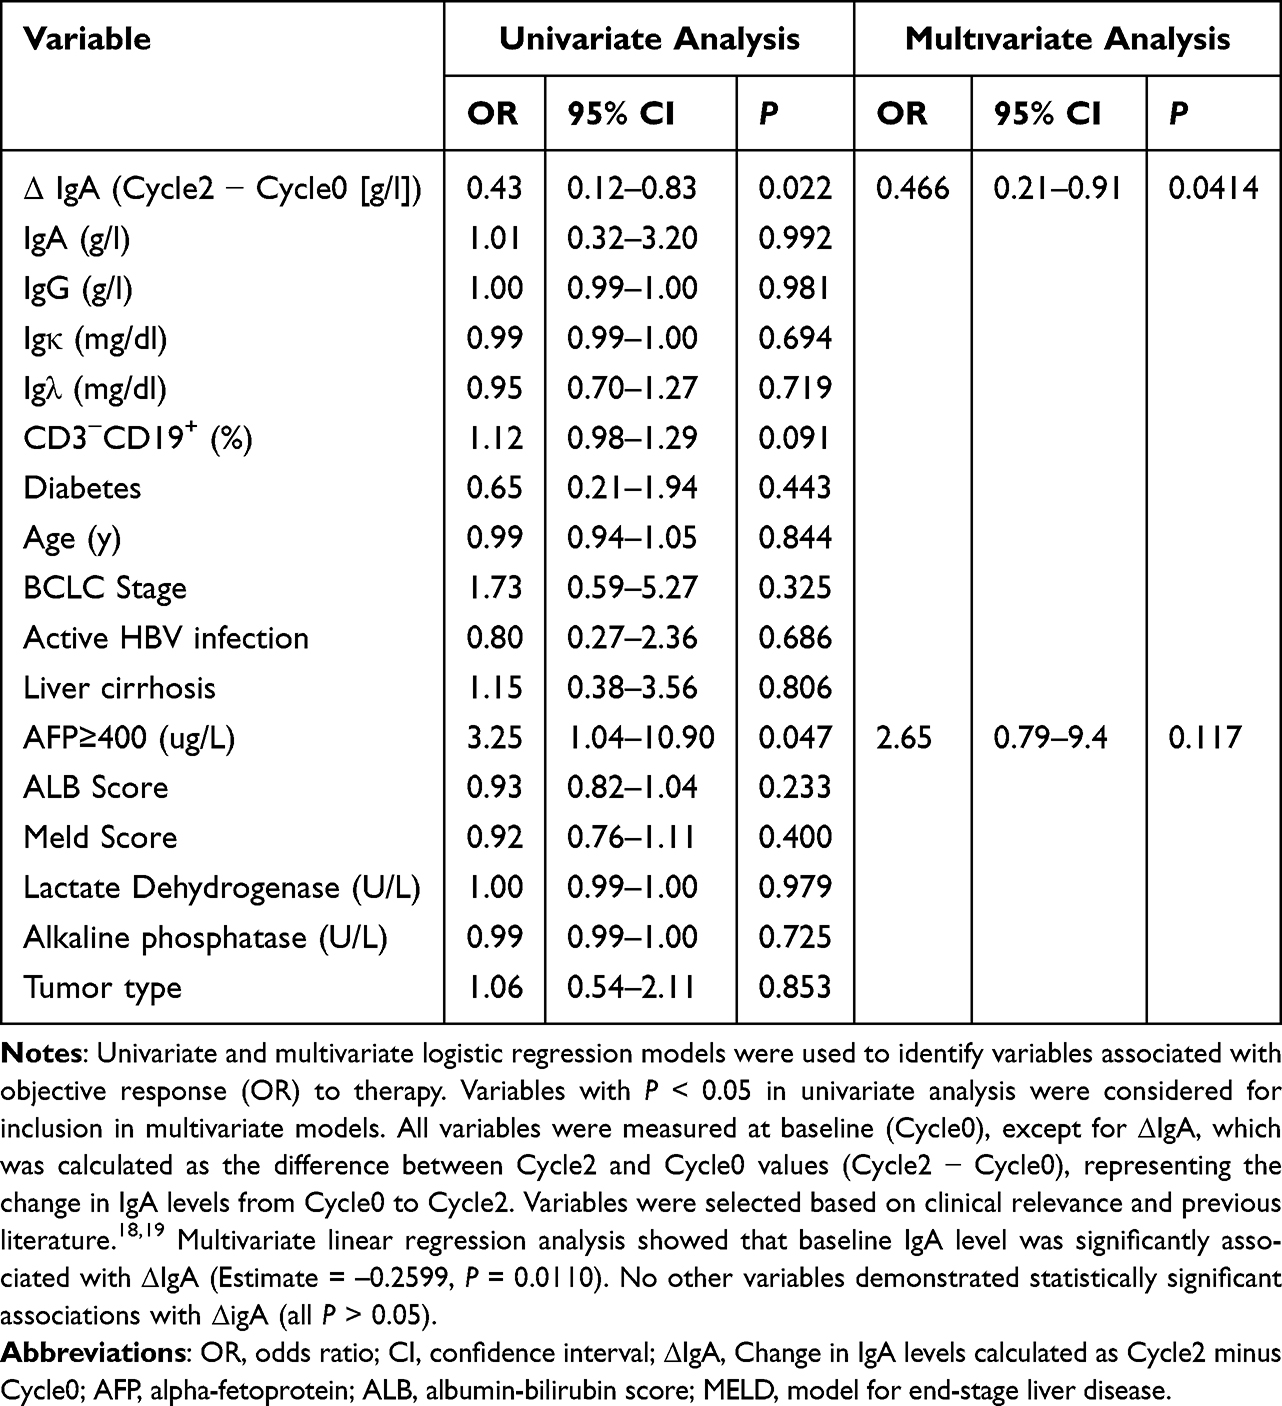 |
Table 7 Univariate and Multivariate Logistic Regression Analyses of Factors Associated with Objective Response (OR) |
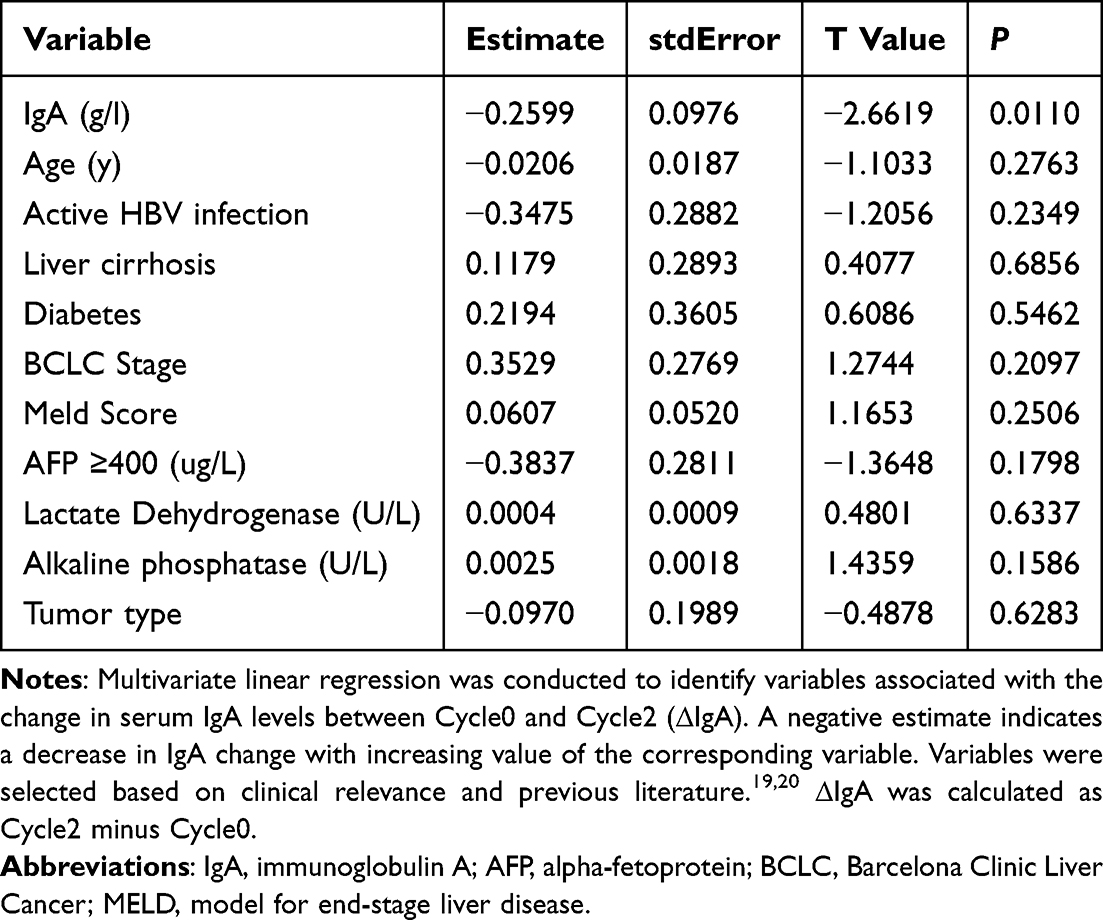 |
Table 8 Multivariate Linear Regression Analysis of Factors Associated with Δiga (Cycle2 − Cycle0) |
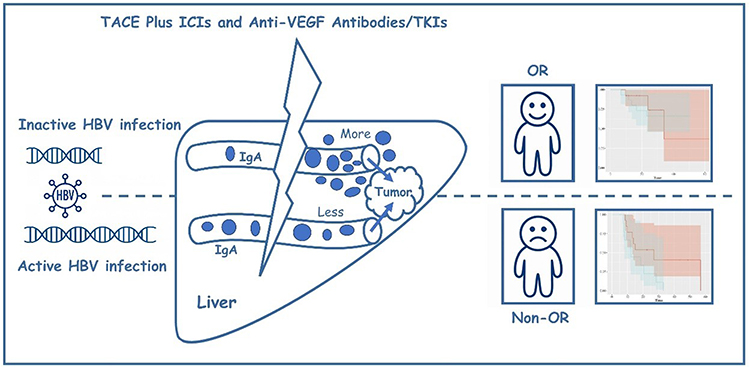 |
Figure 4 Conceptual model linking pre-treatment HBV activation, dynamic changes in IgA, and treatment outcomes in patients with unresectable HBV-related HCC receiving TACE plus ICIs and anti-VEGF antibodies/TKIs. Patients are first categorized according to baseline HBV DNA into inactive HBV infection (upper row) and active HBV infection (lower row). The lightning symbol represents the TACE plus ICIs and anti-VEGF antibodies/TKIs combination regimen. Within the stylized liver, blue dots depict serum IgA levels around the tumor. Patients with active HBV infection exhibit elevated baseline levels of circulating IgA. Following treatment with TACE in combination with ICIs and anti-VEGF antibodies or TKIs, these patients show relatively limited IgA accumulation within the peripheral immune environment, suggesting an insufficient IgA-mediated immune activation and potential immune exhaustion. This phenotype is associated with a poorer treatment response (non-objective response,). In contrast, patients with inactive HBV infection exhibit lower pre-treatment IgA levels but display greater intratumoral IgA enrichment following therapy, which is indicative of enhanced immune activation and improved therapeutic outcomes (objective response). |
Discussion
This study investigated the impact of pretreatment HBV replication status (ie, active HBV infection) on peripheral immune status and treatment response in HCC patients with chronic HBV infection undergoing TACE combined with ICIs and anti-VEGF antibodies or TKIs. Our findings delineate a potential immunomodulatory pathway through which HBV activation may reshape the peripheral immune microenvironment—primarily by altering serum IgA levels—and thereby influence the efficacy of immunotherapy. Notably, the change in IgA levels (ΔIgA) emerged as an independent immune marker predictive of treatment response, highlighting its translational potential in guiding individualized therapeutic strategies.
In HBV-related HCC, active viral replication is strongly associated with an immunosuppressive state.21 Previous studies have demonstrated that HBV facilitates immune evasion through multiple mechanisms, including impaired antigen presentation, T cell exhaustion, expansion of regulatory T cells (Tregs), and suppression of NK and dendritic cell (DC) functions.22–24 The present study further revealed that patients with active HBV infection exhibited significantly elevated serum IgA levels prior to treatment, suggesting that HBV may contribute to dysregulated humoral immunity by promoting B cell differentiation and IgA class switching. These findings offer new insights into how HBV modulates the immune microenvironment in HCC.
IgA is a class of antibodies involved in mucosal and systemic immunity, and its elevated expression levels have been reported to be associated with poor prognosis in HCC patients.25,26 IgA not only exacerbates chronic inflammation through immune complex deposition but also inhibits the immune clearance by macrophages and NK cells through interaction with FcαRI receptors, thereby contributing to the establishment of an immunosuppressive microenvironment.27–30 In this study, linear regression analysis confirmed a linear correlation between HBV DNA load and IgA levels, suggesting that activation of viral replication may be the direct precipitating factor of abnormally elevated IgA. This association remained significant after log transformation, enhancing statistical robustness.
In the analysis of immune dynamic changes, only IgA showed a significant difference between the HBV-activated and non-activated groups during the early treatment phase (Cycle0 to Cycle2), while no consistent trends were observed in CD3⁺, CD4⁺, CD8⁺, CD19⁺, or other major T/B cell subsets. This suggests that IgA may serve as an earlier and more sensitive indicator of immune response. Moreover, IgA levels exhibited a significant upward trend in HBV non-activated patients and those achieving an OR, whereas no such changes were observed in HBV-activated or non-OR patients. These findings imply that IgA levels are modulated not only by HBV activation status but may also reflect the induction of an effective immune response following immunotherapy. A significant increase in IgA from Cycle0 to Cycle2 in OR patients further supports its potential as a marker of treatment sensitivity. Stratified analyses revealed that the change in IgA (ΔIgA) was significantly greater in HBV non-activated patients compared to activated ones, and in the OR cohort compared to the nOR cohort. Logistic regression analysis identified ΔIgA as the sole independent predictor of treatment response, whereas HBV activation status, baseline IgA levels, and other conventional clinical variables were not retained in the multivariate model. These results support the use of ΔIgA as a biomarker for “treatment-response immune sensitivity”—that is, the capacity of a patient to mount an effective immune response early in the course of treatment.
In this study, we found that the baseline IgA level was an independent determinant of ΔIgA (Cycle2 − Cycle0), exhibiting a significant inverse correlation. This suggests that the magnitude of IgA change during immunotherapy is strongly influenced by its baseline state, highlighting the pivotal role of the “initial immune status” in shaping dynamic immune responses to treatment.31 Patients with higher baseline IgA levels tended to exhibit a less pronounced IgA increase during treatment, which may reflect a state of chronic immune activation or immune tolerance due to long-term antigenic stimulation.32,33 In HBV-related HCC, persistent viral infection induces chronic inflammation, promoting sustained plasma cell activation and aberrant IgA elevation.34,35 This immune state is often accompanied by CD8⁺ T cell exhaustion, impaired antigen presentation, and enrichment of Tregs, thereby fostering an immunosuppressive microenvironment.36,37 Under such conditions, even the administration of ICIs and anti-VEGF agents may fail to sufficiently reinvigorate the immune response, resulting in a blunted IgA increase. Conversely, patients with lower baseline IgA levels are more likely to possess greater “immune plasticity” and retain the capacity to mount effective immune responses.31 Upon exposure to combination therapy, these individuals exhibited a more substantial IgA increase, indicative of enhanced immune activation. Furthermore, the role of IgA in tumor immunity is gaining increasing attention.38–41 IgA has been shown to suppress effector T cell function through FcαRI-mediated immunoinhibitory pathways and to participate in the negative feedback regulation of the immune network.42,43 Thus, elevated IgA may not only reflect immune exhaustion but may also actively contribute to the establishment of an immunosuppressive tumor microenvironment.43 Our findings support this view, as elevated baseline IgA was associated with a diminished IgA response and predicted a suboptimal response to immunotherapy.
This study has several limitations. First, although a statistically significant linear association was observed between baseline IgA levels and HBV viral load, this relationship proved sensitive to high-leverage observations: the correlation lost significance and the model’s explanatory power declined markedly after exclusion of only two extreme values. This fragility suggests that the association should be interpreted cautiously and regarded as exploratory. Validation in larger, prospectively collected cohorts is needed to clarify whether it reflects a reproducible biological pattern or sample-specific variation. Second, survival analyses after propensity score matching were conducted in the overall cohort, the OR subgroup, and the non-OR subgroup. While HBV activation showed a borderline association with prognosis in the non-OR subgroup (P = 0.058), no significant relationship was observed in the overall population or the OR subgroup. This marginal trend may represent random variation, and its biological significance remains uncertain given the limited subgroup sample size and underlying heterogeneity in immune status. Third, although a 1:2 propensity score matching strategy was employed to improve covariate balance, the relatively small final matched sample and the incomplete availability of immune marker data introduce statistical uncertainty. These factors may limit the stability of effect estimates and should be addressed in future multi-center studies with larger sample sizes and more comprehensive immune profiling. Finally, the mechanisms underlying IgA dynamics remain incompletely understood. Further studies with larger cohorts and integrated immunologic assessments are needed to clarify the biological basis of these changes and to determine how IgA interacts with broader HBV-related immune alterations.
In conclusion, this study suggests that HBV activation status is linked to elevated IgA expression, which may contribute to immune suppression, attenuate treatment-induced immune activation, and ultimately compromise the efficacy of TACE combined with ICIs and anti-VEGF therapy/TKIs. Dynamic changes in IgA (ΔIgA) emerged as a sensitive and predictive indicator of this process. These findings support the role of immune phenotyping in guiding treatment stratification for HBV-related uHCC and highlight IgA as a promising biomarker for pre-treatment risk assessment and real-time treatment monitoring.
Ethics Statement
This retrospective study was reviewed and approved by the Institutional Review Board and Ethics Committee of the First Affiliated Hospital of Soochow University (Approval No. 2024352). Given the retrospective design, the requirement for informed consent was waived; nevertheless, written informed consent was obtained from all patients at the time of each hospital admission. Data were collected and analyzed exclusively for research purposes under strict confidentiality safeguards. All patient information was anonymized prior to analysis, with direct identifiers removed and replaced by study codes, and the electronic database was stored on password-protected institutional servers accessible only to authorized investigators. No individually identifiable patient data are presented in this article. The study procedures complied with the ethical principles of the Declaration of Helsinki (1975).
Acknowledgment
Baseline peripheral immune marker data from a subset of patients in this cohort have been reported in previous publications, but were not previously analyzed in relation to HBV activation status or its longitudinal immunological impact across treatment cycles.
Funding
This work is supported by the 2023 Jiangsu Province Natural Science Foundation Project (SBK2023022210), the 2023 Clinical Innovation and Translational Project of Soochow University (ML12203323), the 2024 Clinical Diagnosis and Treatment Technology Innovation Project of the First Affiliated Hospital of Soochow University (CXZL-F-240702), and the 2025 National Natural Science Foundation of China (82472083).
Disclosure
The authors report no conflicts of interest in this work.
References
1. McGlynn KA, Petrick JL, El-Serag HB. Epidemiology of Hepatocellular Carcinoma. Hepatology. 2021;73(Suppl 1):4–16. doi:10.1002/hep.31288
2. Yuan H, Xu R, Li S, et al. The Malignant Transformation of Viral Hepatitis to Hepatocellular Carcinoma: mechanisms and Interventions. MedComm. 2025;6(3):e70121. doi:10.1002/mco2.70121
3. Datfar T, Doulberis M, Papaefthymiou A, Hines IN, Manzini G. Viral Hepatitis and Hepatocellular Carcinoma: state of the Art. Pathogens. 2021;10(11):1366. doi:10.3390/pathogens10111366
4. Jin ZC, Chen JJ, Zhu XL, et al. CHANCE2201 Investigators. Immune checkpoint inhibitors and anti-vascular endothelial growth factor antibody/tyrosine kinase inhibitors with or without transarterial chemoembolization as first-line treatment for advanced hepatocellular carcinoma (CHANCE2201): a target trial emulation study. EClinicalMedicine. 2024;72:102622. doi:10.1016/j.eclinm.2024.102622
5. Brennan L, Brouwer-Visser J, Nüesch E, et al. T-Cell Heterogeneity in Baseline Tumor Samples: implications for Early Clinical Trial Design and Analysis. Front Immunol. 2022;13:760763. doi:10.3389/fimmu.2022.760763
6. Yang H, Kang B, Ha Y, et al. High serum IL-6 correlates with reduced clinical benefit of atezolizumab and bevacizumab in unresectable hepatocellular carcinoma. JHEP Rep. 2023;5(4):100672. doi:10.1016/j.jhepr.2023.100672
7. Xu XY, Wang Z, Liu CY, et al. Immune indicator changes in hepatocellular carcinoma undergoing TACE plus ICIs and anti-VEGF antibodies/TKIs: a prognostic biomarker analysis. J Hepatocell Carcinoma. 2024;11:2019–2032. doi:10.2147/JHC.S487472
8. Greten TF, Korangy F, Kudo M, et al. Biomarkers for immunotherapy of hepatocellular carcinoma. Nat Rev Clin Oncol. 2023;20(11):780–798. doi:10.1038/s41571-023-00816-4
9. Ekpanyapong S, Reddy KR. Hepatitis B Virus Reactivation: what Is the Issue, and How Should It Be Managed? Clin Liver Dis. 2020;24(3):317–333. doi:10.1016/j.cld.2020.04.002
10. Zhang X, Zhou Y, Chen C, et al. Hepatitis B virus reactivation in cancer patients with positive Hepatitis B surface antigen undergoing PD-1 inhibition. J Immunother Cancer. 2019;7(1):322. doi:10.1186/s40425-019-0808-5
11. Ho DW, Tsui YM, Chan LK, et al. Single-cell RNA sequencing shows the immunosuppressive landscape and tumor heterogeneity of HBV-associated hepatocellular carcinoma. Nat Commun. 2021;12(1):3684. doi:10.1038/s41467-021-24010-1
12. Wang J. To use or not to use propensity score matching? Pharm Stat. 2021;20(1):15–24. doi:10.1002/pst.2051
13. Lee YC, Wang JH, Chen CH, et al. Sorafenib use in hepatitis B virus- or hepatitis C virus-related hepatocellular carcinoma: a propensity score matching study. Kaohsiung J Med Sci. 2021;37(10):894–902. doi:10.1002/kjm2.12413
14. Qiu J, Zheng Y, Shen J, et al. Resection versus ablation in hepatitis B virus-related hepatocellular carcinoma patients with portal hypertension: a propensity score matching study. Surgery. 2015;158(5):1235–1243. doi:10.1016/j.surg.2015.04.002
15. Zhong L, Zhong P, Liu H, Li Z, Nie Q, Peng W. Hepatitis B virus infection does not affect the clinical outcome of anti-programmed death receptor-1 therapy in advanced solid malignancies: real-world evidence from a retrospective study using propensity score matching. Medicine. 2021;100(49):e28113. doi:10.1097/MD.0000000000028113
16. Clinical Guidelines Committee of Chinese College of I. Chinese clinical practice guidelines for transarterial chemoembolization of hepatocellular carcinoma (2023 edition). Zhonghua Yi Xue Za Zhi. 2023;103(34):2674–2694. doi:10.3760/cma.j.cn112137-20230630-01114
17. Llovet JM, Lencioni R. mRECIST for HCC: performance and novel refinements. J Hepatol. 2020;72(2):288–306. doi:10.1016/j.jhep.2019.09.026
18. Pan S, Zheng J, Shi C. Analysis and prediction of the efficacy and influencing factors of camrelizumab combined with TACE and sorafenib in the treatment of advanced hepatocellular carcinoma. J Cancer Res Clin Oncol. 2023;149(13):12479–12487. doi:10.1007/s00432-023-05050-0
19. Sun A, Chen S, Lin M, et al. Efficacy of TACE+Radiofrequency Ablation+Sorafenib in the Treatment of Patients with Recurrent Liver Cancer and Construction of Prediction Mode. Comput Math Methods Med. 2022;2022:6879035. doi:10.1155/2022/6879035. [Retracted in: Comput Math Methods Med. 2023 Dec 13;2023:9850243. doi: 10.1155/2023/9850243]
20. Tang B, Zhang X, Yang X, Wang W, Li R, Liu Y. Construction and validation of an angiogenesis-related scoring model to predict prognosis, tumor immune microenvironment and therapeutic response in hepatocellular carcinoma. Front Immunol. 2022;13:1013248. doi:10.3389/fimmu.2022.1013248
21. Loomba R, Liang TJ. Hepatitis B Reactivation Associated With Immune Suppressive and Biological Modifier Therapies: current Concepts, Management Strategies, and Future Directions. Gastroenterology. 2017;152(6):1297–1309. doi:10.1053/j.gastro.2017.02.009
22. Fisicaro P, Barili V, Rossi M, et al. Pathogenetic Mechanisms of T Cell Dysfunction in Chronic HBV Infection and Related Therapeutic Approaches. Front Immunol. 2020;11:849. doi:10.3389/fimmu.2020.00849
23. Ma H, Yan QZ, Ma JR, Li DF, Yang JL. Overview of the immunological mechanisms in hepatitis B virus reactivation: implications for disease progression and management strategies. World J Gastroenterol. 2024;30(10):1295–1312. doi:10.3748/wjg.v30.i10.1295
24. den Brouw ML O, Binda RS, van Roosmalen MH, et al. Hepatitis B virus surface antigen impairs myeloid dendritic cell function: a possible immune escape mechanism of hepatitis B virus. Immunology. 2009;126(2):280–289. doi:10.1111/j.1365-2567.2008.02896.x
25. Gleeson PJ, Camara NOS, Launay P, Lehuen A, Monteiro RC. Immunoglobulin A Antibodies: from Protection to Harmful Roles. Immunol Rev. 2024;328(1):171–191. doi:10.1111/imr.13424
26. Wang Y, Xiao J. Recent advances in the molecular understanding of immunoglobulin A. FEBS J. 2024;291(16):3597–3603. doi:10.1111/febs.17089
27. Breedveld A, van Egmond M. IgA and FcαRI: pathological Roles and Therapeutic Opportunities. Front Immunol. 2019;10:553. doi:10.3389/fimmu.2019.00553
28. Bakema JE, van Egmond M. The human immunoglobulin A Fc receptor FcαRI: a multifaceted regulator of mucosal immunity. Mucosal Immunol. 2011;4(6):612–624. doi:10.1038/mi.2011.36
29. Kroll KW, Hueber B, Balachandran H, et al. FcαRI (CD89) is upregulated on subsets of mucosal and circulating NK cells and regulates IgA-class specific signaling and functions. Mucosal Immunol. 2024;17(4):692–699. doi:10.1016/j.mucimm.2024.04.003
30. Hand TW, Reboldi A. Production and Function of Immunoglobulin A. Annu Rev Immunol. 2021;39(1):695–718. doi:10.1146/annurev-immunol-102119-074236
31. Rossi JF, Lu ZY, Massart C, Levon K. Dynamic Immune/Inflammation Precision Medicine: the Good and the Bad Inflammation in Infection and Cancer. Front Immunol. 2021;12:595722. doi:10.3389/fimmu.2021.595722
32. Bettonville M, d’Aria S, Weatherly K, et al. Long-term antigen exposure irreversibly modifies metabolic requirements for T cell function. Elife. 2018;7:e30938.
33. Zheng K, Zheng X, Yang W. The Role of Metabolic Dysfunction in T-Cell Exhaustion During Chronic Viral Infection. Front Immunol. 2022;13:843242. doi:10.3389/fimmu.2022.843242
34. Sung PS, Park DJ, Roh PR, et al. Intrahepatic inflammatory IgA+PD-L1high monocytes in hepatocellular carcinoma development and immunotherapy. J Immunother Cancer. 2022;10(5):e003618. doi:10.1136/jitc-2021-003618
35. Liu WT, Jing YY, Han ZP, et al. The injured liver induces hyperimmunoglobulinemia by failing to dispose of antigens and endotoxins in the portal system. PLoS One. 2015;10(3):e0122739. doi:10.1371/journal.pone.0122739
36. Jiang Y, Li Y, Zhu B. T-cell exhaustion in the tumor microenvironment. Cell Death Dis. 2015;6(6):e1792. doi:10.1038/cddis.2015.162
37. Zhou L, Velegraki M, Wang Y, et al. Spatial and functional targeting of intratumoral Tregs reverses CD8+ T cell exhaustion and promotes cancer immunotherapy. J Clin Invest. 2024;134(14):e180080. doi:10.1172/JCI180080
38. Biswas S, Mandal G, Payne KK, et al. IgA transcytosis and antigen recognition govern ovarian cancer immunity. Nature. 2021;591(7850):464–470. doi:10.1038/s41586-020-03144-0
39. Chan C, Lustig M, Baumann N, Valerius T, van Tetering G, Leusen JHW. Targeting Myeloid Checkpoint Molecules in Combination With Antibody Therapy: a Novel Anti-Cancer Strategy With IgA Antibodies? Front Immunol. 2022;13:1017924. doi:10.3389/fimmu.2022.1017924
40. Chan C, Cabanes NC, Jansen JHM, et al. The relevance of tumor target expression levels on IgA-mediated cytotoxicity in cancer immunotherapy. Cancer Immunol Immunother. 2024;73(12):238. doi:10.1007/s00262-024-03824-0
41. Biswas S, Mandal G, Anadon CM, et al. Targeting intracellular oncoproteins with dimeric IgA promotes expulsion from the cytoplasm and immune-mediated control of epithelial cancers. Immunity. 2023;56(11):2570–2583.e6. doi:10.1016/j.immuni.2023.09.013
42. Hansen IS, Baeten DLP, den Dunnen J. The inflammatory function of human IgA. Cell Mol Life Sci. 2019;76(6):1041–1055. doi:10.1007/s00018-018-2976-8
43. Heyman B. Antibody feedback regulation. Immunol Rev. 2024;328(1):126–142. doi:10.1111/imr.13377
 © 2026 The Author(s). This work is published and licensed by Dove Medical Press Limited. The
full terms of this license are available at https://www.dovepress.com/terms
and incorporate the Creative Commons Attribution
- Non Commercial (unported, 4.0) License.
By accessing the work you hereby accept the Terms. Non-commercial uses of the work are permitted
without any further permission from Dove Medical Press Limited, provided the work is properly
attributed. For permission for commercial use of this work, please see paragraphs 4.2 and 5 of our Terms.
© 2026 The Author(s). This work is published and licensed by Dove Medical Press Limited. The
full terms of this license are available at https://www.dovepress.com/terms
and incorporate the Creative Commons Attribution
- Non Commercial (unported, 4.0) License.
By accessing the work you hereby accept the Terms. Non-commercial uses of the work are permitted
without any further permission from Dove Medical Press Limited, provided the work is properly
attributed. For permission for commercial use of this work, please see paragraphs 4.2 and 5 of our Terms.