
Back to Journals » Drug Design, Development and Therapy » Volume 20
Potential Hepatoprotective Effects of Adenosine Triphosphate Against Olaparib-Induced Oxidative Liver Injury: An Experimental Rat Model
Authors Baykan AR  , Cerrah S , Kartal Baykan E , Tanas S , Yavuzer B , Yazici GN, Kuzucu M, Altuner D, Suleyman H
Received 1 April 2026
Accepted for publication 17 June 2026
Published 24 June 2026 Volume 2026:20 613667
DOI https://doi.org/10.2147/DDDT.S613667
Checked for plagiarism Yes
Review by Single anonymous peer review
Peer reviewer comments 3
Editor who approved publication: Professor Anastasios Lymperopoulos
Ahmed Ramiz Baykan,1 Serkan Cerrah,2 Emine Kartal Baykan,3 Serdar Tanas,1 Bulent Yavuzer,4 Gulce Naz Yazici,5 Mehmet Kuzucu,6 Durdu Altuner,4 Halis Suleyman4
1Division of Gastroenterology, Department of Internal Medicine, Erzurum City Hospital, Erzurum, Turkey; 2Division of Gastroenterology, Department of Internal Medicine, Erzurum Regional Training and Research Hospital, University of Health Sciences, Erzurum, Turkey; 3Division of Endocrinology and Metabolic Diseases, Department of Internal Medicine, Erzurum Regional Training and Research Hospital, University of Health Sciences, Erzurum, Turkey; 4Department of Pharmacology, Faculty of Medicine, Erzincan Binali Yıldırım University, Erzincan, Turkey; 5Department of Histology and Embryology, Faculty of Medicine, Erzincan Binali Yıldırım University, Erzincan, Turkey; 6Department of Molecular Biology, Faculty of Arts and Sciences, Erzincan Binali Yıldırım University, Erzincan, Turkey
Correspondence: Halis Suleyman, Department of Pharmacology, Faculty of Medicine, Erzincan Binali Yıldırım University, Erzincan, Turkey, Tel +90 530 9211909, Fax +90 446 2261819, Email [email protected] Ahmed Ramiz Baykan, Division of Gastroenterology, Department of Internal Medicine, Erzurum City Hospital, Erzurum, Turkey, Tel +90 555 5061878, Email [email protected]
Background: Olaparib, a clinically established poly (ADP-ribose) polymerase (PARP) inhibitor widely used in oncology, has significantly improved outcomes in several malignancies. However, increasing evidence indicates that olaparib may induce hepatocellular injury through mechanisms involving oxidative stress, inflammation, and mitochondrial dysfunction. Adenosine triphosphate (ATP), a key regulator of cellular bioenergetics and redox homeostasis, may confer protection against oxidative tissue injury. This study investigated the hepatoprotective effects of ATP against olaparib-induced oxidative liver damage in rats and compared its efficacy with melatonin.
Methods: Twenty-four male albino Wistar rats were randomly assigned to four experimental groups (n = 6): healthy control (HG), olaparib-treated (OLP), ATP plus olaparib (ATOL), and melatonin plus olaparib (MLOL). Olaparib was administered at a dose of 100 mg/kg orally twice daily, whereas ATP (5 mg/kg, intraperitoneally) and melatonin (10 mg/kg, orally) were administered once daily. The treatments were administered for 14 consecutive days. Hepatic oxidative and inflammatory status was assessed by measuring malondialdehyde (MDA), total glutathione (tGSH), superoxide dismutase (SOD), catalase (CAT), interleukin-6 (IL-6) and ATP levels in liver tissue. Serum alanine aminotransferase (ALT) and aspartate aminotransferase (AST) activities were measured as biochemical indicators of hepatocellular injury. Liver tissues were also examined histopathologically.
Results: Olaparib administration significantly increased hepatic MDA and IL-6 levels together with serum ALT and AST activities, while significantly reducing hepatic tGSH and ATP levels and SOD and CAT activities compared with the healthy group (p < 0.001). Both ATP and melatonin significantly attenuated these alterations (p < 0.001). Notably, ATP demonstrated a more pronounced protective effect than melatonin, particularly in suppressing aminotransferase elevations and improving histopathological liver architecture.
Conclusion: ATP significantly alleviates olaparib-induced hepatotoxicity by attenuating oxidative stress, suppressing inflammatory responses, restoring antioxidant defense mechanisms and significantly replenishing depleted hepatic ATP levels. These findings suggest that ATP may represent a promising therapeutic strategy for preventing PARP inhibitor-associated drug-induced liver injury. The diagram illustrates a study on olaparib-induced hepatotoxicity. Olaparib is administered orally twice daily, leading to hepatotoxicity in a rat model. Adenosine triphosphate is given intraperitoneally once daily and melatonin is given orally once daily. The study includes four groups: Healthy (n=6), Olaparib-alone (100 mg/kg) (n=6), ATP (5 mg/kg) plus Olaparib (100 mg/kg) (n=6) and Melatonin (10 mg/kg) plus Olaparib (100 mg/kg) (n=6). Liver tissue analysis includes measurements of malondialdehyde, total glutathione, superoxide dismutase, catalase, interleukin 6 and adenosine triphosphate for all groups (n=6). Histopathology is performed for all groups (n=6). Blood serum analysis includes alanine transaminase and aspartate transaminase for all groups (n=6).Study: olaparib hepatotoxicity, ATP/melatonin treatments, liver tissue & serum analysis.
Keywords: olaparib, adenosine triphosphate, drug-induced liver injury, PARP inhibitors, oxidative stress, interleukin-6, alanine aminotransferase, aspartate aminotransferase, melatonin, rats
Introduction
Olaparib is a poly (ADP-ribose) polymerase (PARP) inhibitor that is administered via the oral route. It was specifically designed to function as a competitive inhibitor of nicotinamide adenine dinucleotide (NAD⁺) at the catalytic domains of PARP1 and PARP2, two key members of the PARP family that play a central role in the repair of DNA single-strand breaks.1 Olaparib and other PARP inhibitors were initially introduced for the treatment of ovarian cancer and were subsequently approved for use in additional indications, including breast, pancreatic, and prostate cancers.2 During clinical use, the adverse events most commonly observed include fatigue, nausea, vomiting, diarrhea, dyspepsia, headache, taste disturbances, decreased appetite, dizziness, elevations in serum creatinine levels, hematological toxicity, myelodysplastic syndrome, acute myeloid leukemia, and pneumonia.3 First-line maintenance olaparib therapy has been documented to be associated with hepatocellular injury.4 Analyses conducted to evaluate the toxic effects of olaparib have revealed its potential hepatotoxic, nephrotoxic, and genotoxic properties.5 Several studies have demonstrated that PARP inhibition augments oxidative stress, which may contribute to its antitumor activity. In addition to promoting DNA damage, PARP inhibition also enhances intracellular reactive oxygen species (ROS) generation.6 Moreover, several studies have demonstrated that the PARP inhibitor olaparib increases interleukin-6 (IL-6) levels in breast cancer cells.7 Abnormal elevations in laboratory parameters, comprising alanine aminotransferase (ALT), aspartate aminotransferase (AST), alkaline phosphatase (ALP), and gamma-glutamyl transpeptidase (GGT), as well as bilirubin levels, have been observed following olaparib administration.8 Studies investigating the mechanisms underlying olaparib-induced toxicity have reported that olaparib treatment leads to reductions in mitochondrial complex I and IV activities, accompanied by decreased adenosine triphosphate (ATP) levels.9 Moreover, excessive ROS production is known to potentially lead to reduced ATP synthesis and mitochondrial damage.10,11 Collectively, these findings suggest that reduced ATP levels represent one of the major factors underlying olaparib-associated oxidative stress. This view is consistent with evidence indicating that oxidative stress is associated with reduced ATP levels.12,13
Adenosine triphosphate (ATP), evaluated in this study for its potential protective role against olaparib-induced hepatotoxicity, is a nucleoside triphosphate consisting of a nitrogenous base, a ribose moiety, and three phosphate residues.14 Moreover, ATP is known to participate in the synthesis of antioxidants and to provide the energy required for antioxidant production.15–19 As is well established, oxidative stress is closely associated with inflammatory responses. This is consistent with findings reporting that ATP suppresses both oxidative stress and inflammatory responses.20 Collectively, evidence from the literature suggests that the hepatotoxic effects of olaparib may be attributable to oxidative stress and mitochondrial dysfunction associated with reduced ATP levels. To the best of our knowledge, based on currently available experimental and clinical literature, no study has specifically investigated the protective effects of exogenous ATP against olaparib-induced hepatotoxicity. Although ATP-mediated cytoprotection has been investigated in several models of oxidative tissue injury, including drug-induced hepatotoxicity,21,22 evidence regarding its role in olaparib-associated hepatotoxicity remains unavailable or extremely limited. Therefore, the present study aimed to investigate the potential protective effects of ATP against olaparib-induced oxidative liver injury in rats and to compare its efficacy with that of melatonin.
Materials and Methods
Animals
A total of twenty-four male albino Wistar rats, aged 9–10 weeks and weighing between 280 and 292 g, were included in this experimental study. All animals were procured from the Experimental Animals Application and Research Center of Erzincan Binali Yıldırım University (Erzincan, Turkey). Upon arrival, the rats were randomly distributed into four experimental groups (n = 6 per group) in order to achieve comparable mean body weights across groups. Prior to the initiation of the experimental procedures, all animals were subjected to a 7-day acclimatization period. During this period, they were housed in standard laboratory wire cages (20 × 35×55 cm; floor area: 1925 cm2), with six rats per cage. Environmental conditions were strictly regulated throughout the study, including a 12 h light/12 h dark cycle, an ambient temperature maintained at 22 ± 2 °C, and relative humidity levels ranging between 30% and 70%. Animals were provided with standard laboratory chow (Bayramoglu Feed and Flour Industry Inc., Erzurum, Turkey) and tap water ad libitum for the entire duration of the experiment. At baseline, all rats were clinically healthy and showed no apparent signs of systemic or local pathology.
All animal-related experimental procedures were performed in the laboratories of the Experimental Animals Application and Research Center of Erzincan Binali Yıldırım University. The experimental protocol was conducted in accordance with the European Parliament Directive 2010/63/EU on the protection of animals used for scientific purposes (Approval ID: 2016–24-199) and complied with the ARRIVE (Animal Research: Reporting of In Vivo Experiments) guidelines.23 Every effort was made to minimize animal suffering and to reduce animal use to the minimum required to achieve scientific validity.
Reagents and Chemicals
Reagents and chemical compounds used throughout the study were of analytical grade and sourced from authorized commercial vendors. Thiopental sodium (Pental Sodium®, 0.5 g powder for solution for injection; Catalog No.: 8699508270385) was supplied by Menarini Health and Pharmaceutical Industry Trade Inc. (Istanbul, Turkey). Olaparib (Lynparza®, 150 mg film-coated tablet; Catalog No.: 8699786092921) was obtained from AstraZeneca Pharmaceuticals Industry and Trade Ltd. Co. (Istanbul, Turkey). Adenosine triphosphate sodium (Sodium Adenosine Triphosphate–Darnytsia®, 10 mg/mL injectable solution; Catalog No.: 4823006406180) was provided by Darnytsia Pharmaceutical Co. (Kyiv, Ukraine). Melatonin (Melatonina LEK-AM®, 3 mg tablet; Catalog No.: 5909990884926) was supplied by Lek-AM Pharmaceutical Company Ltd. (Zakroczym, Warsaw, Poland).
Experimental Design and Randomization
Animal numbers were carefully defined according to the 4R framework (Reduction, Refinement, Replacement, and Responsibility) to limit animal utilization to the lowest feasible level while maintaining scientific rigor and reproducibility.24
Prior to the initiation of experimental procedures, exclusion criteria were prospectively defined in two stages: pre-experimental and peri-/post-experimental. Pre-experimental exclusion criteria included abnormal body posture, reduced spontaneous activity, or injuries resulting from aggressive interactions among cage mates. Peri-experimental and post-experimental exclusion criteria comprised unexpected mortality before planned endpoints; complications associated with anesthesia or drug administration; procedural errors such as unsuccessful oral gavage or extravasation during injection; deviations from the predefined treatment schedule; body weight loss exceeding 15–20% of baseline values; clinical signs of dehydration or systemic illness; severe distress indicative of uncontrolled pain or suffering; and loss of tissue integrity during sample collection or processing that could compromise the reliability of biochemical or histopathological evaluations. All criteria were monitored throughout the intervention period and during subsequent data assessment. No animals met the exclusion criteria at any stage of the experiment; therefore, all 24 subjects were included in the final analyses.
Animals were allocated to experimental groups using a random number table to ensure unbiased assignment. To further minimize potential confounding variables and systematic sources of bias, each cage and each animal was assigned a unique numerical identification code that was maintained consistently throughout the entire experimental period. All biochemical and histopathological analyses were performed by investigators blinded to group allocation.
Experimental Groups
Following randomization, the animals were allocated to four experimental groups according to their respective treatment protocols. The healthy control group (HG) received no pharmacological intervention. The olaparib group (OLP) was administered olaparib alone (100 mg/kg, by oral gavage). In the ATOL group, ATP (5 mg/kg, intraperitoneally) was administered in combination with olaparib (100 mg/kg, by oral gavage). The MLOL group received melatonin (10 mg/kg, by oral gavage) together with olaparib (100 mg/kg, by oral gavage).
Experimental Procedure
ATP was administered at a dose of 5 mg/kg via intraperitoneal injection to rats assigned to the ATOL group (n = 6), whereas melatonin was administered to animals in the MLOL group (n = 6) at a dose of 10 mg/kg by oral gavage. ATP (5 mg/kg, intraperitoneally)21 and melatonin (10 mg/kg, orally)22 were administered at doses established in previously validated experimental models in which both agents conferred significant hepatoprotection by attenuating oxidative stress, restoring antioxidant enzyme activities, and ameliorating hepatocellular injury in rats. In the HG (n = 6) and OLP (n = 6) groups, distilled water was administered as the vehicle. One hour following administration of ATP, melatonin or the vehicle, olaparib was administered orally by gavage to the ATOL, MLOL, and OLP groups at a dose of 100 mg/kg, twice daily. ATP and melatonin were administered once daily throughout the experimental period. The treatment protocol was continued for a period of 14 consecutive days. At the conclusion of the treatment period, rats were euthanized under deep anesthesia induced by thiopental sodium (50 mg/kg). Liver tissues were promptly excised and prepared for biochemical analyses. Levels of malondialdehyde (MDA), total glutathione (tGSH), superoxide dismutase (SOD), catalase (CAT), interleukin-6 (IL-6) and ATP were determined in liver tissue. Before euthanasia, blood was obtained via the tail vein to assess serum AST and ALT activities. Furthermore, liver tissues were processed for histopathological evaluation.
Biochemical Analyses
Preparation of Samples
Liver tissue samples were carefully excised from each experimental animal and gently rinsed with ice-cold 0.9% sodium chloride solution to remove residual blood and adherent tissue debris. From each rat, approximately 300 mg of hepatic tissue was accurately weighed and promptly sectioned into small pieces. To preserve biochemical integrity, the tissue fragments were immediately subjected to snap freezing in liquid nitrogen. The frozen samples were then mechanically ground into a uniform fine powder using a pre-chilled mortar and pestle. Subsequently, the powdered tissue was suspended in phosphate-buffered saline (PBS, pH 7.4) at a fixed tissue-to-buffer ratio of 1:10 (w/v) to facilitate efficient extraction of intracellular components. The resulting homogenates were briefly vortexed for 10 seconds and centrifuged at 10,000 × g for 20 minutes at 4 °C to obtain clear supernatants. The supernatant fractions were carefully collected and preserved at −80 °C until further biochemical evaluation. To ensure analytical consistency and allow reliable comparisons among experimental groups, all biochemical parameters were normalized to total protein concentration. Thus, MDA and tGSH levels were expressed as nmol/mg protein, whereas SOD and CAT activities were reported as U/mg protein.
Determination of MDA, GSH, SOD, CAT, and Protein Levels in Liver Tissue
MDA, tGSH, and SOD levels in liver tissue were determined using rat-specific ELISA kits (Catalog No. 201–11-0157 for MDA; SunRed Biotechnology® Co., Shanghai, China; ELK10914 for tGSH and ELK8178 for SOD; ELK Biotechnology® Co. Ltd., Sugar Land, TX, USA) in accordance with the manufacturers’ instructions. CAT activity was evaluated using the method described by Goth.25 Total protein concentration was determined using a Bradford-based colorimetric assay.26
Determination of IL-6 Levels in Liver Tissue
Tissue IL-6 levels were determined using a rat-specific ELISA kit (Catalog No. 201–11-0136; SunRed Biotechnology® Co., Shanghai, China) in accordance with the manufacturer’s instructions.
Determination of ATP Levels in Liver Tissue
Tissue ATP levels were quantified using a commercially available rat enzyme-linked immunosorbent assay (ELISA) kit in strict accordance with the manufacturer’s instructions (Catalog No. SL1512Ra, Lot No. 20260201; Sunlong Biotech® Co. Ltd., Shanghai, China).
Determination of Serum ALT and AST Activities
Venous blood samples were collected into sterile serum gel tubes without anticoagulant. The samples were allowed to clot at room temperature for 30 min, after which they were centrifuged at 1500 × g for 10 min to obtain serum. The separated serum was subsequently stored at −80 °C until biochemical analysis. Serum ALT and AST activities, widely recognized biochemical markers of hepatocellular injury, were determined spectrophotometrically using a Beckman Coulter AU5800 automated clinical chemistry analyzer (Beckman Coulter® Inc., Brea, CA, USA) with commercial reagent kits supplied by the same manufacturer, in accordance with the manufacturer’s instructions.
Histopathological Examination
Liver tissue samples obtained from the experimental animals were immediately fixed in 10% neutral buffered formaldehyde solution for 72 h. Following fixation, the tissues were placed into tissue cassettes and washed under running tap water for 24 h to remove residual fixative. Subsequently, the samples were dehydrated through a graded ethanol series (70%, 80%, 90%, and 100%) and then cleared in xylene. After the clearing process, the tissues were embedded in paraffin blocks, and 4–5 μm thick sections were obtained using a rotary microtome. The sections were stained with hematoxylin and eosin (H&E) and examined under a light microscope (Olympus BX53; Olympus® Inc., Tokyo, Japan). Histopathological evaluation and photomicrograph acquisition were performed using an Olympus DP2-SAL digital imaging system (Version 3.3.1.198; Olympus® Inc., Tokyo, Japan). For histopathological assessment, six sections from each animal were evaluated. In each section, six microscopic fields were examined at 200× magnification, including one central and five peripheral fields. Deviations from normal hepatic histoarchitecture were assessed according to the following criteria: hepatocellular lipid infiltration/vacuolization, necrosis, vascular dilatation/congestion, and polymorphonuclear leukocyte (PMNL) infiltration. Each parameter was graded using a semi-quantitative scoring system ranging from 0 to 3, where 0 = absent, 1 = mild, 2 = moderate, and 3 = severe. All histopathological evaluations were performed by a blinded histologist who was unaware of the experimental group allocations.
Statistical Analysis
All statistical analyses related to the biochemical and histopathological data were performed using IBM SPSS® Statistics for Windows (Version 27.0; IBM Corp., Armonk, NY, USA, 2020). Figures were generated using GraphPad Prism® (Version 8.0.1; GraphPad Software, San Diego, CA, USA, 2018). Biochemical results are expressed as mean ± standard error of the mean (SEM). Prior to inferential analyses, the distribution of each biochemical variable was evaluated using the Shapiro–Wilk test to determine normality (Supplementary Table 1), and the homogeneity of variances was assessed using Levene’s test (Supplementary Table 2). When both assumptions were satisfied, intergroup differences were analyzed using one-way analysis of variance (ANOVA) followed by Tukey’s Honestly Significant Difference (HSD) test for post hoc pairwise comparisons (Supplementary Table 3). If the assumption of variance homogeneity was violated, Welch’s ANOVA was applied and subsequent pairwise comparisons were conducted using the Games–Howell test. Histopathological outcomes were summarized as median values together with their minimum–maximum values. Because these scores represent ordinal data, nonparametric statistical methods were applied. Accordingly, the Kruskal–Wallis test was used to evaluate overall differences among the experimental groups. When significant differences were detected, Dunn’s post hoc test with Bonferroni correction was used to determine pairwise group differences. A p-value < 0.05 was considered statistically significant.
Ethical Approval
Ethical approval was obtained from the Local Animal Ethics Committee of Erzincan Binali Yıldırım University (Erzincan, Turkey; Approval No.:05; Session: January/2026; Date: 29 January 2026).
Results
Biochemical Findings
Results of MDA and tGSH Analysis in Liver Tissue
As shown in Figure 1, olaparib administration (OLP, 7.46±0.10) significantly increased hepatic MDA levels compared with the healthy group (HG, 4.33±0.09) (OLP vs. HG, p < 0.001). Co-treatment with ATP (ATOL, 4.72±0.04) or melatonin (MLOL, 4.77±0.18) significantly suppressed the OLP-induced increase in MDA levels (ATOL and MLOL vs. OLP, both p < 0.001). There was no statistically significant difference between the ATP or melatonin groups and the healthy group in terms of MDA levels (ATOL vs. HG, p = 0.095; MLOL vs. HG, p = 0.055). Collectively, these findings indicate that olaparib-induced hepatotoxicity is accompanied by significant lipid peroxidation, and that both ATP and melatonin effectively attenuate oxidative membrane damage, reducing MDA levels to values comparable to those of the healthy control group.
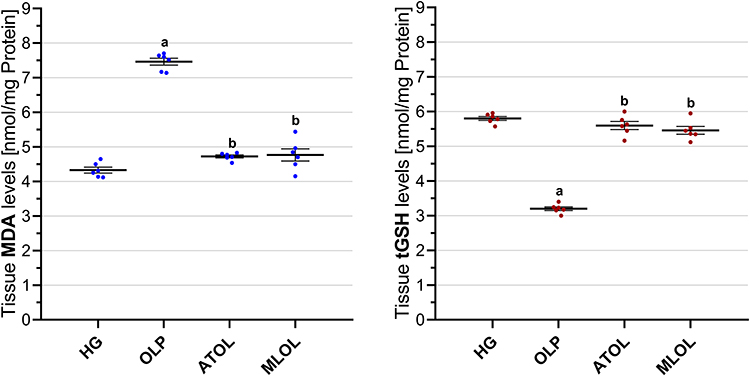 |
Figure 1 Effects of ATP, melatonin, and olaparib on MDA and tGSH levels in rat liver tissue. Abbreviations: HG, healthy group; OLP, olaparib-alone group; ATOL, ATP + olaparib group; MLOL, melatonin + olaparib group; ATP, adenosine triphosphate; MDA, malondialdehyde; tGSH, total glutathione. Notes: Data are presented as mean ± SEM (standard error of the mean). Statistical analysis was performed using one-way analysis of variance (ANOVA), followed by Tukey’s honestly significant difference (HSD) post hoc test. a, p < 0.001 vs. HG; b, p < 0.001 vs. OLP. n = 6 per group. |
Olaparib treatment (OLP, 3.20±0.05) resulted in a significant reduction in hepatic tGSH levels relative to the healthy group (HG, 5.80±0.06) (OLP vs. HG, p < 0.001). Administration of ATP (ATOL, 5.60±0.12) or melatonin (MLOL, 5.46±0.11) in combination with olaparib significantly counteracted the OLP-associated decline in tGSH (ATOL and MLOL vs. OLP, both p < 0.001). No statistically significant differences were detected between the ATOL or MLOL groups and the healthy group with respect to tGSH levels (ATOL vs. HG, p = 0.395; MLOL vs. HG, p = 0.063) (Figure 1). These results suggest that olaparib significantly impairs hepatic antioxidant capacity through glutathione depletion, and that both ATP and melatonin effectively preserve intracellular redox homeostasis, maintaining tGSH levels within the range observed in the healthy control group.
Results of SOD and CAT Analysis in Liver Tissue
As presented in Figure 2, hepatic SOD activity was significantly lower in the olaparib-treated group (OLP, 3.60±0.07) than in the healthy group (HG, 7.43±0.06) (OLP vs. HG, p < 0.001). Concomitant administration of ATP (ATOL, 7.10±0.15) or melatonin (MLOL, 6.96±0.21) significantly mitigated the olaparib-induced reduction in SOD levels (ATOL and MLOL vs. OLP, both p < 0.001). There was no statistically significant difference between the ATP or melatonin groups and the healthy group in terms of SOD activity (ATOL vs. HG, p = 0.320; MLOL vs. HG, p = 0.088).
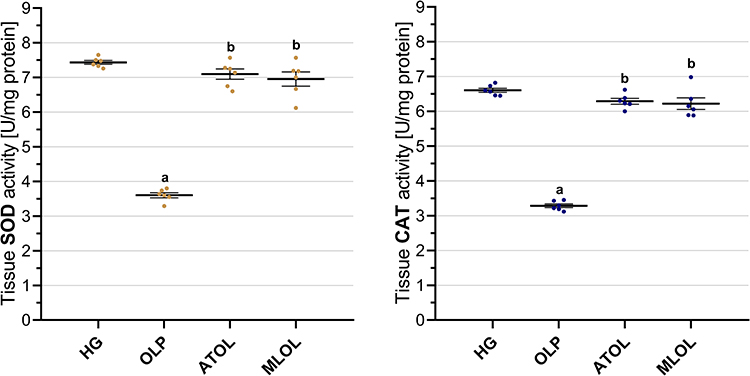 |
Figure 2 Effects of ATP, melatonin, and olaparib on SOD and CAT activities in rat liver tissue. Abbreviations: HG, healthy group; OLP, olaparib-alone group; ATOL, ATP + olaparib group; MLOL, melatonin + olaparib group; ATP, adenosine triphosphate; SOD, superoxide dismutase; CAT, catalase. Notes: Data are presented as mean ± SEM (standard error of the mean). Statistical analysis was performed using one-way analysis of variance (ANOVA), followed by Tukey’s honestly significant difference (HSD) post hoc test. a, p < 0.001 vs. HG; b, p < 0.001 vs. OLP. n = 6 per group. |
Olaparib administration (OLP, 3.29±0.05) was associated with a significant decrease in hepatic CAT activity compared with the healthy group (HG, 6.61±0.06) (OLP vs. HG, p < 0.001). In contrast, combined treatment with ATP (ATOL, 6.29±0.08) or melatonin (MLOL, 6.22±0.17) significantly attenuated the decline in CAT activity observed in the OLP group (ATOL and MLOL vs. OLP, both p < 0.001). CAT levels did not differ significantly from those of the healthy group in either the ATP or melatonin groups (ATOL vs. HG, p = 0.165; MLOL vs. HG, p = 0.067) (Figure 2).
Taken together, these findings demonstrate that olaparib significantly disrupts the enzymatic antioxidant defense system, as evidenced by marked reductions in both SOD and CAT activities, and that co-administration of ATP or melatonin effectively restores these activities to levels comparable to those of the healthy control group, underscoring the capacity of both agents to preserve hepatic antioxidant enzyme function against olaparib-induced oxidative impairment.
Results of IL-6 Analysis in Liver Tissue
As shown in Figure 3, hepatic IL-6 levels were significantly increased in animals receiving olaparib alone (OLP, 3.93 ± 0.09) compared with the healthy control group (HG, 2.27 ± 0.09) (p < 0.001). Co-administration of ATP (ATOL, 2.58 ± 0.08) and melatonin (MLOL, 2.52 ± 0.12) significantly suppressed the olaparib-induced increase in IL-6 levels (both p < 0.001). No statistically significant differences were observed in IL-6 levels among the ATP, melatonin, and healthy control groups (ATOL vs. HG, p = 0.128; MLOL vs. HG, p = 0.290; ATOL vs. MLOL, p = 0.961). Collectively, these results demonstrate that olaparib induces a significant hepatic pro-inflammatory response, as evidenced by a significant elevation in IL-6 levels, and that both ATP and melatonin significantly suppress olaparib-induced IL-6 elevation, restoring inflammatory markers to levels indistinguishable from those of the healthy control group with comparable efficacy.
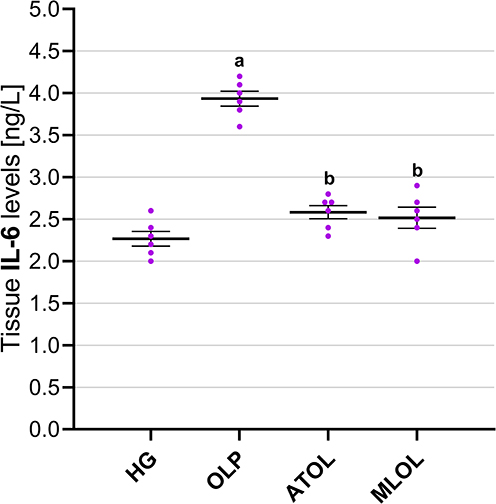 |
Figure 3 Effects of ATP, melatonin, and olaparib on IL-6 levels in rat liver tissue. Abbreviations: HG, healthy group; OLP, olaparib-alone group; ATOL, ATP + olaparib group; MLOL, melatonin + olaparib group; ATP, adenosine triphosphate; IL-6, interleukin-6. Notes: Data are presented as mean ± SEM (standard error of the mean). Statistical analysis was performed using one-way analysis of variance (ANOVA), followed by Tukey’s honestly significant difference (HSD) post hoc test. a, p < 0.001 vs. HG; b, p < 0.001 vs. OLP. n = 6 per group. |
Results of ATP Analysis in Liver Tissue
As presented in Figure 4, hepatic ATP levels were significantly lower in the olaparib-alone group (OLP, 2.21 ± 0.05) than in the healthy control group (HG, 4.71 ± 0.07) (p < 0.001). Co-administration of ATP (ATOL, 4.33 ± 0.08) or melatonin (MLOL, 2.92 ± 0.06) significantly restored hepatic ATP levels relative to the olaparib-alone group (both p < 0.001). Both treatment groups exhibited significantly lower hepatic ATP levels compared with the healthy control group (ATOL vs. HG, p = 0.003; MLOL vs. HG, p < 0.001). Furthermore, ATP administration resulted in significantly higher hepatic ATP levels compared with melatonin treatment (ATOL vs. MLOL, p < 0.001). Taken together, these results indicate that olaparib significantly depletes hepatic ATP levels, reflecting a marked impairment of cellular bioenergetics, and that exogenous ATP administration more effectively restores intracellular energy homeostasis than melatonin, albeit neither treatment achieves full normalization to healthy control levels.
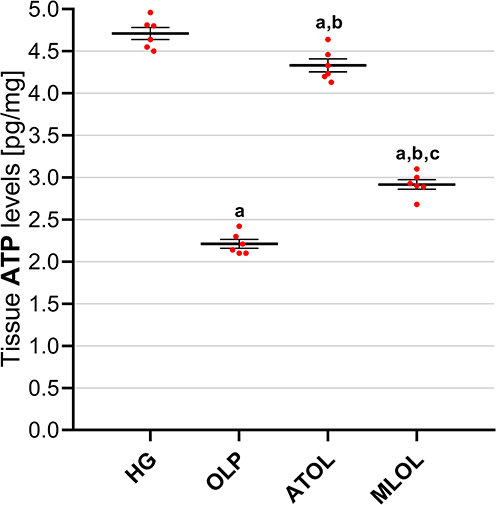 |
Figure 4 Effects of ATP, melatonin, and olaparib on ATP levels in rat liver tissue. Abbreviations: HG, healthy group; OLP, olaparib-alone group; ATOL, ATP + olaparib group; MLOL, melatonin + olaparib group; ATP, adenosine triphosphate. Notes: Data are presented as mean ± SEM (standard error of the mean). Statistical analysis was performed using one-way analysis of variance (ANOVA), followed by Tukey’s honestly significant difference (HSD) post hoc test. a, p < 0.05 vs. HG; b, p < 0.001 vs. OLP; c, p < 0.001 vs. ATOL. n = 6 per group. |
Results of Serum ALT and AST Analysis
As shown in Figure 5, olaparib administration (OLP, 106.17 ± 1.92) resulted in a significant elevation of serum ALT activity compared with the healthy control group (HG, 32.50 ± 1.98) (p < 0.001). Co-treatment with ATP (ATOL, 40.50 ± 1.84) and melatonin (MLOL, 71.50 ± 3.16) significantly suppressed the olaparib-induced increase in serum ALT activity (ATOL vs. OLP, p < 0.001; MLOL vs. OLP, p < 0.001). Notably, ATP administration produced a more pronounced inhibitory effect on ALT elevation than melatonin. Serum ALT activity in the ATP-treated group was comparable to that of the healthy control group, and no statistically significant difference was detected between these groups (ATOL vs. HG, p = 0.096). In contrast, significant differences in ALT activity were observed between the ATP- and melatonin-treated groups (ATOL vs. MLOL, p < 0.001), as well as between the melatonin and healthy control groups (MLOL vs. HG, p < 0.001).
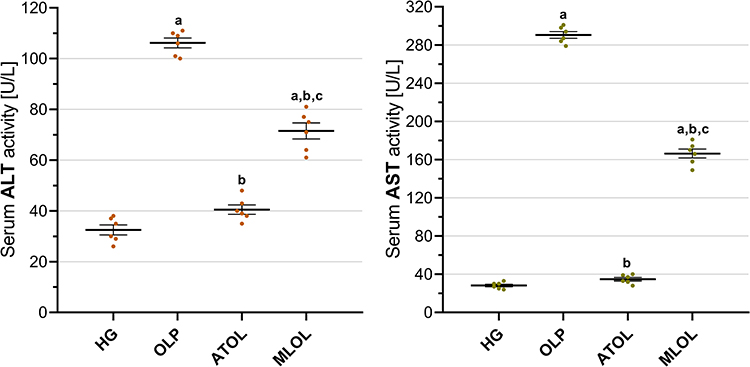 |
Figure 5 Effects of ATP, melatonin, and olaparib on serum ALT and AST activities in rats. Abbreviations: HG, healthy group; OLP, olaparib-alone group; ATOL, ATP + olaparib group; MLOL, melatonin + olaparib group; ATP, adenosine triphosphate; ALT, alanine aminotransferase; AST, aspartate aminotransferase. Notes: Data are presented as mean ± SEM (standard error of the mean). Statistical analysis was performed using one-way analysis of variance (ANOVA), followed by Tukey’s honestly significant difference (HSD) post hoc test. a, p < 0.001 vs. HG; b, p < 0.001 vs. OLP; c, p < 0.001 vs. ATOL. n = 6 per group. |
Serum AST activity was significantly increased following olaparib treatment (OLP, 290.50 ± 3.49) compared with the healthy control group (HG, 28.17 ± 1.40) (p < 0.001). Administration of ATP (ATOL, 34.83 ± 1.89) and melatonin (MLOL, 166.33 ± 4.68) significantly reduced the olaparib-induced elevation in AST activity (ATOL vs. OLP, p < 0.001; MLOL vs. OLP, p < 0.001). Among the treatment groups, ATP demonstrated a significantly greater suppressive effect on AST activity compared with melatonin. AST levels in the ATP-treated group were similar to those observed in the healthy control group, with no statistically significant difference between these groups (ATOL vs. HG, p = 0.457). Conversely, AST activity remained significantly higher in the melatonin-treated group compared with both the ATP group (ATOL vs. MLOL, p < 0.001) and the healthy control group (MLOL vs. HG, p < 0.001) (Figure 5).
In aggregate, these findings demonstrate that olaparib induces significant hepatocellular injury, as reflected by marked elevations in both serum ALT and AST activities, and that ATP more effectively attenuates this hepatocellular damage than melatonin, restoring aminotransferase levels to values comparable to those of the healthy control group, whereas melatonin, despite significantly suppressing aminotransferase elevations, did not achieve full normalization to healthy control levels.
Histopathological Findings
A comprehensive semi-quantitative evaluation of hepatic histopathological changes, along with intergroup statistical comparisons, letter-coded multiple comparison results, and corresponding p-values, is provided in Table 1. In liver tissue sections from the healthy HG control group, the hepatic lobule, centered around its central vein, exhibited radially arranged hepatic cords, and the overall liver architecture was normal (Figure 6). Examination of liver tissue from the olaparib-alone–treated (OLP) group revealed a pronounced loss of the normal radial organization of hepatic cords, which appeared irregular and disorganized. In the abnormally arranged hepatocyte cords surrounding the central vein, severe lipid infiltration was evident, leading to marked distortion of cellular morphology, hepatocellular swelling, and prominent vacuolization. This vacuolar degeneration of hepatocytes was associated with severe hepatocellular necrosis, with necrotic cells diffusely distributed throughout the tissue. Furthermore, focal polymorphonuclear cell infiltration was observed in several regions of the tissue, accompanied by severe vascular dilatation and mild vascular congestion (Figure 7). As presented in Table 1, all histopathological parameters reached their highest values in the OLP group, with lipid infiltration/vacuolization, necrosis, and dilatation/congestion all at grade 3, and PMNL infiltration at grade 2, all of which were significantly higher than those of the healthy control group (p < 0.001). In the ATP-treated (ATOL) group, the hepatic cords exhibited a regular and well-preserved radial arrangement. Hepatocytes showed mild to moderate lipid infiltration and vacuolization, while only a limited number of necrotic cells were observed. Moderate vascular dilatation was also observed. Notably, no polymorphonuclear cell infiltration was detected in the liver tissue of this group (Figure 8). These morphological improvements were corroborated by the semi-quantitative findings in Table 1; lipid infiltration/vacuolization was at grade 2, necrosis at grade 1, dilatation/congestion at grade 2, and PMNL infiltration was negligible, all significantly lower than the OLP group (p < 0.001). In the melatonin-treated (MLOL) group, architectural irregularity of the hepatic cords persisted, and hepatocytes exhibited moderate to severe vacuolization. However, the number of necrotic nuclei was partially reduced compared with the olaparib-treated damage group. Vascular structures displayed moderate dilatation, while polymorphonuclear cells were rarely observed throughout the tissue (Figure 9). As reflected in Table 1, lipid infiltration/vacuolization was at grade 2, necrosis at grade 2–3, and dilatation/congestion at grade 2 in the MLOL group, while PMNL infiltration was negligible. Although melatonin significantly attenuated olaparib-induced histopathological alterations, necrosis and lipid infiltration/vacuolization remained significantly higher than in the ATOL group (p < 0.05), demonstrating a significantly inferior degree of morphological recovery.
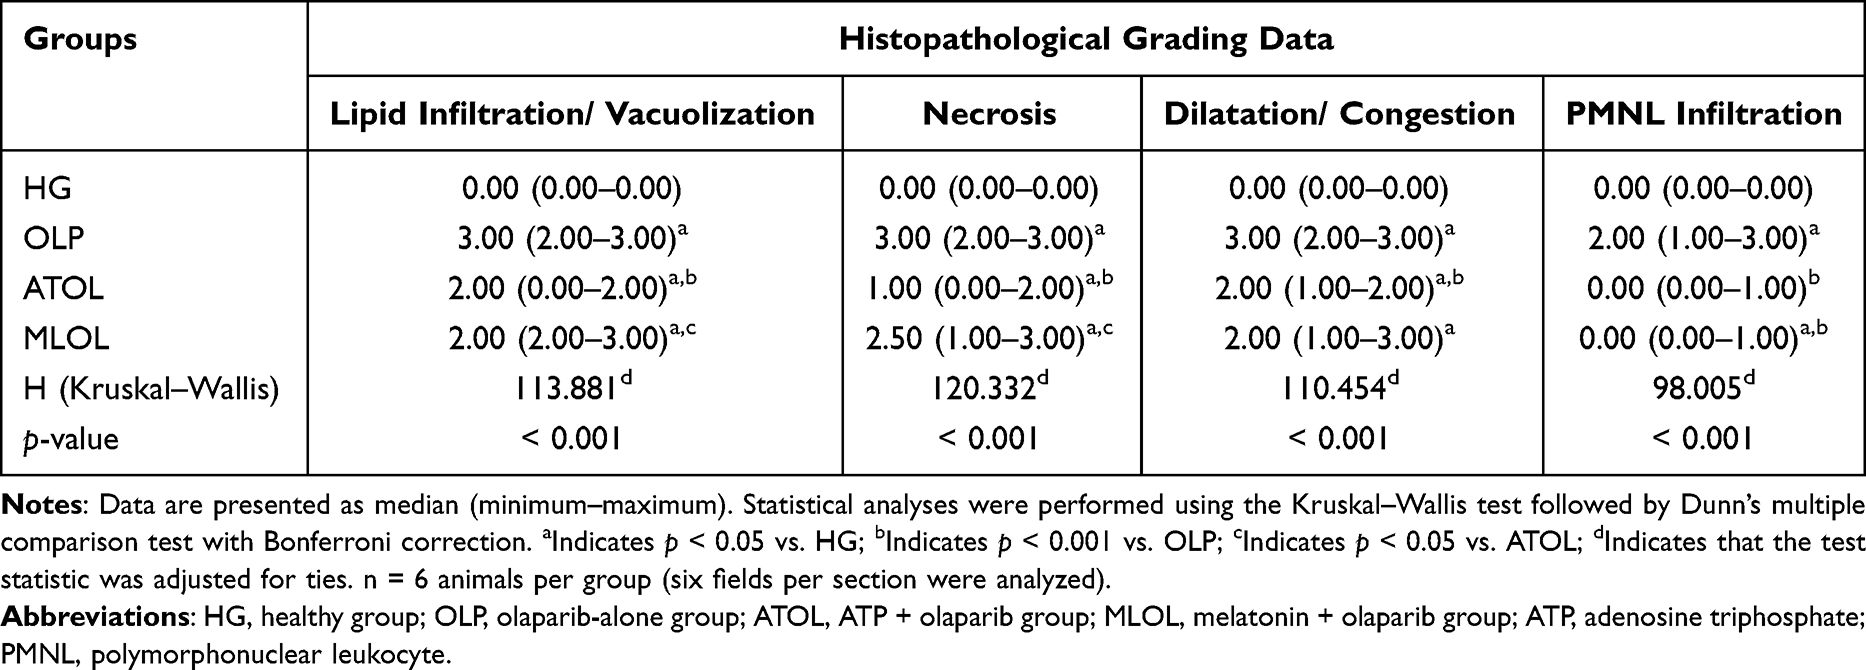 |
Table 1 Semi-Quantitative Scoring of Histopathological Lesions in Rat Liver Tissue and Comparative Analysis of Histopathological Parameters Across Experimental Groups |
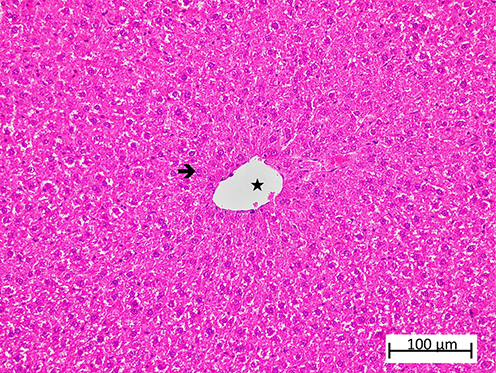 |
Figure 6 Representative liver tissue sections from the healthy control (HG) group demonstrating preserved hepatic histoarchitecture. Normal hepatocytes ( |


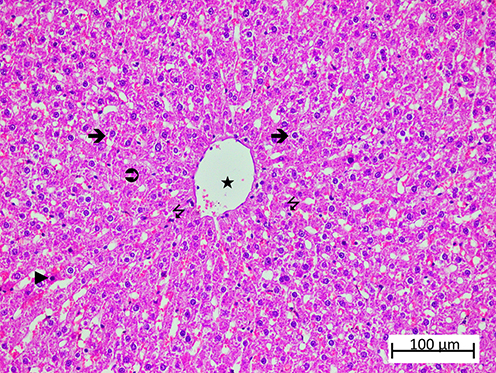 |
Figure 7 Representative liver tissue sections from the OLP group exhibiting severe histopathological alterations. Severely vacuolated hepatocytes ( |


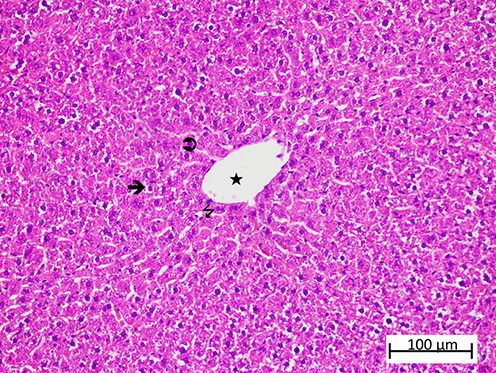 |
Figure 8 Representative liver tissue sections from the ATOL group showing partial improvement of histopathological alterations. Mild-to-moderate vacuolated hepatocytes ( |


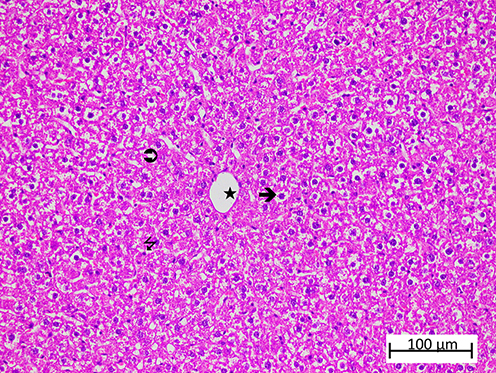 |
Figure 9 Representative liver tissue sections from the MLOL group exhibiting severe histopathological alterations. Severely vacuolated hepatocytes ( |


Taken together, these histopathological findings are consistent with the biochemical data and demonstrate that both ATP and melatonin significantly mitigate olaparib-induced hepatocellular injury at the morphological level; however, ATP confers superior hepatoprotective efficacy, as reflected by significantly greater improvements in necrosis and lipid infiltration/vacuolization.
Discussion
In this study, the hepatoprotective potential of ATP in olaparib-induced hepatic injury in rats was systematically evaluated through biochemical and histopathological assessments, with melatonin included for comparative analysis. The biochemical analyses revealed a significant elevation in hepatic MDA levels, a terminal product of lipid peroxidation (LPO), in the olaparib-treated group. As is well established, MDA is a reliable biomarker of oxidative stress and increases in hepatic injury associated with hepatotoxic agents.27 As outlined above, PARP inhibitors may lead to disruption of the mitochondrial electron transport chain, thereby promoting increased ROS production.6 Our findings are consistent with those reported by Gao et al, who showed that olaparib induces oxidative stress by increasing mitochondrial ROS levels and reducing antioxidant defenses.9
In our study, ATP suppressed the olaparib-induced increase in MDA levels more significantly than melatonin. The ability of ATP to reduce MDA levels to values close to those of the healthy control group suggests that it may attenuate mitochondrial dysfunction, a primary source of oxidative stress; this interpretation is indirectly supported by the hepatic ATP measurements obtained in the present study, which demonstrated that olaparib significantly depleted intracellular ATP levels, whereas exogenous ATP administration significantly restored these levels. Melatonin is an endogenous hormone with strong ROS-scavenging properties28 and attenuated the olaparib-induced increase in MDA levels in liver tissue to an extent nearly comparable to that of ATP. Taken together, our experimental findings and evidence from the literature indicate that oxidative stress represents one of the major underlying factors in olaparib-associated hepatic injury. As is well established, treatment with olaparib results in a decrease in ATP levels.9 Excessive ROS production may also lead to reduced ATP synthesis and mitochondrial damage.11 Moreover, previous studies have demonstrated an association between oxidative stress and reduced ATP levels.12 Furthermore, studies reporting that exogenous ATP administration protects organs and tissues against oxidative damage provide support for our experimental findings.11
As suggested by our findings, olaparib treatment resulted in a decrease in tGSH levels in liver tissue. The significant decrease in tGSH levels observed following olaparib administration indicates suppression of the antioxidant defense system. GSH, a tripeptide present at high concentrations in the liver, is synthesized through ATP-dependent enzymatic pathways. It plays a central role in maintaining redox homeostasis in hepatocytes, and its depletion renders cells more susceptible to oxidative damage.17 Previous studies have reported that the PARP inhibitor olaparib induces cell death through increased LPO and depletion of GSH.29 In our study, the significant preservation of tGSH levels after ATP administration supports its role in supplying the energy required for GSH synthesis and recycling.17–19 Redegeld et al reported that intracellular GSH depletion alone does not induce cell death; however, a subsequent decline in ATP levels following GSH depletion leads to loss of cell viability30 ATP attenuated the olaparib-induced decline in tGSH levels with an efficacy comparable to that of melatonin, a compound with well-established antioxidant activity.31 Some studies have shown that ATP exhibits stronger antioxidant activity than melatonin.32
The significant reductions in hepatic SOD and CAT activities in the olaparib-treated group suggest a disruption of the enzymatic antioxidant defense system. These enzymes represent a principal protective barrier against oxidative stress, and their activity levels are widely recognized as both diagnostic and prognostic indicators across a range of pathological conditions.33 Enzymatic antioxidant activities are known to decrease in hepatic injury.34 To the best of our knowledge, no studies have reported direct effects of olaparib exposure on SOD and CAT activities. However, as outlined above, olaparib induces mitochondrial oxidative stress by increasing mitochondrial ROS levels while reducing glutathione peroxidase activity and ATP levels.9 Although the literature directly examining the relationship between ATP and the synthesis of antioxidant enzymes such as SOD and CAT remains limited, ATP has been shown to protect cells against ROS-mediated damage through induction of these intracellular antioxidants via P2Y receptor signaling.35 Melatonin was observed to be almost as effective as ATP in preventing the decrease in SOD and CAT activities. Previous studies have also reported that melatonin prevents reductions in SOD and CAT activities and protects liver tissue against oxidative damage.34
Another parameter that was significantly increased in the liver tissue of olaparib-treated animals was IL-6. IL-6 is a prototypical cytokine exhibiting pleiotropic biological functions. In response to infection or tissue injury, IL-6 is rapidly synthesized and released by monocytes and macrophages. However, excessive and dysregulated IL-6 production contributes to the pathogenesis of numerous inflammatory disorders and malignancies.36 Although scarce, reports in the literature indicate that olaparib may lead to an increase in IL-6 levels.7 Accumulating evidence in the literature indicates a direct link between increased oxidant levels and the upregulation of proinflammatory cytokines. Accordingly, oxidative stress and inflammation are widely recognized as closely interconnected processes involved in the onset and progression of a broad spectrum of diseases.37 These findings are in agreement with previous reports, indicating that ATP and melatonin attenuated the olaparib-induced increase in IL-6 levels. Similarly, experimental studies by Shen et al demonstrated that ATP exerts anti-inflammatory activity through the suppression of IL-6 expression38 Additionally, melatonin has been demonstrated to exhibit both antioxidative and anti-inflammatory actions.28
Olaparib treatment significantly increased serum ALT and AST activities in the experimental animals. Abnormal elevations in aminotransferase levels are commonly observed in liver diseases.39 While ALT is mainly confined to the cytoplasmic fraction, AST is present in both cytoplasmic and mitochondrial compartments.40 Therefore, concurrent elevations in both enzymes suggest injury involving both cytoplasmic and mitochondrial compartments. The elevations in serum ALT and AST activities observed in olaparib-treated animals are consistent with previous reports demonstrating olaparib-induced hepatocellular injury.4 Furthermore, the increases in ROS, ALT, and AST levels following PARP inhibition are consistent with the relationship between oxidative stress and elevated aminotransferase activity.6,8 ATP, and particularly melatonin, are well recognized as potent antioxidants.19,28 However, our results suggest that ATP exhibited greater efficacy than melatonin in attenuating olaparib-induced increases in ALT and AST levels. In our study, the more limited suppression of liver dysfunction by melatonin compared with ATP suggests a decisive role of ATP in the maintenance of cellular viability. These findings are supported by evidence indicating that GSH depletion alone is insufficient to induce cell death, whereas a subsequent decline in ATP levels following GSH reduction plays a critical role in triggering cellular death.30
Beyond these biochemical considerations, the pharmacological behavior of exogenous ATP in biological systems warrants discussion. A relevant pharmacological consideration in the interpretation of the present findings concerns the extracellular stability of ATP. Following intraperitoneal administration, ATP is rapidly hydrolyzed by ecto-nucleotidases, principally CD39 (NTPDase1) and CD73, which sequentially convert ATP to ADP, AMP, and ultimately adenosine within the extracellular compartment.41 Consequently, a proportion of the observed hepatoprotective effects may be mediated not only by ATP itself but also by its metabolites, particularly adenosine, through activation of purinergic P1 receptors. Adenosine has been shown to exert cytoprotective and anti-inflammatory effects through A1 and A2A receptor signalling, including attenuation of oxidative stress and suppression of pro-inflammatory cytokine production.42 Despite the rapid extracellular degradation of ATP, the question of whether exogenous ATP can directly contribute to intracellular ATP pools has remained a subject of debate for several decades. Historically, the prevailing view held that ATP could not cross the plasma membrane because of its highly charged structure. However, experimental evidence accumulated over time has challenged this assumption and supports the existence of cellular ATP uptake mechanisms under certain physiological and pathological conditions.43 Notably, systemic and oral ATP administration have been reported to influence extracellular and cellular ATP availability in vivo, suggesting that administered ATP exerts biological effects beyond simple receptor-mediated signaling. Rapaport and Fontaine demonstrated that intraperitoneal administration of adenine nucleotides expands erythrocyte ATP pools and increases circulating plasma ATP concentrations in mice.44 Similarly, Jäger et al reported that oral ATP supplementation enhances post-exercise blood flow in both animals and humans, supporting the biological activity of administered ATP in vivo.45 More direct evidence for intracellular ATP uptake has emerged from mechanistic cellular studies. Forte et al demonstrated that both yeast and human cells are capable of importing extracellular ATP through PANX1-associated mechanisms, resulting in alterations of intracellular AMP/ATP balance and activation of mTORC1 signaling pathways.46 Furthermore, Qian et al demonstrated that extracellular ATP can be internalized by cancer cells through macropinocytosis, whereas Wang et al subsequently showed that this process markedly increases intracellular ATP concentrations and modulates downstream signaling pathways involved in cellular survival and drug resistance.47,48 Although the relative contribution of intracellular ATP uptake cannot be determined from the present data, the marked restoration of hepatic ATP levels observed in the ATOL group, which was significantly greater than that achieved by melatonin, raises the possibility that mechanisms beyond extracellular purinergic receptor signaling alone may contribute to the observed hepatoprotective effect. Accordingly, it cannot be excluded that the hepatoprotective outcome observed in this study reflects a combined contribution of P2 receptor-mediated extracellular ATP signaling, adenosine-dependent P1 receptor activation, and the potential for direct intracellular ATP replenishment. This mechanistic complexity is an inherent feature of purinergic pharmacology and does not diminish the translational significance of the present findings; rather, it underscores the need for future studies employing selective purinergic receptor antagonists, ATP-tracing approaches, direct assessment of intracellular ATP uptake, or non-hydrolyzable ATP analogues to delineate the relative contributions of these pathways.
Histopathological evaluation of the olaparib-treated group demonstrated disruption of the radial organization of hepatic cords, marked hepatocellular vacuolization, widespread necrosis, and polymorphonuclear cell infiltration, together with dilatation and congestion of the central vein and hepatic sinusoids. These findings are regarded as classical histopathological manifestations of hepatocellular injury associated with oxidative stress and mitochondrial dysfunction.49,50 In our study, the histopathological findings did not fully correspond with the biochemical results. Although ATP and melatonin antagonized the effects of olaparib on oxidant, antioxidant, and proinflammatory cytokine parameters to a comparable extent, ATP more effectively prevented histopathological alterations than melatonin. Our previous study demonstrated that ATP and melatonin improved hydropic degeneration and necrosis in liver tissue to a comparable extent.22 In contrast, another study reported that melatonin exerted weaker protective effects than ATP on the morphological integrity of optic nerve tissue under oxidative stress conditions.32
Limitations and Future Perspectives
The interpretation of the present findings should be made in light of certain limitations inherent to this study. First, the results were obtained using an experimental rat model; therefore, direct translation of these findings to human clinical practice should be interpreted with caution. Although animal models provide valuable mechanistic insights into drug-induced hepatotoxicity, further well-designed clinical and translational studies are required to validate the hepatoprotective efficacy of ATP in humans. Second, the experimental design did not include an ATP-alone treatment group, which would have allowed determination of whether exogenous ATP exerts intrinsic effects on oxidative stress markers, liver enzymes, or hepatic histology independent of olaparib. However, the direct measurement of hepatic ATP levels in the present study demonstrated that olaparib significantly depleted intracellular ATP levels while exogenous ATP administration significantly restored them, partially mitigating this limitation by providing biochemical evidence linking the observed protective effects to the restoration of intracellular ATP homeostasis. Future studies should incorporate an ATP-alone control group to address this gap. Third, mitochondrial dysfunction and oxidative stress are complex biological processes regulated by multiple intracellular signaling pathways. However, key molecular mediators such as Nrf2, NF-κB, apoptotic markers, and mitochondrial respiratory chain activity were not evaluated in the present study. Consequently, the precise intracellular mechanisms underlying ATP-mediated hepatoprotection remain to be elucidated. Fourth, ATP and melatonin were assessed using a single-dose regimen over a defined treatment period. As a result, potential dose–response relationships, optimal therapeutic dosing strategies, and long-term protective effects could not be determined within the scope of the current experimental design. Fifth, the experimental design included only male rats; therefore, potential sex-dependent variations in drug metabolism, redox-related responses, and susceptibility to hepatotoxicity were not evaluated.
Conclusions
This study demonstrates that olaparib induces hepatotoxicity in rats, which is closely associated with enhanced oxidative stress, suppression of the antioxidant defense system, and activation of inflammatory pathways. Administration of exogenous ATP and melatonin significantly suppressed olaparib-induced increases in oxidative and proinflammatory markers, as well as the depletion of endogenous antioxidants, with both agents exerting comparable protective effects at the biochemical level. The greater effectiveness of ATP compared with melatonin, particularly in promoting histopathological recovery and normalization of aminotransferase levels, highlights the decisive role of energy homeostasis in the preservation of cellular viability. This interpretation is directly supported by the hepatic ATP measurements obtained in the present study, which demonstrated that olaparib significantly depleted intracellular hepatic ATP levels, whereas exogenous ATP administration significantly restored these levels, to an extent significantly greater than that achieved by melatonin. These findings are consistent with the prevailing view in the literature that antioxidant depletion alone is insufficient to initiate irreversible cell death, whereas subsequent ATP depletion constitutes a critical determinant of irreversible cellular injury. Collectively, the present data suggest that ATP may represent a promising therapeutic strategy for the prevention of olaparib-associated hepatotoxicity, underscoring the importance of preserving mitochondrial function and cellular energy balance in mitigating drug-induced liver injury.
Use of Artificial Intelligence
The authors acknowledge the use of ChatGPT (OpenAI, San Francisco, CA, USA; GPT-5.3, accessed via ChatGPT Plus, 2026) for assistance with language editing and enhancing the clarity of the manuscript. All AI-generated content was thoroughly reviewed, verified, and refined by the authors, who assume full responsibility for the accuracy and integrity of the final version.
Data Sharing Statement
Data are available from the corresponding author, Ahmed Ramiz Baykan upon request. All data are included in this published article.
Author Contributions
All authors made a significant contribution to the work reported, whether that is in the conception, study design, execution, acquisition of data, analysis and interpretation, or in all these areas; took part in drafting, revising or critically reviewing the article; gave final approval of the version to be published; have agreed on the journal to which the article has been submitted; and agree to be accountable for all aspects of the work.
Funding
This research received no external funding.
Disclosure
The authors declare no conflicts of interest.
References
1. Bochum S, Berger S, Martens UM. Olaparib. Recent Results Cancer Res. 2018;211:217–17. doi:10.1007/978-3-319-91442-8_15
2. Hage Chehade C, Gebrael G, Sayegh N, et al. A pan-tumor review of the role of poly(adenosine diphosphate ribose) polymerase inhibitors. CA Cancer J Clin. 2025;75(2):141–167. doi:10.3322/caac.21870
3. Goulooze SC, Cohen AF, Rissmann R. Olaparib. Br J Clin Pharmacol. 2016;81(1):171–173. doi:10.1111/bcp.12761
4. Zhu K, Drew Y, Jayakumar S. Challenges in PARP inhibitor therapy: a case of Olaparib-induced liver injury and successful rechallenge with Niraparib. Gynecol Oncol Rep. 2024;54:101439. doi:10.1016/j.gore.2024.101439
5. Morais GCF, Alves GB, Hossain MS, Sindi ER, Zaki MEA, Oliveira JIN. Olaparib in pancreatic cancer: a computational study on safety and toxicological implications. Int J Surg. 2025;111(7):4914–4916. doi:10.1097/JS9.0000000000002523
6. Hou D, Liu Z, Xu X, et al. Increased oxidative stress mediates the antitumor effect of PARP inhibition in ovarian cancer. Redox Biol. 2018;17:99–111. doi:10.1016/j.redox.2018.03.016
7. Shi C, Pan L, Amano S, Wu MY, Li C, Lin J. Co-Inhibition of PARP and STAT3 as a promising approach for triple-negative breast cancer. Biomolecules. 2025;15(7). doi:10.3390/biom15071035
8. Tufoni M, Serena Ricci C, Zaccherini G. A case of immune-mediated liver injury induced by olaparib. Hepatology. 2018;68(5):2039–2041. doi:10.1002/hep.30119
9. Gao X, Yin Q, Wang Z. Olaparib triggers mitochondrial fission through the CDK5/Drp-1 signaling pathway in ovarian cancer cells. J Biochem Mol Toxicol. 2025;39(6):e70273. doi:10.1002/jbt.70273
10. Mihajlovic M, Vinken M. Mitochondria as the target of hepatotoxicity and drug-induced liver injury: molecular mechanisms and detection methods. Int J Mol Sci. 2022;23(6). doi:10.3390/ijms23063315
11. Bulut S, Süleyman H. Relationship between oxidative stress and cellular adenosine triphosphate levels. Recent Trends Pharmacol. 2024;2(2):79–82. doi:10.62425/rtpharma.1467636
12. Nankivell MC, Rosenfeldt F, Pipingas A, Pase MP, Reddan JM, Stough C. Coenzyme Q10 and cognition: a review. Nutrients. 2025;17(17). doi:10.3390/nu17172896
13. Banerjee P, Gaddam N, Chandler V, Chakraborty S. Oxidative stress-induced liver damage and remodeling of the liver vasculature. Am J Pathol. 2023;193(10):1400–1414. doi:10.1016/j.ajpath.2023.06.002
14. Dunn J, Grider MH. Physiology, Adenosine Triphosphate. In: StatPearls. Treasure Island (FL): StatPearls Publishing; 2026. PMID: 31985968.
15. Nguyen MT, Lian A, Guilford FT, Venketaraman V. A literature review of glutathione therapy in ameliorating hepatic dysfunction in non-alcoholic fatty liver disease. Biomedicines. 2025;13(3). doi:10.3390/biomedicines13030644
16. Kandefer MY, Sezgin ET, Suleyman B, et al. Mitigating hydroxychloroquine-induced oxidative liver damage: the roles of adenosine triphosphate, liv-52, and their combination in rats. Int J Mol Sci. 2025;27(1). doi:10.3390/ijms27010421
17. Lu SC. Dysregulation of glutathione synthesis in liver disease. Liver Res. 2020;4(2):64–73. doi:10.1016/j.livres.2020.05.003
18. Saquet AA, Streif J, Bangerth F. Changes in ATP, ADP and pyridine nucleotide levels related to the incidence of physiological disorders in ‘Conference’ pears and ‘Jonagold’ apples during controlled atmosphere storage. J Hortic Sci Biotech. 2000;75(2):243–249. doi:10.1080/14620316.2000.11511231
19. Yi C, Jiang YM, Shi J, et al. ATP-regulation of antioxidant properties and phenolics in litchi fruit during browning and pathogen infection process. Food Chem. 2010;118(1):42–47. doi:10.1016/j.foodchem.2009.04.074
20. Swennen EL, Dagnelie PC, Bast A. ATP inhibits hydroxyl radical formation and the inflammatory response of stimulated whole blood even under circumstances of severe oxidative stress. Free Radic Res. 2006;40(1):53–58. doi:10.1080/10715760500364298
21. Karadogan MT, Yavuzer B, Gursul C, et al. Comparative study of the protective effects of adenosine triphosphate and resveratrol against amiodarone-induced potential liver damage and dysfunction in rats. Adv Clin Exp Med. 2025;34(12):2137–2152. doi:10.17219/acem/202011
22. Ciftel S, Ciftel S, Altuner D, et al. Effects of adenosine triphosphate, thiamine pyrophosphate, melatonin, and liv-52 on subacute pyrazinamide proliferation hepatotoxicity in rats. BMC Pharmacol Toxicol. 2025;26(1):67. doi:10.1186/s40360-025-00901-7
23. Percie du Sert N, Hurst V, Ahluwalia A, et al. The ARRIVE guidelines 2.0: updated guidelines for reporting animal research. PLoS Biol. 2020;18(7):e3000410. doi:10.1371/journal.pbio.3000410
24. Kiani AK, Pheby D, Henehan G, et al. Ethical considerations regarding animal experimentation. J Prev Med Hyg. 2022;63(2 Suppl 3):E255–E266. doi:10.15167/2421-4248/jpmh2022.63.2S3.2768
25. Goth L. A simple method for determination of serum catalase activity and revision of reference range. Clin Chim Acta. 1991;196(2–3):143–151. doi:10.1016/0009-8981(91)90067-m
26. Bradford MM. A rapid and sensitive method for the quantitation of microgram quantities of protein utilizing the principle of protein-dye binding. Anal Biochem. 1976;72:248–254. doi:10.1016/0003-2697(76)90527-3
27. Ozhan Y, Guzelmeric E, Cokceken Z, et al. Exploring the cytoprotective potential of Sideritis congesta extracts in APAP-induced hepatotoxicity: in vitro and in silico approaches. Food Chem Toxicol. 2026;207:115825. doi:10.1016/j.fct.2025.115825
28. Joseph TT, Schuch V, Hossack DJ, Chakraborty R, Johnson EL. Melatonin: the placental antioxidant and anti-inflammatory. Front Immunol. 2024;15:1339304. doi:10.3389/fimmu.2024.1339304
29. Hong T, Lei G, Chen X, et al. PARP inhibition promotes ferroptosis via repressing SLC7A11 and synergizes with ferroptosis inducers in BRCA-proficient ovarian cancer. Redox Biol. 2021;42:101928. doi:10.1016/j.redox.2021.101928
30. Redegeld FA, Moison RM, Koster AS, Noordhoek J. Depletion of ATP but not of GSH affects viability of rat hepatocytes. Eur J Pharmacol. 1992;228(4):229–236. doi:10.1016/0926-6917(92)90034-a
31. Tordjman S, Chokron S, Delorme R, et al. Melatonin: pharmacology, functions and therapeutic benefits. Curr Neuropharmacol. 2017;15(3):434–443. doi:10.2174/1570159X14666161228122115
32. Somuncu AM, Parlak Somuncu B, Ozbay AD, et al. Potential effects of adenosine triphosphate and melatonin on oxidative and inflammatory optic nerve damage in rats caused by 5-fluorouracil. Int J Ophthalmol. 2025;18(2):222–228. doi:10.18240/ijo.2025.02.04
33. Hamam H, DemİR H, Aydin M, DemİR C. Determination of some antioxidant activities (Superoxide dismutase, catalase, reduced glutathione) and oxidative stress level (Malondialdehyde acid) in cirrhotic liver patients. Middle Black Sea J Health Sci. 2022;8(4):506–514. doi:10.19127/mbsjohs.1108726
34. Goc Z, Szaroma W, Kapusta E, Dziubek K. Protective effects of melatonin on the activity of SOD, CAT, GSH-Px and GSH content in organs of mice after administration of SNP. Chin J Physiol. 2017;60(1):1–10. doi:10.4077/CJP.2017.BAF435
35. Satoh E, Tsukimoto M, Kojima S. Involvement of P2Y receptors in the protective effect of ATP towards the cell damage in HaCaT cells exposed to H(2)O(2). J Toxicol Sci. 2011;36(6):741–750. doi:10.2131/jts.36.741
36. Tanaka T, Narazaki M, Masuda K, Kishimoto T. Regulation of IL-6 in immunity and diseases. Adv Exp Med Biol. 2016;941:79–88. doi:10.1007/978-94-024-0921-5_4
37. Manful CF, Fordjour E, Ikumoinein E, Abbey L, Thomas R. Therapeutic strategies targeting oxidative stress and inflammation: a narrative review. BioChem. 2025;5(4):35. doi:10.3390/biochem5040035
38. Shen Z, Zhou Y, Qu L, Lei H. ATP serves an anti-inflammatory role by enhancing beta-defensin-2 response in acute pneumonia of rat. Biomed Rep. 2017;6(6):649–653. doi:10.3892/br.2017.906
39. Farhan M, Rehman S, Zehra SR, Ahmed S, Saghir NA. Analysis of hepatic function markers in chronic liver disease patients according to child-pugh classifıcations. Xi’an Shiyou Daxue Xuebao. 2024;67(04). doi:10.5281/zenodo.10953167
40. Kalas MA, Chavez L, Leon M, Taweesedt PT, Surani S. Abnormal liver enzymes: a review for clinicians. World J Hepatol. 2021;13(11):1688–1698. doi:10.4254/wjh.v13.i11.1688
41. Zimmermann H. Extracellular metabolism of ATP and other nucleotides. Naunyn Schmiedebergs Arch Pharmacol. 2000;362(4–5):299–309. doi:10.1007/s002100000309
42. Linden J. New insights into the regulation of inflammation by adenosine. J Clin Invest. 2006;116(7):1835–1837. doi:10.1172/JCI29125
43. Chaudry IH. Does ATP cross the cell plasma membrane. Yale J Biol Med. 1982;55(1):1–10.
44. Rapaport E, Fontaine J. Anticancer activities of adenine nucleotides in mice are mediated through expansion of erythrocyte ATP pools. Proc Natl Acad Sci U S A. 1989;86(5):1662–1666. doi:10.1073/pnas.86.5.1662
45. Jager R, Roberts MD, Lowery RP, et al. Oral adenosine-5’-triphosphate (ATP) administration increases blood flow following exercise in animals and humans. J Int Soc Sports Nutr. 2014;11:28. doi:10.1186/1550-2783-11-28
46. Forte GM, Davie E, Lie S, et al. Import of extracellular ATP in yeast and man modulates AMPK and TORC1 signalling. J Cell Sci. 2019;132(7). doi:10.1242/jcs.223925
47. Qian Y, Wang X, Liu Y, et al. Extracellular ATP is internalized by macropinocytosis and induces intracellular ATP increase and drug resistance in cancer cells. Cancer Lett. 2014;351(2):242–251. doi:10.1016/j.canlet.2014.06.008
48. Wang X, Li Y, Qian Y, et al. Extracellular ATP, as an energy and phosphorylating molecule, induces different types of drug resistances in cancer cells through ATP internalization and intracellular ATP level increase. Oncotarget. 2017;8(50):87860–87877. doi:10.18632/oncotarget.21231
49. Begriche K, Massart J, Robin MA, Borgne-Sanchez A, Fromenty B. Drug-induced toxicity on mitochondria and lipid metabolism: mechanistic diversity and deleterious consequences for the liver. J Hepatol. 2011;54(4):773–794. doi:10.1016/j.jhep.2010.11.006
50. Korolczuk A, Caban K, Amarowicz M, Czechowska G, Irla-Miduch J. Oxidative stress and liver morphology in experimental cyclosporine a-induced hepatotoxicity. Biomed Res Int. 2016;2016:5823271. doi:10.1155/2016/5823271
 © 2026 The Author(s). This work is published and licensed by Dove Medical Press Limited. The
full terms of this license are available at https://www.dovepress.com/terms
and incorporate the Creative Commons Attribution
- Non Commercial (unported, 4.0) License.
By accessing the work you hereby accept the Terms. Non-commercial uses of the work are permitted
without any further permission from Dove Medical Press Limited, provided the work is properly
attributed. For permission for commercial use of this work, please see paragraphs 4.2 and 5 of our Terms.
© 2026 The Author(s). This work is published and licensed by Dove Medical Press Limited. The
full terms of this license are available at https://www.dovepress.com/terms
and incorporate the Creative Commons Attribution
- Non Commercial (unported, 4.0) License.
By accessing the work you hereby accept the Terms. Non-commercial uses of the work are permitted
without any further permission from Dove Medical Press Limited, provided the work is properly
attributed. For permission for commercial use of this work, please see paragraphs 4.2 and 5 of our Terms.