")
Back to Journals » International Journal of Nanomedicine » Volume 19
Potential Exploration of Biocompatible Carbon-Coated MoSe2 Nanoparticles for Exploration of the Photothermal Potential in the Treatment of Human Choriocarcinoma
Authors Yu H , He X, Yao J, Gu X, Zhou L, Gao L , Wang J
Received 14 October 2023
Accepted for publication 3 February 2024
Published 7 March 2024 Volume 2024:19 Pages 2359—2375
DOI https://doi.org/10.2147/IJN.S444738
Checked for plagiarism Yes
Review by Single anonymous peer review
Peer reviewer comments 2
Editor who approved publication: Professor R.D.K. Misra
Hui Yu,1 Xinyi He,1 Jinmeng Yao,1 Xiaoya Gu,1 Lin Zhou,1 Li Gao,1,2 Jia Wang1
1Department of Obstetrics and Gynecology, The First Affiliated Hospital of Xi’an Jiaotong University, Xi’an Jiaotong University, Xi’an, Shaanxi, People’s Republic of China; 2Health Science Center, Xi’an Jiaotong University, Xi’an, Shaanxi, People’s Republic of China
Correspondence: Jia Wang; Li Gao, Email [email protected]; [email protected]
Background: Molybdenum diselenide (MoSe2), as a nano near-infrared absorber, has been widely studied in the field of photothermal therapy of cancer. However, there is little research on its application in the treatment of human choriocarcinoma.
Methods and Results: In this paper, a new type of carbon-coated MoSe2 (MEC) nanoparticles was prepared by a one-step hydrothermal method. The chemical characterization including SEM, TEM, EDS, XRD, FT-IR, TGA, Roman, and XPS showed that MEC was successfully synthesized. MEC exhibited a high photothermal conversion efficiency (50.97%) and extraordinary photothermal stability under laser irradiation. The cell experiment results showed that MEC had good biocompatibility on normal cells while significant photothermal effect on human choriocarcinoma (JEG-3) cells, achieving a good anticancer effect. The level of reactive oxygen species (ROS) in JEG-3 cells was significantly increased under the combination of MEC nanoparticles and near-infrared radiation. MEC nanoparticles could induce apoptosis of JEG-3 cells in combination with near-infrared radiation. Finally, transcriptomic analysis verified that MEC combined with laser radiation could inhibit DNA replication and induce apoptosis, thus improving its therapeutic effect on human choriocarcinoma.
Conclusion: MEC nanoparticles exert an excellent photothermal effect and may become an important candidate drug for the treatment of human choriocarcinoma.
Keywords: MoSe2, carbon-coated, biocompatibility, human choriocarcinoma, photothermal therapy
Introduction
Human choriocarcinoma is a rare gynecological malignant tumor, which originated from trophoblast, that is, a malignant tumor of placental tissue.1,2 It mainly occurs in pregnant women and postpartum women, especially in late pregnancy and postpartum. The incidence of human choriocarcinoma in gynecological cancer is low, but its mortality is relatively high, mainly due to misdiagnosis and lack of early diagnostic methods.3
Photo-thermal therapy (PTT) is a kind of treatment methods that locally heats tumor tissue with light energy, thus damaging it. It includes the use of photosensitizer to convert light energy in tumor tissue into heat energy so that it can be heated locally to achieve the purpose of killing tumor cells. PTT has been applied in many cancer types and is considered a promising treatment.4–12 Molybdenum diselenide (MoSe2) is a new photothermal agent and a near-infrared (NIR) absorption nano-material. It has excellent photothermal therapeutic effects and has made many achievements in the study of cancer photothermal treatment, such as breast cancer, lung cancer, prostate cancer, and lymphoma.13–18 Liu et al used a simple method to synthesize molybdenum diselenide nanoparticles (MoSe2 NPs) as a carrier, loaded with photosensitizer ICG and formed a nano-system with photothermal/photodynamic functions (MoSe2@ICG-PDA-HA) under near-infrared irradiation. A large number of experiments proved that MoSe2@ICG-PDA-HA could significantly inhibit the growth of 4T1 cells and their metastasis.19 However, the biocompatibility and stability of MoSe2 may not meet the requirements in some cases, so surface treatment is needed.20–28 MoSe2 is usually modified by coating to form a core structure, which can isolate nano-materials from the external environment, thus improving chemical stability and biocompatibility. Gao et al prepared carbon-coated MoSe2 nanoparticles and studied its anticancer effect on renal cancer. The experimental results show that doped carbon-coated MoSe2 nanoparticles have obvious anti-cancer effects on renal cell carcinoma 786-O and ACHN cells and have good biocompatibility with KH-2 cells.29 Poly-dopamine has unique characteristics, such as good biocompatibility, biodegradability, strong near-infrared absorption ability and rich surface functional groups, which makes it very suitable as a shell material for surface modification of nano-materials.23 Wang et al developed a new type of photothermal nanocarrier based on poly-dopamine coated MoSe2 (MoSe2@PDA), which showed good biocompatibility, good stability, and high photothermal conversion efficiency. In vivo experiments showed that they destroyed tumor tissues strongly and almost completely killed tumor cells.30 MoSe2-polyvinylpyrrolidone nanoparticles were exposed to oxygen, and Mo atoms reacted with Se atoms, and polyvinylpyrrolidone was modified on the surface of MoSe2 at the same time due to the chelating coordination of O and Mo atoms, so it had good biocompatibility and high stability.21
Although there were many related studies evaluating the corresponding biomedical properties after chemical modification of MoSe2 nanoparticles,20–28 this study innovatively prepared a new composite nano-material carbon-coated MoSe2 (MEC) and explored its photothermal potential in the treatment of human choriocarcinoma, which made up for the shortcomings of MoSe2 related research and the treatment of human choriocarcinoma.
Methods
Materials
Selenium (Se) powder was purchased from Beilian Fine Chemicals Development Co., Ltd (Tianjin, China). Sodium molybdate (Na2MoO4⋅2H2O) was purchased from Chemical Reagent Plant four (Tianjin, China). Hydrazine hydrate (80%, N2H4⋅H2O) was purchased from Fuyu Fine Chemical Co., Ltd (Tianjin, China). Ethanol was purchased from Damao Chemical Reagent Factory (Tianjin, China). The reagents and materials applied in this research were of an analysis grade (AR).
Preparation of MoSe2 (M) Nanoparticles
First of all, add 0.765 g of Na2MoO4⋅2H2O, 0.5 g of selenium powder, and 5 mL of N2H4⋅H2O into 40 mL of deionized water. Then, mix the mixture with a magnetic stirrer at a speed of 1000 r/min for 30 min. Next, transfer the mixture to a 100 mL Teflon high-pressure reaction flask and keep it at a temperature of 200°C for 12 h. After that, cool the high-pressure reaction flask down to room temperature and remove the complex from the flask using a centrifugal separator three times with deionized water. In addition, the deposit obtained after centrifugation is dried at 60°C for 12 h to obtain MoSe2 (M) nanoparticles.
Preparation of Carbon-Coated MoSe2 (MEC) Nanoparticles
About 0.765 g of Na2MoO4⋅2H2O and 0.5 g of selenium powder are added into 40 mL of deionized water, and then 20 mL of ethanol and 10 mL of N2H4⋅H2O are added into the mixture. After stirring for 30 min, the mixture was evenly stirred and transferred to a 100 mL stainless steel autoclave lined with polytetrafluoroethylene and kept at 200°C for 12 h. Then, the reactants were naturally cooled to room temperature, and the suspension was centrifuged. After ultrasonic treatment with deionized water and isopropanol (volume ratio of 1:1) for 2 h, it was washed by centrifugation. After drying at 60°C, black MEC powder was obtained.
Characterization
The surface morphology of nanoparticles was observed by both scanning electron microscopy (SEM, OXFORD instruments, UK) and transmission electron microscopy (TEM, H-7650, HITACHI, Japan). X-ray diffraction (XRD, D8 Advance Diffractometer, Bruker, Germany) was used to analyze the crystal phase structure of the prepared nanoparticles, with Cu-Ka radiation (λ=0.15406 nm) running at 40 kV and 40 mA. Fourier transform infrared spectroscopy (FT-IR, Nicolet iS50 spectrometer, Thermo Fisher Scientific, USA) was used to analyze the chemical functional groups of the prepared nanoparticles, with a spectral resolution of 4 cm−1 in the range of 400–4000 cm−1. The thermal stability of the prepared nanoparticles was analyzed from room temperature to 1000°C by thermogravimetric analysis (TGA, NETZSCH Group, Germany). X-ray photoelectron spectroscopy (XPS, Escalab 250Xi, Thermo Fisher Scientific, USA) was used to analyze the chemical composition of the prepared nanoparticles, with a range of 0–550 eV. Energy dispersive spectrometer (EDS, OXFORD instruments, UK) was used to obtain the elemental maps of the nanoparticles. The structure of the nanoparticles was characterized by Raman spectroscopy (LabRam, HR800, Horiba Jobin-Yvon, excitation source = 532 nm Diode laser, KBSI Gwangju center) at room temperature. Zetasizer Nano-ZS (Malvern, UK) was used to assess the size distribution, hydrodynamic diameter, polydispersity index, and zeta potential.
Cell Culture
Human choriocarcinoma cell line JEG-3 cells were purchased from the Chinese Academy of Sciences Cell Bank (Shanghai, China). Cells were cultured in DMEM high-glucose medium (Gibco) and supplemented with 10% (v/v) fetal bovine serum (FBS, FCS500, ExCell Bio) and a 1% (v/v) penicillin-streptomycin solution (PB180120, Procell, Wuhan, China) at 37°C and 5% CO2 in an incubator. The medium was replaced every 1–2 days, and when the cells reached 80–90% confluence, they were digested with trypsin containing EDTA to subculture.
Photothermal Measurement and Photothermal Stability Assay
About 300 μL of MEC aqueous solution with different concentrations (0, 100, 500, 1000 μg/mL) was placed in a 96-well plate and irradiated with an 808 nm laser device (Dongguan Yizheng Electronic Technology Co. Ltd, China). Temperature changes and infrared thermal images were recorded and acquired by an infrared thermal imager (HIKMICRO, China) at 10-second intervals. For photothermal stability evaluation, 1000 μg/mL of MEC underwent 3 cycles of NIR laser irradiation (5 min irradiation followed by cooling to room temperature). Photothermal conversion efficiency was calculated following the methodology of a previous study.31
Internalization Analysis by TEM
Transmission electron microscopy (TEM) was used to observe the internalization of nanoparticles in JEG-3 cell sections following M or MEC treatment. After 24-hour treatment with 10 μg/mL of particles, JEG-3 cells were fixed in 2.5% glutaraldehyde and 4% paraformaldehyde. After fixation, the cells were rinsed with 0.1 M phosphate buffer and underwent a second fixation in 1% osmic acid. Following the rinse with 0.1 M phosphate buffer, the cells were dehydrated in an acetone solution. The dehydrated and fixed cells were embedded in polymerized epoxy resin and sectioned to thicknesses of 70–90 nm. After staining with uranyl acetate and lead citrate, the sections were mounted onto copper grids for observation under an H-7650 TEM (Hitachi, Japan).
Cell Viability Experiment
In vitro cytotoxicity is evaluated using the 3-(4,5-dimethylthiazol-2-yl)-2,5-diphenyltetrazolium bromide (MTT) assay. Firstly, JEG-3 cells are seeded at a density of 5×10³/well in a 96-well plate overnight. The next day, the cells are treated with different concentrations of M or MEC dispersed in a culture medium. After 12 h, the laser-irradiated group of cells is irradiated with an 808 nm near-infrared laser at a power density of 2 W/cm2 for 10 min, and the cells are further cultured in the incubator for another 12 h. In studying the cytotoxicity of MEC on JEG-3 cells and IOSE-80 cells, they were co-cultured for 24 h. The culture medium is then removed, and 100 μL of MTT solution (0.5 mg/mL, Solarbio) is added to each well. The cells are incubated for another 4 h. Finally, the MTT solution is removed, and 150 μL of dimethyl sulfoxide (DMSO) (Sigma) is added to each well to solubilize the blue-colored crystals. The absorbance is measured using an enzyme-linked immunosorbent assay (ELISA) reader (Biotek Synergy Neo2) at a wavelength of 490 nm. The relative cell viability of each treatment group is calculated as the absorbance of the treated group/absorbance of the control group × 100%.
Dead/Living Cell Staining
JEG-3 cells at a density of 1×10⁵/well in 12-well plates were cultured overnight. Add 500 μL of culture medium containing M or MEC (10 μg/mL) to each well and culture for 12 h. Treat the cells with near-infrared light (808 nm, 2 W/cm2) for 10 min after 12 h of culture. Wash the cells with PBS twice and add a staining solution containing Calcein-AM (2 μM) and Propidium (4.5 μM) (Cat No. PF00007, Proteintech, China), which is incubated in the dark at room temperature for 20 min. Observe the cells under an inverted fluorescence microscope (Leica DM IL LED) and capture fluorescence images.
Apoptosis Experiment
Culture the JEG-3 cells at a density of 5×10⁵/well in 6-well plates overnight. The next day, suspend the nanoparticles in the culture medium and adjust the concentration to 10 μg/mL, then add the solution to the cells. Treat the cells for 12 h and then treat the cells with a near-infrared laser (808 nm) for 10 minutes (2 W/cm2) for another 12 h of culture. Collect the culture medium and trypsinize the cells with trypsin without EDTA. Centrifuge the cells at 4°C (300 g, 5 min), then wash the cells with pre-cooled PBS twice. After removing the PBS, add 100 μL 1×Binding Buffer, 5 μL Annexin V-FITC, and 10 μL Propidium Staining Solution (40302ES60, Yeasen Biotechnology Co., Ltd.), gently mix and react for 10–15 min in the dark at room temperature. Set up a control group with cells without treatment. Add 400 μL 1×Binding Buffer and mix well, then store it on ice before measurement with flow cytometry (ACEA NovoCyte, Agilent, USA) and NovoExpress (1.6.1) software for cell detection, recording, and analysis.
Reactive Oxygen Species (ROS) Detection
Culture the JEG-3 cells at a density of 5×10⁵/well in 6-well plates overnight. The next day, suspend the nanoparticles in the culture medium and adjust the concentration to 10 μg/mL, then add the solution to the cells. Treat the cells for 12 h and then treat the cells with a near-infrared laser (808 nm) for 10 min (2 W/cm2) for another 12 h of culture. Wash the cells with PBS twice and trypsinize the cells with trypsin without EDTA. Collect the cells and centrifuge them at 4°C (300 g, 5 min). Add DCFH-DA (S0033S, Beyotime) to the cells and react them at 37°C in the dark for 20 min. Use flow cytometry (ACEA NovoCyte, Agilent, USA) and NovoExpress (1.6.1) software to detect and record the cells.
Transcriptome Sequencing and Bioinformatics Analysis
JEG-3 cells were seeded overnight in 10-cm dishes and treated for 12 h in triplicate with PBS or MEC (10 μg/mL). Following a 10-minute NIR laser irradiation of MEC-treated cells and 12-hour incubation, total RNA was extracted from two groups of cells according to the manufacturer’s instructions using the TRIzol reagent kit (Invitrogen, 10296010CN, USA). After RNA extraction, RNA quality was determined on an Agilent 2100 Bioanalyzer electrophoresis, and eukaryotic mRNA was enriched by Oligo (dT) beads. The enriched mRNA was then fragmented into short fragments with fragmentation buffer and reverse-transcribed into cDNA by using the NEBNext Ultra RNA Library Prep Kit for Illumina (NEB #7530, New England Biolabs, USA). The purified double-stranded cDNA fragments were end-repaired, and a base was added and ligated to Illumina sequencing adapters. The ligation reaction was purified using the AMPure XP Beads (1.0X) and amplified using polymerase chain reaction (PCR). The cDNA libraries were sequenced on the Illumina sequencing platform by Gene Denovo Biotechnology Co., Ltd (Guangzhou, China). DESeq2_edgeR was used to normalize raw counts and identify differentially expressed genes (DEGs) between two groups (fold change ≥ 2 and adjusted P value < 0.05).32 Bioinformatic data processing was performed online with Omicsmart (www.omicsmart.com).
Statistical Analysis
All statistical analyses were performed using GraphPad Prism 8.0.2. Data is represented as the mean ± standard deviation of at least three independent experiments. Statistical significance was determined using one-way and two-way ANOVA to determine the statistical significance of group differences. P values <0.05 were considered to have statistical significance.
Results and Discussion
SEM and TEM Analysis
The microstructure of M and MEC was observed by SEM. Figure 1A and B show the microstructure image of M and the enlarged image of the corresponding part. It can be seen that M nanoparticles are stacked together because of their small size and high surface energy, and they appear as nano-flowers. Figure 1D and E show the microstructure image of MEC and the enlarged image of the corresponding part. It can also be seen that MEC is made of stacked nanosheets, showing a nano-flower shape.33,34 The microstructure of M and MEC was further observed by transmission electron microscopy(TEM). Figure 1C and F show the microstructure images of M and MEC. As can be seen from Figure 1C, M is composed of stacked nanosheets, with relatively dark color and relatively clear edge contour. As can be seen from Figure 1F, compared with M, the surface profile of MEC nanoparticles is relatively vague, and it can be inferred that the surface layer and edge area of MEC nanoparticles are covered by a layer of substance.29
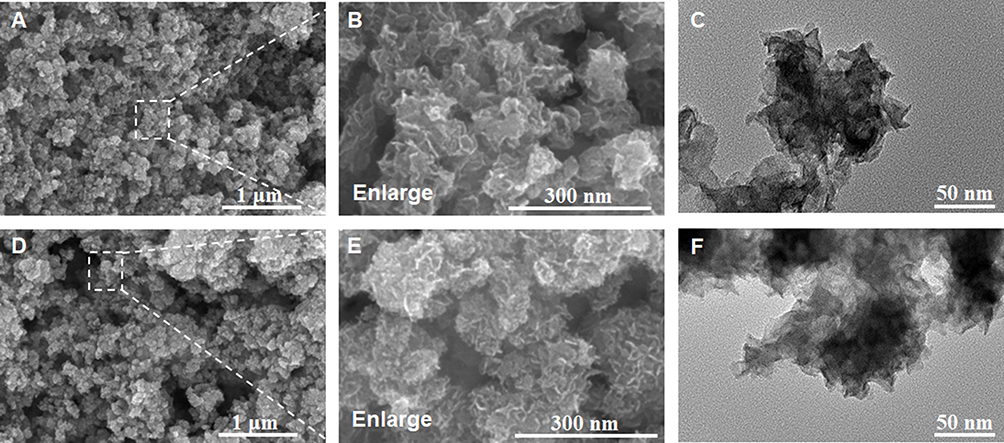 |
Figure 1 Scanning electron microscopy (SEM) images of nanoparticles: (A and B) M, (D and E) MEC, transmission electron microscopy (TEM) images of nanoparticles: (C) M, (F) MEC. |
EDS Analysis
Figure 2A is the SEM image of MEC, and MEC nanoparticles are adsorbed together, which is similar to the result of Figure 1D. Figure 2B–D is the EDS fluorescence image of MEC. Mo and Se elements were detected in MEC nanoparticles, and C element was detected. Based on the results of Figure 1D–F, it can be inferred that MEC nanoparticles were coated with a layer of C.
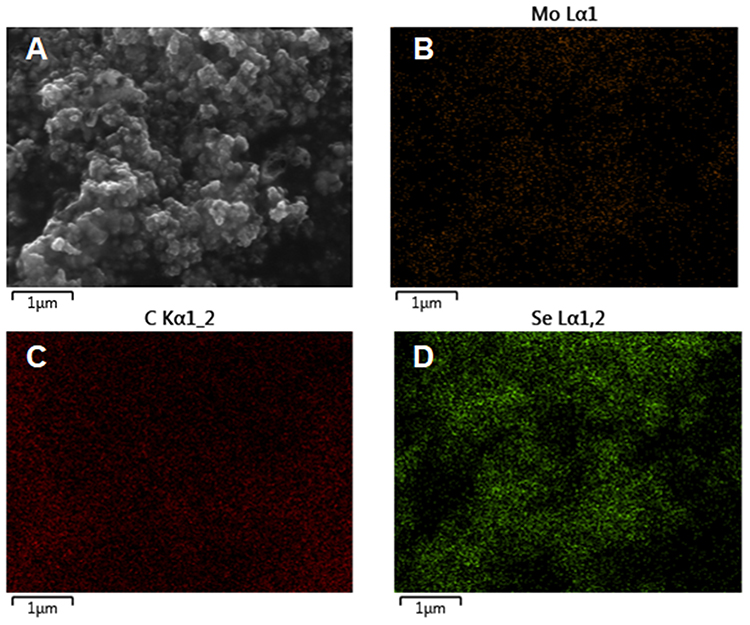 |
Figure 2 (A) SEM image, (B–D) energy-dispersive spectrometer (EDS) element mapping images of MEC. |
XRD, FT-IR, TGA, and Raman Analysis
Figure 3A is an XRD image of M and MEC. It can be seen that M and MEC have detected 100 peaks (32.8°) and 110 peaks (55.6°) at the same position, which is similar to the typical diffraction peak of M (JCPDF#51-0787), and the intensity of two characteristic peaks of M is slightly higher than that of MEC.29,35,36 Figure 3B shows the FT-IR images of M and MEC. It can be seen that Mo-OH, Se-O, and Se-O-Se absorption peaks are detected in both M and MEC, and more absorption peaks can be found in MEC between 500 and 1000 cm−1, which may be caused by the presence of C-containing functional groups.37,38 Figure 3C is the TGA image of M and MEC. It can be seen that M and MEC show roughly the same trend of mass loss during heating, and the weight increases at 302°C, which is due to the reaction between nanoparticles and air: 2MoSe2 + 7O2 = 2MoO3 + 4SeO2, and the mass increases due to the production of solid SeO2. When the temperature rises to 392°C, the SeO2 in M and MEC begins to volatilize, which leads to the sudden decrease of their mass, but the mass decreased by MEC is greater than that of M, which is due to the oxidation of C on the surface of MEC to CO2.39 Figure 3D is the Raman image of M and MEC. It can be seen that M and MEC detected A1g at 240 cm−1,  at 285 cm−1, and G band was detected at 1591cm−1, which indicates that there is element C in both of them, and the intensity of G band of MEC is greater than that of M. The element C in M may be caused by C pollution during preparation.40,41
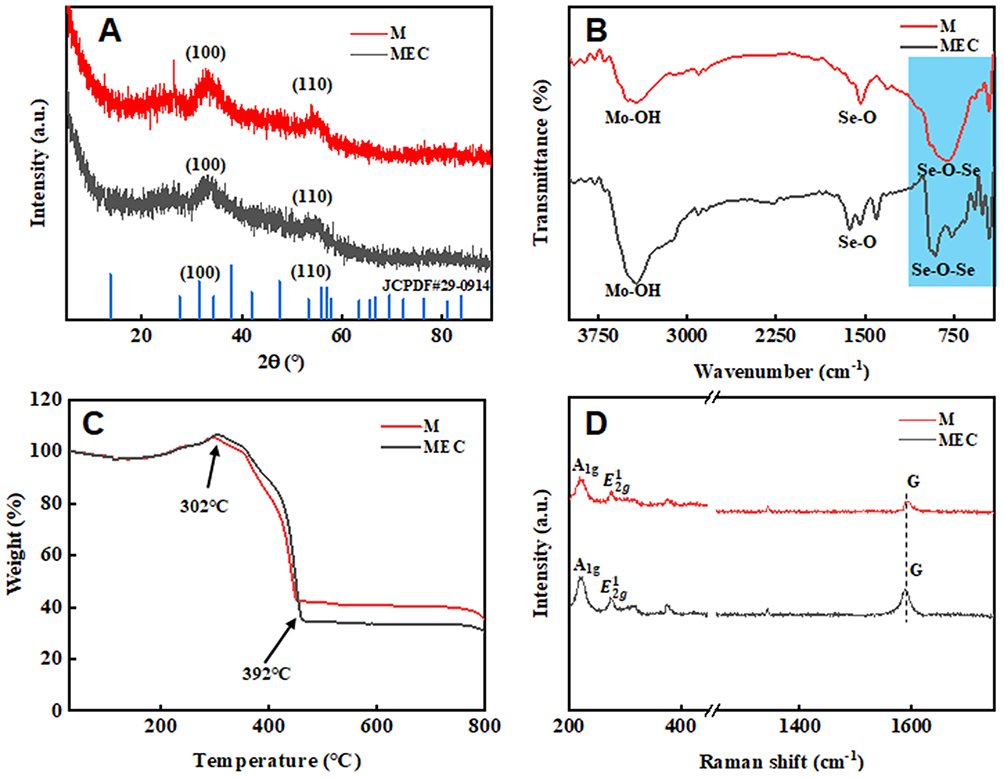 |
Figure 3 (A) X-ray diffraction (XRD) image of M and MEC; (B)Fourier transform infrared spectroscopy (FT-IR) image of M and MEC; (C) Thermogravimetric (TGA) image of M and MEC; (D) Raman image of M and MEC. |
XPS Analysis
Figure 4A–D shows the XPS overview, C 1s, Mo 3d, and Se 3d images of MEC. According to Figure 4A, it can be seen that MEC contains O, C, Mo, and Se elements, and some impurity elements still exist in MEC. Figure 4B is the C 1s image of MEC. COOR front and C-OR front are fitted at 287.6 eV and 284.7 eV, respectively, which may be the main form of C in MEC. Figure 4C is the Mo 3d image of MEC, and the Mo 3d3/2 front, Mo 3d front, and Mo 3d5/2 front are fitted at 230.9 eV, 228.9 eV, and 227.3 eV, respectively, which may be the main existing form of Mo in MEC. Figure 4D is the Se 3d image of MEC, and the Se 3d3/2 front and Se 3d5/2 front are fitted at 54.7 eV and 53.8 eV, respectively, which may be the main form of Se in MEC.35,42–44 Figure 4E–H shows the XPS overview, C 1s, Mo 3d and Se 3d images of M. It can be seen from Figure 4E that the elements corresponding to the XPS image of M are similar to MEC, and the intensity of C 1s is reduced, and C 1s may be caused by air pollution during drying. Figure 4F is the C 1s image of M. Figure 4G is the Mo 3d image of M, and the Mo 3d3/2 front, Mo 3d front, and Mo 3d5/2 front are fitted at 230.8 eV, 228.3 eV and 227.1 eV, respectively, which may be the main existing form of Mo in M. Figure 4H is the Se 3d image of MEC, and the Se 3d3/2 front and Se 3d5/2 front are fitted at 54.6 eV and 53.7 eV, respectively, which may be the main form of Se in M.45
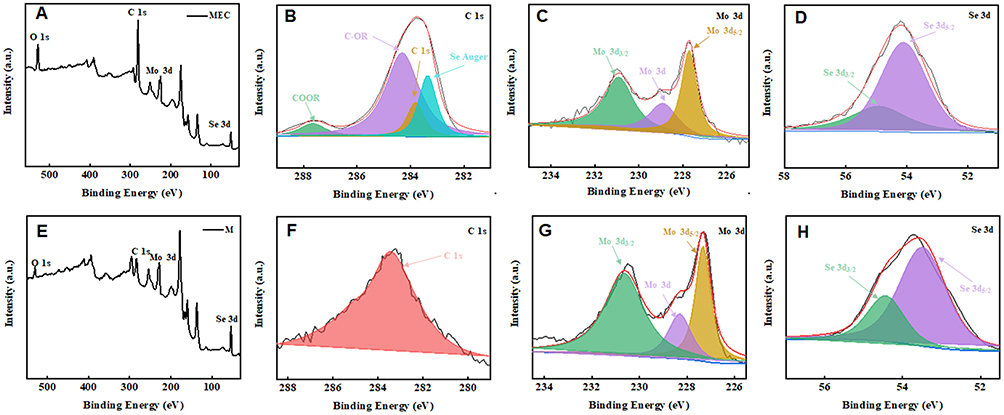 |
Figure 4 X-ray photoelectron spectroscopy (XPS) spectra of MEC: (A) survey, (B) C 1s, (C) Mo 3d, (D) Se 3d; XPS spectra of (M) (E) survey, (F) C 1s, (G) Mo 3d, (H) Se 3d. |
Photothermal Effects of MEC
To confirm the application potential of MEC as a photothermal agent, its temperature change under an 808 nm laser was measured and captured using an infrared thermal imager. Temperature variation curves for different concentrations of MEC subjected to 808 nm NIR laser irradiation were plotted in Figure 5A. Compared to the negligible temperature variation of 0 μg/mL (pure water), 100 μg/mL of MEC showed a significant temperature elevation of 16.2 °C after 2 W/cm2 irradiation for 5 min. At concentrations of 500 μg/mL and 1000 μg/mL, MEC’s temperature increased by 44.4 °C and 64.7 °C, respectively. Under exposure to the radiation, MEC had a rapid temperature rise in a short period and eventually reached a plateau (Figure 5A). Moreover, infrared thermal photographs in Figure 5B provide a visual comparison and support this conclusion. These findings suggested that MEC could cause temperature increase in a concentration-dependent manner under NIR laser irradiation and controlling the concentration of nanoparticles could fine-tune the photothermal effect of MEC. To assess the photothermal stability, MEC underwent three heating (laser-on) and cooling (laser-off) cycles. As shown in Figure 5C, MEC’s temperature quickly rose within 5 min and returned to the initial temperature upon laser deactivation. In three heating-cooling cycles, there was no marked change in the temperature-time curve and peak pattern after the repeated heating-cooling process, suggesting that MEC had extraordinary photothermal stability. Photothermal conversion efficiency (η) served as a critical parameter for evaluating the light-to-heat conversion capability of photothermal agents. Adopting the calculation method reported by Qin et al,31 photothermal conversion efficiency of MEC was determined to be 50.97% (Figure 5D). This exceeds the photothermal conversion efficiency of reported MoSe2 agents, including MoSe2 nanosheets (32.8%), MoSe2@PDA (44.5%) and MoSe2 nanodots (46.5%).30,46 Therefore, MEC demonstrates excellent photothermal performance and photostability, promising for photothermal therapy.
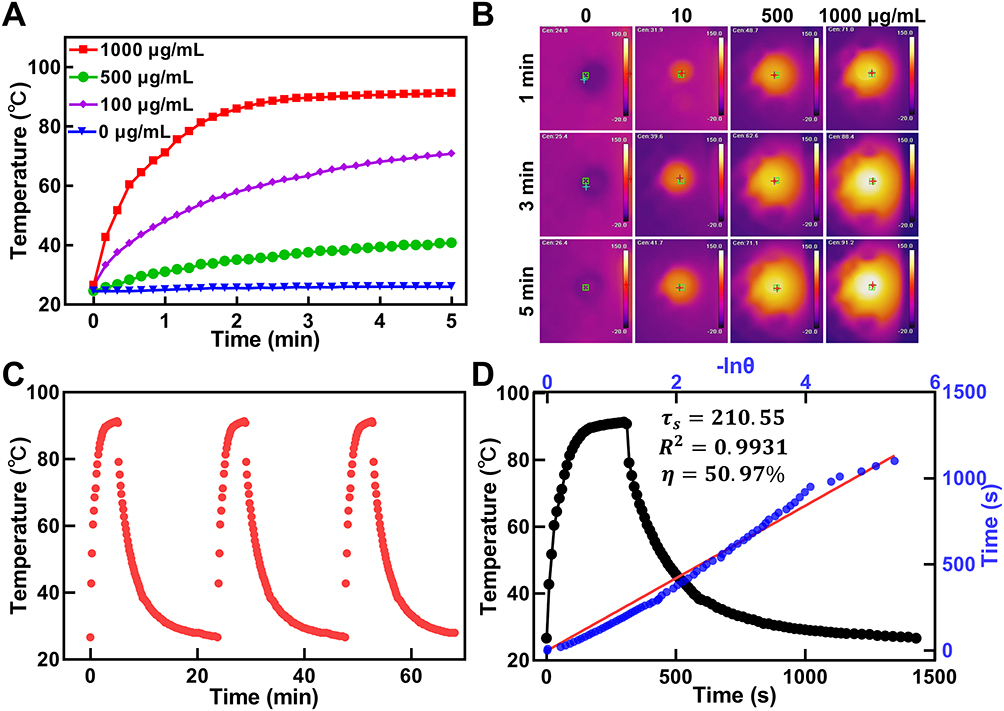 |
Figure 5 Photothermal performance of MEC. Real-time temperature measurements (A) and infrared thermal images (B) of MEC aqueous solution at different concentrations (0, 100, 500, 1000 μg/mL) exposed to NIR laser irradiation (808 nm, 2 W/cm2). (C) Temperature curves of MEC aqueous solution (1000 μg/mL) under NIR laser irradiation (808 nm, 2 W/cm2) for three cycles (5 min of irradiation for each cycle). (D) Determination of MEC’s photothermal conversion efficiency during laser irradiation. Blank dot line: Temperature change curve of the MEC aqueous solution (1000 μg/mL) under NIR laser irradiation (808 nm, 2 W/cm2) for 300 s, followed by laser deactivation. Blue dot and red line: Plot of cooling time (after 300 s) versus negative natural logarithm of driving force temperature. |
Size, Zeta Potential, and Internalization Analysis
Dynamic light scattering (DLS) was used to assess the size distribution, hydrodynamic diameter, polydispersity index (PDI), and zeta potential. Figure 6A shows the size distribution of M and MEC. M has a hydrodynamic diameter of 236.6 nm and PDI of 0.26, while MEC has a hydrodynamic diameter of 321.9 nm and PDI of 0.261. MEC exhibits a larger hydrodynamic diameter than M, and both of them are stable and monodispersed. Because the PDI value was used to evaluate the stability and dispersity of nanoparticles, and PDI less than 0.3 reflects a highly stable distribution of monodispersed particles. Zeta potential is crucial for the stability of nanoparticles, MEC’s zeta potential (−32.97 ± 0.25) was more negative than M’s (−32.07 ± 0.45), as shown in Figure 6B. A highly negative zeta potential indicates good stability of nanoparticles in water. The Bio-TEM was used to observe the internalization of nanoparticles by JEG-3 cells. According to Figure 6C–F, it can be seen that both M and MEC could be internalized by JEG-3 cells and existed in cytoplasm. Enlarged images of the dashed box in Figure 6C and E are shown in Figure 6D and F, respectively. These nanoparticles are easy to agglomerate to form larger particles inside the cytoplasm, which may be beneficial to the photothermal effect. Tumor cells have higher uptake efficiency of these particles, and efficient internalization of particles by tumor cells is crucial for photothermal therapy.
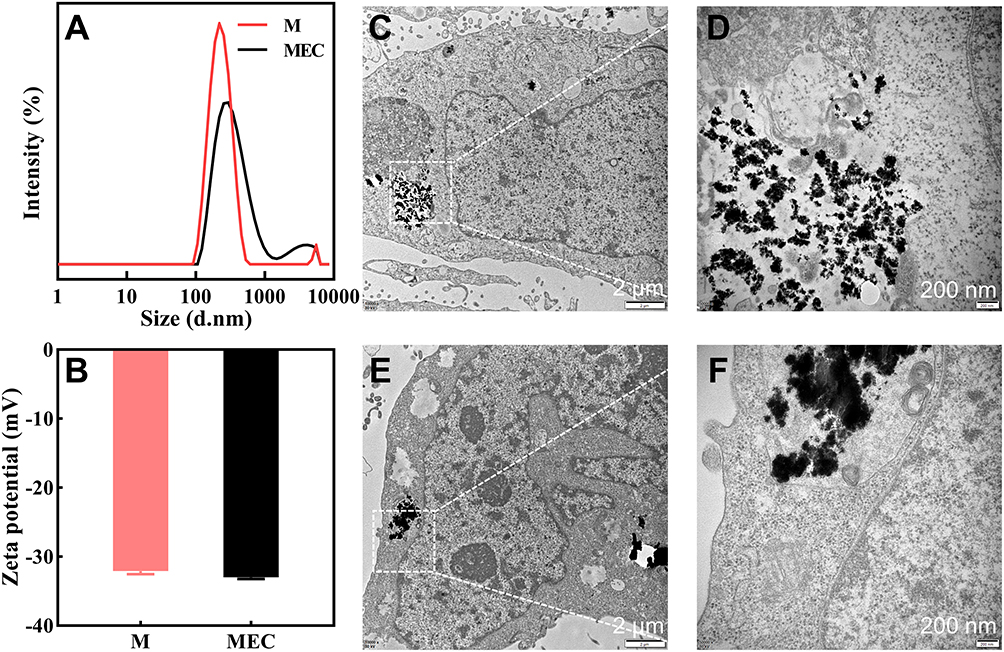 |
Figure 6 Size distribution (A) and zeta potential (B) of M and MEC determined by DLS. Bio-TEM of JEG-3 cells treated with M (C and D) and MEC (E and F). |
Cytotoxicity Analysis
The cytotoxic effects of M and MEC on JEG-3 choriocarcinoma cells were evaluated using the 3-(4,5-dimethylthiazol-2-yl)-2,5-diphenyltetrazolium bromide (MTT) assay after 24 h of treatment. As shown in Figure 7A and B, both M and MEC dose-dependently inhibited cell viability, with MEC showing a stronger cytotoxicity. When MEC was administered at a concentration of 10 μg/mL, the cell viability of JEG-3 cells was 53.75% ± 3.30% after 24 h of treatment. To evaluate the photothermal therapeutic effects of the materials, cells were treated with different concentrations of nanoparticles for 12 h, followed by 10 min of near-infrared light irradiation (808 nm, 2 W/cm2) after another 12 h of culture in a 37°C cell incubator. When MEC was administered at a concentration of 50 μg/mL, the cell viability of JEG-3 cells was 46.33% ± 5.03% after 24 h of treatment, and significant cytotoxicity was observed following irradiation (32.50% ± 7.51%, P < 0.05). At an MEC concentration of 100 μg/mL, laser irradiation caused apparent cytotoxicity due to the PTT effect. Therefore, the particles showed the ability to suppress cell proliferation, and this effect was potentiated by irradiation. The biocompatibility of MEC was evaluated through cytotoxicity tests on a normal cell line. Given the importance of ovarian preservation in choriocarcinoma treatment, we assessed MEC’s cytotoxicity on human normal ovarian epithelial cell line IOSE-80. As shown in Figure 7C, MEC had no significant cytotoxicity towards IOSE-80 cells. Therefore, MEC can kill tumor cells through photothermal effects while sparing normal cells.
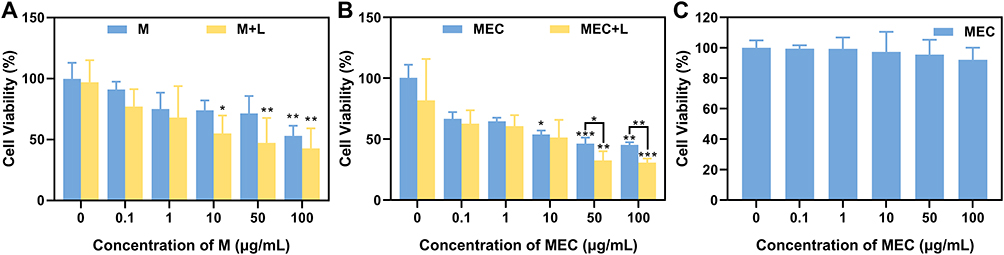 |
Figure 7 Cell viability of JEG-3 cells treated with different concentrations of M (A) and MEC (B) with/without NIR laser irradiation (808 nm, 10 min), (C) Cell viability of IOSE-80 cells treated with different concentrations of MEC. *P < 0.05; **P < 0.01; ***P < 0.001. |
Apoptosis Analysis
Simultaneous staining of living and dead cells using Calcein-AM and propidium iodide (PI) was performed. As shown in Figure 8A, the control group and the laser group showed significant green fluorescence, indicating the presence of many living cells. In the M and M + Laser treated groups, the green fluorescence decreased, while the red fluorescence increased, suggesting the presence of a few dead cells. In the MEC and MEC + Laser treated groups, the red fluorescence increased significantly, indicating a high degree of cell death. Quantification analysis for the percentage of dead cells was shown in Figure 8B as the ratio of intracellular red fluorescence intensity (F.L.) to total fluorescence intensity (F.L.) in live/dead assays. The percentage of dead cells treated with MEC + Laser was higher than in other groups. Apoptosis analysis was performed by flow cytometric quantitation of apoptotic cells labeled with Annexin V-FITC/PI. As shown in Figure 8B and D, the MEC + Laser group had a significantly higher apoptotic rate (79.00% ± 0.33%) compared to the control group (9.54% ± 5.66%), the laser group (14.71% ± 2.13%), the M group (15.15% ± 1.92%), the M + Laser group (21.45% ± 8.63%), and the MEC group (22.57% ± 10.68%) (P < 0.001).
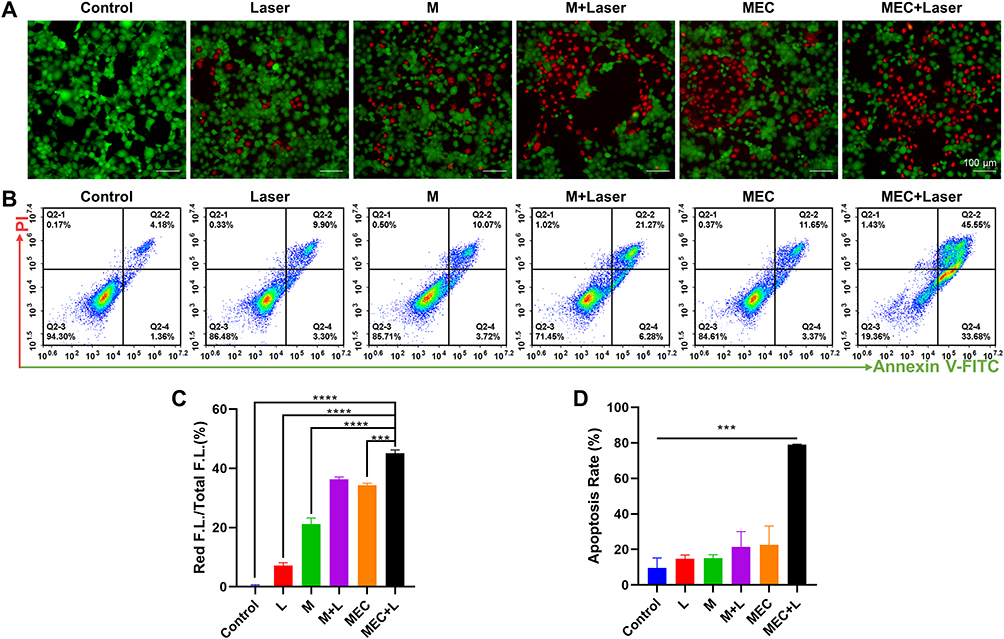 |
Figure 8 (A) Live and dead co-staining images of JEG-3 cells stained by Calcein-AM/PI after various treatments. (B) Apoptosis for JEG-3 cells after being treated with M and MEC with/without NIR laser irradiation (808 nm, 10 min). (C) Quantification of fluorescence intensity in Figure 8A for the ratio of intracellular red fluorescence intensity (F.L.) to total fluorescence intensity (F.L.) in live/dead assays (n=3). (D) Apoptosis rate of JEG-3 cells with flow cytometry in Figure 8B (n=3). *** P < 0.001; **** P < 0.0001. |
ROS Level
The production of ROS was evaluated using a 2′, 7′-dichlorodihydrofluorescein diacetate (DCFH-DA) probe, which is converted into dichlorofluorescein (DCF) with green fluorescence. The intensity of green fluorescence indicates the amount of ROS present in the cell. As shown in Figure 9A, the level of ROS produced by JEG-3 cells after M and MEC treatments significantly increased, which was further confirmed by the quantitative measurement of ROS using flow cytometry (Figure 9B). The experimental results are shown in Figure 9B and D, the level of ROS in the MEC + Laser group (75.92% ± 4.30%) was significantly higher than that in the control group (31.01% ± 8.86%), the laser group (41.65% ± 11.72%), and the M group (45.84% ± 8.87%) (P < 0.01), but there was no statistical difference between the MEC + Laser group (55.24% ± 9.71%) and the MEC group (68.20% ± 3.81%) (P > 0.05).
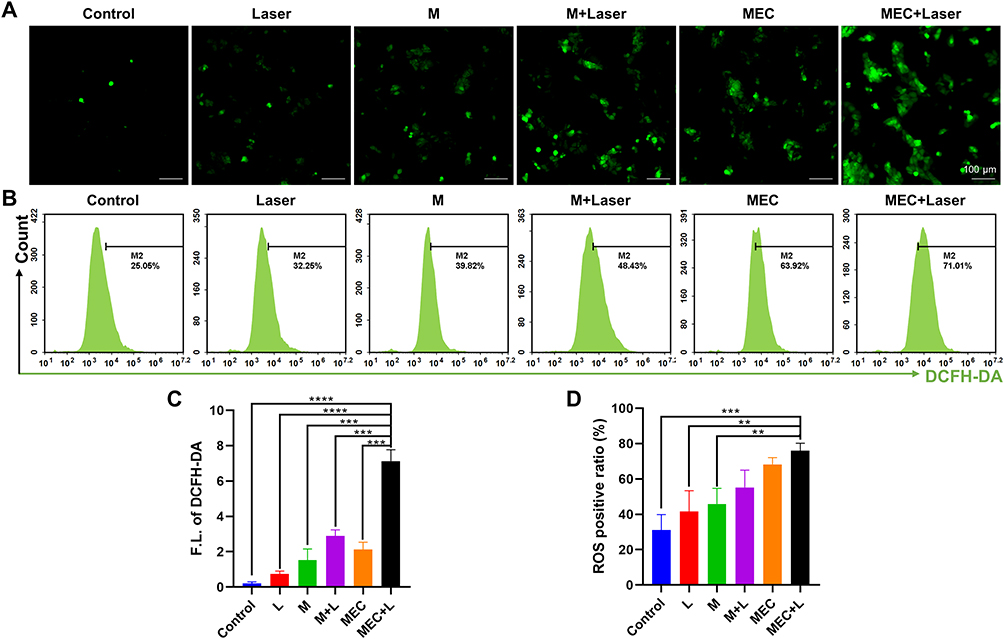 |
Figure 9 Fluorescence microscopic images (A) and flow cytometry analysis (B) of ROS generation with DCFH-DA probe in JEG-3 cells after treated with M and MEC with/without NIR laser irradiation (808 nm, 10 min). (C) Quantification of intracellular ROS fluorescence intensity (F.L.) detected by DCFH-DA probe in Fluorescence microscopic images of Figure 9A (n=3). (D) Quantification of intracellular ROS positive ratio stained with DCFH-DA probe by flow cytometry (n=3). **P < 0.01; ***P < 0.001; ****P < 0.0001. |
MEC Treatment Mechanism Analysis
The therapeutic mechanism of MEC nanoparticles is shown in Figure 10. Firstly, according to the morphology of MEC nanoparticles, it can be seen that MEC nanoparticles are surrounded by a layer of amorphous carbon. Under the condition of near-infrared overexposure (808 nm, 10 min), MEC nanoparticles can generate a lot of heat, and the level of reactive oxygen increases. In this case, MEC nanoparticles effectively reduce the survival rate of JEG-3 cells through the photothermal effect, thus achieving the effect of killing JEG-3 cells and treating cancer.
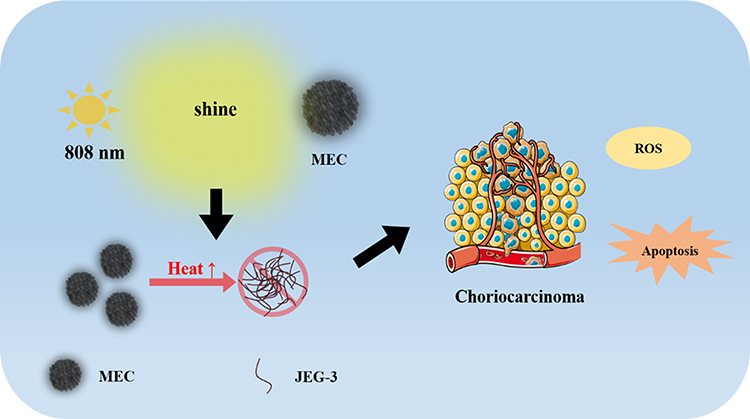 |
Figure 10 Therapeutic mechanism. |
Two groups of JEG-3 cells received high-throughput RNA sequencing (RNA-seq) analysis to further explore the effect mechanism and the regulation of gene expression in MEC therapy with NIR laser irradiation. Each sample has a mapping ratio on the reference genome that ranged from 97.06% to 97.48%, indicating that they are appropriate for subsequent bioinformatic exploration (Table 1).47 Principal Component Analysis (PCA) was utilized to conduct dimensionality reduction analysis on the data to intuitively comprehend the distribution of the data, showing a significant separation of MEC+L and control samples (Figure 11A). Compared with the control group, the expression of 293 genes was upregulated and that of 60 genes was downregulated in the MEC+L group, as shown in Figure 11B for volcano plot and Figure 11C for clustered heat map. Gene Ontology (GO) is an internationally standardized classification system for gene function that offers a dynamically updated controlled vocabulary and a strictly defined concept to thoroughly describe the characteristics of genes and their products in any organism. GO analysis demonstrated that the DEGs were enriched in the regulation of GTPase activity, positive regulation of protein kinase activity, regulation of molecular function, and positive regulation of catalytic activation (Figure 11D). Genes usually coordinate with each other in organisms to perform their biological functions, and pathway-based analysis helps to further understand the biological functions of differential genes. Kyoto Encyclopedia of Genes and Genomes (KEGG) pathway enrichment analysis can identify the most important biochemical and metabolic pathways or signaling pathways in which DEGs are involved. The KEGG analysis showed that DEGs were mainly enriched in the FoxO signaling pathway, HIF-1 signaling pathway, Notch signaling pathway, DNA replication, selenocompound metabolism, and MAPK signaling pathway, etc (Figure 11E). FoxO signaling pathway and HIF-1 signaling pathway are oxidative stress-related pathways, and MAPK signaling pathway was reported as a ROS-mediated pathway.
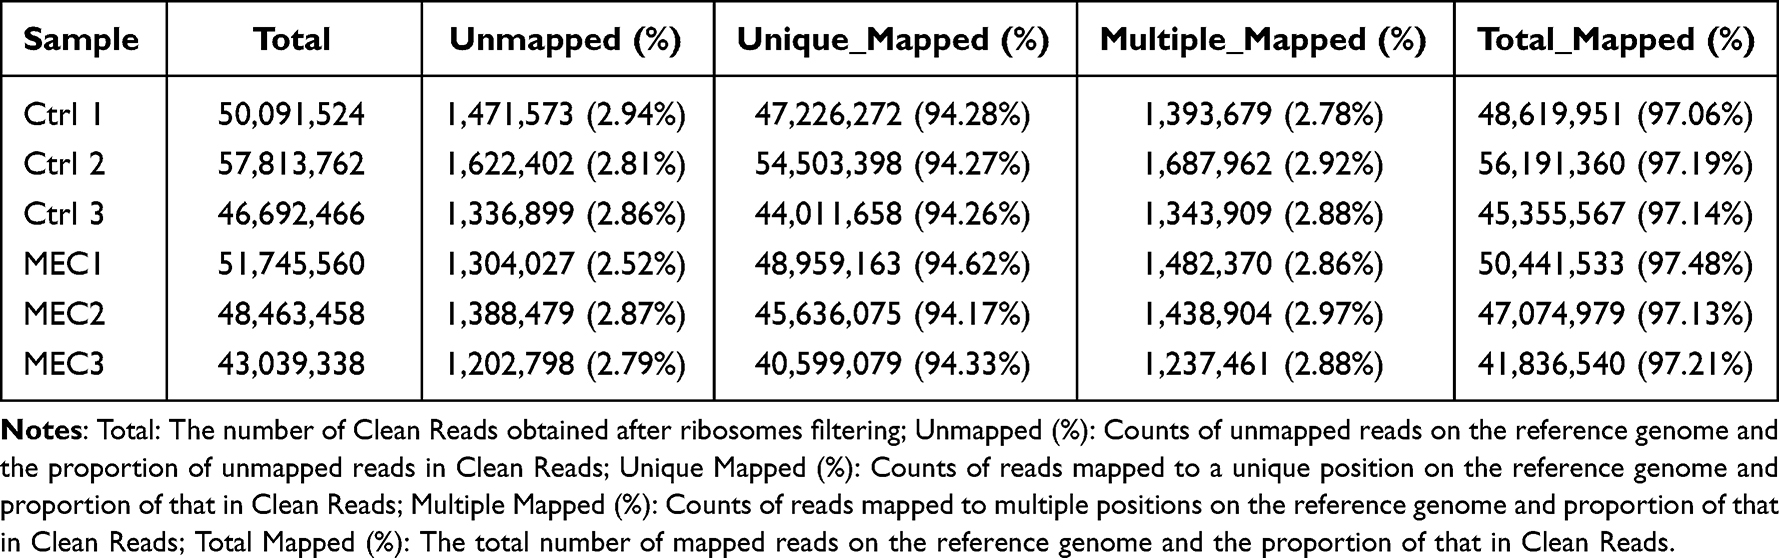 |
Table 1 Statistics on Data Mapping |
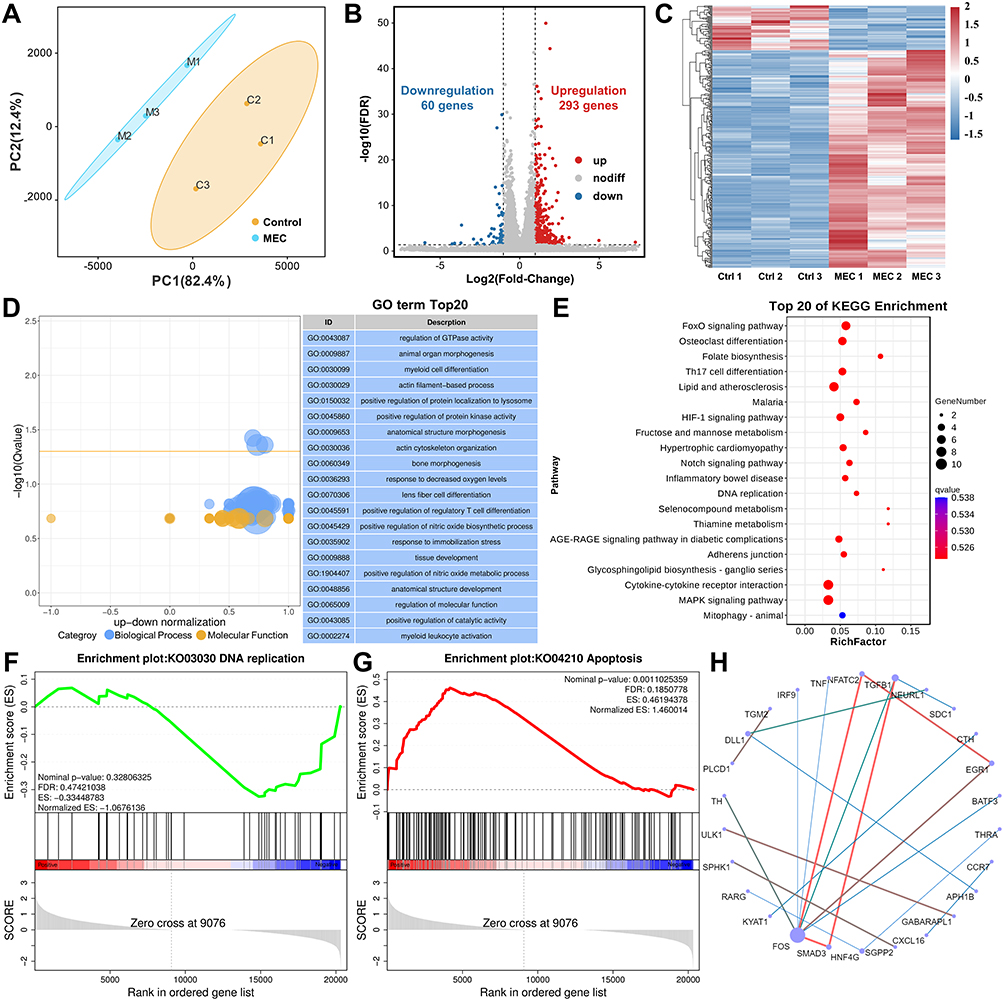 |
Figure 11 Significant changes in mRNA expression in JEG-3 cells with MEC+L treatment identified by high-throughput transcriptomic sequencing. (A) Principal Component Analysis (PCA) of two groups of samples. (B) Volcano plot of DEGs. (C) Clustered heat map of DEGs. The color (from red to blue) represents the level of gene expression (log10 FPKM) from high to low, indicating the upregulation and downregulation of the expression. (D) Bubble plot of GO enrichment of DEGs and Top 20 GO terms. (E) Top 20 pathways enriched by KEGG. (F–G) GSEA enrichment plots of differentially expressed genes centralized in the regulation of (F) DNA replication and (G) apoptosis. (H) The Top 20 hub genes identified in protein–protein interaction (PPI) networks. |
Gene Set Enrichment Analysis (GSEA) can effectively address the shortcomings of traditional enrichment analysis regarding the lack of efficient information mining of microeffective genes and provide a more comprehensive explanation of the regulatory influence of a certain functional pathway.48 To verify the results in living cells, we explored transcriptome sequencing data by GSEA analysis to assess the effect of MEC+L on DNA replication and apoptosis. As shown in Figure 11F, the DNA replication pathway was inhibited by the MEC+L group. Reversely, the apoptosis pathway was activated by the MEC+L group (ES: 0.46, NES: 1.46, NOM p-value: 0.001, FDR q-value: 0.18) as shown in Figure 11G. These findings further confirmed our results in Figures 7B and 8B that MEC in combination with NIR irradiation inhibited cell proliferation and induced apoptosis in JGE-3 cells. To explore the potential function of DEGs, protein–protein interaction (PPI) networks were analyzed by the interactions in the STRING protein interaction database (http://string-db.org).49 The total number of identified DEGs included 1256 gene–gene interactions and 282 gene nodes. The combined score represents the reliability of protein (gene) interactions in the STRING database and a higher score indicates greater reliability. Based on the top 20 combined scores from the STRING database, the string protein–protein interaction networks of DEGs were presented in Figure 11H. As shown in Figure 11H, the FOS gene emerges as a key gene in regulating cell proliferation, differentiation, and apoptosis.50 The transcriptomics study contributed to a deeper comprehension of the underlying mechanism.
Conclusions
In summary, carbon-coated MoSe2 (MEC) nanomaterials were successfully synthesized that verified by a series of chemical characterization. MEC exhibited a high photothermal conversion efficiency and extraordinary photothermal stability under laser irradiation. The results of the biological transmission electron microscope showed that MEC nanoparticles could enter JEG-3 cells. In vitro experiments confirmed that MEC nanoparticles could kill tumor cells, produce ROS, and induce apoptosis under NIR laser irradiation, demonstrating a photothermal effect on human choriocarcinoma cells. Finally, the therapeutic mechanism of MEC nanoparticles is explored by transcriptomic sequencing, which showed that MEC nanoparticles combined with NIR laser irradiation could inhibit DNA replication and induce apoptosis in a complicated regulation network. Thus, our study confirmed the superior photothermal therapy effect of MEC nanoparticles on human choriocarcinoma and a further application for clinical agents will be explored in the future.
Acknowledgments
This work was supported by the Shaanxi Provincial Key Research and Development Program Project(Program No.2020SF-030).
Author Contributions
All authors made a significant contribution to the work reported, whether that is in the conception, study design, execution, acquisition of data, analysis and interpretation, or in all these areas; took part in drafting, revising or critically reviewing the article; gave final approval of the version to be published; have agreed on the journal to which the article has been submitted; and agree to be accountable for all aspects of the work.
Funding
Shaanxi Provincial Key Research and Development Program Project (Program No.2020SF-030).
Disclosure
The authors declare that they have no known competing financial interests or personal relationships that could have influenced the work reported herein.
References
1. Silverberg SGKRJTAJo SP. Tumors of the uterine corpus and gestational trophoblastic disease. Atlas Tumor Pathol. 1993;17:1300–1301.
2. Chen X, Wright JD, Abellar RG, et al. Cytological features of choricarcinoma in ap smear: a case report and literature review. Diagn Cytopathol. 2016;44(4):324–328. doi:10.1002/dc.23417
3. Yelian FD, Liu A, Todt JC, et al. Expression and function of autocrine motility factor receptor in human choriocarcinoma. Gynecologic Oncol. 1996;62(2):159–165. doi:10.1006/gyno.1996.0209
4. Chen J, Ning C, Zhou Z, et al. Nanomaterials as photothermal therapeutic agents. Pro Mater Sci. 2019;99:1–26. doi:10.1016/j.pmatsci.2018.07.005
5. Han HS, Choi KY. Advances in nanomaterial-mediated photothermal cancer therapies: toward clinical applications. Biomedicines. 2021;9(3):305. doi:10.3390/biomedicines9030305
6. Jiang Z, Li T, Cheng H, et al. Nanomedicine potentiates mild photothermal therapy for tumor ablation. Asian J Pharm Sci. 2021;16(6):738–761. doi:10.1016/j.ajps.2021.10.001
7. Lakshmanan SB, Zou X, Hossu M, Ma L, Yang C, Chen W. Local field enhanced Au/CuS Nanocomposites as efficient photothermal transducer agents for cancer treatment. J Biomed Nanotechnol. 2012;8(6):883–890. doi:10.1166/jbn.2012.1486
8. Wang J, Wu X, Shen P, et al. Applications of inorganic nanomaterials in photothermal therapy based on combinational cancer treatment. Int j Nanomed. 2020;15:1903–1914. doi:10.2147/IJN.S239751
9. Yi X, Duan Q-Y, Wu F-G. Low-temperature photothermal therapy: strategies and applications. Research. 2021;2021. doi:10.34133/2021/9816594
10. Yun WS, Park J-H, Lim D-K, Ahn C-H, Sun I-C, Kim K. How did conventional nanoparticle-mediated photothermal therapy become ”hot” in combination with cancer immunotherapy? Cancers. 2022;15(1):14. doi:10.3390/cancers15010014
11. Zhang L, Forgham H, Huang X, et al. All-in-one inorganic nanoagents for near-infrared-II photothermal- based cancer theranostics. Mater Today Adv. 2022;3:14.
12. Zhang L, Oudeng G, Wen F, Liao G. Recent advances in near-infrared-II hollow nanoplatforms for photothermal-based cancer treatment. Biomater Res. 2022;26(1):26. doi:10.1186/s40824-022-00269-3
13. He L, Nie T, Xia X, et al. Designing bioinspired 2D MoSe2 nanosheet for efficient photothermal-triggered cancer immunotherapy with reprogramming tumor-associated macrophages. Adv Funct Mater. 2019;29:2.
14. Wang Y, Zhang F, Wang Q, Yang P, Lin H, Qu F. Hierarchical MoSe2 nanoflowers as novel nanocarriers for NIR-light-mediated synergistic photo-thermal/dynamic and chemo-therapy. Nanoscale. 2018;10(30):14534–14545. doi:10.1039/C8NR04538K
15. Wang Y, Zhao J, Chen Z, et al. Construct of MoSe2/Bi2Se3 nanoheterostructure: multimodal CT/PT imaging-guided PTT/PDT/chemotherapy for cancer treating. Biomaterials. 2019;198:217. doi:10.1016/j.biomaterials.2018.11.030
16. Yuwen L, Zhou J, Zhang Y, et al. Aqueous phase preparation of ultrasmall MoSe 2 nanodots for efficient photothermal therapy of cancer cells. Nanoscale. 2016;8(5):2720–2726. doi:10.1039/C5NR08166A
17. Gao F, Zhang T, Miao Y, et al. Mild hyperthermia synergized chemotherapy by Bi2Se3/MoSe2 nanosaucers for cancer treatment with negligible thermal resistance. Nano Res. 2022;15(9):8270–8280. doi:10.1007/s12274-022-4470-8
18. Zhao J, Zhang Y, Zhang J, et al. Synthetic and Biodegradable Molybdenum (IV) Diselenide Triggers the Cascade Photo- and Immunotherapy of Tumor. Adv Healthcare Mater. 2022;2:11 doi:10.1002/adhm.202200524.
19. Liu Y, Wei C, Lin A, et al. Responsive functionalized MoSe2 nanosystem for highly efficient synergistic therapy of breast cancer. Colloids Surf B Biointerfaces. 2020;3:189.
20. Zhang S, Zhang C, Jia Y, et al. Sandwich-type electrochemical immunosensor based on Au@Pt DNRs/NH2-MoSe2 NSs nanocomposite as signal amplifiers for the sensitive detection of alpha-fetoprotein. Bioelectrochemistry. 2019;128:140–147. doi:10.1016/j.bioelechem.2019.03.012
21. Xie P, Zhang L, Shen H, et al. Biodegradable MoSe2-polyvinylpyrrolidone nanoparticles with multi-enzyme activity for ameliorating acute pancreatitis. J Nanobiotechnol. 2022;20(1):113. doi:10.1186/s12951-022-01288-x
22. Wang L, Hou T, Li Y, Lu H, Gao LJFi C. Lubrication performances of carbon-doped MoSe2 nanoparticles and their biocompatibility characterization in vitro. Front Chem. 2021;8:580151. doi:10.3389/fchem.2020.580151
23. Yu YJ, Qing M, Ma YD, Polydopamine assembled stable core-shell nanoworms-DNAzyme probe for selective detection of Pb2+ and in livinig cells imaging. Talanta. 2023; 253: 123984. doi:10.1016/j.talanta.2022.123984
24. Qi F, Liu R. Tumor-Targeted and Biocompatible MoSe2 Nanodots@Albumin nanospheres as a dual-modality therapy agent for synergistic photothermal radiotherapy. Nanoscale Res Lett. 2019;14(1):67. doi:10.1186/s11671-019-2896-z
25. Chen R, Guo CC, Lan GL, Luo P, Yi, JM, Wei, W. Highly sensitive surface plasmon resonance sensor with surface modified MoSe2/ZnO composite film for non-enzymatic glucose detection. Biosens Bioelectron. 2023; 237: 115469. doi:10.1016/j.bios.2023.115469
26. Lin G, Zhang M. Ligand chemistry in antitumor theranostic nanoparticles. Acc. Chem. Res. 2023;56(12):1578–1590. doi:10.1021/acs.accounts.3c00151
27. Huang XW, Wei JJ, Liu T, Zhang XL, Bai S, Yang HJN. Silk fibroin-assisted exfoliation and functionalization of transition metal dichalcogenide nanosheets for antibacterial wound dressings. Nanoscale. 2017;9(44):17193–17198. doi:10.1039/C7NR06807G
28. Chen J, Li X, Liu X, et al. Hybrid MoSe 2 –indocyanine green nanosheets as a highly efficient phototheranostic agent for photoacoustic imaging guided photothermal cancer therapy. Biomat Sci. 2018;6(6):1503–1516. doi:10.1039/C8BM00104A
29. Gao L, Fan Y-Z, Zhang T-H, et al. Biocompatible carbon-doped MoSe 2 nanoparticles as a highly efficient targeted agent for human renal cell carcinoma. RSC Adv. 2019;9(20):11567–11575. doi:10.1039/C9RA01029G
30. Wang C, Bai J, Liu Y, Jia X, Jiang X. Polydopamine coated selenide molybdenum: a new photothermal nanocarrier for highly effective chemo-photothermal synergistic therapy. ACS Biomater Sci Eng. 2016;2(11):2011–2017. doi:10.1021/acsbiomaterials.6b00416
31. Qin L, Gan J, Niu D, Interfacial-confined coordination to single-atom nanotherapeutics. Nat Commun. 2022;13 (1) :91. doi:10.1038/s41467-021-27640-7.
32. Love MI, Huber W, Anders SJGB. Moderated estimation of fold change and dispersion for RNA-seq data with DESeq2. Genome Biol. 2014;15(12):550. doi:10.1186/s13059-014-0550-8
33. Li Y, Lu H, Liu Q, Qin L, Dong G. A facile method to enhance the tribological performances of MoSe2 nanoparticles as oil additives. Tribol Int. 2019;137:22–29. doi:10.1016/j.triboint.2019.04.029
34. Lu H, Chen L, Liu Q, Li Y, Gao L. Tribological properties of biocompatible molybdenum selenide nanoparticles as water lubrication additives for ultra-high molecular weight polyethylene/304 stainless steel contact. Mater Chem Phys. 2021;272:125053. doi:10.1016/j.matchemphys.2021.125053
35. Tang H, Dou K, Kaun -C-C, Kuang Q, Yang S. MoSe 2 nanosheets and their graphene hybrids: synthesis, characterization and hydrogen evolution reaction studies. J Mater Chem A. 2014;2(2):360–364. doi:10.1039/C3TA13584E
36. Pan J, Zhu X, Chen X, Zhao Y, Liu J. Gd 3+ -Doped MoSe 2 nanosheets used as a theranostic agent for bimodal imaging and highly efficient photothermal cancer therapy. Biomater Sci. 2018;6(2):372–387. doi:10.1039/C7BM00894E
37. Vishnu N, Badhulika S. Single step synthesis of MoSe 2 −MoO 3 heterostructure for highly sensitive amperometric detection of nitrite in water samples of industrial areas. Electroanalysis. 2019;31(12):2410–2416. doi:10.1002/elan.201900310
38. Kaur R, Singh KP, Tripathi SK. Study of linear and non-linear optical responses of MoSe2-PMMA nanocomposites. J Material Sci Material Electro. 2020;31(22):19974–19988. doi:10.1007/s10854-020-04520-2
39. Qin F, Hu H, Jiang Y, et al. Mesoporous MoSe2 /C composite as anode material for sodium/lithium ion batteries. J Electroanal Chem. 2018; 823; 67–72. doi:10.1016/j.jelechem.2018.05.023
40. Yousaf M, Wang Y, Chen Y, Wang Z, Han RP. A 3D Trilayered CNT/MoSe 2 /C Heterostructure with an Expanded MoSe2 Interlayer Spacing for an Efficient Sodium Storage. Adv Energy Material. 2019;9:1900567.
41. Xin S, Liu Z, Ma L, et al. Visualization of the electrocatalytic activity of three-dimensional MoSe2@reduced graphene oxide hybrid nanostructures for oxygen reduction reaction. Nano Res. 2016;9(12):3795–3811. doi:10.1007/s12274-016-1249-9
42. Lei Z, Xu S, Wu P. Ultra-thin and porous MoSe 2 nanosheets: facile preparation and enhanced electrocatalytic activity towards the hydrogen evolution reaction. Phys Chem Chem Phys. 2016;18(1):70–74. doi:10.1039/C5CP06483J
43. Wang H, Kong D, Johanes P, et al. MoSe 2 and WSe 2 Nanofilms with Vertically Aligned Molecular Layers on Curved and Rough Surfaces. Nano Lett. 2013;13(7):3426–3433. doi:10.1021/nl401944f
44. Xue N, Diao P. Composite of Few-Layered MoS 2 Grown on Carbon Black: tuning the Ratio of Terminal to Total Sulfur in MoS 2 for Hydrogen Evolution Reaction. J Phys Chem C. 2017;121(27):14413–14425. doi:10.1021/acs.jpcc.7b02522
45. Yan Y, Sun B, Ma DJ. Resistive switching memory characteristics of single MoSe2 nanorods. Chem Phys Lett. 2015;638:103–107.
46. Yuwen L, Zhou J, Zhang Y, et al. Aqueous phase preparation of ultrasmall MoSe2 nanodots for efficient photothermal therapy of cancer cells. Nanoscale. 2015;8:2.
47. Yu H, Zhao H, Zhang Y, et al. A biomimetic nanoreactor for combinational chemo/chemodynamic therapy of choriocarcinoma through synergistic apoptosis and ferroptosis strategy. Chem Eng J. 2023;472:144690. doi:10.1016/j.cej.2023.144690
48. Subramanian A, Tamayo P, Mootha VK, et al. Gene set enrichment analysis: a knowledge-based approach for interpreting genome-wide expression profiles. P Natl Acad Sci USA. 2005; 102 (43): 15545–15550. doi:10.1073/pnas.0506580102.
49. Szklarczyk D, Franceschini A, Wyder S, et al. STRING v10: protein-protein interaction networks, integrated over the tree of life. Nucleic Acids Res. 2015;43(D1):D447–452. doi:10.1093/nar/gku1003
50. Kong F, Ye S, Zhong Z, et al. Single-Cell transcriptome analysis of chronic antibody-mediated rejection after renal transplantation. Front Immunol. 2022;3:12.
 © 2024 The Author(s). This work is published and licensed by Dove Medical Press Limited. The full terms of this license are available at https://www.dovepress.com/terms.php and incorporate the Creative Commons Attribution - Non Commercial (unported, v3.0) License.
By accessing the work you hereby accept the Terms. Non-commercial uses of the work are permitted without any further permission from Dove Medical Press Limited, provided the work is properly attributed. For permission for commercial use of this work, please see paragraphs 4.2 and 5 of our Terms.
© 2024 The Author(s). This work is published and licensed by Dove Medical Press Limited. The full terms of this license are available at https://www.dovepress.com/terms.php and incorporate the Creative Commons Attribution - Non Commercial (unported, v3.0) License.
By accessing the work you hereby accept the Terms. Non-commercial uses of the work are permitted without any further permission from Dove Medical Press Limited, provided the work is properly attributed. For permission for commercial use of this work, please see paragraphs 4.2 and 5 of our Terms.