Back to Journals » Psychology Research and Behavior Management » Volume 12
Positive Self-Relation Scale – development and psychometric properties
Authors Ociskova M ![]() , Prasko J
, Prasko J ![]() , Kupka M
, Kupka M
Received 20 April 2019
Accepted for publication 26 July 2019
Published 11 September 2019 Volume 2019:12 Pages 861—875
DOI https://doi.org/10.2147/PRBM.S212923
Checked for plagiarism Yes
Review by Single anonymous peer review
Peer reviewer comments 2
Editor who approved publication: Dr Igor Elman
Marie Ociskova,1 Jan Prasko,1 Martin Kupka2
1Department of Psychiatry, Faculty of Medicine and Dentistry, Palacky University in Olomouc, University Hospital Olomouc, Olomouc, The Czech Republic; 2Department of Psychology, Faculty of Arts, Palacky University in Olomouc, Olomouc, The Czech Republic
Correspondence: Jan Prasko
Department of Psychiatry, I. P. Pavlova 6, Olomouc 77520, The Czech Republic
Tel +42058 844 3519
Email [email protected]
Purpose: Self-relation is a profound connection that influences one’s life. As such, it presents an important topic for various areas of research and psychotherapy. The goal of this study was to develop and evaluate a brief scale that would assess positive aspects of self-relation.
Sample and methods: The Positive Self-Relation Scale (PSRS) consists of 16 items divided into 4 subscales – Self-Acceptance, Self-Confidence, Authenticity and Assertiveness, and Fulfilled Experience. Two samples were used for the evaluation of its content and factor structure. The final sample’s data used for validation assessment. This sample consisted of 1234 adults from a general population (mean age 34.8±14.2 years, 70.8% women). All participants completed PSRS. Subgroups also filled in Rosenberg Self-Esteem Scale (RSES), Adult Dispositional Hope Scale (ADHS), Beck Depression Inventory-II (BDI-II), Liebowitz Social Anxiety Scale (LSAS), and Dissociative Experiences Scale (DES).
Results: Differences in scores among demographic groups were small to none. Internal consistency was good (Composite Reliability Coefficients – the whole scale: 0.93; the subscales: 0.73–0.80). Temporal stability, assessed 2 weeks apart, was satisfactory (intraclass correlation coefficients – the whole scale: 0.86, the subscales: 0.60–0.82). Factor loadings in confirmatory factor analysis were 0.45–0.80, fit indices mostly showed an adequate model. The correlation coefficients between PSRS and RSES/ADHS were strong (r=0.79/0.55). The scale also strongly correlated with LSAS, BDI-II, and DES (r=−0.61/-0.48/-0.30, all ps<0.001).
Conclusion: PSRS showed adequate psychometric properties in the general population. Future studies should include clinical samples. The areas of application lie mainly in research and psychotherapy.
Keywords: self-relation, positive psychology, self-esteem, self-acceptance, psychometric properties
Introduction
A relationship with oneself is one of the profound connections that individuals develop during their lives. Its foundations form in childhood, largely through attachment with caregivers.1 Over time, a child creates schemas – distinct patterns of cognitions, emotions, and bodily sensations that are connected to oneself and/or other people.2 On a more general level, a child develops a relationship with oneself. This self-relation has several basic parts – the ability to treat oneself in accepting, kind, and compassionate way,3 to perceive oneself as competent and able to reach set goals,4 to act authentically and autonomously,5 and to allow oneself feel and experience life here-and-now.6 The qualities of self-relation naturally vary among individuals – someone might have a decent sense of self-worth but struggle with letting themselves be authentic, another can accept themself most of the time but experience issues with assertiveness.
An individual with positive self-relation might show subsequent qualities. During his childhood, a man had his needs mostly met. He grew up thinking that he is an acceptable and valuable person who generally considers himself being safe (a cognitive part of self-relation). He likes himself and others and allows himself to feel emotions without their suppression or dissociation (an affective part). He is authentic and when needing something, he can assert himself without being overly defensive or aggressive (a behavioral part). He is also able to set appropriate goals in life, create ways to reach them, and follow them through (a cognitive and behavioral part). These aspects of self-relation (cognitive, emotional, and behavioral) influence one another.7
In a study of Kessler et al,8 more than a half of adults had at least one early adverse experience, the most common being parental death and physical abuse. Furthermore, a significant number of children are raised by parents who do not have secure attachment.9 In a sample of North American mothers, only 58% showed secure attachment. Fathers’ results were similar.9 Parental attachment then manifests in their behavior toward the offspring. For example, mothers with non-secure attachment tend to be less warm and responsive toward their child, overly anxious, and less often show positive affectivity.10 In such constellation, the child’s needs might not be sufficiently met.
Adolescents and adults with aversive early life experiences and insecure attachment tend to have low self-esteem and often report symptoms of depression and hopelessness,11 social anxiety,12 or dissociation.13 The relationship between early adversity and later emotional struggles is not direct but depends on the way in which individuals relate to themselves – largely through schemas and ways of coping with them.2,14 For example, schemas related to loss and worthlessness mediated the connection between early adverse experiences and anhedonia, while schemas related to danger mediated a connection of the experiences with feelings of anxiety in depressed adolescents.14
One of the main characteristics of self-relation is its pervasiveness.15 It influences academic and workplace performance,16,17 as well as functioning in close relationships18 and ways of spending leisure time.19,20 A change in self-relation is also one of the common manifestations of successful psychotherapy.21 When individuals have a good-enough relationship with themselves, they tend to be more flexible and resilient22 and overcome possible obstacles more quickly23 than those with less favorable self-relation.
A screening measure to quickly assess a person’s self-relation can be useful for various therapeutic and research purposes. One of such measures is Rosenberg’s Self-Esteem Scale that evaluates self-competence and self-liking – some of the cognitive and affective components of self-relation.24 Another common measure is Beck Self-Esteem Scale that assesses individual’s beliefs about themselves and other’s views of them.25 This scale evaluates core beliefs – some of the deeply held cognitive components of self-concept. As the name suggests, Young Schema Questionnaires then measure maladaptive schemas, specific self- and other-related structures consisting of cognitions, emotions, and physiological reactions.26 Other measures include State Self-Esteem Scale27 or Implicit Associates Test.28 Various measurements focus on the relationship with oneself in one way or another, usually focusing on cognitions (such as Beck Self-Esteem Scales) or emotions (several items of Rosenberg’s Self-Esteem Scale or Young Schema Questionnaire).
The goal of the study was to develop a scale that would (a) be brief, to enhance its usability in therapeutic practice and research, (b) be positively oriented, to promote clients’ awareness of the strengths in their self-relation and not only of the areas with which they struggle, and (c) include the behavioral component of self-relation, as one of its components. This paper describes the development of the scale and its psychometric properties in a sample of general population adults. It also analyzes potential differences among basic demographic subgroups (divided according to sex, age, education, employment, and marital status). The reason for this step is that a comparable scale (Rosenberg’s Self-Esteem Scale) also detected significant variations in scores according to demographic factors.29
Based on the theoretical background and concepts of used measurements, following hypotheses were stated:
- Positive self-relation (the total score of the developed PSRS scale) strongly positively correlates with self-esteem (RSES total score).
1a. Self-competence (PSRS subscale score) strongly positively correlates with self-confidence (RSES subscale score).
1b. Self-acceptance (PSRS subscale score) strongly positively correlates with self-liking (RSES subscale score).
2a. Self-confidence (PSRS subscale score) moderately positively correlates with hope (ADHS total score).
3a. Self-acceptance (PSRS subscale score) moderately negatively correlates with DS (BDI-II total score).
3b. Fulfilled experience (PSRS subscale score) moderately negatively correlates with DS (BDI-II total score).
4a. Authenticity/Assertiveness (PSRS subscale score) strongly negatively correlates with social anxiety symptoms (LSAS total score).
4b. Self-confidence (PSRS subscale score) strongly negatively correlates with social anxiety symptoms (LSAS total score).
5a. Fulfilled experience (PSRS subscale score) moderately negatively correlates with dissociative experiences (DES total score).
Methods
Development of Positive Self-Relation Scale (PSRS)
The development of PSRS and data collection took place between April 2017 and May 2018. The creation of PSRS was based on three sources. The first source that led to the idea to create the scale was in rich experience of one of the authors with conducting CBT training. One of the training modules focuses on self-relation. At the start of this module, participants complete a brief scale that assesses their relation with themselves. The items focus on the extent in which they let themselves to be open and authentic or how much they like or criticize themselves. These questions have been based on the clinical and CBT training experience. When the participants respond to each statement, they discuss their results, along with the areas of self-relation that, they think, are fine and those that they would like to work on. Subsequently, they create “therapeutic goals” that come directly from their scale results and the subsequent reflection. The scale has served in eight training courses so far and 320 trainees have used it. It has been a useful tool that develops self-reflection, helps to formulate goals related to self-relation, and serves as a measurement assessing change during the training course. The second source of the PSRS development was a literature analysis which helped with theoretical background and ideas not included in the training scale. The third source of knowledge was a discussion about the concept and possible scale items with four experts – two CBT therapists, one psychologist working in primary prevention programs for teens, and one lecturer who leads two university courses in positive psychology.
These three sources led to a conceptual definition of the positive self-relation, as described in the Introduction. An initial set of 34 items was created. A 0–10 points Likert-type scale was chosen as a method of responding because this way of evaluation is well established in the routine CBT practice and known to our patients and trainees. Subsequently, the first version of PSRS was administered to adult volunteers from a general population sample (n=44) who commented on the items, the scale construction, and the concept itself. These participants, who were addressed by using the convenience sampling, suggested in five other items that were added in the scale. Also, wording of several items was changed to increase their understandability.
In the next step, the 39-item version of the scale was administered to a snowball sample of 119 volunteers and an exploratory factor analysis was performed. The analysis resulted in the selection of 16 best performing items divided into four domains instead of the original five. The reason behind the merging was that Self-Confidence and Self-Control were structurally too close.
The final version of the scale was presented to a group of 1234 volunteers from a general population and performed confirmatory factor analysis and internal consistency analysis. The sampling of this group was based on random stratification to obtain data from all major subpopulations in the Czech Republic (various age groups, education levels, and employment and marital status). A part of the sample (n=1025) completed the Rosenberg’s Self-Esteem Scale to compare both measures. To analyze similarities and differences between PSRS and other scales, that measure related but not conceptually same phenomena (hope – ADHS, depression – Beck Depression Inventory-II [BDI-II], dissociation – DES, and social anxiety – LSAS), were used. These measurements were not administered to the whole sample but only to those who were the latest to enter the study. The decision was to administer these lengthy questionnaire batteries only to large-enough samples, not to everyone who participated in the study. It was a preventive measure because of an expectation that many participants would quit if they were asked to complete more time-consuming batteries. This created a limitation that is also stated in the discussion. In the last step, a part of the sample (n=86) completed PSRS 2 weeks apart to analyze the temporal stability of the measurement. The flowchart below summarizes the development of the scale. Its form was adapted from Khoiriyah et al30 (Figure 1).
 |
Figure 1 Flowchart of development and validation of PSRS. Abbreviations: PSRS, Positive Self-Relation Scale; RSES, Rosenberg’s Self-Esteem Scale; LSAS, Liebowitz Social Anxiety Scale; DES, Dissociative Experiences Scale; BDI-II, Beck Depression Inventory-II; ADHS, Adult Dispositional Hope Scale. |
Final version of PSRS
The final version of the scale consists of 16 items with Likert-type scales ranging from 0 to 10 according to the level of agreement (Figure 2). This type of responding was chosen because of its similarity with CBT scaling. The scale is thus easy to use for clients of CBT and others who practice this kind of evaluation. The scale takes 3–5 mins to complete.
 |
Figure 2 Positive Self-Relation Scale. |
The items group into four subscales:
- Self-Confidence refers to a set of beliefs in one’s ability to deal with struggles and to reach meaningful goals. Self-confident adults usually do not fear obstacles because they think of them as challenges or opportunities. When they cannot solve an issue one way, they do not give up and choose another solution. Although this subscale mainly includes cognitive aspects of self-relation (core performance beliefs, subjective evaluation of own executive functions), it also inherently includes a general feeling of safety and hope. A brief sentence that could sum this subscale up would be “I can make it.” Items 1, 3, 6, 14*.
- Authenticity and Assertiveness – This subscale focuses on an ability and willingness to (existentially speaking) be who one is. Adults with high scores in this subscale behave congruently and openly to themselves and to others and assert themselves when needed. The fundamental attitude behind this subscale is “I can be who I am.” Items 2, 7*10, 16.
- Self-Acceptance describes a level in which a person likes and accepts himself, despite possible flaws. Individuals, who accept themselves, are first and foremost kind to themselves and others. Usually, they do not have an issue admitting a mistake. Although they can be sporadically upset with themselves, it is temporary. They differentiate between “the sin” and “the sinner”, and even when they “mess up” something, they still like themselves. A basic statement behind this subscale is “I like myself.” Items 4*9, 12, 15.
- Fulfilled experience is a subscale that refers to the extent in which a person experiences their life in its variability. Adults, who experience life its richness, are able to feel joy, and let themselves immerse in beauty. They do not prevent themselves from feeling good. The subscale, summed up in one sentence, would be simply “I feel.” Items 5, 8, 11, 13.
Scoring: The items with an asterisk are scored reversely. The total score is a sum of all items. Each subscale score varies between 0 and 40, so the whole scale score lies between 0 and 160. The higher the resultant numbers are, the more positive self-relation a person shows.
Other measurements
RSES24 consists of 10 items that assess global self-esteem that consists of self-competence and self-liking. Individuals respond on a 4-point Likert scale according to their level of agreement. The total score ranges between 0 and 30 points with higher scores indicating higher self-esteem.24 The average total score is 20.9±4.8 with 0–3 scoring.31 In the cited study, the Czech Republic sample scored 18.5±4.1 points. The internal consistency of the scale is mostly good across the language versions (the Cronbach’s alpha is mostly 0.80–0.89).31 The stability in time is adequate. In a Spanish study, test–retest correlation coefficient was 0.84 between measurements 4 weeks apart.32 In this study, the Cronbach’s alpha reached 0.87.
ADHS33 – The scale measures dispositional hope, which is defined as the ability to set goals, to find ways to reach them (so-called pathway thinking), and to muster motivation to do it (agency).33 It includes 12 items – four measure pathway thinking, another four assess agency, and the rest are fillers.33 The responses are based on an 8-point Likert scale. The total score varies between 8 and 64 points. The average total score of ADHS is 48 points in the American general population34 and 46 points in the Czech non-clinical population.35 The internal consistency of the scale is good. The Cronbach’s alphas of the Czech translation were 0.82 for the whole scale, 0.71 for the pathway thinking subscale, and 0.73 for the agency subscale.35 Temporal stability of the scale is also good, reaching 0.80 or higher in measurements 10 weeks apart.33 In this study, the Cronbach’s alpha was 0.82 for the whole scale, 0.69 for the pathway thinking, and 0.75 for the agency subscale.
BDI-II36 assesses 21 DS in the last 2 weeks. Each symptom has several levels of intensity and participants choose which one applies the most for them.36 The total score can be interpreted according to the following categories – 0–9 points: absence of DS, 10–15 points: minimal DS, 16–19 points: mild DS, 20–29 points: moderate to severe DS, 30–63 points: severe DS.37 The Cronbach’s alpha of the Czech version varied between 0.90 and 0.93.38 The temporal stability of the measurement is also good (intraclass correlation coefficient: r=0.83 for the patients and 0.77 for the healthy controls).38 The Cronbach’s alpha was 0.90 in this study.
Liebowitz Social Anxiety Scale – Self-Report Version39 (LSAS-SR) consists of 24 items with symptoms of performance and social interaction anxiety. Participants evaluate levels of fear and avoidance in each symptom.39 There are two versions of the scale – objective39 and subjective.40 We used the subjective version in this study. The total score varies between 0 and 144 points. Thirty points are usually recommended as a cut-off for a possible social anxiety disorder.41 The Cronbach’s alpha reaches 0.94 in the non-clinical population.42 Temporal stability of the scale is excellent; its correlation coefficient varies around 0.93.43 In this study, the Cronbach’s alpha was 0.96 for the whole scale, 0.94 for the Fear subscale, and 0.92 for the Avoidance subscale.
DES44 measures 28 dissociative states, ranging from absorption and amnesia to depersonalization and derealization. A participant chooses a number from a Likert-type scale with regard to how often they experience each symptom (0= never, 10= all the time).44 The average total score in non-clinical samples is 11.6±10.6 points.45 The mean Cronbach’s alpha is 0.93 and test–retest correlation between 0.78 and 0.84.45 The Cronbach’s alpha was 0.92 in this study.
Subjects
The sample consisted of three groups of volunteering adults from general population. The sampling process was mixed – based on convenience in the first, snowball in the second, and random stratification in the third group. The first group included 44 individuals who evaluated the preliminary version of the scale and suggested additional items. These participants were mostly female (n=31), with mean age 24.7±7.9 years. The second group consisted of 119 individuals. The data from these participants served for the exploratory factor analysis and led to the creation of the final version of the scale. This group consisted of slightly more men than women (n=63), their mean age was 24.9±10.7 years.
The final group included 1234 individuals whose data were used for scale validation. Their characteristics are in Table 3. The participants were mostly female (70.8%). Three individuals did not state their gender. The average age was 34.8±14.2 years. The largest subgroup was in their twenties (40.0%), followed by those in the thirties (18.2%) and forties (14.3%). Only 21 individuals were 60 years old or more. The youngest participant was 18 years old, the eldest one had 92 years. One hundred and eleven individuals chose not to reveal their age. Most participants had either a secondary (38.2%) or tertiary (54.1%) level education. Four participants did not state their level of education. Most participants were employed or self-employed (62.2%) and almost a third of the final sample were students (30.0%). Three people did not fill their employment status. Most individuals were either single (55.3%) or married (33.6%). Four people left the marital status item unanswered. Table 1 shows mean scores of the administered methods and their comparison with norms. The participants had mostly average levels of self-esteem (RSES) and hope (ADHS), and none to minimal symptoms of depression (BDI-II). On the other side, they showed mildly increased symptoms of social anxiety and dissociation.
 |
Table 1 Scales’ scores and their comparison with norms |
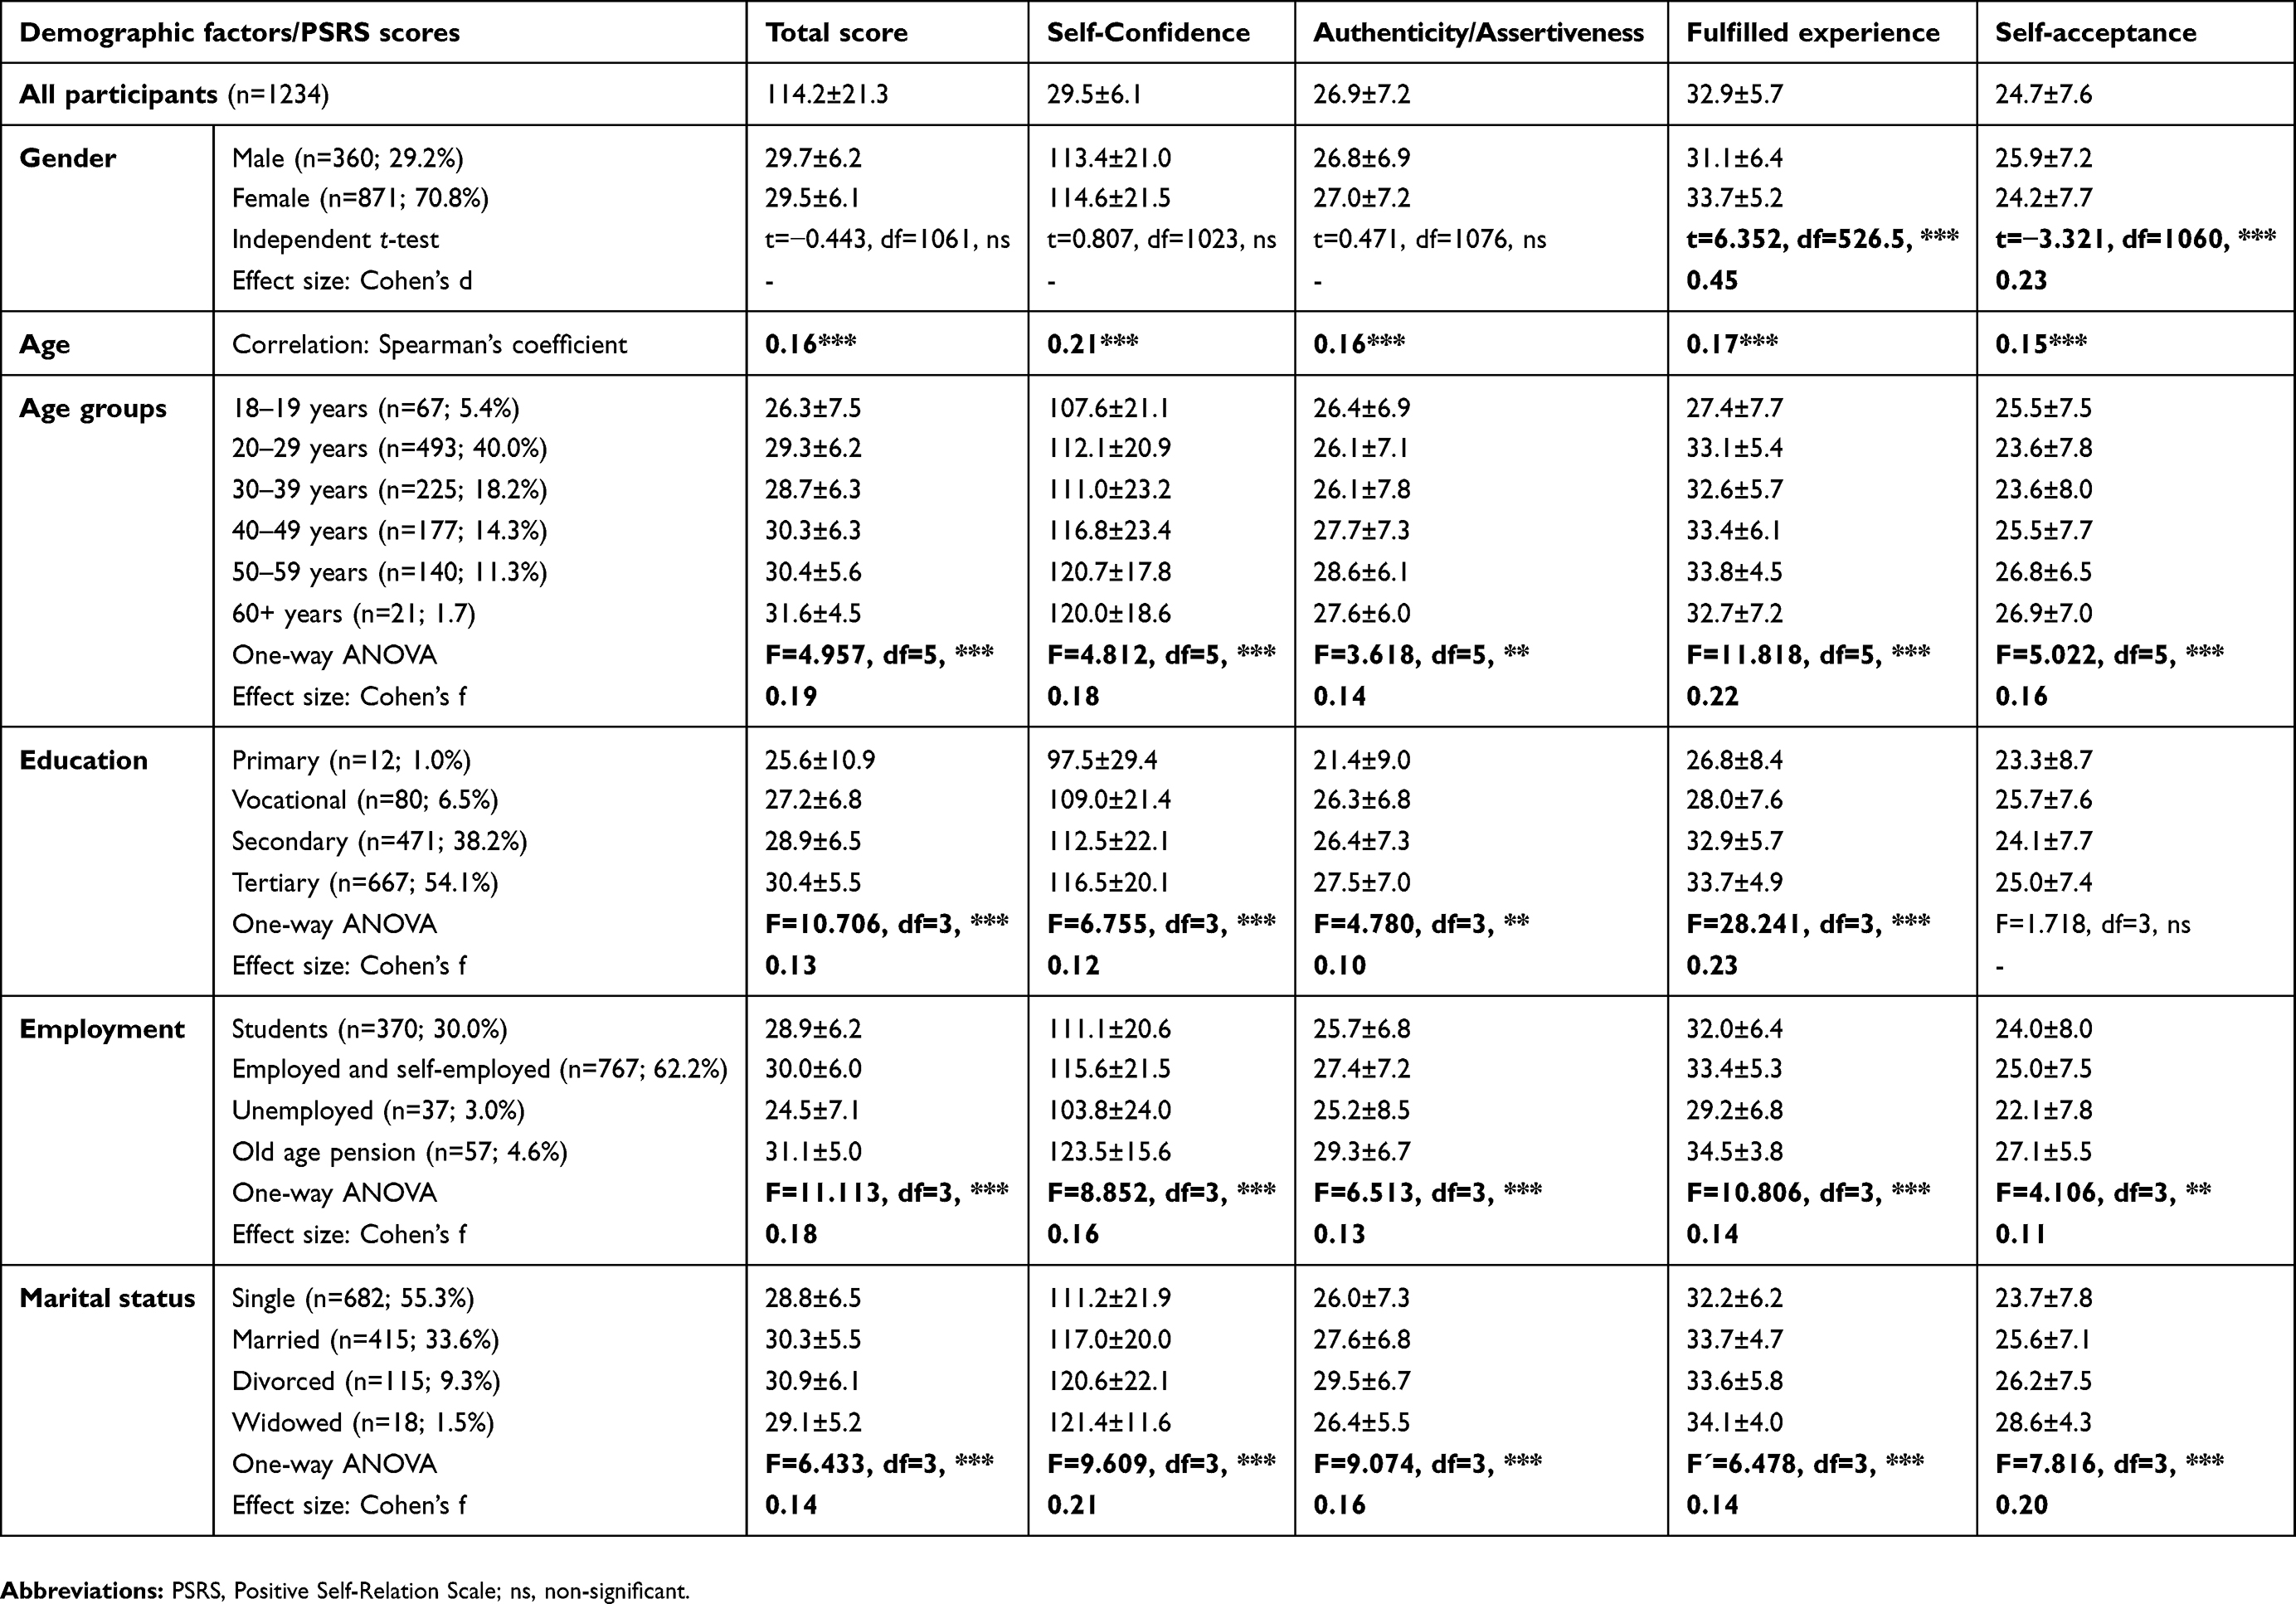 |
Table 2 Means of PSRS and its subscales and their connection with demographic factors |
 |
Table 3 Factor loadings of the scale items |
Statistics
Programs SPSS 21, AMOS, and G*Power47 were used for the calculations. Descriptive statistics included Shapiro–Wilk test for the data distribution analysis, means, and standard deviations of the measurements and applicable demographic factors. Differences between demographic variables were analyzed by independent t-tests or one-way ANOVA. Pearson’s Spearman’s correlation was used for evaluation of convergent and discriminant validity and age-related calculations. Reliability was assessed with Composite Reliability Coefficient and intraclass correlation. Composite Reliability Coefficient measures reliability of scales, that do not meet the tau-equivalence assumption, more precisely than the traditionally used Cronbach’s alpha.48 Exploratory and confirmatory factor analysis was also performed. Effect sizes were calculated with G*Power and interpreted by Cohen’s criteria.49 Cut-off values for correlations used in the validation results were: <0.10 negligible, 0.10–0.30 small, 0.30–0.50 moderate, 0.50+ large. Cut-off scores for Cohen’s d, which was used in t-tests, were: 0.20 small, 0.50 medium, and 0.80 large. Cut-off scores for Cohen’s f, applied in ANOVA calculations, were: 0.10 small, 0.25 medium, and 0.40 large. Power analysis was also performed with the G*Power software to calculate minimum sample sizes for planned calculations. Statistical significance was set at p<0.05.
Ethics
The research was approved by the Ethics Committee of the Faculty of Medicine and Dentistry and University Hospital Olomouc under the number 94/17. All participants signed the informed consent. The research in accordance with ethical principles formulated by the Helsinki Declaration50 and the American Psychological Association.51 Data supporting the results can be obtained from the main author of the manuscript.
Results
Descriptive analysis
Table 2 describes means and standard deviations of PSRS and its subscales of all participants and demographic subsamples. Women reached a slightly higher score in Fulfilled Experience, while men had a bit higher Self-Acceptance. All significant differences with respect to age, education, employment, and marital status were small (Table 2).
Factor analysis
Two exploratory factor analyses were performed. The first analysis evaluated a one-factor solution, the other analyzed a four-factor solution. The one-factor analysis was based on the maximum likelihood method. Its solution had the eigenvalue of 5.99 and explained 37.4% of the scale scores variance. The factor loadings ranged from 0.09 to 0.73 with an average of 0.56. Because the one-factor solution presented only the self-confidence factor, factor loadings were low, and the explained variance percentage was low as well (it should be at least 60%52), the four-factor solution was preferred.
The second exploratory factor analysis consisted of maximum likelihood extraction with promax rotation and Kaiser normalization. Four factors with eigenvalue higher than 1 explained 61.9% of the scale scores variance. Eigenvalues for each factor were 6.27 (Self-Confidence), 1.32 (Self-Acceptance), 1.30 (Fulfilled Experience), and 1.03 (Authenticity and Assertiveness). Factor loadings of each item are stated in Table 3. Most items had their highest loading on the “correct” factor. However, one item of Fulfilled Experience related to the Self-Acceptance factor more than to its own and one of the Authenticity and Assertiveness items cross-loaded on the Self-Confidence factor. Items 14 and 16 also loaded on their factor poorly (interpreted according to Comrey and Lee53).
The confirmatory factor analysis was then applied to the four-factor solution using the maximum likelihood method. The resultant factor loadings are stated in Table 4. The goodness-of-fit indices were mostly acceptable (Table 5). The subscales shared a considerable variance, varying between 0.64 for Self-Confidence a Fulfilled Experience and 0.80 for Authenticity and Assertiveness and Fulfilled Experience. There were 25 minor modification indices with the average parameter change of 0.094 (the expected changes ranged from −0.139 to 0.181). Three modification indices suggested adding one of the items to a different subscale. However, one parameter change would be negative, so the overall goodness of the model would actually get worse, and two other parameter changes were negligible (Item 12→the Fulfilled Experience subscale: Par. change: 0.144, Item 15→the Fulfilled Experience subscale: −0.110, Item 2→the Self-Confidence subscale: 0.171).
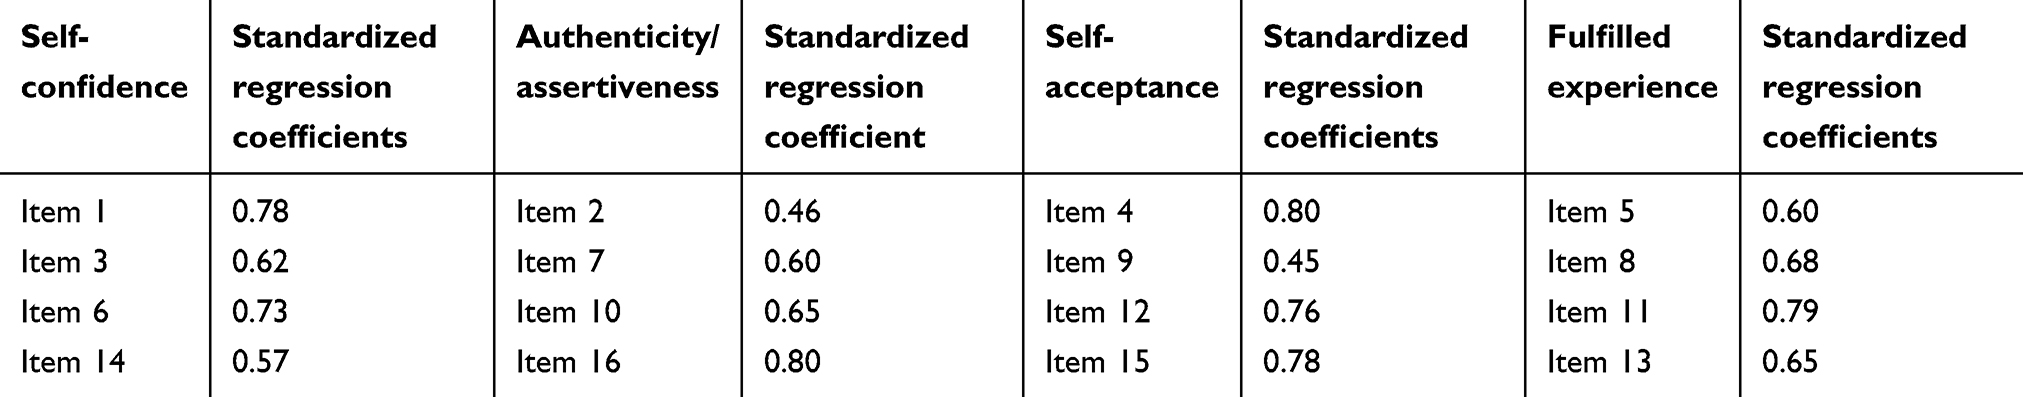 |
Table 4 Standardized regression coefficients of PSRS |
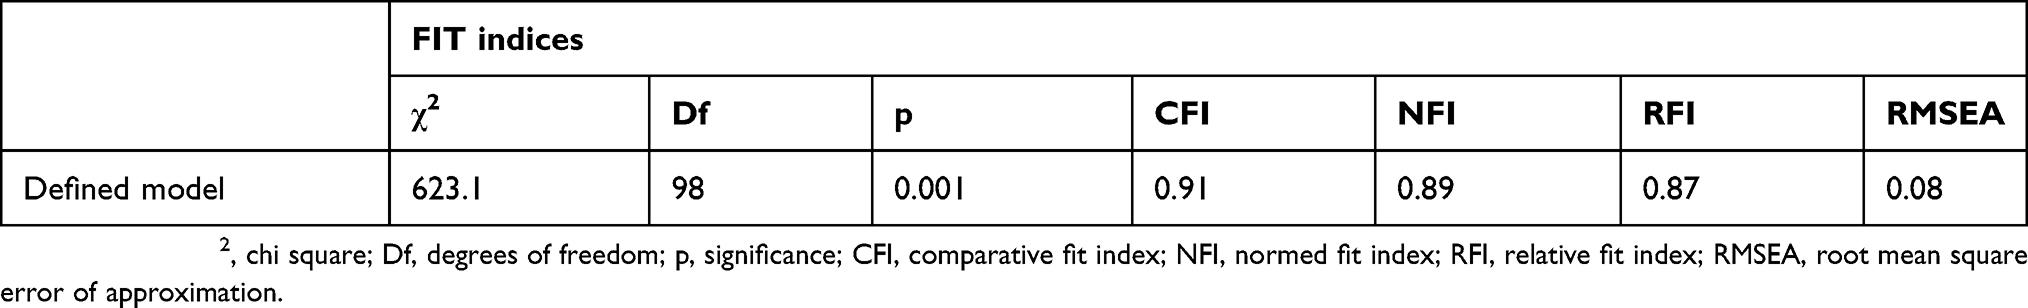 |
Table 5 Goodness-of-fit indices |
Reliability
The internal consistency was assessed by the Composite Reliability Coefficient (Table 6). All reliability coefficients were acceptable or good. Item-total correlation coefficients were also adequate (r=0.36–0.68; a mean coefficient: 0.55). The correlations among the subscales were strong (r=0.50–0.59, p<0.001). Temporal stability, assessed 2 weeks apart, was good to excellent (Table 6).
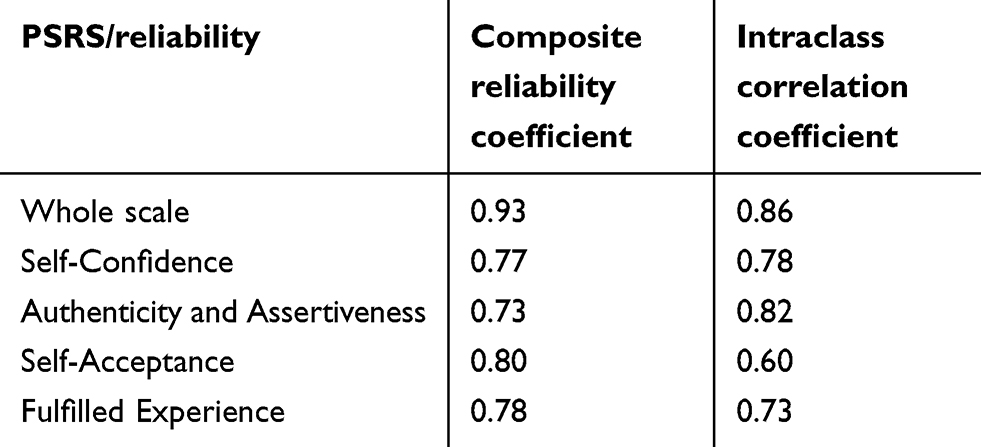 |
Table 6 Reliability of PSRS |
Validity
Convergent validity was analyzed by correlating PSRS with RSES (Table 7). The correlation between both measurements was strong. Subsequently, the scale was compared with ADHS. Both scales correlated strongly but their connection was weaker than the previous one with RSES. Lastly, the connection between PSRS and BDI-II, LSAS, and DES was analyzed. The scales strongly (LSAS) or moderately (BDI-II, DES) negatively correlated with PSRS (Table 7).
 |
Table 7 Correlational coefficients of PSRS and its subscales with other measurements |
Discussion
The goal of this study was to develop and evaluate a brief screening scale that would assess positive self-relation. Three groups of adult volunteers from general population participated in the study. The data from the first two groups were instrumental for the formulation of the scale and creation of the final version. Batteries from the third group served for scale validation. This group consisted of 1234 adults, most of whom were women (70.8%) with mean age 34.8±14.2 years. Some subpopulations were underrepresented, namely individuals with 60+ years, those with primary education, unemployed, or widowed. This is one of the study limitations.
Although the average scores of PSRS and its subscales varied between demographic groups, the differences were small. Women scored slightly higher in the Fulfilled Experience subscale, while men had a higher average Self-Acceptance score. The sexes did not differ in other subscales or in the total scale score. This result partially differs from Sinclair et al, study where men and women did not significantly vary in their RSES scores at all.29 Diverse cultural backgrounds may explain the difference in these findings. In the cited study,29 the RSES scores slightly increased with age. This finding is in agreement with presented results in which age significantly correlated with PSRS and its subscales. Similar connections – significant but weak – were also found in other demographic factors – with respect to the educational level, employment, and marital status.29 To sum it up, demographic factors seem to play only a marginal role in positive self-relation measured by PSRS.
The sample showed average levels of self-esteem31 and hope.35 The participants had on average none to minimal symptoms of depression37 and mildly increased social anxiety and dissociation.46 These slight elevations might have been a consequence of collecting data from predominantly young adult sample.45,54
Two exploratory factor analyses were performed. The first calculation analyzed a one-factor solution. The resultant eigenvalue was 5.99, the explained variance reached 37.4%, the factor loadings ranged from 0.09 to 0.73. The identified factor was of the Self-Confidence subscale, as became apparent in the subsequent, four-factor solution analysis. This analysis identified four factors that explained 61.9% of the scores variance. Two subscales (Self-Confidence and Self-Control) were conceptually so close that they merged into one factor. In the four-factor model, most items significantly loaded the “correct” subscale very well or excellently.53 However, one Fulfilled Experience item saturated the Self-Acceptance factor more than its own. This item focuses on the ability to feel positive emotions toward others (“I can like others.”). It seems that individuals, who perceive themselves as being able to like others, tend to relate similar to themselves. This is an assumption that has a long tradition in psychology (at least since Horney55) and that has some empirical background in moderate correlation coefficients between self-acceptance and acceptance of others.56 One Authenticity and Assertiveness item split and significantly saturated its own and the Self-Confidence factor. This item explores the ability to keep own opinion even when others disagree. It takes a degree of self-confidence and non-conformity to act this way.57 This may be a cause of the cross-loading. Also, items 14 (“When I meet an obstacle, I quickly give up.”) and 16 (“I can be who I am – before myself and before others.”) loaded on their factor somewhat poorly. This suggests that they partially differ from self-relation concept – in the first case, the item might be too oriented on perceived performance and not so much on self-confidence as it should be. In the second case, the item might be too general or vague to fall neatly among other Authenticity/Assertiveness items. However, both items were considered essential for capturing the meaning of the self-relation concept so they remained in the final version of the scale – with the limitation that their loadings brings. All subscales were significantly interrelated but distinguishable.
This moderate to strong relatedness was again apparent in the confirmatory factor analysis that was performed on the data from the final group of participants. The variance between subscales ranged between 0.64 and 0.80. In the confirmatory factor analysis, all items significantly loaded on the “correct” factor. There were three modification indices suggesting adding an item to a different subscale. However, one of these modifications would lower the goodness-of-fit and two others would create only a marginal parameter change (0.144 and 0.171). Since neither of these parameter changes was nearing the value 0.40 (a rule of the thumb for considering following the modification indices58) and they would not make a theoretical sense, the items’ assignments were not changed.
The strength of the confirmatory factor loadings was mostly very good or excellent.53 Furthermore, none of the items in the confirmatory factor analysis loaded poorly. However, this might have been due to the absence of cross-loadings and allowance of correlations between the subscales. These were allowed because of the inherent affinity between the subscales – a self-confident person is likely assertive,59 a self-accepting person often feels joy and leads a fulfilling life.60,61 Because of this, the factor loadings might have been skewed.
Still, there are other possible explanations of the better performance of the confirmatory factor analysis. Both factor analyses were calculated on the data from different groups. The exploratory factor analysis was made with the data of the smaller sample of 119 individuals whose recruitment was via snowball. The confirmatory factor analysis was made with the data of 1234 individuals. The sampling method of this group was random stratification. So apart from the impact of the correlations between the subscale, the differing results of the exploratory and confirmatory factor analysis could have been influenced by the sample sizes and sampling methods.
The goodness-of-fit indices of the scale were mostly acceptable. The chi-square indicator was significant which was most likely due to the sample size.62 The comparative fit index indicated that the model was acceptable. The other indices (NFI, RFI, RMSEA) were on the border of an acceptable model (interpretation according to Hu and Bentler63).
Reliability of the scale was good. None of the item-total correlation coefficients dropped below 0.30 which means that the items sufficiently connect with the overall scale score.64 As expected, the correlation coefficients among the subscales were strong (r=0.50–0.59, p<0.001) which shows that they are closely related but not identical. All Composite Reliability Coefficients were higher than 0.60, a widely accepted cut-off value indicating acceptable consistency.65 There was a discrepancy between the Composite Reliability Coefficient of the whole scale (0.93) and of the subscales (0.73 to 0.80). This may be attributed to the differing number of items entering the analyses.66 The temporal stability assessed 2 weeks apart was good to excellent.67 Still, a longer distance between measurements is needed to further evaluate the temporal stability. These results are also comparable with average internal consistency and temporal stability of RSES.31,32
The convergent validity was assessed by correlating PSRS with RSES. The resultant coefficient was r=0.79, confirming that both measurements were very similar.66 The Self-Competence subscale (RSES) correlated equally strongly with all subscales of PSRS. The authors’ assumption was that this subscale would connect mainly with the Self-Confidence subscale. It may be that the Self-Confidence subscale measures a wider range of self-relation phenomena than its label suggests. On the other side, the opposite may be true as well – all PSRS subscales may be inherently related with self-confidence to a certain extent. As expected, the Self-Liking subscale (RSES) correlated most significantly with Self-Acceptance, as they are theoretically very similar. PSRS and RSES seem to be conceptually very close. Both scales are short and easy to use. In comparison with RSES, the newly developed scale offers a more structured measurement of self-relation (because of its four subscales, the scale allows a more detailed description) and an added focus on existential parts of self-relation (fulfilled experience and authenticity). These differences might make the scale useful for practitioners or researchers who are interested in various facets of self-relation or who want to explore existential parts of the relationship with oneself.
Subsequently, PSRS was compared with ADHS.33 Snyder’s theory of hope focuses on goal-directed action, the ability to find ways to reach goals, and to muster enough motivation to do so.33 It is a positive psychology concept34 that partly overlaps with the self-relation theory. The authors expected that ADHS would correlate mostly with Self-Confidence subscale because both focus on the ability to assess own strengths and to utilize them when trying to meet a goal.33 Both scales significantly correlated but their connection was weaker than between RSES and PSRS. This may be due to conceptual differences of the scales. ADHS does not directly focus on the emotions, which is especially true for the cognitive pathway thinking subscale.33
Finally, PSRS was compared with three psychopathological states – depressive, social anxiety, and dissociative symptoms. The DS (BDI-II) moderately negatively correlated with PSRS, mainly with the Fulfilled Experience and Self-Acceptance subscales. Apart from other phenomena, the subscales evaluate the ability to let themselves feel joy or tendencies toward self-criticism. Since anhedonia is one of the core symptoms of depression and negative self-view is also one of its diagnostic criteria,67 this result is understandable. PSRS also negatively correlated with LSAS, a measure of social anxiety. It was most significantly related to Authenticity and Assertiveness and Self-Confidence subscales. This result is also in agreement with other studies in which social anxiety strongly negatively correlated with assertiveness68 and low self-esteem.69 As for the dissociative experiences, they hypothetically connect with Fulfilled Experience subscale. This was confirmed. Dissociation is often presented by emotional numbness67 which is why individuals with more pronounced dissociative symptoms struggle with experiencing life in its richness and color.
Limitations
The study has several limitations that need to be mentioned. The scale was developed in Czech and the validation was also performed on data from a Czech sample. The validation of the English translation could not be performed due to the unavailability of relevant population to the authors. There were several sampling methods – probable and non-probable which also might have influenced the results. Some differences in the psychometric characteristics might be present in various language versions of the scale. In spite of our effort to cover all demographic subpopulations, individuals, who are elderly, with primary education, unemployed or widowed, were underrepresented. Also, not everyone was asked to complete all used scales. The scales used for validation (RSES, ADHS, BDI-II, LSAS, DES) were obtained from volunteers who entered the study the last. The collection of the retest data was similar. Although the analyses had sufficient power, these findings could have been slightly different would they were administered to the whole sample. Also, several items performed poorly in the factor analysis which limits two subscales (Fulfilled Experience and Authenticity and Assertiveness) in their validity. Finally, the clinical phenomena (depressive, social anxiety, and dissociative symptoms) were administered to a general population sample. The scores in related scales were low. The validation results could have been partially different in a clinical sample.
Future research
The current study evaluated psychometric properties of the PSRS in a general population sample. It presents a first step leading to future research that could focus on clinical samples. Apart from the necessary psychometric evaluations in various populations, future studies could focus on the exploration of the self-relation in individuals with mental disorders – a group of people who often struggle with positive self-appraisal.70 For example, the authors plan to administer the PSRS scale to hospitalized patients with borderline personality disorder and explore (a) their self-relation assessed by the scale, (b) the connection between the self-relation and psychopathology (anxiety, dysphoria, or impulsivity), (c) sensitivity of the scale to a therapeutic change, and most importantly, and (d) its predictive validity with respect to treatment outcomes. The results of this study may be useful for tailoring psychotherapy according to specific areas of vulnerability and strengths in this population that mostly does not reach very favorable treatment outcomes.71,72 However, because the self-relation is a general concept, that relates to almost everyone, the scope of the scale utilization is very wide.
In the future clinical studies, it would be useful to not apply only the traditional psychometric analyses but utilize the new clinimetric approach as well. Clinimetrics evaluates measurements, that focus on various clinical phenomena, with an effort to identify clinical validity, “right measurements for a specific clinical purpose”.73 Instead of focusing solely on statistical results, this approach puts them into the context of needs of the clinical practice.74 As such, it presents another side of clinical assessments. For example, usefulness of the clinimetrics has been shown in the assessment of apathy and other psychiatric symptoms in Parkinson’s Disease.75,76
Conclusion
PSRS serves as a screening tool for an evaluation of one’s relationship with oneself. It focuses on four facets of self-relation – Self-Acceptance, Self-Confidence, Authenticity and Assertiveness, and Fulfilled Experience. The scale was developed to be brief to enhance its usability in research and clinical practice. Its psychometric properties are largely favorable – the scale has good internal consistency, temporal stability, and validity, and adequate structure. The current study evaluated the scale on a general population sample. Analyses on the clinical sample will follow. The scale is planned to be evaluated and used mainly in clinical research, specifically in outcome studies of individuals with chronic and disabling mental disorders. However, given the general concept of the scale, it may be useful in a wide range of research scenarios.
Disclosure
The authors report no conflicts of interest in this work.
References
1. Oyserman D. Self-concept and identity. In: Tesser A, Schwarz N, editors. The Blackwell Handbook of Social Psychology. Malden, MA: Blackwell; 2001:499–517.
2. Young JE, Klosko JS, Weishaar ME. Schema Therapy: A Practitioner’s Guide. New York: Guilford Press; 2003.
3. Neff KD. The development and validation of a scale to measure self-compassion. Self Identity. 2003;2:223–250. doi:10.1080/15298860309027
4. Neff KD, Vonk R. Self-compassion versus global self-esteem: two different ways of relating to oneself. J Pers. 2009;77(1):23–50. doi:10.1111/j.1467-6494.2008.00537.x
5. Chen S. Authenticity in context: being true to working selves. Rev Gen Psychol. 2019;23(1):60–72. doi:10.1037/gpr0000160
6. Siegel DJ. The Mindful Brain: Reflection and Attunement in the Cultivation of Well-Being. New York: W. W. Norton & Co; 2007.
7. Scott A. Cognitive behavioural therapy and young people: an introduction. J Fam Health Care. 2009;19(3):80–82.
8. Kessler RC, McLaughlin KA, Greif Green J, et al. Childhood adversities and adult psychopathology in the WHO World Mental Health Surveys. Br J Psychiatry. 2010;197(5):378–385. doi:10.1192/bjp.bp.110.080499
9. Bakermans-Kranenburg MJ, van Ijzendoorn MH. The first 10,000 adult attachment interviews: distributions of adult attachment representations in clinical and non-clinical groups. Attach Hum Dev. 2009;11(3):223–263. doi:10.1080/14616730902814762
10. Adam EK, Gunnar MR, Tanaka A. Adult attachment, parent emotion, and observed parenting behavior: mediator and moderator models. Child Dev. 2004;75(1):110–122.
11. Lee A, Hankin BL. Insecure attachment, dysfunctional attitudes, and low self-esteem predicting prospective symptoms of depression and anxiety during adolescence. J Clin Child Adolesc Psychol. 2009;38(2):219–231. doi:10.1080/15374410802698396
12. Manning RP, Dickson JM, Palmier-Claus J, Cunliffe A, Taylor PJ. A systematic review of adult attachment and social anxiety. J Affect Disord. 2017;211:44–59. doi:10.1016/j.jad.2016.12.020
13. Lyons-Ruth K, Dutra L, Schuder MR, Bianchi I. From infant attachment disorganization to adult dissociation: relational adaptations or traumatic experiences? Psychiatr Clin North Am. 2006;29(1):63–viii. doi:10.1016/j.psc.2005.10.011
14. Lumley MN, Harkness KL. Specificity in the relations among childhood adversity, early maladaptive schemas, and symptom profiles in adolescent depression. Cog Ther Res. 2007;31(5):639–657. doi:10.1007/s10608-006-9100-3
15. Beck JS. Cognitive Behavior Therapy: Basics and Beyond.
16. Ahami A, Mammad K, Azzaoui FZ, Boulbaroud S, Rouim FZ, Rusinek S. Early maladaptive schemas, working memory and academic performances of Moroccan students. Open J Med Psychol. 2017;6(6):53–65. doi:10.4236/ojmp.2017.62004
17. Bamber M, McMahon R. Danger – early maladaptive schemas at work! The role of early maladaptive schemas in career choice and the development of occupational stress in health workers. Clin Psychol Psychother. 2008;15(2):96–112. doi:10.1002/cpp.564
18. Yoosefi N, Etemadi O, Bahrami F, Al-Sadat Fatehizade M, Ahmadi SA. An investigation on early maladaptive schema in marital relationship as predictors of divorce. J Divorce Remarriage. 2010;51(5):269–292. doi:10.1080/10502551003651951
19. Lobbestael J, van Vreeswijk M, Arntz A. Shedding light on schema modes: a clarification of the mode concept and its current research status. Neth J Psychol. 2007;63(3):69–78.
20. Banting LK, Dimmock JA, Lay BS. The role of implicit and explicit components of exerciser self-schema in the prediction of exercise behavior. Psychol Sport Exerc. 2009;10(1):80–86. doi:10.1016/j.psychsport.2008.07.007
21. Arnold EG, Farber BA, Geller JD. Changes in patients’ self–representation over the course of psychotherapy. J Am Acad Psychoanal. 2000;28(3):449–466.
22. Borjali A, Bahramizadeh H, Eskandai H, Farrokhi NA. Psychological flexibility mediate the effect of early maladaptive schemas on psychopathology. IJABS. 2016;3:4.
23. Sheeran P, Orbell S. Self-schemas and the theory of planned behavior. Eur J Soc Psychol. 2000;30(4):533–550. doi:10.1002/1099-0992(200007/08)30:4<533::AID-EJSP6>3.0.CO;2-F
24. Rosenberg M. Society and the Adolescent Self-Image.
25. Beck AT, Brown GK, Steer RA, Kuyken W, Grisham J. Psychometric properties of the beck Self-Esteem Scales. Behav Res Ther. 2001;39(1):115–124.
26. Young JE. Young Schema Questionnaire Short Form.
27. Heatherton TF, Polivy J. Development and validation of a scale for measuring state self-esteem. J Pers Soc Psychol. 1991;60:895–910. doi:10.1037/0022-3514.60.6.895
28. Greenwald AG, McGhee DE, Schwarz JLK. Measuring individual differences in implicit cognition: the implicit association test. J Pers Soc Psychol. 1998;74:1464–1480. doi:10.1037//0022-3514.74.6.1464
29. Sinclair SJ, Blais MA, Gansler DA, et al. Psychometric properties of the Rosenberg Self-Esteem Scale: overall and across demographic groups living within the United States. Eval Health Prof. 2010;33(1):56–80. doi:10.1177/0163278709356187
30. Khoiriyah U, Roberts C, Jorm C, van der Vleuten CPM. Enhancing students’ learning in problem based learning: validation of a self-assessment scale for active learning and critical thinking. BMC Med Educ. 2015;15:140. doi:10.1186/s12909-015-0422-2
31. Schmitt DP, Allik J. Simultaneous administration of the Rosenberg Self-Esteem Scale in 53 nations: exploring the universal and culture-specific features of global self-esteem. J Pers Soc Psychol. 2005;89(4):623–642. doi:10.1037/0022-3514.89.4.623
32. Martín-Albo J, Núñez JL, Navarro JG, Grijalvo F. The Rosenberg Self-Esteem Scale: translation and validation in university students. Span J Psychol. 2007;10(2):458–467.
33. Snyder CR, Harris C, Anderson JR, et al. The will and the ways: development and validation of an individual-differences measure of hope. J Pers Soc Psychol. 1991;60(4):570–585. doi:10.1037//0022-3514.60.4.570
34. Lopez SJ, Ciarlelli R, Coffman L, Stone M, Wyatt L. Diagnosing for strengths: on measuring hope building blocks. In: Snyder CR, editor. Handbook of Hope: Theory, Measures, and Applications. San Diego: Academic Press; 2000:57–85.
35. Ociskova M, Sobotkova I, Prasko J, Mihal V. Measuring hope: standardization of the Czech version of the adult dispositional hope scale in healthy adults. Neuro Endocrinol Lett. 2016;37(8):543–550.
36. Beck AT, Steer RA, Carbin MG. Psychometric properties of the Beck depression inventory: twenty-five years of evaluation. Clin Psychol Rev. 1988;8(1):77–100. doi:10.1016/0272-7358(88)90050-5
37. Spreen O, Strauss E. A Compendium of Neuropsychological Tests. New York: Oxford University Press; 1991.
38. Ociskova M, Prasko J, Kupka M, et al. Psychometric evaluation of the Czech Beck Depression Inventory-II in a sample of depressed patients and healthy controls. Neuro Endocrinol Lett. 2017;38(2):98–106.
39. Liebowitz MR. Social phobia. Mod Probl Pharmacopsychiatry. 1987;22(1):147–173.
40. Cox BJ, Ross L, Swinson RP, Direnfeld DM. A comparison of social phobia outcome measures in cognitive-behavioral group therapy. Behav Modif. 1998;22(3):285–297. doi:10.1177/01454455980223004
41. Mennin DS, Fresco DM, Heimberg RG, Schneier FR, Davies SO, Liebowitz MR. Screening for social anxiety disorder in the clinical setting: using the Liebowitz social anxiety scale. Anxiety Disord. 2002;16:661–673. doi:10.1016/S0887-6185(02)00134-2
42. Fresco DM, Coles ME, Heimberg RG, et al. The Liebowitz social anxiety scale: a comparison of the psychometric properties of self-report and clinician-administered formats. Psychol Med. 2001;31:1025–1035. doi:10.1017/s0033291701004056
43. Heeren A, Maurage P, Rossignol M, et al. Self-report version of the Liebowitz social anxiety scale: psychometric properties of the French version. Can J Behav Sci. 2012;44(2):99–107. doi:10.1037/a0026249
44. Bernstein EM, Putnam FW. Development, reliability, and validity of a dissociation scale. J Nerv Ment Dis. 1986;174:727–735. doi:10.1097/00005053-198612000-00004
45. Van Ijzendoorn M, Schuengel C. The measurement of dissociation in normal and clinical populations: meta-analytic validation of the Dissociative Experiences Scale (DES). Clin Psychol Rev. 1996;16(5):365–382. doi:10.1016/0272-7358(96)00006-2
46. Rytwinski NK, Fresco DM, Heimberg RG, et al. Screening for social anxiety disorder with the self-report version of the Liebowitz Social Anxiety Scale. Depress Anxiety. 2009;26(1):34–38. doi:10.1002/da.20503
47. Faul F, Erdfelder E, Lang AG, Buchner A. G*Power 3: a flexible statistical power analysis program for the social, behavioral, and biomedical sciences. Behav Res Methods. 2007;39:175–191.
48. Graham JM. Congeneric and (essentially) tau-equivalent estimates of score reliability: what they are and how to use them. Educ Psychol Meas. 2006;66:930–944. doi:10.1177/0013164406288165
49. Cohen J. Statistical Power Analysis for the Behavioral Sciences.
50. World Medical Association. WMA declaration of Helsinki: ethical principles for medical research involving human subjects; JAMA. 2013;310(20):2191–2191.
51. American Psychological Association. Ethical principles of psychologists and code of conduct. Washington, DC: American Psychological Association; 2010.
52. Hair JF
53. Comrey AL, Lee HB. A First Course in Factor Analysis.
54. Stein DJ, Lim CCW, Roest AM, et al. The cross-national epidemiology of social anxiety disorder: data from the World Mental Health Survey Initiative. BMC Med. 2017;15:143. doi:10.1186/s12916-017-0889-2
55. Horney K. The Neurotic Personality of Our Time. New York: W. W. Norton & Co; 1937.
56. Durm MW, Glaze PE. Relation of self-acceptance and acceptance of others. Psychol Rep. 2001;88(2):410. doi:10.2466/pr0.2001.88.2.410
57. MacDonald G, Leary MR. Individual differences in self-esteem. In: Leary MR, Tangney JP, editors. Handbook of Self and Identity. New York: Guilford Press; 2003:354–377.
58. Jöreskog KG, Sörbom D. LISREL 8: Structural Equation Modeling with the SIMPLIS Command Language. Hillsdale: Lawrence Erlbaum Associates; 1993.
59. Sarkova M, Bacikova-Sleskova M, Orosova O, et al. Associations between assertiveness, psychological well-being, and self-esteem in adolescents. J Appl Soc Psychol. 2013;43(1):147–154. doi:10.1111/j.1559-1816.2012.00988.x
60. Páez D, Martínez-Sánchez F, Mendiburo A, et al. Affect regulation strategies and perceived emotional adjustment for negative and positive affect: a study on anger, sadness and joy. J Posit Psychol. 2013;8(3):249–262. doi:10.1080/17439760.2013.786751
61. Jimenez S, Niles BL, Park CL. A mindfulness model of affect regulation and depressive symptoms: positive emotions, mood regulation expectancies, and self-acceptance as regulatory mechanisms. Pers Indiv Dif. 2010;49(6):645–650. doi:10.1016/j.paid.2010.05.041
62. Vandenberg RJ. Statistical and methodological myths and urban legends. Organ Res Methods. 2006;9(2):194–201. doi:10.1177/1094428105285506
63. Hu L, Bentler PM. Cutoff criteria for fit indexes in covariance structure analysis: conventional criteria versus new alternatives. Struct Equ Modeling. 1999;6(1):1–55. doi:10.1080/10705519909540118
64. Boateng GO, Neilands TB, Frongillo EA, Melgar-Quinonez HR, Young SL. Best practices for developing and validating scales for health, social, and behavioral research: a primer. Front Public Health. 2018;6:149. doi:10.3389/fpubh.2018.00149
65. Bagozzi PR, Yi Y. On the evaluation of structural equation models. J Acad Mark Sci. 1988;16(1):74–94. doi:10.1007/BF02723327
66. Post MW. What to do with “moderate” reliability and validity coefficients? Arch Phys Med Rehabil. 2016;97:1051–1052. doi:10.1016/j.apmr.2016.04.001
67. American Psychiatric Association. Diagnostic and Statistical Manual of Mental Disorders.
68. Caballo VE, Olivares J, López-Gollonet C, Irurtia MJ, Rosa AI. Una revisión de los instrumentos para laevaluación de la fobia social: algunos datos empíricos [A re-view of the instruments for the assessment of social phobia: someempirical data]. Psicol Conductual. 2003;11(3):539–562.
69. Izgiç F, Akyüz G, Doğan O, Kuğu N. Social phobia among university students and its relation to self-esteem and body image. Can J Psychiatry. 2004;49:630–634. doi:10.1177/070674370404900910
70. Zeigler-Hill V. The connections between self-esteem and psychopathology. J Contemp Psychother. 2011;41(3):157–164. doi:10.1007/s10879-010-9167-8
71. Stoffers-Winterling JM, Storebø O, Völlm BA, et al. Pharmacological interventions for people with borderline personality disorder. Cochrane Database Syst Rev. 2018;2. Art. No.: CD012956.
72. Cristea IA, Gentili C, Cotet CD, et al. Efficacy of psychotherapies for borderline personality disorder. JAMA Psychiatry. 2017;74(4):319–328. doi:10.1001/jamapsychiatry.2016.4287
73. Feinstein AR. An additional science for clinical medicine: IV. The development of clinimetrics. Ann Intern Med. 1983;99(6):843–848. doi:10.7326/0003-4819-99-6-843
74. Fava GA, Tomba E, Sonino N. Clinimetrics: the science of clinical measurements. Int J Clin Pract. 2012;66(1):11–15. doi:10.1111/j.1742-1241.2011.02825.x
75. Carrozzino D, Morberg BM, Siri C, Pezzoli G, Bech P. Evaluating psychiatric symptoms in Parkinson’s Disease by a clinimetric analysis of the Hopkins Symptom Checklist (SCL-90-R). Prog Neuropsychopharmacol Biol Psychiatry. 2018;81:131–137. doi:10.1016/j.pnpbp.2017.10.024
76. Carrozzino D. Clinimetric approach to rating scales for the assessment of apathy in Parkinson’s disease: a systematic review. Prog Neuropsychopharmacol Biol Psychiatry. 2019;94:109641. doi:10.1016/j.pnpbp.2019.109641
 © 2019 The Author(s). This work is published and licensed by Dove Medical Press Limited. The
full terms of this license are available at https://www.dovepress.com/terms
and incorporate the Creative Commons Attribution
- Non Commercial (unported, 3.0) License.
By accessing the work you hereby accept the Terms. Non-commercial uses of the work are permitted
without any further permission from Dove Medical Press Limited, provided the work is properly
attributed. For permission for commercial use of this work, please see paragraphs 4.2 and 5 of our Terms.
© 2019 The Author(s). This work is published and licensed by Dove Medical Press Limited. The
full terms of this license are available at https://www.dovepress.com/terms
and incorporate the Creative Commons Attribution
- Non Commercial (unported, 3.0) License.
By accessing the work you hereby accept the Terms. Non-commercial uses of the work are permitted
without any further permission from Dove Medical Press Limited, provided the work is properly
attributed. For permission for commercial use of this work, please see paragraphs 4.2 and 5 of our Terms.