")
Back to Journals » International Journal of Nanomedicine » Volume 18
Porous SiO2-Based Reactor with Self-Supply of O2 and H2O2 for Synergistic Photo-Thermal/Photodynamic Therapy
Authors Li Z , Guo L , Lin L, Wang T, Jiang Y, Song J, Feng J, Huang J, Li H, Bai Z, Liu W , Zhang J
Received 14 February 2023
Accepted for publication 20 June 2023
Published 3 July 2023 Volume 2023:18 Pages 3623—3639
DOI https://doi.org/10.2147/IJN.S387505
Checked for plagiarism Yes
Review by Single anonymous peer review
Peer reviewer comments 2
Editor who approved publication: Dr Phong A Tran
Zhengzhao Li,1,* Lianshan Guo,1,* Liqiao Lin,1 Tongting Wang,1 Yanqiu Jiang,1 Jin Song,1 Jihua Feng,1 Jianfeng Huang,2 Haoyu Li,2 Zhihao Bai,3 Wenqi Liu,4 Jianfeng Zhang1
1Department of Emergency, The Second Affiliated Hospital of Guangxi Medical University, Nanning, Guangxi, 530007, China; 2Department of Nephrology, The Second Affiliated Hospital of Guangxi Medical University, Nanning, Guangxi, 530007, China; 3College of Chemistry and Chemical Engineering, Guangxi University, Nanning, Guangxi, 530004, China; 4Department of Radiation Oncology, The Second Affiliated Hospital of Guangxi Medical University, Nanning, Guangxi, 530007, China
*These authors contributed equally to this work
Correspondence: Zhihao Bai, College of Chemistry and Chemical Engineering, Guangxi University, Nanning, Guangxi, 530004, China, Tel/Fax +86 771-3237584, Email [email protected] Jianfeng Zhang, Department of Emergency, The Second Affiliated Hospital of Guangxi Medical University, Nanning, Guangxi, 530007, China, Tel +86 771- 3277068, Fax +86 771- 3277277, Email [email protected]
Purpose: Although the combined photo-thermal (PTT) and photodynamic therapy (PDT) of tumors have demonstrated promise as effective cancer therapy, the hypoxic and insufficient H2O2 supply of tumors seriously limits the efficacy of PDT, and the acidic environment reduces the catalytic activity of nanomaterial in the tumor microenvironment. To develop a platform for efficiently addressing these challenges, we constructed a nanomaterial of Aptamer@dox/GOD-MnO2-SiO2@HGNs-Fc@Ce6 (AMS) for combination tumor therapy. The treatment effects of AMS were evaluated both in vitro and in vivo.
Methods: In this work, Ce6 and hemin were loaded on graphene (GO) through π-π conjugation, and Fc was connected to GO via amide bond. The HGNs-Fc@Ce6 was loaded into SiO2, and coated with dopamine. Then, MnO2 was modified on the SiO2. Finally, AS1411-aptamer@dox and GOD were fixed to gain AMS. We characterized the morphology, size, and zeta potential of AMS. The oxygen and reactive oxygen species (ROS) production properties of AMS were analyzed. The cytotoxicity of AMS was detected by MTT and calcein-AM/PI assays. The apoptosis of AMS to a tumor cell was estimated with a JC-1 probe, and the ROS level was detected with a 2’,7’-Dichlorodihydrofluorescein diacetate (DCFH-DA) probe. The anticancer efficacy in vivo was analyzed by the changes in the tumor size in different treatment groups.
Results: AMS was targeted to the tumor cell and released doxorubicin. It decomposed glucose to produce H2O2 in the GOD-mediated reaction. The generated sufficient H2O2 was catalyzed by MnO2 and HGNs-Fc@Ce6 to produce O2 and free radicals (•OH), respectively. The increased oxygen content improved the hypoxic environment of the tumor and effectively reduced the resistance to PDT. The generated •OH enhanced the ROS treatment. Moreover, AMS depicted a good photo-thermal effect.
Conclusion: The results revealed that AMS had an excellent enhanced therapy effect by combining synergistic PTT and PDT.
Keywords: nanomaterial, photo-thermal therapy, photodynamic therapy, hypoxia
Introduction
Reactive oxygen species (ROS) is an important intracellular signaling molecule in biological processes.1 At normal concentrations, ROS can regulate cell growth, apoptosis, and differentiation; it also participates in proliferation, DNA damage, and other living activities. However, congestion of the plethora of ROS can lead to oxidative damage and, ultimately, apoptosis.2 Breaking the ROS content threshold to trigger tumor apoptosis has attracted extensive interest in tumor therapy.3–5
ROS-based methods have demonstrated considerable potential in cancer therapeutics.6–8 Photodynamic therapy (PDT), which uses photosensitizers to generate ROS by laser activation, is generally regarded as a scheme for ROS-based tumor therapeutics.9–11 However, the hypoxic nature of tumor tissue is very harmful to a photosensitizer, which requires oxygen molecules to exert cytotoxicity. In addition, the consumption of O2 by the photosensitizer will increase the tumor site hypoxia in the PDT process, resulting in a weakening effect of PDT for cancer treatment.12–15 Many programs have been developed to ameliorate the hypoxic condition to improve the therapeutic effect.16–20 Using nanomaterials as catalysts to improve the oxygen concentration of tumor sites has attracted increasing interest.21–23
Some treatment methods, such as PTT, PDT, and CDT, have been combined to further improve anti-tumor efficiency.24–26 Doxorubicin (dox), which can embed into DNA to inhibit the synthesis of nucleic acids, has been widely used as an anti-tumor antibiotic. Under aerobic conditions, dox can activate nicotinamide adenine dinucleotide phosphate (NADPH) oxidase to trigger and generate superoxide radicals (O2•−) in the reaction. The produced O2•− can oxidize the damaged cell components to induce cancer cell death.27,28 However, the hypoxic condition of the tumor tissue reduces the therapeutic effect of dox. Therefore, alleviating the hypoxic environment can increase the sensitivity of tumor cells to dox and improve the anti-tumor efficacy of CDT.29–32
Nanozymes have recently been developed for novel photo-thermal and photodynamic tumor therapy. Compared with natural enzymes, nanozymes have the advantages of tunable size and high stability in harsh environments and can produce cascading catalytic effects in tumor treatment. In the nanoenzyme mediated reaction, the abundant of H2O2 can be catalyzed to generate the highly oxidizing •OH radicals by the nanozyme, which can cause efficient chemotherapy effects on tumor cells. Wang have constructed an amorphous NiB@IrOx nanozymes that possess a high therapeutic efficiency via catalyze H2O2 to •OH and O2.33 Xu have developed a hollow silica nanozymes for robust oxidative phosphorylation, which possess treatment effect significantly through dual enzyme-like activities.34 Liu constructed the nanomaterial of SS-DMONS/DOX-Ce6@MIPs, which possess an excellent tumor targeting and dual responsive drug release.35 Zhang constructed a reactor that SiO2 encapsulated upconversion material for photo-thermal photodynamic therapy of tumor.36
Herein, we fabricated a hollow mesoporous silica-based nanoplatform that possessed excellent photo-thermal and photodynamic treatment (Scheme 1). In the nanomaterial, HGNs-Fc@Ce6 was encapsulated in the mesoporous SiO2, PDA and MnO2 were immobilized on the surface of SiO2, and doxorubicin-loaded AS1411-aptamer and GOD were modified via the amide bond between the amino of dopamine and the carboxyl of GOD and aptamer. The Aptamer@dox/GOD-MnO2-SiO2@HGNs-Fc@Ce6 (AMS) degraded glucose into H2O2 through the GOD-mediated process in the tumor microenvironment, and the generated H2O2 was decomposed into oxygen (O2) by MnO2. Meanwhile, AMS could be used to generate 1O2 by Ce6 under the 660 nm laser irradiation, which can efficiently kill tumor cells. The generated O2 could overcome tumor hypoxia and enhance PDT. The PDA was cracked in the acidic environment, and the released HGNs-Fc@Ce6 catalyzed H2O2 to generate ROS to kill tumor cells. Moreover, AMS exhibited good photo-thermal and photodynamic effects under laser irradiation.
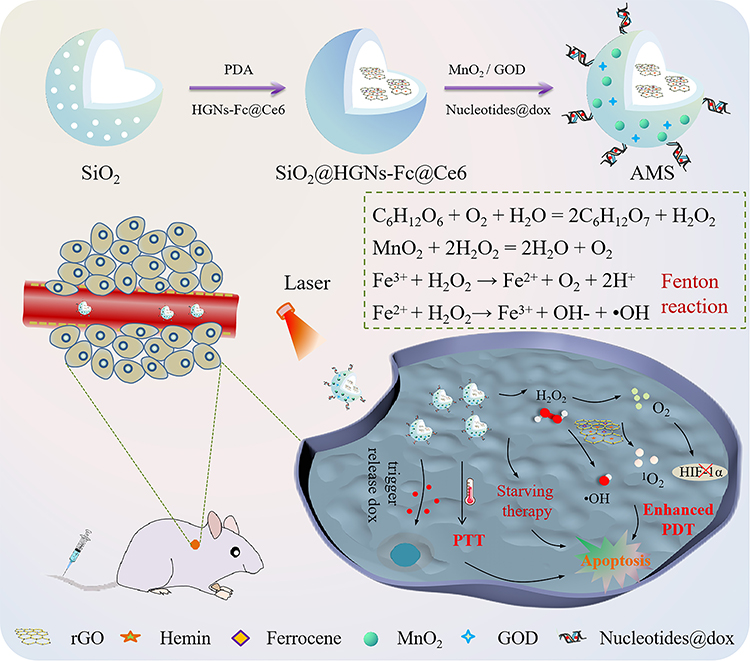 |
Scheme 1 Schematic illustrations for the fabrication of AMS and synergistic anti-tumor effect. |
Materials and Methods
Materials
Chlorine e6 (Ce6), glucose oxidase (GOD), Hemin, 3-(4,5-dimethylthiazol-2-yl)-2,5-diphenyltetrazolium bromide (MTT), 2′,7′-dichlorofluorescin diacetate (DCFH-DA), JC-1 reagent test kit, propidium iodide (PI), and 1, 3-diphenylisobenzofuran (DPBF) were purchased from Sigma-Aldrich. Graphene oxide (GO) was obtained from Xianfeng Nano Materials Tech Co. Ltd. (Nanjing, China). The nucleic acid sequence was obtained from Takara Biomedical Technology Co., Ltd. (Beijing, China). Human hepatocarcinoma cell lines (HepG2) and human normal liver cells (7702) were purchased from the Chinese Academy of Medical Sciences (Beijing, China).
Preparation of AMS
Preparation of SiO2
First, 3 mL of ethyl orthosilicate (TEOS) was added to the ethanol (36 mL) and ammonia (1.60 mL) solution and stirred at 30 °C for 50 min. Then, a mixture of TEOS (2.5 mL) and perfluorodecane (CF, 1.0 mL) was added drop-wise into the above solution, and it was further continuously stirred for 80 min in a 30 °C water bath. The pellet was obtained via centrifugation (10,000 rpm, 10 min). The precipitate was placed in a Na2CO3 solution (50 mL, 0.6 M) and etched at 80 °C for 10–20 min. The mixed solution was centrifuged (8000 rpm for 10 min) and washed with H2O to obtain the hollow mesoporous SiO2.
Preparation of HGNs-Fc@Ce6
Hydrazine (80%, 5 μL) and hemin (2 mg) were added to 1 mL of graphene oxide (10 nm, GO) solution (1 mg/mL) and incubated for 4 h in the water bath at 60 °C. The hemin was loaded onto the GO via π-π conjugated covalent bond. The mixed solution was centrifuged to remove the supernatant; thus, the HGNs were obtained. A mixture of 0.1 mg of chitosan (CS, CAS: 9012-76-4, 10-50kDa), 1 mL of HGNs (1 mg/mL), 50-mM EDC, and NHS was stirred for 2 h. The solution was centrifuged to gain precipitates, and then 0.2 mg of ferrocene, 100 μL of 50-mM EDC, and NHS were added to the above re-dispersed solution while stirring for another 2 h. The supernatant was removed from the mixed solution and re-dispersed to form a 1-mg/mL HGNs-Fc solution. The HGNs-Fc was synthesized via the dehydration condensation reaction, that the amino group of CS is connected with the carboxyl group of HGNs and Fc through the chemical bond of amide bond.37
Next, 0.5 mg of Ce6 was dissolved in 2 mL of dimethyl sulfoxide (DMSO) and added to the HGNs-Fc solution (1 mg/mL, 2 mL). The mixed solution was stirred for 12 h and centrifuged to remove the excess Ce6.
Preparation of MnO2-SiO2@HGNs-Fc@Ce6
The HGNs-Fc@Ce6 solution (2.0 mg/mL, 5 mL) was injected into the SiO2 dispersion (1.0 mg/mL, 5 mL) and stirred for 24 h. The solution was centrifuged and washed to gain SiO2@HGNs-Fc@Ce6. A mixture of 5 mL of SiO2@HGNs-Fc@Ce6 (1.0 mg/mL) and 3 mL of dopamine (1.0 mg/mL) was stirred for 12 h. The mixture was centrifuged to gain the precipitates, and then, 1.5 mL of potassium permanganate (KMnO4, 0.1 mg/mL) was added to the above re-dispersed solution, stirring for 1 h. Next, ascorbic acid (0.5 mM) was added dropwise into the above solution to reduce KMnO4 to manganese dioxide (MnO2). This reaction was manipulated until the color of the solution changed from dark red to brownish black. The mixed solution was centrifuged to remove the supernatant and obtain MnO2-SiO2@HGNs-Fc@Ce6.
Preparation of AMS
Next, 500 μL of FITC-labeled AS1411-aptamer@dox (100 nM), GOD (0.5 mg/mL, 1 mL), 100 μL of EDC, and NHS aqueous (50 mM, 4:1) were added to the above MnO2-SiO2@HGNs-Fc@Ce6 solution. The mixed aqueous solution was stirred for 12 h and centrifuged at 10,000 rpm for 20 min to obtain AMS.
Sequences of the FITC-AS1411-aptamer: 5’-FITC-GGT GGT GGT GGT TGT GGT GGT GGT GG NNNNNNNNNNNNNNNNNTTTTTTT-SH-3’ (The AS1411-aptamer sequences in the oligonucleotides are underlined.).
Complementary strand: 5’-NNNNNNNNNNTTTTTTTTT ACA ACC ACC ACC ACC-1-3’.
Oxygen Generation
Next, 100 µL of H2O2 (150 µM) or a glucose solution (150 µM) was added to AMS solutions of different concentrations (10, 20, 30, 60, and 90 μg/mL) without oxygen, and then, the dissolved O2 concentration was measured with an oxygen meter.
Measurement of Singlet Oxygen (1O2)
DPBF was used to measure 1O2 production by AMS in the absence or presence of the H2O2 solution under 660-nm laser irradiation. First, 100 μL of H2O2 (5 mM) and 50 μL of DPBF (1 mg/mL, dissolved in DMSO) were added to 3 mL of the AMS (100 μg/mL, pH = 5.5) solution. Similarly, 100 μL of glucose (5 mM) and 50 μL of DPBF (1 mg/mL, dissolved in DMSO) were added to 3 mL of the AMS (100 μg/mL, pH = 5.5) solution. The generated 1O2 of AMS was evaluated by the UV–visible absorption of DPBF under 660-nm laser irradiation (0.2 W cm−2).
Measurement of •OH
A TMB coloration assay was used to measure the produced •OH. First, 100 μg/mL of H2O2 (10 mM) and the glucose solution (20 mM) were injected into the AMS solution (100 μg/mL, pH = 5.5) and 0.5 mg/mL of TMB, respectively. The absorbance peak at 652 nm was recorded with a microplate reader.
Electron spin resonance (ESR) was used for the measurement of •OH. First, 100 μL of H2O2 (5 mM) was added to the AMS solution (100 μg/mL, pH = 5.5), including the capture agent of DMPO. An ESR signal was detected at a different time by a Bruker EMX1598 spectrometer.
Photo-Thermal Performance
To analyze the photo-thermal effect, AMS solutions with a range of concentrations (0, 50, 100, 200, and 300 μg/mL) were irradiated with an 808-nm laser at a power density of 1.6 W/cm2 for 10 min. Different power densities of the 808-nm laser (0.4, 0.8, 1.2, 1.6, and 2.0 W/cm2) were also used to evaluate the thermal effect of the AMS solution (100 μg/mL). In addition, the photo-thermal efficiency of AMS was monitored by repeated on/off under the irradiation of an 808-nm laser.
Cell Culture
HepG2 cells (human hepatoma cells) and 7702 cells (human liver cells) were purchased from the Chinese Academy of Sciences. The cell lines were cultured in a DMEM medium (Gibco, USA) containing 10% fetal bovine serum (FBS, Gibco, USA) at 37 °C and 5% CO2 cell incubator.
Targeted Analysis of AMS
The HepG2 cells (1 × 10⁵ cells) were incubated in a confocal dish at 37 °C, 5% CO2 for 24 h. Then, they were treated with AMS (100 μg/mL) for 30 min. The dish was washed with PBS (0.01 M) and imaged with a confocal laser scanning microscope (CLSM).
In vitro Reactive Oxygen Species (ROS) Production
A DCFH-DA probe was used to measure intracellular ROS. The HepG2 cells (105 cells per dish) were co-incubated with the AMS solution (100 µg/mL) for 30 min in a dish. Then, the DMEM containing DCFH-DA (1 µM) was added, and the sample was incubated for 30 min. Subsequently, the HepG2 cells were treated with laser (660 nm, 0.2 W cm−2) and imaged with CLSM.
In vitro Toxicity Assessment of AMS
The HepG2 and 7702 cells (8000 cells per well) were incubated in 96-well plates for 24 h and processed with a series of therapeutic regimens. First, 10 µL of CCK-8 (5 mg/mL) was added to the plates, and they were further incubated for 4 h. The toxicity was evaluated with a microplate reader. (Therapeutic regimen: control: cells handled by PBS or laser irradiation; SiO2: cells treated with SiO2; HGNs-Fc@Ce6: cells treated with HGNs-Fc@Ce6; AMS: cells treated with AMS; AMS + 660 L: cells were irradiated with the 660-nm laser (0.2 W cm−2) after treatment with AMS; AG NPs + 808 L: cells were irradiated with the 808-nm laser (1.6 W cm−2) after treatment with AMS; AMS + 660 nm + 808 nm L: cells were irradiated with the 660-nm laser (0.2 W cm−2) and the 808-nm laser (1.6 W cm−2) after treatment with AMS). Similarly, different concentrations of SiO2, HGNs-Fc@Ce6, and AMS were used for detecting cell toxicity under laser irradiation.
The calcein-AM and PI dye was used to assess and analyze the live/dead cells. HepG2 cells (1 × 10⁵ cells per dish) were incubated in a confocal dish for 24 h. Then, the cells were treated with the above mentioned treatment prescription. Subsequently, the culture medium containing calcein-AM (10 µg/mL) and PI (5 µg/mL) was injected into the dish and cultured for 20 min. The dish was washed with PBS (0.01 mM) and imaged with CLSM.
The JC-1 probe was used as a detection indicator in the early apoptosis of tumor cells. HepG2 cells (105 cells per well) were incubated in a confocal dish and handled with PBS, SiO2 (100 μg/mL), HGNs-Fc@Ce6 (100 μg/mL), AMS (100 μg/mL), AMS (100 μg/mL) with the 660-nm laser (0.2 W cm−2), AMS (100 μg/mL) with the 808-nm laser (1.6 W cm−2), and AMS (100 μg/mL) with the 660-nm laser (0.2 W cm−2) and the 808-nm laser (1.6 W cm−2). Then, a JC-1 solution (1×, 1 mL) was added to the above mentioned eight dishes and incubated at 4 °C for 20 min. The dishes were washed with the JC-1 buffer and imaged with CLSM.
Construction of Tumor-Bearing Mouse Model
Nude mice (4–6 weeks old, an equal number of males and females) were obtained from Guangxi Medical University. All the animal experiments were performed under protocols approved by the Animal Care and Use Committee. Furthermore, 100 µL of PBS containing HepG2 cells (1 × 10⁶) was subcutaneously seeded on the backs of the nude mice to develop a hepatic carcinoma tumor model.
In vivo Fluorescence Imaging
Fluorescence imaging was conducted using an MSOT scanner in a small-animal imaging system. First, 200 µL of an AMS solution (100 µg/mL) was injected into the mice via the tail vein (anesthetized with 3% isoflurane). The fluorescence signal of AMS in the tumor-bearing mice was recorded at different time points (0, 1, 4, 8, 12, 24, and 48-h post-injection). Next, 200 µL of random sequence modified-GOD-MnO2-SiO2@HGNs-Fc@Ce6 (RMS) (100 µg/mL) was injected into mice via the tail vein to record the fluorescence signal, which acted as the control signal.
In vivo Anti-Tumor Effect
The tumor-bearing mice were randomly divided into six groups (n = 6) as follows: (a) PBS, (b) laser irradiation, (c) AMS, (d) AMS + 660 nm laser, (e) AMS + 808 nm laser, (f) AMS + 660 nm + 808 nm laser. The prepared AMS (100 µg/mL) was injected into the mice via the tail vein. After 4 h, the 660-nm laser (0.2 W cm−2, 5 min) or the 808-nm laser (1.6 W cm−2, 5 min) was used to irradiate the tumor site of the mice. The tumor volumes and body weights were measured every two days. After treatment, the tumors of tumor-bearing mice were dissected and used for a hematoxylin and eosin (HE) staining assay and Ki-67.
Statistical Analysis
The results were presented as mean ± standard deviation. Furthermore, t-tests were used to analyze the comparison between different groups. *p < 0.05, **p < 0.01, and ***p < 0.001 were regarded as statistically significant.
Results and Discussion
Preparation and Characterization
The HGNs-Fc was synthesized via the amide bond between the amino of CS and the carboxyl of HGNs and Fc.37 The thickness and the average size were approximately 21 nm and 18 nm, respectively (Figures S1 and S2, Supporting Information). In the FT-IR spectrum of HGNs-Fc, 943 cm−1 is a characteristic peak of the Fc ring vibration, and the peaks at 1236 and 1452 cm−1 represent the C-O and N-H vibrations. The peak at 1710 cm−1 was the characteristic absorption peak of the amide bond (CO-NH) (Figure S3, Supporting Information). In the UV-vis spectrum of HGNs-Fc, the peak at 221 nm was ascribed to the π-π transitions of aromatic C=C bonds, and the peaks at 274 and 320 nm were the characteristic peaks of Fc (Figure S4, Supporting Information). Similarly, the Raman spectra of both GO and HGNs-Fc had two characteristic bands at 1353 cm−1 (D band) and 1596 cm−1 (G band), respectively (Figure S5, Supporting Information). The HGNs-Fc nanozymes exhibited excellent catalase activities, which could generate •OH for the ROS therapy through the Fenton reaction. 3, 3′, 5, 5′-Tetramethylbenzidine (TMB) was used to evaluate the catalytic performance of HGNs-Fc, which could be oxidized into blue oxidized TMB (oxTMB) in the presence of the peroxidase-like activity of the materials and the H2O2 solution. A variation of the TMB absorption value with time was detected in a solution of 2 mL of HGNs-Fc (100 μg/mL) containing 10.0-mM H2O2 and 0.5-mM TMB. The TMB absorption of HGNs-Fc reached the maximum value at 3 min and then gradually decreased, indicating that the HGNs-Fc had an efficient catalytic effect on H2O2 (Figure S6, Supporting Information). After the modification of Ce6 on the HGNs-Fc by the π−π stacking interaction, the catalytic performance remained almost unchanged (Figure S7, Supporting Information). Subsequently, HGNs-Fc@Ce6 was encapsulated in SiO2, and then, PDA and MnO2 were covered on the surface of SiO2@HGNs-Fc@Ce6 in turn. The concentration of doxorubicin loaded in the aptamer was optimized, and the characteristic absorption peak reached the maximum at the concentration of 14 mg (Figure S8, Supporting Information). Finally, AS1411-aptamer@dox and GOD were co-modified on MnO2-SiO2@ HGNs-Fc@Ce6, and the final product was obtained. As displayed in Figure 1A and B, the TEM images of SiO2 exhibited spherical morphology and a hollow structure. The size was approximately 160 nm, and the zeta potential was −47.5 mV. The pore size of SiO2 measured by BET reached 29.4 nm. When the HGNs-Fc@Ce6 and PDA were modified in the SiO2, the morphological structure of the material did not change, and the zeta potential value was −15.2 mV. After KMnO4 was reduced by ascorbic acid, a layer of MnO2 particles could be observed around the SiO2 surface. The particle size was then 130 nm, and the zeta potential became −44.2 mV. To increase the biocompatibility and multiple functions of SiO2, AS1411-aptamer@dox and GOD were coated on the surface of SiO2. The particle size of the prepared AMS remained at approximately 140 nm, which was attributed to the fact that both the oligonucleotides and the enzymes were small molecules. The SEM images of the modified SiO2 demonstrated a spherical morphology, and the particle size was consistent with that obtained using TEM. The energy spectrum was also detected to analyze the elemental composition of AMS, and the representative elements of C, O, Fe, Mn, Si, and P could be observed, as illustrated in Figure 1C. The zeta potential value increased to −27.6 mV (Figure 1C). The elements Fe, Mn, Si, and S co-existed in the XPS spectra, indicating that AMS was successfully synthesized (Figure 1D). The Mn2+ peaks (644.4 eV) in Mn (2p) further indicated that Mn2+ was modified in the AMS, as displayed in Figure 1E of XPS Mn (2p). The infrared spectrum also provided evidence of the synthesis of AMS (Figure S9, Supporting Information). In addition, the hydrodynamic size of AMS was detected by dynamic light scattering (DLS) in PBS or the cell culture medium within seven days, which indicated that the AMS had good dispersion and stability (Figure S10, Supporting Information).
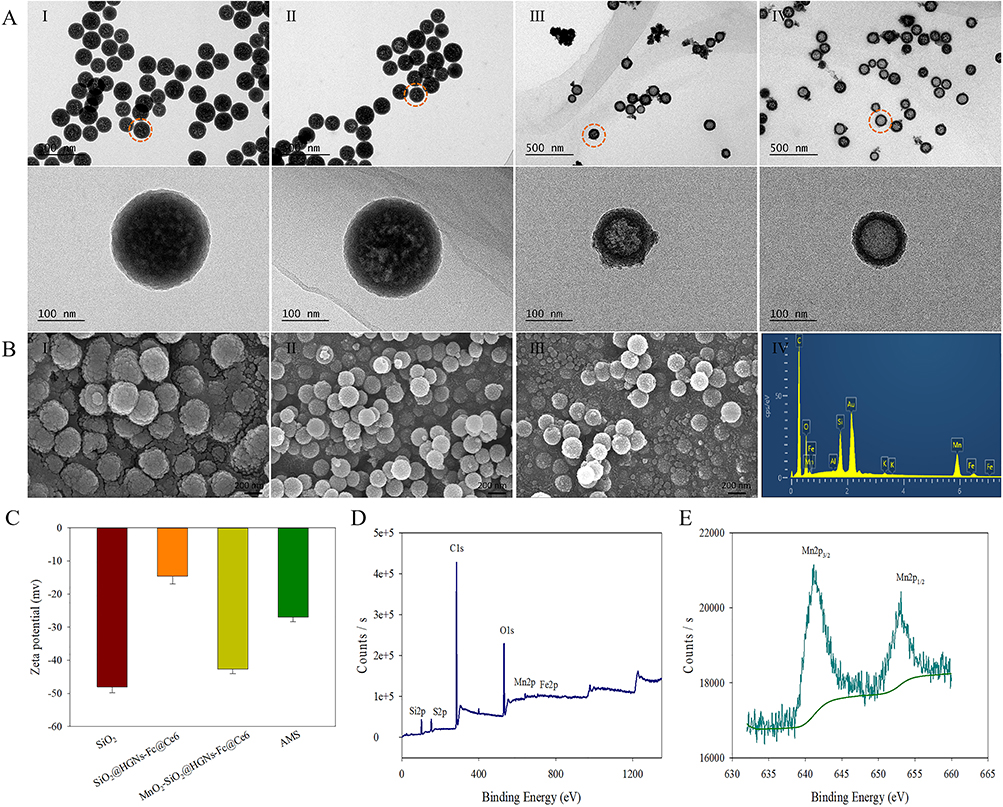 |
Figure 1 Characterization of AMS. (A) TEM images of SiO2 (I), SiO2@HGNs-Fc@Ce6 (II), MnO2-SiO2@HGNs-Fc@Ce6 (III), AMS (IV), respectively. Scale bar: 500 nm. The corresponding enlarged view of the above of TEM images. Scale bar: 100 nm. (B) SEM images of SiO2 (I), MnO2-SiO2@HGNs-Fc@Ce6 (II), AMS (III), and energy dispersive spectroscopy (EDS) of AMS (IV), respectively. Scale bar: 200 nm. (C) Zeta potentials of the different modified SiO2. (D) XPS spectrum of AMS. (E) XPS spectrum of Mn 2p. |
Detection of Produced Oxygen
To analyze the oxygen production capacity of AMS, the oxygen content was monitored after the injection of AMS solutions of different concentrations into H2O2 or glucose solution. Negligible oxygen content was detected in PBS. However, the oxygen generation increased with an increase in the concentration of AMS in the H2O2 or glucose solution (Figure 2A and B), demonstrating that AMS could efficiently catalyze glucose to H2O2 and that the generated H2O2 could be oxidized to produce O2 by MnO2. The photographs of the addition of AMS solutions of different concentrations to the H2O2 or glucose solution are illustrated in Figures S11 and S12. The higher concentrations of AMS produced more bubbles. The results revealed that AMS could consume glucose in the tumor microenvironment and “starved” the tumor cells. Simultaneously, the produced O2 could overcome the hypoxic environment of tumors, synergistically improving and enhancing the effect of the tumor treatment.
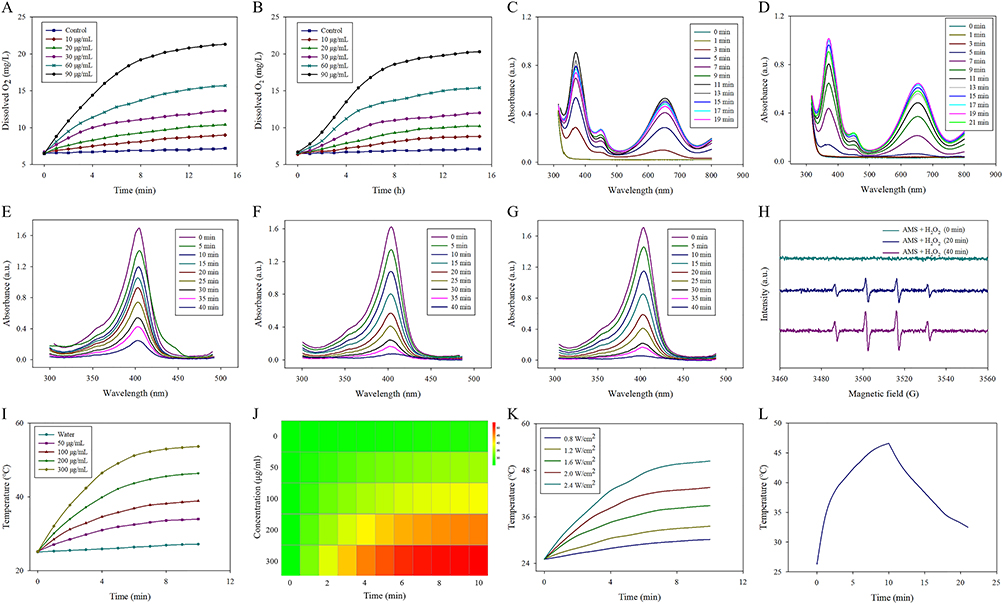 |
Figure 2 (A) The generated oxygen of different concentrations AMS in H2O2 solution. (B) The generated oxygen of different concentrations AMS in glucose solution. (C) Time-dependent TMB absorption in AMS solution including 10 mM H2O2 and 0.5 mM TMB. (D) Time-dependent TMB absorption in AMS solution including 20 mM glucose and 0.5 mM TMB. (E) Absorption spectrum of DPBF upon 660 nm laser irradiation in AMS solution. (F) Absorption spectrum of DPBF upon 660 nm laser irradiation in AMS solution with H2O2. (G) Absorption spectrum of DPBF upon 660 nm laser irradiation in AMS solution with glucose. (H) ESR spectra of DMPO/•OH collected from H2O2 with AMS solution. (I) Temperature curves of different concentrations AMS under 808 nm laser irradiation (1.6 W/cm2). (J) Thermal infrared photograph of different concentrations AMS under laser irradiation. (K) Temperature curves of AMS solutions under different power density laser irradiation. (L) Temperature changes curve of AMS under 808 nm laser irradiation (1.6 W/cm2) for 10 min, and then turned off the laser. |
Catalytic Performance of AMS
TMB was applied to measure the peroxidase-like activity of AMS. The absorption peaks at 652 nm were observed when 10-mM H2O2 and 0. 5-mM TMB were added to the AMS (100 μg/mL, pH = 5.5) solution, in which the chitosan of AMS degraded in the acidic environment and released the HGNs-Fc catalyzed to produce •OH to oxidize TMB (Figure 2C). Similarly, the absorption value at 652 nm was recorded in the mixed solution (20-mM glucose, 0.5-mM TMB, and 100-μg/mL AMS). In this process, AMS consumed glucose to generate H2O2 and gluconic acid through the GOD-mediated reaction, polydopamine was degraded, and HGNs-Fc catalyzed H2O2 to produce •OH for the TMB oxidation (Figure 2D). The results demonstrated that AMS exhibited CAT-like and POD-like activities, which could produce O2 to overcome tumor hypoxia and decompose glucose into H2O2 and then catalyze H2O2 to •OH for an enhanced ROS treatment.
Measurement of 1O2
The DPBF was used to analyze the 1O2 production ability of AMS. The absorption values of DPBF hardly changed under laser irradiation alone over 40 min (Figure S13, Supporting Information). The DPBF absorption of the AMS solution (100 μg/mL, pH = 5.5) at 410 nm decreased upon 660-nm laser irradiation (0.2 W cm−2) for 40 min (Figure 2E). Meanwhile, the DPBF absorption of the AMS solution (100 μg/mL, pH = 5.5) containing 20-mM H2O2 at 410 nm was detected to analyze the effect of H2O2 on the 1O2 production. The increase in the 1O2 yield of AMS with H2O2 was higher than that without H2O2, revealing that the O2 produced from the reaction of MnO2 and H2O2 could increase the oxygen concentration and improve the production of the reactive oxygen species (ROS) generated by AMS (Figure 2F). In contrast, no significant difference in the DPBF absorption of Ce6 was found in the presence or absence of H2O2, which could be attributed to the fact that Ce6 did not catalyze H2O2 to generate O2 in the H2O2 solution. In addition, the DPBF absorption of the AMS solution (100 μg/mL) containing 20-mM glucose was detected for the 1O2 generation. Compared with the AMS solution (100 μg/mL, pH = 5.5), AMS with had a relatively high 1O2 yield in the glucose solution. Glucose was decomposed to H2O2 and gluconic acid through a GOD-mediated reaction; the generated H2O2 was catalyzed to O2 by MnO2, enhancing ROS production (Figure 2G). To analyze the properties of AMS to generate •OH, DMPO/•OH was captured by the trapping probe of dimethyl pyridine N-oxide (DMPO) and recorded by electron spin resonance (ESR). The four-line spectra of DMPO/•OH were obtained by the AMS treatment. At the start of the reaction, no response signal had been detected. With the extension of time, the spectrum intensity increased, indicating that the AMS was gradually cracked, resulting in higher •OH generation (Figure 2H).
Photothermal Effect of AMS
To test the photo-thermal effect, AMS solutions of different concentrations were exposed for 10 min under the 808-nm laser irradiation. The concentration-dependent temperature rise curve and the thermal infrared photograph are presented in Figures 2I and J; the temperature rose to 32.5, 37.2, 46.0, and 57.0 °C at the concentration of 50, 100, 200, and 300 µg/mL, respectively. For comparison, the water temperature only increased by 2.1 °C. The photo-thermal efficiency of AMS under the different intensities of laser irradiation was also analyzed, exhibiting a laser-power-dependent manner (Figure 2K). The photo-thermal conversion efficiency of AMS reached 41.3% (Figure 2L). The temperature of the material could be used to kill tumor cells.38–40 The temperature that treated with cells reached to 50°C, the activity of tumor cells decreases, leading to apoptosis effects in the tumor cells. The results demonstrated that both AMS solutions had a good photo-thermal effect. In addition, the temperature change of AMS that treated by repeating on/off laser every other 5 min in ten cycles was within an acceptable range, indicating that AMS had a good photo-thermal stability (Figure S14, Supporting Information).
Targeting Study of AMS and Drug Release
To investigate the targeting, AMS (100 μg/mL) was added to the HepG2 cells and incubated for different periods (Figure 3A). FITC-labeled AMS was aggregated to the HepG2 cells. At the incubation time of 3 min, the red fluorescence was barely visible. With the prolongation of the incubation time, the red fluorescence of dox was significantly enhanced and accumulated in the cell nuclei, demonstrating that the intracellular dox released after the structural changes of the oligonucleotide within the trigger after the cellular uptake of AMS. The prepared AMS could target to tumor cells, and released the doxorubicin. The released doxorubicin could induce cell DNA damage and increase the apoptosis rate of tumor cells. However, AMS had less damage to normal cells. This indicated that AMS had an efficient anti-tumor effect.
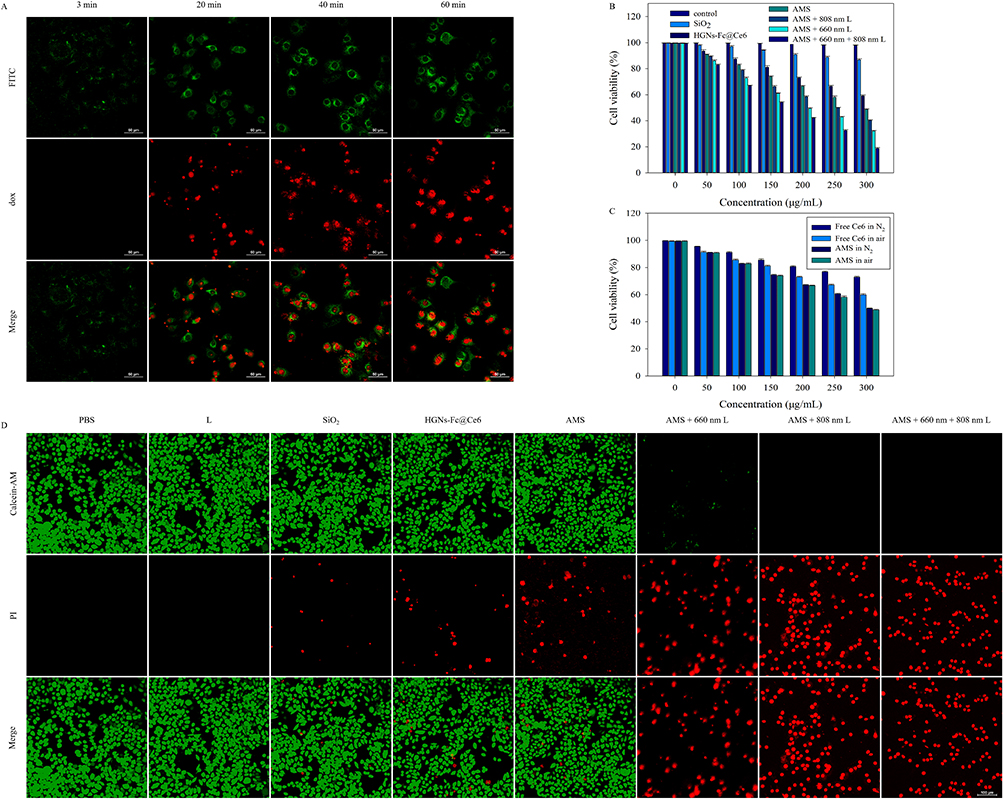 |
Figure 3 (A) CLSM images of released dox at different time that incubated with AMS solution (100 μg/mL). Scale bar: 50 μm. (B) Cells viability of HepG2 cells that incubated with different concentrations of material (SiO2, HGNs-Fc@Ce6, AMS) with 808 nm laser irradiation (1.6 W/cm2), 660 nm laser irradiation (0.2W/cm2) or both 808 nm and 660 nm laser irradiation. Scale bar: 100 μm. (C) Cells viability of HepG2 cells that incubated with different concentrations of free Ce6 and AMS in air and nitrogen. (D) Calcein-AM/PI dual staining images of HepG2 cells that incubated with different material (SiO2, HGNs-Fc@Ce6, AMS) with or without laser irradiation. Scale bar: 100 μm. |
Toxicity Assessment of AMS
The toxicity of AMS was assessed by using the MTT test. HepG2 cells that were treated with PBS or laser irradiation exhibited no cell damage, and the cells treated with SiO2 or HGNs-Fc@Ce6 exhibited mild toxicity. Compared with the AMS group, these cells exhibited varying degrees of toxicity (Figure 3B). The cell viability gradually decreased after treatment with increased concentrations of AMS with 808-nm laser irradiation, 660-nm laser irradiation, or 808- and 660-nm laser irradiation, and the cell viability at the concentration of 300 μg/mL reduced to 18% under the 660-nm and 808-nm laser irradiation, which was lower than that under the 660-nm laser irradiation (32%) or the 808-nm laser irradiation (40%). For comparison, 7702 cells were treated with the abovementioned nanomaterial under the same conditions, which exhibited relatively low toxicity (Figure S15, Supporting Information). The phototoxicity of AMS and Ce6 was found in air, while AMS exhibited an excellent photodynamic effect in an oxygen-deficient environment, which could be attributed to the O2 production from AMS by oxidizing the abundant H2O2 in the HepG2 cells (Figure 3C).
The calcein-AM and PI staining assays were used to assess the live/dead cells. As displayed in Figure 3D, green fluorescence was observed in group of PBS or laser irradiation, indicating no apoptosis. While green fluorescence doped with red fluorescence was found in the cells treated with SiO2, rGO-Fc@Ce6, or AMS. The red proportion of the fluorescence increased after treatment with increased concentrations of AMS upon the 808-nm laser irradiation, 660-nm laser irradiation, or 808-nm and 660-nm laser irradiation, which indicated that the photo-thermal and photodynamic effect of AMS induced cell membrane rupture, leading to tumor cell apoptosis. The results revealed that combining the photo-thermal and photodynamic treatments could significantly improve the anti-tumor effect.
Detection of ROS in vitro
DCFH-DA was oxidized into the green fluorescence of DCF by ROS, which could be used to detect cellular ROS. As displayed in Figure 4, almost no fluorescence was found in the control group, laser irradiation group, or only the SiO2 group, while green fluorescence was found in the HGNs-Fc@Ce6 group, which was attributed to the Fenton reaction between ferrocene and the H2O2 over-expressed in tumor cells. The group of AMS + 660 nm or AMS + 660 nm + 808 nm irradiation had brighter green fluorescence than the HGNs-Fc@Ce6 group and the AMS group, which could be attributed to the production of 1O2 from Ce6 and •OH from ferrocene. The results depicted that the AMS exhibited an excellent photodynamic effect for tumor treatment. However, under the hypoxia condition, only the HepG2 cell group that was treated with AMS under 660-nm laser irradiation emitted bright green fluorescence, which indicated that AMS could increase oxygenation to efficiently stimulate ROS. The produced •OH and 1O2 increase the ROS content of cells, and the enhanced ROS can produce more significant anti-tumor effect.
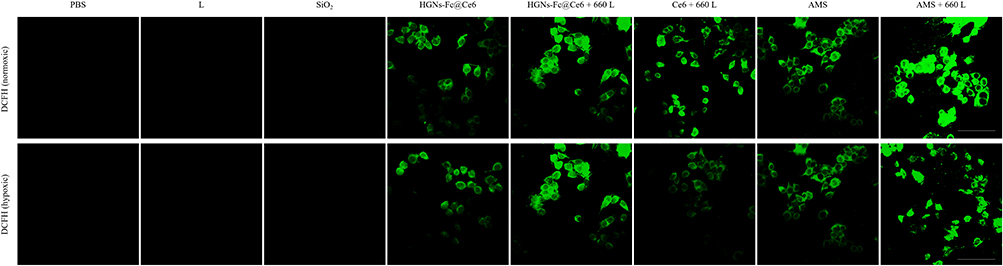 |
Figure 4 CLSM images of ROS generation that HepG2 cells incubated with different material (SiO2, HGNs-Fc@Ce6, AMS) with or without laser irradiation in normoxic and hypoxic condition. Scale bar: 100 μm. |
Apoptosis Assessment of AMS
A JC-1 fluorescent probe was used to evaluate cell apoptosis by measuring the changes in the mitochondrial membrane potential. As displayed in Figure 5, compared with the fluorescence emitted by the PBS or laser irradiation group, red fluorescence doped with green fluorescence was exhibited by the rGO-Fc@Ce6 or AMS group, which could be attributed to the generated highly toxic •OH that killed the tumor cells. The apoptotic ratio increased in the cells treated with AMS under the 808-nm laser irradiation, 660-nm laser irradiation, or 808-nm and 660-nm laser irradiation, respectively, which demonstrated that AMS had excellent PPT and PDT for the tumor cells. These results were consistent with the MMT assay and the live/dead cell staining assays. The apoptosis rates of cells treated with AMS under 808nm or 660nm irradiation were 37.36%, 32.65%, respectively, which were significantly higher than those of treated with PBS or laser alone. The apoptotic ratios that treated with AMS under 808nm and 660nm laser irradiation was the highest in all schemes, and value reached to 54.74%. The data showed that AMS exhibited good anti-tumor effects under laser irradiation via synergistic photo-thermal and photodynamic treatment (Figure S16, Supporting Information).
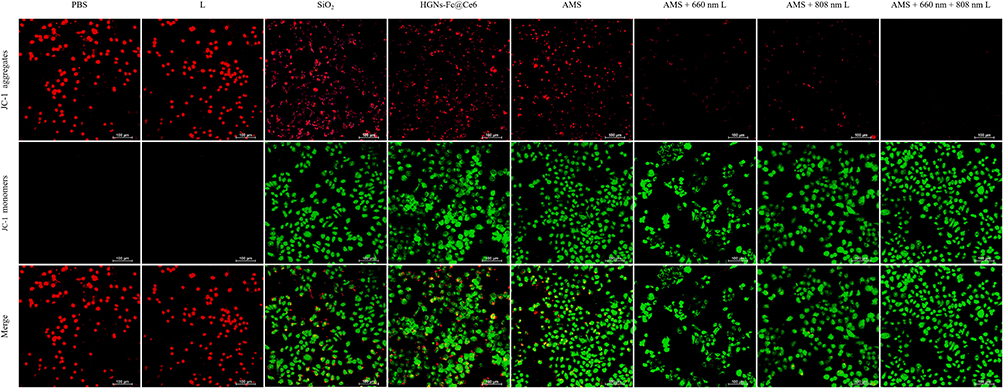 |
Figure 5 JC-1 of HepG2 cells that treated with PBS, laser irradiation, SiO2 (100 μg/mL), HGNs-Fc@Ce6 (100 μg/mL), AMS (100 μg/mL), AMS + 660 nm L (0.2 W/cm2), AMS + 808 nm L (1.6 W/cm2), AMS + 660 nm (0.2 W/cm2) + 808 nm L (1.6 W/cm2). Scale bar: 100 μm. |
In vivo Biocompatibility Assessment
To analyze the biosafety in vivo, the AMS solution (200 μg/mL) was injected into healthy mice via the tail vein, and the blood biochemical indexes were monitored 24 h after the injection. No significant difference was observed between the AMS group and the PBS group, and the values were maintained in the normal range, which implied that AMS did not have a negative effect at the given doses, also indicated that AMS could be safely used in tumor bearing mice (Figure 6A). The toxicity of the major organs (kidney, heart, spleen, liver, and lung) was analyzed via the H&E staining assay, indicating the rather limited damage to major organs treated with AMS or PBS (Figure 6B). Therefore, AMS had good bio-safety and seemed promising for subsequent tumor treatment.
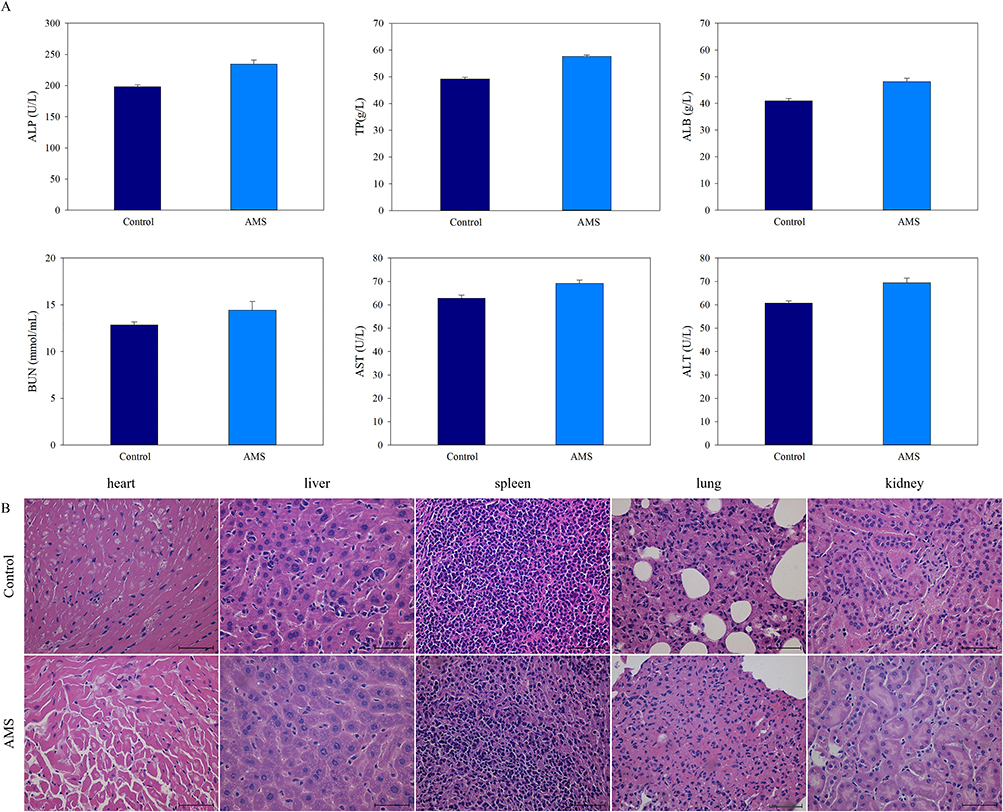 |
Figure 6 (A) Serum biochemistry assay of mice injected with or without AMS. (B) H&E of organs including heart, liver, spleen, lung, and kidney that after injection with AMS (100 μL, 100 μg/mL) solution for 24 h. |
In vivo Dual-Modal Imaging
To analyze the distribution in vivo, a cy5.5-labeled AMS solution (200 µL, 100 µg/mL) was intravenously injected into the mice. The fluorescence signal was recorded, and the background signal before the injection was subtracted. The fluorescent-labeled AMS was enriched in the tumor site with blood circulation after the injection, and the fluorescence signal of the tumor cells gradually enhanced. The signal value reached the maximum at 4 h and then gradually weakened. After 72 h, the fluorescence of the tumor site disappeared. The main organs and the tumor were stripped, and the fluorescence intensity was measured to analyze the distribution of AMS in vivo. These results indicated that AMS mainly enriched the tumor site, liver, and kidney. As the control, the labeled random sequence (RMS) barely enriched the tumor sites, and the fluorescent signal remained mainly in the organs of the mice (Figure 7A). MRI imaging was carried out in the HepG2 tumor-bearing mice, and the T2 signal was found in the tumor cells treated with AMS, indicating the good MRI capability of AMS (Figure 7B). The data showed that dual-modal imaging could guide and achieve visual monitoring of tumors. In addition, the photo-thermal imaging of tumor bearing mice was shown in Figure S17. Compared with the control group, the temperature of the mice that treated with AMS reached to 56°C, indicating that AMS had a good photo-thermal performance for photo-thermal therapy.
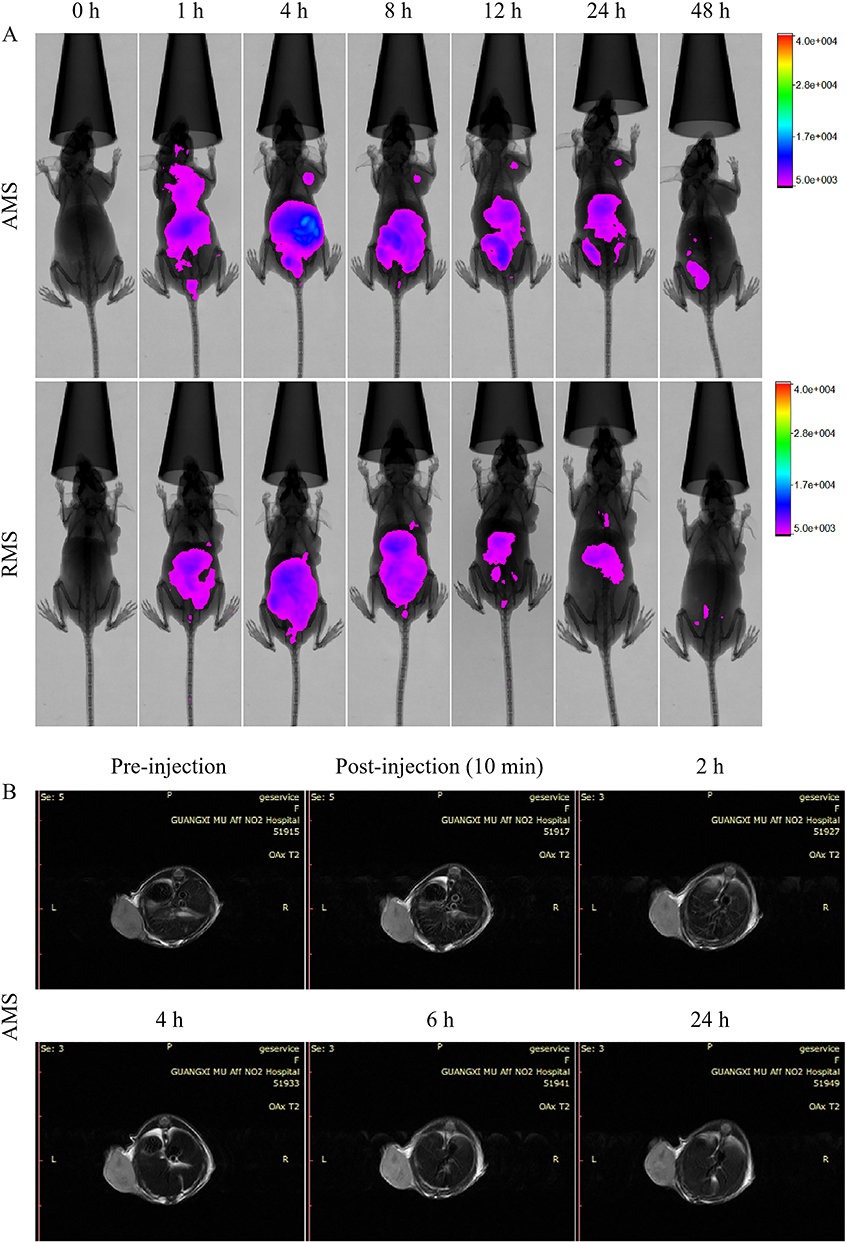 |
Figure 7 (A) In vivo fluorescence imaging of mice that intravenous injection of AMS or RMS. (B) MRI imaging of mice after intravenous (i.v.) injection of 100 μL AMS (100 μg/mL). |
In vivo Anti-Tumor Assays
The HepG2 tumor-bearing mice were randomly divided into six groups (N = 6): (1) control group (PBS injection), (2) L group (660 nm + 808 nm laser irradiation), (3) AMS, (4) AMS + 660 nm L, (5) AMS + 808 nm L, (6) AMS + 660 nm + 808 nm L. The mice were injected with AMS (100 μL, 200 μg/mL) and irradiated with the 808-nm laser (1.6 W cm−2, 5 min), 660-nm laser (0.2 W cm−2, 5 min), or the 808-nm (1.6 W cm−2, 5 min) and 660-nm (0.2 W cm−2, 5 min) laser 4 h after the injection. The tumor sizes and body weights of the mice were recorded every two days. The mice were tail vein injected with AMS and irradiated with the laser 4 h after the injection. The figure of treatment schematic diagram was shown in the Figure 8A. The excised tumor photographs and the relative tumor volume after the different treatments are displayed in Figures 8B and C; the tumor volume in the PBS group or the L group continued to increase, which signified that there was no inhibitory effect on the tumor growth. While the AMS group demonstrated a slower tumor growth, which could be attributed to the generated •OH of the Fenton effect. Compared with that in the AMS group, the tumor suppressive effect was more pronounced in the groups of AMS + 660 nm L and AMS + 808 nm L, which could be attributed to the O2 production ability of AMS for enhanced photodynamic therapy and the photo-thermal effect of GO and PDA. The tumor suppression rate reached the maximum in the group of AMS + 660 nm + 808 nm L, the generated •OH and 1O2 enhance the ROS content and had a ROS killing effect on tumor cells. Simultaneously, the generation of dissolved oxygen could improve the hypoxic environment of tumor cells, increased the catalytic activity of glucose oxidase, and enhance the efficacy of doxorubicin in the tumor site. In addition, the increased O2 content could enhance the photodynamic effect for the tumor treatment. The data indicated the significant combined photo-thermal therapy and photodynamic therapy effect of AMS in vivo. Moreover, the weight of the mice between the groups had little significant difference during the treatment period (Figure 8D). Compared with the PBS or L groups, the H&E and Ki-67 staining showed the most severe damage to the cells treated in the AMS + 660 nm + 808 nm L group (Figure 8E and F). In addition, because of the excellent CAT-like and POD-like catalytic capability of AMS, the produced O2 was prospected to ameliorate the hypoxic nature of tumors. The probe of HIF-1α was used to assess the hypoxia improvement in tumors after treatment with AMS. The weak green fluorescence (antipimonidazole antibody) was observed when the tumor was treated with AMS in the presence or absence of laser irradiation, demonstrating that the hypoxia environment had been improved and was conducive to reducing the PDT resistance (Figure 8G), which can produce higher anti-tumor effects than that with PDT alone in previous study.
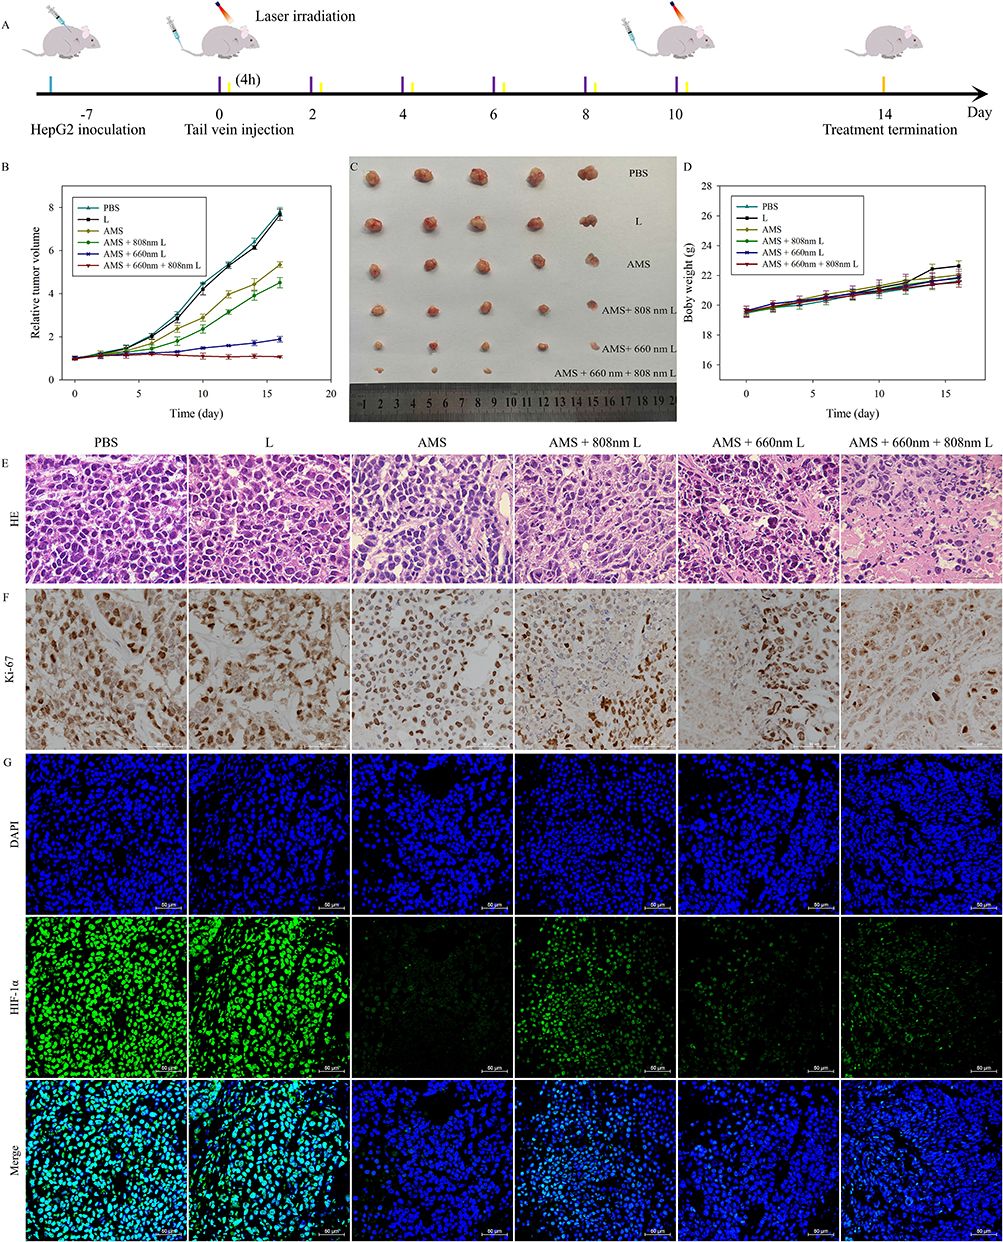 |
Figure 8 (A) Scheme of in vivo antitumor efficacy of AMS. (B) Relative tumor volume of mice after various treatments as indicated. (C) Photographs of the tumor dissection. (D) Body weight variation with various treatment. (E–G) H&E, Ki-67 and HIF-1α staining of tumor tissue from various treatment. Scale bar: 50 μm. |
Conclusions
We constructed a mesoporous silica-based nanoplatform for the combination therapy of tumors, which consisted of HGNs-Fc, MnO2, and AS1411-aptamer. In the nanomaterial, HGNs-Fc possessed excellent catalase-like activity, catalyzing H2O2 to generate highly toxic free radicals to kill the tumor cells. The loaded Ce6 on HGNs-Fc could be efficiently released into tumors for enhanced PDT. Under the laser irradiation, the prepared AMS exhibited efficient photo-thermal and photodynamic effects. Moreover, glucose was catalyzed to produce H2O2 and gluconic acid by the GOD-mediated reaction in the tumor microenvironment, and the generated H2O2 was decomposed to produce O2. The increased oxygen content could improve the hypoxic environment of the tumor and effectively reduce the resistance to PDT. Compared with the control group, the tumor volume in group that treated with AMS under 808nm and 660nm laser irradiation decreased approximately 80%. The immunohistochemical image of Ki-67 showed that the proliferation rate of tumor cells treated with AMS under 808nm and 660nm laser irradiation was significantly lower than that of the PBS or laser alone group. The immunofluorescence image of HIF-1α showed that the fluorescence intensity of control group was 60% of that AMS + 660 nm + 808 nm laser group, indicating that AMS could improve the content of dissolved oxygen in tumor microenvironment and ameliorate the therapeutic effect of PDT. The data demonstrated that AMS could enrich at the tumor sites and could be combined with photo-thermal and photodynamic therapy to inhibit tumor cell growth.
Supplementary Materials
Supplementary material of this article can be found in the online.
Acknowledgments
This work was supported by the Fund of the Natural Science Foundation of Guangxi (Grant Number 2022GXNSFAA035459 and 2021GXNSFBA196017), the High-level Medical Expert Training Program of Guangxi “139” Plan Funding (G201903027) and the R&D project of Guangxi Zhuang Autonomous Region Key Trauma Surgery (Grant Number GKTS2022).
Disclosure
The authors declare no competing interests in this work.
References
1. Srinivas US, Tan BWQ, Vellayappan BA, Jeyasekharan AD. ROS and the DNA damage response in cancer. Redox Biol. 2019;25:101084–101093. doi:10.1016/j.redox.2018.101084
2. Curtin NJ. DNA repair dysregulation from cancer driver to therapeutic target. Nat Rev Cancer. 2012;12(12):801–817. doi:10.1038/nrc3399
3. Kennel KB, Greten FR. Immune cell - produced ROS and their impact on tumor growth and metastasis. Redox Biol. 2021;42:101891–101899. doi:10.1016/j.redox.2021.101891
4. Sies H, Jones DP. Reactive oxygen species (ROS) as pleiotropic physiological signalling agents. Nat Rev Mol Cell Biol. 2020;21(7):363–383. doi:10.1038/s41580-020-0230-3
5. Hayes JD, Dinkova-Kostova AT, Tew KD. Oxidative stress in cancer. Cancer Cell. 2020;38(2):167–197. doi:10.1016/j.ccell.2020.06.001
6. Gorrini C, Harris IS, Mak TW. Modulation of oxidative stress as an anticancer strategy. Nat Rev Drug Discov. 2013;12(12):931–947. doi:10.1038/nrd4002
7. Ming L, Cheng K, Chen Y, Yang R, Chen D. Enhancement of tumor lethality of ROS in photodynamic therapy. Cancer Med. 2021;10(1):257–268. doi:10.1002/cam4.3592
8. Yu Z, Sun Q, Pan W, Li N, Tang B. A near-infrared triggered nanophotosensitizer inducing domino effect on mitochondrial reactive oxygen species burst for cancer therapy. ACS Nano. 2015;9(11):11064–11074. doi:10.1021/acsnano.5b04501
9. Fan H, Yan G, Zhao Z, et al. A smart photosensitizer-manganese dioxide nanosystem for enhanced photodynamic therapy by reducing glutathione levels in cancer cells. Angew Chem Int Ed Engl. 2016;55(18):5477–5482. doi:10.1002/anie.201510748
10. Li W, Yang J, Luo L, et al. Targeting photodynamic and photothermal therapy to the endoplasmic reticulum enhances immunogenic cancer cell death. Nat Commun. 2019;10(1):3349–3365. doi:10.1038/s41467-019-11269-8
11. Li X, Kwon N, Guo T, Liu Z, Yoon J. Innovative strategies for hypoxic-tumor photodynamic therapy. Angew Chem Int Ed Engl. 2018;57(36):11522–11531. doi:10.1002/anie.201805138
12. Zhang Y, Liao Y, Tang Q, Lin J, Huang P. Biomimetic nanoemulsion for synergistic photodynamic-immunotherapy against hypoxic breast tumor. Angew Chem Int Ed Engl. 2021;60(19):10647–10653. doi:10.1002/anie.202015590
13. Zhao M, Yang X, Fu H, et al. Immune/hypoxic tumor microenvironment regulation-enhanced photodynamic treatment realized by pH-responsive phase transition-targeting nanobubbles. ACS Appl Mater Interfaces. 2021;13(28):32763–32779. doi:10.1021/acsami.1c07323
14. Fan G-L, Deng F-A, Zhou X, et al. Plasma membrane targeted photodynamic O2 economizer for hypoxic tumor therapy. Biomaterials. 2021;273:120854–120865. doi:10.1016/j.biomaterials.2021.120854
15. Zhou Q, Mohammed F, Wang Y, et al. Hypoxia-responsive block copolymer polyprodrugs for complementary photodynamic-chemotherapy. J Control Release. 2021;339:130–142. doi:10.1016/j.jconrel.2021.09.023
16. Li Y, Jeon J, Park JH. Hypoxia-responsive nanoparticles for tumor-targeted drug delivery. Cancer Lett. 2020;490:31–43. doi:10.1016/j.canlet.2020.05.032
17. Yang Z, Chen Q, Chen J, et al. Tumor-pH-responsive dissociable albumin-tamoxifen nanocomplexes enabling efficient tumor penetration and hypoxia relief for enhanced cancer photodynamic therapy. Small. 2018;14(49):1803262–1803272. doi:10.1002/smll.201803262
18. Yin T, Chu X, Cheng J, Liang J, Zhou J, Huo M. Hypoxia-sensitive zwitterionic vehicle for tumor-specific drug delivery through antifouling-based stable biotransport alongside PDT-sensitized controlled release. Biomacromolecules. 2021;22(5):2233–2247. doi:10.1021/acs.biomac.1c00301
19. Wang XQ, Wang W, Peng M, Zhang XZ. Free radicals for cancer theranostics. Biomaterials. 2021;266:120474–120489. doi:10.1016/j.biomaterials.2020.120474
20. Cai X, Zhao Y, Wang L, et al. Synthesis of Au@MOF core-shell hybrids for enhanced photodynamic/photothermal therapy. J Mater Chem B. 2021;9(33):6646–6657. doi:10.1039/D1TB00800E
21. Wang M, Chang M, Chen Q, et al. Au2Pt-PEG-Ce6 nanoformulation with dual nanozyme activities for synergistic chemodynamic therapy / phototherapy. Biomaterials. 2020;252:120093–120105. doi:10.1016/j.biomaterials.2020.120093
22. Yang G, Xu L, Chao Y, et al. Hollow MnO2 as a tumor-microenvironment-responsive biodegradable nano-platform for combination therapy favoring antitumor immune responses. Nat Commun. 2017;8(1):902–915. doi:10.1038/s41467-017-01050-0
23. Yan S, Zeng X, Tang Y, Liu BF, Wang Y, Liu X. Activating antitumor immunity and antimetastatic effect through polydopamine-encapsulated core-shell upconversion nanoparticles. Adv Mater. 2019;31(46):1905825–1905833. doi:10.1002/adma.201905825
24. Hou X, Tao Y, Pang Y, Li X, Jiang G, Liu Y. Nanoparticle-based photothermal and photodynamic immunotherapy for tumor treatment. Int J Cancer. 2018;143(12):3050–3060. doi:10.1002/ijc.31717
25. Yang J, Hou M, Sun W, et al. Sequential PDT and PTT using dual-modal single-walled carbon nanohorns synergistically promote systemic immune responses against tumor metastasis and relapse. Adv Sci. 2020;7(16):2001088–2001103. doi:10.1002/advs.202001088
26. Jung E, Lee J, Lee Y, et al. Tumor-targeting H2O2-responsive photosensitizing nanoparticles with antiangiogenic and immunogenic activities for maximizing anticancer efficacy of phototherapy. ACS Appl Bio Mater. 2021;4(5):4450–4461. doi:10.1021/acsabm.1c00210
27. Wu F, Zhang Q, Sun B, et al. MoO3-x nanosheets-based platform for single NIR laser induced efficient PDT/PTT of cancer. J Control Release. 2021;338:46–55. doi:10.1016/j.jconrel.2021.08.022
28. Luo Z, Tian H, Liu L, et al. Tumor-targeted hybrid protein oxygen carrier to simultaneously enhance hypoxia-dampened chemotherapy and photodynamic therapy at a single dose. Theranostics. 2018;8(13):3584–3596. doi:10.7150/thno.25409
29. Fu J, Li T, Yang Y, et al. Activatable nanomedicine for overcoming hypoxia-induced resistance to chemotherapy and inhibiting tumor growth by inducing collaborative apoptosis and ferroptosis in solid tumors. Biomaterials. 2021;268:120537–120550. doi:10.1016/j.biomaterials.2020.120537
30. Shabana AM, Mondal UK, Alam MR, et al. pH-sensitive multiligand gold nanoplatform targeting carbonic anhydrase IX enhances the delivery of doxorubicin to hypoxic tumor spheroids and overcomes the hypoxia-induced chemoresistance. ACS Appl Mater Interfaces. 2018;10(21):17792–17808. doi:10.1021/acsami.8b05607
31. Liu H, Xie Y, Zhang Y, et al. Development of a hypoxia-triggered and hypoxic radiosensitized liposome as a doxorubicin carrier to promote synergetic chemo-/radio-therapy for glioma. Biomaterials. 2017;121:130–143. doi:10.1016/j.biomaterials.2017.01.001
32. Zhang Z, Yang J, Min Q, et al. Holo-lactoferrin modified liposome for relieving tumor hypoxia and enhancing radiochemotherapy of cancer. Small. 2019;15(6):1803703–1803712. doi:10.1002/smll.201803703
33. Wang Q, Shaik F, Lu XX, et al. Amorphous NiB@IrOx nanozymes trigger effiffifficient apoptosis-ferroptosis hybrid therapy. Acta Biomaterialia. 2023;155:575–587. doi:10.1016/j.actbio.2022.10.048
34. Xu YQ, Fei JB, Li GL, Yuan TT, Xu X, Li J. Nanozyme-catalyzed cascade reactions for mitochondria mimicking oxidative phosphorylation. Angew Chem Int Ed. 2019;58(17):5572–5576. doi:10.1002/anie.201813771
35. Liu SW, Han S, Song YZ, Sun RN, Zhao L, Yan C. Disulfide-bridged dendritic organosilicas-based biodegradable molecularly imprinted polymers for multiple targeting and pH/redox-responsive drug release toward chemical/photodynamic synergistic tumor therapy. Adv Healthcare Mater. 2023;e2300184. doi:10.1002/adhm.202300184
36. Zhang C, Huang J, Guo XS, et al. NIR light-driven photocatalytic NAD(P)H oxidation and H2O2 generation in situ for enhanced chemodynamic therapy and immune response. Nano Today. 2023;50:101824–101837. doi:10.1016/j.nantod.2023.101824
37. Bai Z, Li G, Liang J, et al. Non-enzymatic electrochemical biosensor based on Pt NPs/RGO-CS-Fc nano-hybrids for the detection of hydrogen peroxide in living cells. Biosens Bioelectron. 2016;82:185–194. doi:10.1016/j.bios.2016.04.004
38. Wang WD, Chen C, Ying Y, et al. Smart PdH@MnO2 yolk-shell nanostructures for spatiotemporally synchronous targeted hydrogen delivery and oxygen-elevated phototherapy of melanoma. ACS Nano. 2022;16(4):5597–5614. doi:10.1021/acsnano.1c10450
39. Cai ZH, Fu YQ, Qiu ZL, et al. Multitarget reaction programmable automatic diagnosis and treatment logic device. ACS Nano. 2021;15(12):19150–19164. doi:10.1021/acsnano.1c07307
40. Bu YY, Huang RQ, Li Z, et al. Anisotropic truncated octahedral Au with Pt deposition on arris for localized surface plasmon resonance-enhanced photothermal and photodynamic therapy of osteosarcoma. ACS Appl Mater Interfaces. 2021;13(30):35328–35341. doi:10.1021/acsami.1c07181
 © 2023 The Author(s). This work is published and licensed by Dove Medical Press Limited. The full terms of this license are available at https://www.dovepress.com/terms.php and incorporate the Creative Commons Attribution - Non Commercial (unported, v3.0) License.
By accessing the work you hereby accept the Terms. Non-commercial uses of the work are permitted without any further permission from Dove Medical Press Limited, provided the work is properly attributed. For permission for commercial use of this work, please see paragraphs 4.2 and 5 of our Terms.
© 2023 The Author(s). This work is published and licensed by Dove Medical Press Limited. The full terms of this license are available at https://www.dovepress.com/terms.php and incorporate the Creative Commons Attribution - Non Commercial (unported, v3.0) License.
By accessing the work you hereby accept the Terms. Non-commercial uses of the work are permitted without any further permission from Dove Medical Press Limited, provided the work is properly attributed. For permission for commercial use of this work, please see paragraphs 4.2 and 5 of our Terms.