Back to Journals » Drug Design, Development and Therapy » Volume 20
Population Pharmacokinetics and Dosing Regimen Optimization of Piperacillin in Critically Ill Patients
Authors Dong Z, Shi H, Yang Y, Yi Q, Jiang Z, Li Y
Received 3 July 2025
Accepted for publication 23 December 2025
Published 13 January 2026 Volume 2026:20 551307
DOI https://doi.org/10.2147/DDDT.S551307
Checked for plagiarism Yes
Review by Single anonymous peer review
Peer reviewer comments 2
Editor who approved publication: Dr Leonidas Panos
Zhonghua Dong,1 Haiyan Shi,1 Yilei Yang,1 Qiaoyan Yi,1 Zhiming Jiang,2 Yan Li1
1Department of Clinical Pharmacy, The First Affiliated Hospital of Shandong First Medical University & Shandong Provincial Qianfoshan Hospital, Jinan, People’s Republic of China; 2Department of Critical Care Medicine, The First Affiliated Hospital of Shandong First Medical University & Shandong Provincial Qianfoshan Hospital, Shandong Institute of Anesthesia and Respiratory Critical Medicine, Jinan, People’s Republic of China
Correspondence: Zhiming Jiang, Department of Critical Care Medicine, The First Affiliated Hospital of Shandong First Medical University & Shandong Provincial Qianfoshan Hospital, Shandong Institute of Anesthesia and Respiratory Critical Medicine, 16766 Jingshi Road, Jinan, 250014, People’s Republic of China, Email [email protected] Yan Li, Department of Clinical Pharmacy, The First Affiliated Hospital of Shandong First Medical University & Shandong Provincial Qianfoshan Hospital, 16766 Jingshi Road, Jinan, 250014, People’s Republic of China, Email [email protected]
Purpose: Critically ill patients exhibit significant pharmacokinetic alterations, necessitating population pharmacokinetic (PPK) modeling of piperacillin to optimize dosing regimens. This study aimed to develop a PPK model for piperacillin in critically ill patients from China and optimize dosing regimens based on model predictions.
Patients and Methods: A nonlinear mixed-effects modeling approach was applied to characterize piperacillin pharmacokinetics. Covariate analysis identified significant predictors of CL and V. Monte Carlo simulations assessed dosing regimens against pharmacodynamic targets.
Results: The final model estimated population typical CL and V as 6.48 L/h and 19 L, respectively. Estimated glomerular filtration rate and body weight significantly influenced CL, while plasma albumin affected V. Simulations revealed that continuous intravenous infusion achieved higher probability of target attainment (PTA) than intermittent dosing, particularly for pathogens with elevated MICs. Obesity and augmented renal clearance reduced PTA, necessitating dose escalation or more frequent administration.
Conclusion: This study highlights the interplay between host pathophysiology, pathogen susceptibility, and drug exposure. Guided by the PPK model and susceptibility testing, tailored dosing strategies are crucial for optimizing therapeutic outcomes in critical populations.
Keywords: piperacillin, population pharmacokinetic, critically ill patient, antimicrobial
Introduction
Piperacillin is a broad-spectrum β-lactam antibiotic with antibacterial activity against a wide range of Gram-positive and Gram-negative aerobic and anaerobic bacteria. It is extensively used for empirical treatment of severe infections, particularly among patients in intensive care units (ICUs).1,2 As a time-dependent antibiotic, the efficacy of piperacillin is correlated with the duration for which the plasma drug concentration exceeds the minimum inhibitory concentration (MIC). The proportion of time that the free drug concentration remains above the MIC (fT>MIC) is a key determinant of therapeutic success.3 In clinical practice, achieving optimal drug exposure is crucial for maximizing therapeutic efficacy and minimizing the risk of resistance development.4 For β-lactam antimicrobials, a magnitude of 40%–70% fT>MIC is required for bactericidal effect.5,6 Studies have shown that, in critically ill patients, achieving 100% fT>MIC is associated with improved clinical outcomes.7 A research group recommended a more aggressive target of 100%ƒT>4–8×MIC to maximise bacterial killing.8
Optimising antibiotic exposure in the critically ill is complicated by a constellation of simultaneous, and often opposing, pathophysiological changes.9,10 First, for hydrophilic antibiotics like piperacillin, which is predominantly renally eliminated, these alterations are primarily driven by extreme fluctuations in renal function, encompassing both augmented renal clearance (ARC), which can increase drug clearance by 2 to 8 times and elevate the risk of subtherapeutic exposure, and acute kidney injury (AKI) can lead to drug accumulation and potential toxicity.11,12 Second, hypo-albuminaemia further enlarges the unbound fraction and effectively raises clearance of the pharmacologically active moiety.13 Third, systemic inflammatory response syndrome, triggered by infectious or non-infectious factors, is common among ICU patients, resulting in excessive extravasation of fluid from the damaged endothelium and capillaries into the interstitial space.14 This increase in interstitial volume can lead to a substantial expansion of the volume of distribution of piperacillin. Finally, although body size provides a physiological basis for standardizing dosing across a population, body-composition changes (fluid overload, sarcopenia) make weight-based dosing unreliable.15,16 These factors collectively lead to significant differences in the concentration of piperacillin after standard fixed dosing, underscoring the need for population pharmacokinetic (PPK) models and individualised dosing algorithms in this population.
PPK models are powerful tools for characterizing the variability in drug disposition and identifying covariates that influence pharmacokinetic parameters in critically ill patients. By integrating demographic, clinical, and physiological data, PPK models can be used to tailor dosing regimens to the individual needs of ICU patients. PPK models based on data from critically ill patients in various countries, including France, Spain, South Korea, and Australia, have been developed.17–20 However, differences in patient characteristics across regions can limit the extrapolation performance of these models.21,22 Therefore, it is necessary to establish more region-specific PPK models for piperacillin in critically ill patients to optimize individualized dosing regimens for local ICU patients.
In this study, we developed a PPK model for piperacillin in critically ill patients from the East China region and optimized dosing regimens based on model predictions. We focused on identifying the key covariates influencing the pharmacokinetics of piperacillin and evaluating the feasibility of various dosing strategies to achieve pharmacodynamic targets. Our aim was to provide evidence-based recommendations for clinical practice to ensure that critically ill patients receive effective and safe antibiotic therapy.
Material and Methods
Study Design and Population
This prospective observational PK/PD study was conducted in the intensive care unit of the First Affiliated Hospital of Shandong First Medical University (Shandong Provincial Qianfoshan Hospital) from September 2021 to January 2022. The study protocol was approved by the Ethics Committee of the First Affiliated Hospital of Shandong First Medical University (Shandong Provincial Qianfoshan Hospital) (YXLL-KY-2021(050)). The inclusion criteria for this study were (i) admitted to ICU, (ii) treatment with piperacillin, (iii) written informed consent obtained from the patient or legal surrogate. The exclusion criteria were (i) continuous renal-replacement therapy (CRRT), (ii) concurrent participation in another clinical trial involving systemic investigational medicinal products, (iii) pregnancy. The entire study protocol was carried out in compliance with the ethical principles of the Declaration of Helsinki.
Patient demographic information, piperacillin medication data, and laboratory test results were collected from the hospital information system. These included age, sex, height, total body weight, APACHE II score, date, administration time, dose, frequency of administration, type of infection, type of pathogen, alanine aminotransferase, aspartate aminotransferase, gamma-glutamyl transferase, alkaline phosphatase, total bilirubin, direct bilirubin, blood urea nitrogen (BUN), albumin, creatinine, Cystatin C.
Sample Collection
Blood samples were collected after at least five piperacillin doses (ie, at steady state). 2~3 samples per patient were drawn: 30 min before the next infusion (trough), at the end of the infusion (peak), and at any intermediate time-point within the same dosing interval (mid-interval, optional). The blood samples were centrifuged at 4000 rpm for 10 minutes at 4 °C to separate the plasma. Plasma samples was analysed immediately or stored at 4 °C and assayed within 24 h. The plasma concentration of piperacillin was determined by high-performance liquid chromatography (LC-2030C, Tokyo, Japan) equipped with ultraviolet detector (LC-2030C, Tokyo, Japan). Chromatographic separation was performed using an InertSustain C18 column (4.6 × 250 mm, 5µm, GL Sciences, Tokyo, Japan) with a column temperature of 35 °C and a detection wavelength of 218 nm. Mobile phase A was a KH2PO4 solution with a pH of 3.3, and mobile phase B was acetonitrile. A gradient elution program was used: 0–15 minutes, 96% A; 15–25 minutes, 69% A. The flow rate was 1.0 mL/min. The linear range of piperacillin was 1.25–400 mg/L. The determination method was fully validated, and the calibration curve, selectivity, carryover, accuracy, precision, and stability all met the requirements of FDA.23 The methodological validation results of the quantitative analysis method can be found in the Supplementary Materials.
Population Pharmacokinetic Model Development
Potential concentration outliers were identified from the base structural model by conditional weighted residuals (CWRES). Any individual data point whose |CWRES| exceeded 6 was flagged, manually verified against the original analytical worksheet and chromatogram, and re-sampled when a clear analytical or documentation error was suspected. Below-quantification-limit (BQL) samples were retained and set to ½× lower limit of quantification (LLOQ).
Population pharmacokinetic analysis was conducted using a nonlinear mixed-effects model (NONMEM version 7.4; ICON Development Solutions, Ellicott, MD, USA), Pirana (version 2.9.7), and R (version 3.6.0).
One- and two-compartment models were compared to determine the optimal structural model. Inter-individual variability (IIV) in pharmacokinetic parameters was estimated using an exponential model. Residual variability (RSV) was estimated using exponential, proportional, additive, and combined models. Model selection was based on the objective function value (OFV) and goodness-of-fit (GOF) plots. A decrease in OFV (∆OFV) of greater than 3.84 between two nested models was considered statistically significant for model improvement (p < 0.05).
Covariate models were developed using forward inclusion and backward elimination methods. Covariates evaluated included sex, age, total body weight, body mass index (BMI), APACHE II score, albumin, total bilirubin, direct bilirubin, creatinine, Cystatin C, BUN, estimated glomerular filtration rate (eGFR) based on different equations and ARC defined as eGFR > 130 mL/min/1.73 m2 (mL/min).24 During forward inclusion, covariates were added to the model if the OFV was significantly lower than that of the base model (reduction > 3.84, p < 0.05). All statistically significant covariates were included in the full model. Subsequently, backward elimination was performed, with each covariate independently removed from the full model. Only covariates that resulted in an OFV increase greater than 6.635 (p < 0.01) were retained in the final model.
The principle of statistical independence at the subject level was rigorously upheld in this study. Each enrolled critically ill patient constituted a single, independent observational unit. The repeated piperacillin concentration measurements within each patient were explicitly accounted for by using a NONMEM framework. This approach inherently partitions the total variability into inter-individual variability and intra-individual variability, thereby correctly handling the hierarchical data structure and ensuring valid statistical inference.
Validation of the Final Model
The final model was validated using diagnostic scatter plots, bootstrapping, normalized prediction distribution errors (NPDE), and prediction-corrected visual predictive checks (pc-VPC). Diagnostic scatter plots included the following: observed values (DV) versus population predicted concentrations (PRED), DV versus individual predicted concentrations (IPRED), CWRES versus PRED, and CWRES versus time. NPDE were evaluated using R software (version 3.6.0) by generating quantile-quantile (Q-Q) plots of NPDEs, histograms of NPDEs, scatter plots of NPDEs versus time, and scatter plots of NPDEs versus PRED. Bootstrapping was performed with 1000 resamples, and the estimated parameters from the bootstrap process were compared with those from the original dataset. Pc-VPC were generated by simulating datasets and calculating the 5th, 50th, and 95th percentiles of the simulated concentrations with their 95% confidence intervals (CIs). These were then compared with the observed concentrations to assess the predictive performance of the model.
Dose Simulation
Based on the parameters of the final model, Monte Carlo simulations were performed to generate simulated datasets consistent with the characteristics of the original dataset (100 simulations). These simulations were used to predict the steady-state concentrations of piperacillin under various dosing regimens. The simulated dosing regimens included combinations of different daily doses (8 g, 12 g, 16 g, 20 g, and 24 g) and dosing frequencies (continuous infusion, q4h, q6h, q8h, and q12h). For the intermittent regimens (q4 h, q6 h, q8 h and q12 h), the infusion time was set to 30 min.
According to the CLSI M100 Performance Standards for Antimicrobial Susceptibility Testing, the MICs of piperacillin were defined as follows: 1 mg/L for Haemophilus influenzae and Haemophilus parainfluenzae, 8 mg/L for Enterobacterales (excluding Salmonella/Shigella), and 16 mg/L for Pseudomonas aeruginosa, Acinetobacter spp., non-Enterobacterales, and anaerobes. These MIC values were used as target concentrations. The probability of target attainment (PTA) was calculated for different dosing regimens to achieve 50% fT>MIC (free piperacillin concentration maintained above the MIC for at least half of the dosing interval), 100% fT>MIC (free piperacillin concentration maintained above the MIC for the entire dosing interval), and 100% fT>4×MIC (free piperacillin concentration maintained above four times the MIC for the entire dosing interval). The PTA for specific MIC value was calculated as the proportion of the virtual patients in whom the target was attained. A PTA of ≥90% was considered optimal. The unbound fraction of piperacillin was assumed to be 70%.25
Results
Patient Characteristics
This study is a single-center investigation that enrolled 117 plasma drug concentration data from 42 subjects. The proportion of data below the lower limit of quantification (BQL) following the first administration was 2.56%, calculated as half of the lower limit of quantification. The demographic characteristics and biochemical parameters of the patients are detailed in Tables 1 and 2. The concentration range of piperacillin in plasma samples was from 1.25–376.34 mg/L. The concentration-time profile is depicted in Figure 1.
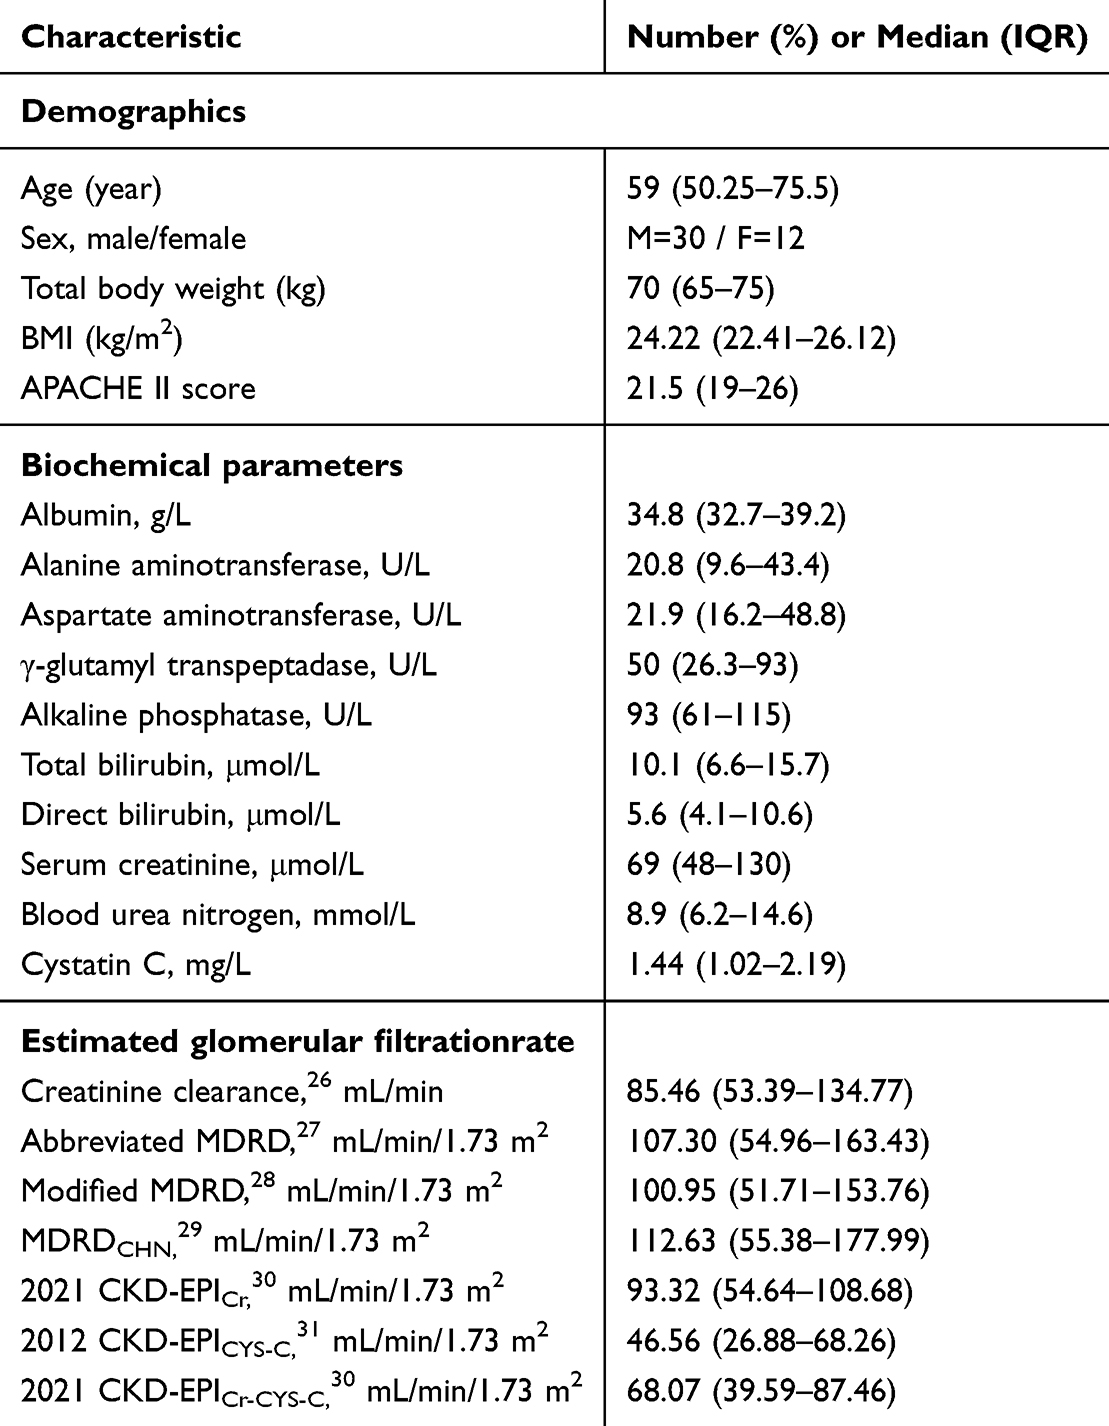 |
Table 1 Demographic Characteristics and Biochemical Parameters of the Patients (n=42) |
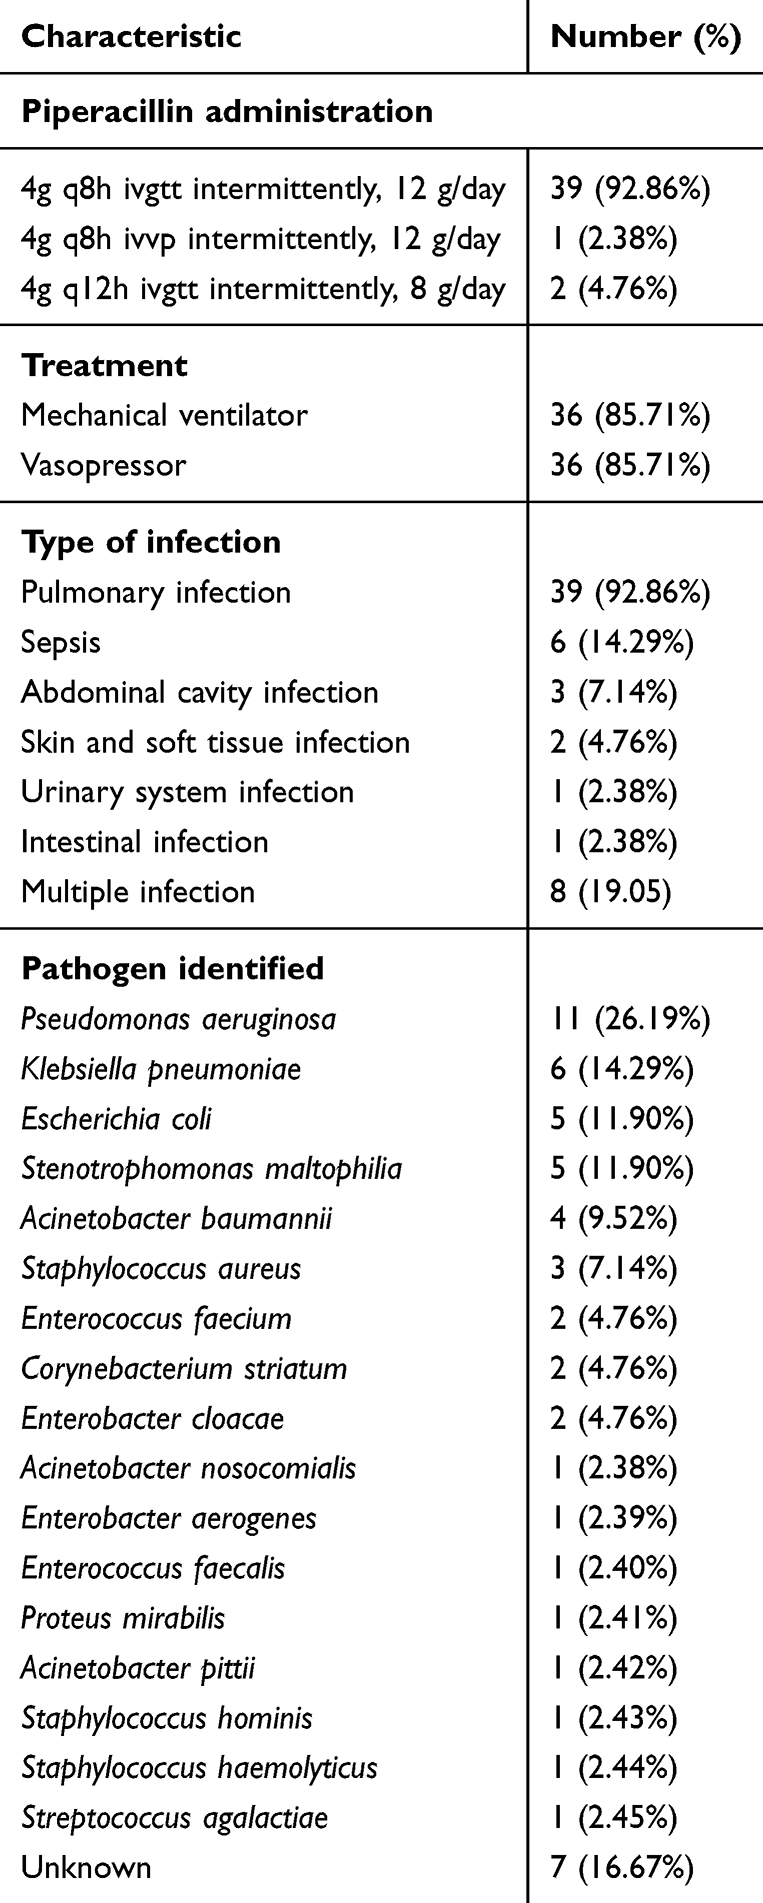 |
Table 2 Treatment Regimens and Infection Types of the Study Population |
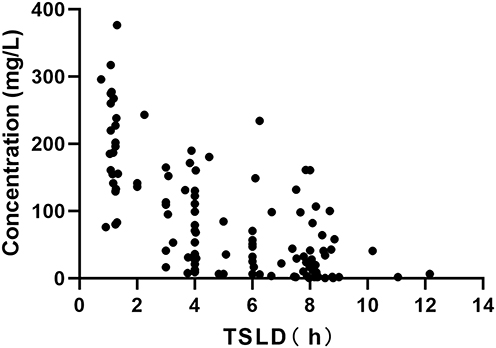 |
Figure 1 Piperacillin concentration versus time after last dose. |
Population Pharmacokinetics Model Development
The pharmacokinetic characteristics of piperacillin can be well explained by a one-compartment model with first-order elimination. Interindividual variability of CL and V can be well fitted by an exponential model, and residual variability were best described by a combined model.
A covariate model was established using forward inclusion and backward elimination. The covariates that were ultimately retained were eGFR (based on CKD-EPIcys), total body weight, and albumin, with eGFR and total body weight being significant covariates for CL, and albumin being a significant covariate for V. The equations for the final model are presented as follows. The typical values for CL and V are 6.48 L/h and 19 L, respectively. The population parameter estimates of the final model are presented in Table 3. Bootstrap results formally confirmed the robustness of the model, with all of 1000 bootstrap replications being successful. The estimated values for each parameter in the final model fall within the 5% to 95% confidence intervals of the bootstrap parameters and are close to the median values of the bootstrap parameters.


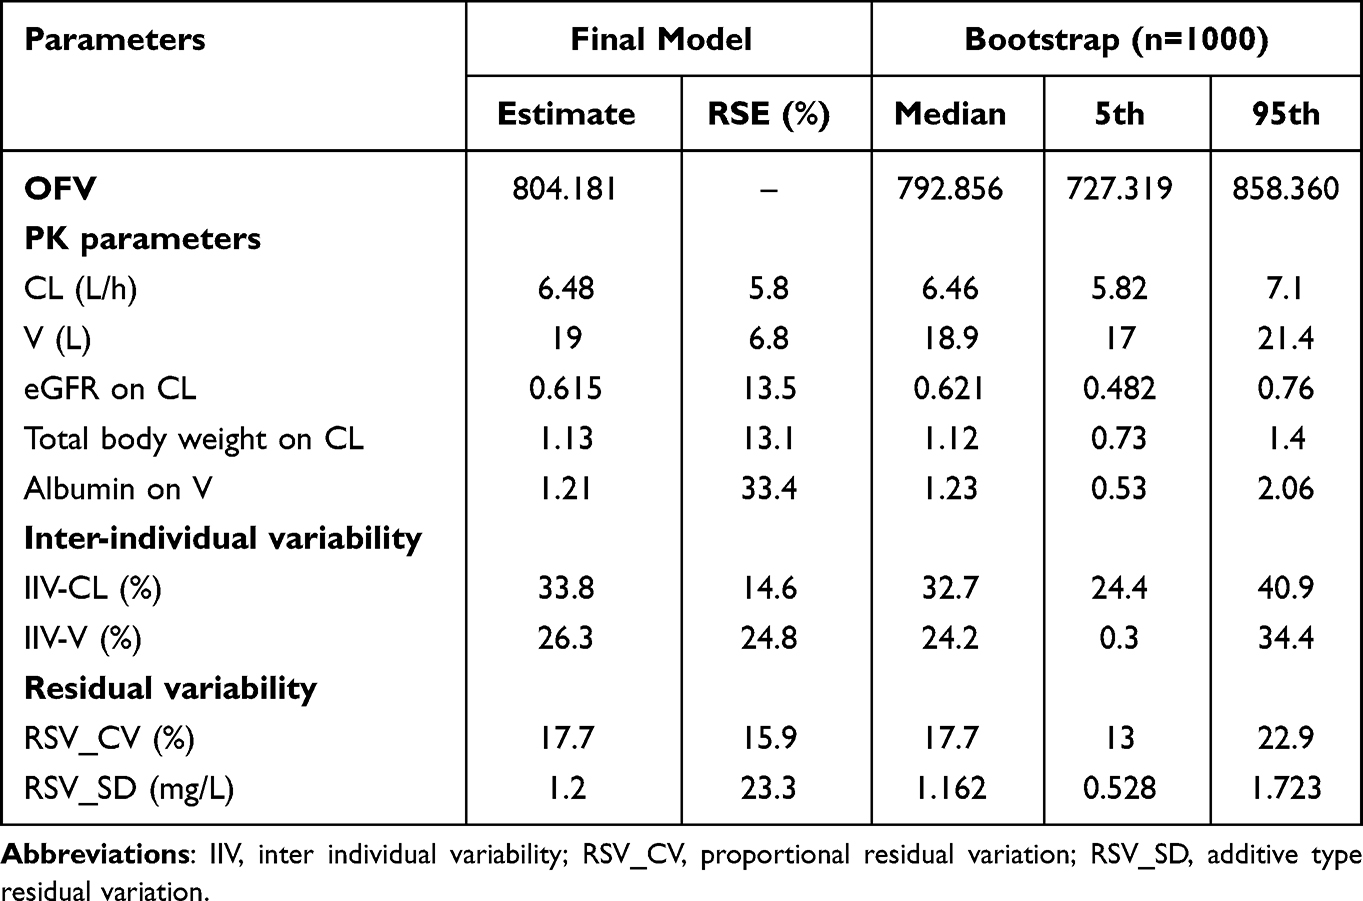 |
Table 3 Final Model Estimation Parameters and Bootstrap Analysis |
Model Evaluation
The diagnostic goodness-of-fit plots for the final model are presented in Figure 2. In the dependent variable-population prediction scatter plot and the dependent variable-individual prediction scatter plot, the trend line and the reference line (y=x) show a high degree of overlap, indicating that the model describes the central tendency of the data well (Figure 2A and B). The CWRES display a good spread against time and PRED, with most points falling within the ±2 range (Figure 2C and D).
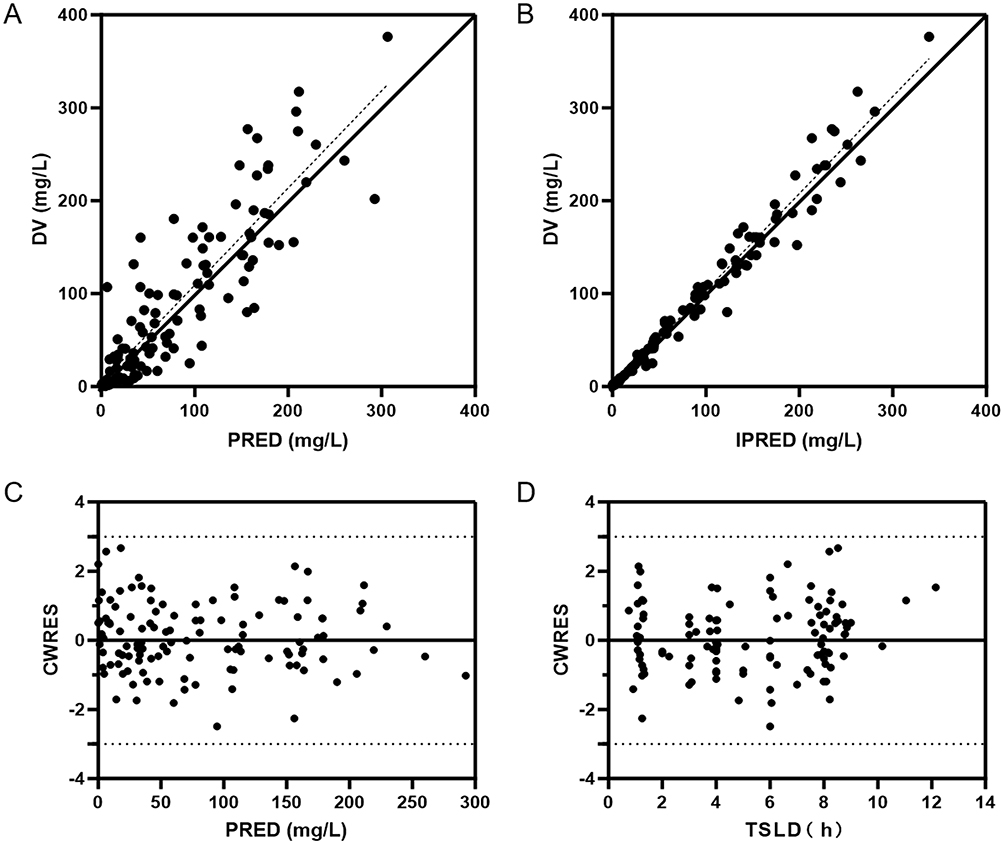 |
Figure 2 Diagnostic goodness-of-fit plots of final model. (A) Scatter plot of dependent variable concentration (DV) versus population prediction concentration (PRED); (B) Scatter plot of DV versus individual prediction concentration (IPRED); (C) Scatter plot of conditional weighted residuals (CWRES) versus PRED; (D) Scatter plot of CWRES versus time after last dose (TIME). The black solid line represents the reference line the black dashed line represents the trend line. |
Validation of the final model’s predictive performance was conducted using the normalized prediction distribution error (NPDE). The NPDE mean was 0.0161 with a variance of 0.954. The Wilcoxon signed-rank test p = 0.93, the Fisher variance test p = 0.757, and the Shapiro–Wilk normality test p = 0.592, indicating that the NPDE follows a normal distribution. The Q-Q plot revealed that data points were closely aligned around the trend line and evenly distributed on both sides of it (Figure 3A). The histogram of NPDE was close to a normal distribution (Figure 3B). The scatter plot of NPDE against time and PRED showed no significant trend changes in the data points (Figure 3C and D). These results confirm the predictability of the final model.
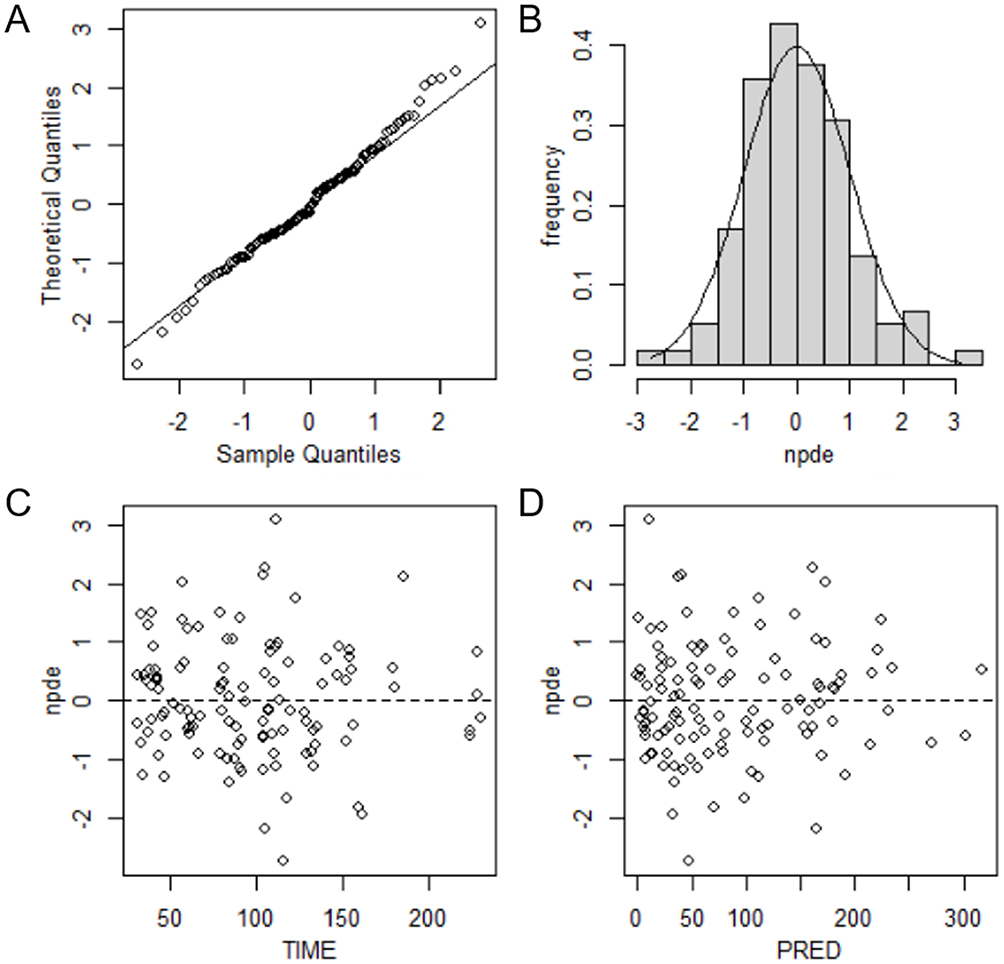 |
Figure 3 Normalized prediction distribution error (NPDE) test of final model. (A) quantile-quantile plot; (B) NPDE histogram; (C) Scatter plot of NPDE versus time after last dose (TIME); (D) Scatter plot of NPDE versus population prediction concentration (PRED). |
The visual predictive check (VPC) results demonstrate that the 5th, 50th, and 95th percentiles of the observed piperacillin concentrations all fall within the 95% confidence intervals of the predicted concentrations, thereby validating the accuracy and appropriateness of the model (Figure 4).
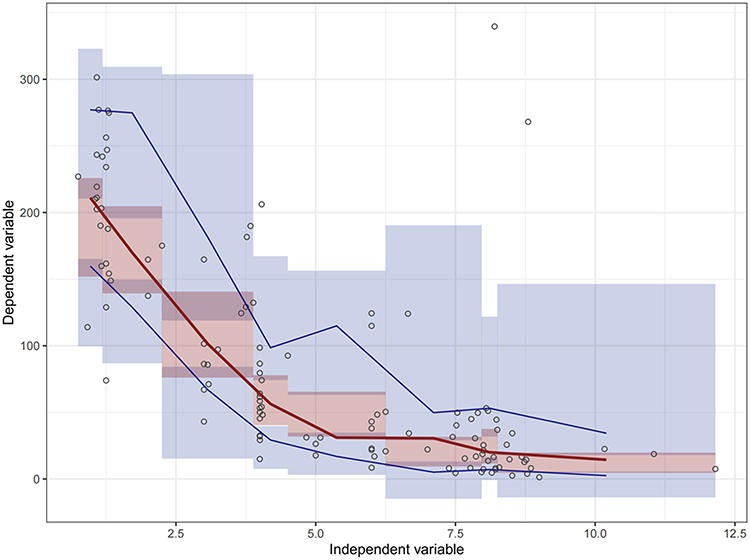 |
Figure 4 Visual predictive check (VPC) of the final model. Black hollow circles represent the observed piperacillin concentrations. The red solid line indicates the median of the observed concentrations, while the blue solid line denotes the 5th and 95th percentiles of the observed concentrations. The red shading represents the 95% confidence interval for the simulated median concentrations, and the blue shading represents the 95% confidence intervals for the simulated 5th and 95th percentiles of concentrations. |
Dosage Regimen Simulations
Monte Carlo simulations were conducted to predict the PTA (Figure 5). For the predefined target of 50% fT > MIC, when the MIC was 1 or 8 mg/mL, most dosing regimens simulated could achieve 90% PTA; when the MIC was 16 mg/mL, the q12 h dosing regimen failed to achieve 90% PTA. With the target set at 100% fT > MIC, a q6h or more frequent dosing regimen could achieve a 90% PTA when the MIC was 1 mg/mL; when the MIC was 8 or 16 mg/mL, continuous intravenous infusion (CII) was recommended. With the target set at 100% fT > 4 × MIC, a dosing regimen of Q4H or more frequent dosing regimen could achieve a 90% PTA when the MIC was 1 mg/mL; when the MIC was 8 mg/mL, CII with a daily dose of no less than 20 g could achieve a 90% PTA; when the MIC was 16 mg/mL, only CII with a daily dose of 24g approached a 90% PTA (78%). The aforementioned results highlight the influence of dosing frequency on the PTA for piperacillin, with more frequent dosing associated with a higher PTA.
 |
Figure 5 Probability of target attainment (PTA) for different dosage regimens of piperacillin in critically ill patients. The dashed horizontal line indicates that 90% of patients in the simulation have reached the specified target fT > MIC. Abbreviation: CII, continuous intravenous infusion. |
The covariate model analysis revealed that eGFR (based on CKD-EPIcys) and total body weight were significant covariates for clearance. Subsequently, we simulated the PTA for piperacillin in critically ill patients across varying levels of eGFR and total body weight. As eGFR increased, the PTA for piperacillin in critically ill patients gradually decreased, particularly when targeting higher MIC values (Figure 6). When the target was set at 50% fT > MIC or 100% fT > MIC, appropriate dosing regimens could be selected based on different MIC values and renal function. However, achieving the target of 100% fT > 4 × MIC (MIC=16 mg/mL) became challenging for patients with eGFR exceeding 60 mL/min/1.73m2. The PTA for patients with varying total body weights is illustrated in Figure 7, demonstrating an inverse relationship between total body weight and PTA. For patients weighing over 110 kg infected with pathogens exhibiting a high MIC (16 mg/L), a daily dose of 24 g of piperacillin administered as a continuous infusion achieved the targets of 50% fT > MIC and 100% fT > MIC, but fell short of the 100% fT > 4 × MIC target.
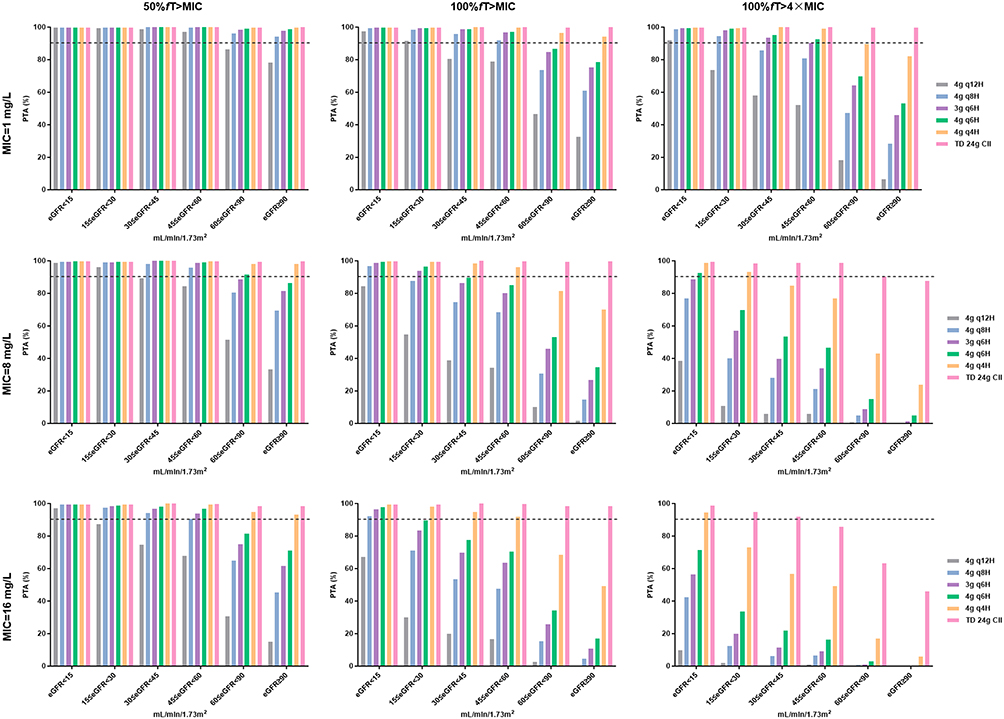 |
Figure 6 Probability of target attainment (PTA) of piperacillin in critically ill patients with different eGFR (CKD-EPIcys) levels. The dashed horizontal line indicates that 90% of patients in the simulation have reached the specified target fT > MIC. Abbreviation: CII, continuous intravenous infusion. |
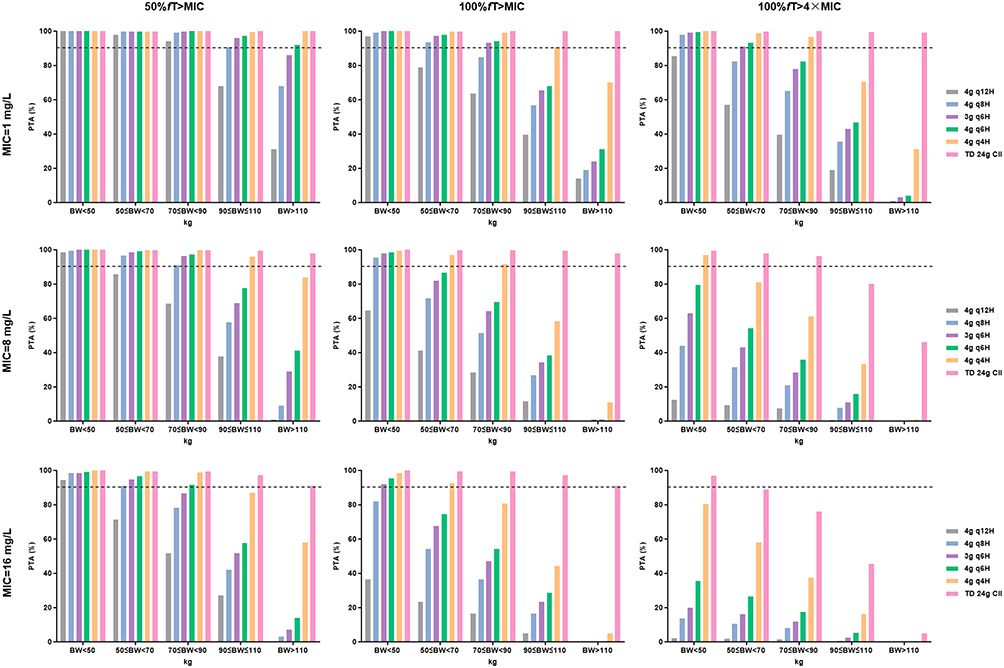 |
Figure 7 Probability of target attainment (PTA) of piperacillin in critically ill patients with different total body weight. The dashed horizontal line indicates that 90% of patients in the simulation have reached the specified target fT > MIC. Abbreviation: CII, continuous intravenous infusion. |
Discussion
Due to the profound alterations in pharmacokinetics among critically ill patients, establishing a piperacillin PPK model in this population is crucial for optimizing dosage regimens. In this study, we successfully developed a piperacillin PPK model using nonlinear mixed-effects modeling based on data from Chinese critically ill patients and investigated the effects of eGFR and total body weight on the PTA.
The pharmacokinetics of piperacillin were best described by a one-compartment model with linear elimination. The population typical values for piperacillin CL and V were 6.48 L/h and 19 L, respectively. Previous PPK studies in critically ill patients have employed both one- and two-compartment models,19,32,33 with reported CL and V estimates varying substantially (CL: 3.12–19.9 L/h; V: 11.2–41.2 L). As a hydrophilic small molecule primarily eliminated renally, the variability in piperacillin CL may reflect differences in renal function across study populations, with elevated CL observed in patients with enhanced renal function.32 Factors such as capillary leakage, hypoalbuminemia, organ dysfunction, and obesity in critically ill patients may contribute to increased V.33,34 Our study identified eGFR, total body weight, and serum albumin as significant covariates affecting piperacillin pharmacokinetics: eGFR and total body weight chiefly influence CL, whereas serum albumin primarily affects V.
In critically ill patients, eGFR values derived from serum creatinine differ markedly from those calculated using cystatin C.35 To identify the most appropriate renal-function descriptor for piperacillin clearance in this population,we evaluated the commonly used equations for eGFR (Cockcroft-Gault, MDRD, CKD-EPIcr, CKD-EPIcys, and CKD-EPIcr-cys) as continuous covariates on CL. Among those eGFR equations, CKD-EPIcys produced the largest OFV drop and was therefore retained in the final model. This result aligns with previous reports indicating that cystatin C based eGFR equations provide superior prediction of piperacillin elimination in the ICU.19,36 Cystatin C is constitutively produced by nucleated cells and freely filtered at the glomerulus. Unlike creatinine, it appears to be less affected by non‐kidney determinants such as muscle mass or systemic inflammation.37
Both eGFR and total body weight were significant predictors of CL, suggesting that total body weight may independently affect CL beyond its association with eGFR. When both eGFR and total body weight were entered simultaneously in a covariate forward search, eGFR produced the greatest OFV drop. This is mechanistically consistent with the known pharmacokinetics of piperacillin, a hydrophilic antibiotic that undergoes minimal metabolism and is primarily eliminated unchanged by the kidneys, via glomerular filtration and active tubular secretion.38,39 The mechanism underlying the total body weight-CL relationship remains unclear. Increased renal blood flow in obese patients may enhance renal excretion capacity despite comparable eGFR.40 Additionally, elevated free fatty acid levels in obesity could competitively bind to albumin, potentially increasing the unbound piperacillin fraction and accelerating renal clearance.41 Synthesizing these points, eGFR serves as the primary and modifiable determinant of piperacillin clearance, explaining the largest portion of pharmacokinetic variability in our study. Body weight provides a necessary physiological foundation for size-based normalization but its effect is secondary to the functional status of the kidneys. Plasma albumin emerged as a significant covariate for V, a subgroup frequently underemphasized in previous PPK studies.33 Hypoalbuminemia reduces drug-albumin binding, leading to higher free drug concentrations that may distribute more readily into interstitial tissues. Moreover, hypoalbuminemic patients often exhibit expanded extracellular fluid volume (eg, edema), which may increase V for hydrophilic drugs like piperacillin.42
Our findings are consistent with a growing body of evidence indicating that achieving aggressive PK/PD targets, particularly 100% fT>4×MIC, is exceptionally challenging in critically ill patients with standard dosing regimens. Research evaluating piperacillin in burn and surgical ICU patients concluded that higher doses were needed to achieve 50% fT>MICfor more resistant organisms (eg, with high MICs).43 A prospective study of ICU patients receiving piperacillin found that despite aggressive dosing, plasma concentrations often fail to reach 100% fT > MIC and 100% fT>4×MIC.44 Our study emphasizes the profound impact of MIC distribution on the feasibility of aggressive dosing strategies. The concept that “one size does not fit all” is a consistent theme in the literature that our findings reinforce.
Optimizing piperacillin dosing regimens is critical for achieving therapeutic targets and ensuring clinical efficacy.45 Monte Carlo simulations demonstrated that dosing strategy significantly impacts PTA, with larger dose, more frequent administration or CII associated with higher target attainment probabilities. It is important to note that with high-dose piperacillin administration, especially in patients with renal impairment, elevated concentrations in the cerebrospinal fluid may occur, potentially leading to penicillin-induced encephalopathy. Therefore, it is recommended to conduct routine monitoring of renal function and regular neurological surveillance for early signs of neurotoxicity. For pathogens with elevated MICs, CII outperformed intermittent dosing, consistent with previous studies showing that sustained drug concentrations above MIC reduce the likelihood of bacterial resistance.46–48 However, the feasibility of implementing CII in clinical practice must be considered, including resource availability and patient tolerance. Augmented renal function and higher total body weight were associated with reduced piperacillin concentrations and lower target attainment probabilities. This effect became pronounced when targeting 100% fT > 4×MIC, particularly at higher MIC values. Patients with augmented renal function or obesity may require higher doses or more frequent administration to achieve therapeutic concentrations. These findings underscore the importance of incorporating patient-specific factors into dosing decisions. Furthermore, antimicrobial susceptibility testing should be prioritized to guide MIC-based regimen adjustments.49
Despite these advances, this study has certain limitations that warrant consideration. The single-center design limits generalizability, a common issue in PK studies. Prospective validation in diverse ICU populations is essential. Besides, this study measured the total plasma concentration of piperacillin, rather than the free concentration. This approach may introduce potential biases in interpreting PK/PD relationships, particularly in patients with severe hypoalbuminemia or altered protein-binding capacity.50
Conclusion
This study provides valuable insights into the pharmacokinetics of piperacillin in critically ill patients, emphasizing adaptive regimens based on renal function, body composition, and pathogen susceptibility. By incorporating patient-specific factors into dosing decisions, clinicians can enhance the efficacy and safety of piperacillin therapy in the ICU setting.
Acknowledgments
This work was supported by Shandong Provincial Natural Science Foundation (grant numbers ZR2021QH296); Shandong Provincial Qianfoshan Hospital Cultivation Fund Project (grant number QYPY2023NSFC0605); Zhong Nanshan Medical Foundation of Guangdong Province (grant number ZNSXS-20240086); Comprehensive Clinical Evaluation Project of Drugs in Shandong Province (grant number 2024YZ002).
Disclosure
The authors report no conflicts of interest in this work.
References
1. Tamma PD, Harris PNA, Mathers AJ, Wenzler E, Humphries RM. Breaking Down the Breakpoints: rationale for the 2022 Clinical and Laboratory Standards Institute Revised Piperacillin-Tazobactam Breakpoints Against Enterobacterales. Clin Infect Dis. 2023;77(11):1585–14. doi:10.1093/cid/ciac688
2. Weinelt FA, Stegemann MS, Theloe A, et al. Evaluation of a Meropenem and Piperacillin Monitoring Program in Intensive Care Unit Patients Calls for the Regular Assessment of Empirical Targets and Easy-to-Use Dosing Decision Tools. Antibiotics. 2022;11(6):758. doi:10.3390/antibiotics11060758
3. Fratoni AJ, Nicolau DP, Kuti JL. A guide to therapeutic drug monitoring of β-lactam antibiotics. Pharmacotherapy. 2021;41(2):220–233. doi:10.1002/phar.2505
4. Alshaer MH, Maranchick N, Alexander KM, et al. Beta-lactam target attainment and associated outcomes in patients with bloodstream infections. Int J Antimicrob Agents. 2023;61(3):106727. doi:10.1016/j.ijantimicag.2023.106727
5. Onufrak NJ, Forrest A, Gonzalez D. Pharmacokinetic and Pharmacodynamic Principles of Anti-infective Dosing. Clin Ther. 2016;38(9):1930–1947. doi:10.1016/j.clinthera.2016.06.015
6. Berry AV, Kuti JL. Pharmacodynamic Thresholds for Beta-Lactam Antibiotics: a Story of Mouse Versus Man. Front Pharmacol. 2022;13:833189. doi:10.3389/fphar.2022.833189
7. Barreto EF, Webb AJ, Pais GM, Rule AD, Jannetto PJ, Scheetz MH. Setting the Beta-Lactam Therapeutic Range for Critically Ill Patients: is There a Floor or Even a Ceiling? Critic Care Explorat. 2021;3(6):e0446. doi:10.1097/CCE.0000000000000446
8. Guilhaumou R, Benaboud S, Bennis Y, et al. Optimization of the treatment with beta-lactam antibiotics in critically ill patients-guidelines from the French Society of Pharmacology and Therapeutics (Société Française de Pharmacologie et Thérapeutique-SFPT) and the French Society of Anaesthesia and Intensive Care Medicine (Société Française d’Anesthésie et Réanimation-SFAR). Critical Care. 2019;23(1):104. doi:10.1186/s13054-019-2378-9
9. Williams PG, Tabah A, Cotta MO, et al. International survey of antibiotic dosing and monitoring in adult intensive care units. Critical Care. 2023;27(1):241. doi:10.1186/s13054-023-04527-1
10. Legg A, Carmichael S, Chai MG, Roberts JA, Cotta MO. Beta-Lactam Dose Optimisation in the Intensive Care Unit: targets, Therapeutic Drug Monitoring and Toxicity. Antibiotics. 2023;12(5):870. doi:10.3390/antibiotics12050870
11. Silva CM, Baptista JP, Santos I, Martins P. Recommended Antibiotic Dosage Regimens in Critically Ill Patients with Augmented Renal Clearance: a Systematic Review. Int J Antimicrob Agents. 2022;59(5):106569. doi:10.1016/j.ijantimicag.2022.106569
12. Pickkers P, Darmon M, Hoste E, et al. Acute kidney injury in the critically ill: an updated review on pathophysiology and management. Intensive Care Med. 2021;47(8):835–850. doi:10.1007/s00134-021-06454-7
13. Ulldemolins M, Roberts JA, Rello J, Paterson DL, Lipman J. The effects of hypoalbuminaemia on optimizing antibacterial dosing in critically ill patients. Clin Pharmacokinet. 2011;50(2):99–110. doi:10.2165/11539220-000000000-00000
14. Gotts JE, Matthay MA. Sepsis: pathophysiology and clinical management. BMJ. 2016;353:i1585. doi:10.1136/bmj.i1585
15. Messmer AS, Zingg C, Müller M, Gerber JL, Schefold JC, Pfortmueller CA. Fluid Overload and Mortality in Adult Critical Care Patients-A Systematic Review and Meta-Analysis of Observational Studies. Crit Care Med. 2020;48(12):1862–1870. doi:10.1097/CCM.0000000000004617
16. Cheng K, Li C, Wu H. Sarcopenia: it is time to attach more importance to this stealth killer in patients who are critically ill. Anaesthesia. 2024;79(9):994–995. doi:10.1111/anae.16305
17. Butragueño-Laiseca L, Marco-Ariño N, Troconiz IF, et al. Population pharmacokinetics of piperacillin in critically ill children including those undergoing continuous kidney replacement therapy. Clin Microbiol Infect. 2022;28(9):
18. Thy M, Urien S, Foissac F, et al. Piperacillin Population Pharmacokinetics and Dosing Regimen Optimization in Critically Ill Children Receiving Continuous Renal Replacement Therapy. Antimicrob Agents Chemother. 2022;66(12):e0113522. doi:10.1128/aac.01135-22
19. Kim YK, Kim HS, Park S, Kim HI, Lee SH, Lee DH. Population pharmacokinetics of piperacillin/tazobactam in critically ill Korean patients and the effects of extracorporeal membrane oxygenation. J Antimicrob Chemother. 2022;77(5):1353–1364. doi:10.1093/jac/dkac059
20. Tsai D, Stewart P, Goud R, et al. Pharmacokinetics of Piperacillin in Critically Ill Australian Indigenous Patients with Severe Sepsis. Antimicrob Agents Chemother. 2016;60(12):7402–7406. doi:10.1128/AAC.01657-16
21. Cheng Y, Wang CY, Li ZR, Pan Y, Liu MB, Jiao Z. Can Population Pharmacokinetics of Antibiotics be Extrapolated? Implications of External Evaluations. Clin Pharmacokinet. 2021;60(1):53–68. doi:10.1007/s40262-020-00937-4
22. Greppmair S, Brinkmann A, Roehr A, et al. Towards model-informed precision dosing of piperacillin: multicenter systematic external evaluation of pharmacokinetic models in critically ill adults with a focus on Bayesian forecasting. Intensive Care Med. 2023;49(8):966–976. doi:10.1007/s00134-023-07154-0
23. US Department of Health and Human Services FaDA. Center for Drug Evaluation and Research and Center for Veterinary Medicine. Bioanalytical Method Validation Guidance for Industry. 2018. Available from: https://www.fda.gov/regulatory-information/search-fda-guidance-documents/bioanalytical-method-validation-guidance-industry.
24. Bilbao-Meseguer I, Rodríguez-Gascón A, Barrasa H, Isla A, Solinís M. Augmented Renal Clearance in Critically Ill Patients: a Systematic Review. Clin Pharmacokinet. 2018;57(9):1107–1121. doi:10.1007/s40262-018-0636-7
25. Sörgel F, Kinzig M. The chemistry, pharmacokinetics and tissue distribution of piperacillin/tazobactam. J Antimicrob Chemother. 1993;31(Suppl A):39–60. doi:10.1093/jac/31.suppl_A.39
26. Cockcroft DW, Gault MH. Prediction of creatinine clearance from serum creatinine. Nephron. 1976;16(1):31–41. doi:10.1159/000180580
27. Levey AS, Bosch JP, Lewis JB, Greene T, Rogers N, Roth D. A more accurate method to estimate glomerular filtration rate from serum creatinine: a new prediction equation. Ann Internal Med. 1999;130(6):461–470.
28. Levey AS, Coresh J, Greene T, et al. Using standardized serum creatinine values in the modification of diet in renal disease study equation for estimating glomerular filtration rate. Ann Internal Med. 2006;145(4):247–254. doi:10.7326/0003-4819-145-4-200608150-00004
29. Ma YC, Zuo L, Chen JH, et al. Modified glomerular filtration rate estimating equation for Chinese patients with chronic kidney disease. J Am Soc Nephrol. 2006;17(10):2937–2944. doi:10.1681/ASN.2006040368
30. Inker LA, Eneanya ND, Coresh J, et al. New Creatinine- and Cystatin C-Based Equations to Estimate GFR without Race. New Engl J Med. 2021;385(19):1737–1749. doi:10.1056/NEJMoa2102953
31. Inker LA, Schmid CH, Tighiouart H, et al. Estimating glomerular filtration rate from serum creatinine and cystatin C. New Engl J Med. 2012;367(1):20–29. doi:10.1056/NEJMoa1114248
32. Klastrup V, Thorsted A, Storgaard M, Christensen S, Friberg LE, Öbrink-Hansen K. Population Pharmacokinetics of Piperacillin following Continuous Infusion in Critically Ill Patients and Impact of Renal Function on Target Attainment. Antimicrob Agents Chemother. 2020;64(7):e02556–02519. doi:10.1128/AAC.02556-19
33. El-Haffaf I, Caissy JA, Marsot A. Piperacillin-Tazobactam in Intensive Care Units: a Review of Population Pharmacokinetic Analyses. Clin Pharmacokinet. 2021;60(7):855–875. doi:10.1007/s40262-021-01013-1
34. Chung EK, Cheatham SC, Healy DP, et al. Population pharmacokinetics and pharmacodynamics of cefazolin using total and unbound serum concentrations in patients with high body weight. Int J Antimicrob Agents. 2023;61(4):106751. doi:10.1016/j.ijantimicag.2023.106751
35. Williams VL, Gerlach AT. Establishing discordance rate of estimated glomerular filtration rate between serum creatinine-based calculations and cystatin-C-based calculations in critically ill patients. Pharmacotherapy. 2025;45(3):161–168. doi:10.1002/phar.70000
36. Barreto EF, Chang J, Rule AD, et al. Piperacillin/tazobactam clearance predicted by non-creatinine based estimates of GFR in critically ill adults. Int J Antimicrob Agents. 2025;66(5):107586. doi:10.1016/j.ijantimicag.2025.107586
37. Shlipak MG, Mattes MD, Peralta CA. Update on cystatin C: incorporation into clinical practice. Am J Kidney Dis. 2013;62(3):595–603. doi:10.1053/j.ajkd.2013.03.027
38. Ulldemolins M, Martín-Loeches I, Llauradó-Serra M, et al. Piperacillin population pharmacokinetics in critically ill patients with multiple organ dysfunction syndrome receiving continuous venovenous haemodiafiltration: effect of type of dialysis membrane on dosing requirements. J Antimicrob Chemother. 2016;71(6):1651–1659. doi:10.1093/jac/dkv503
39. Udy AA, Lipman J, Jarrett P, et al. Are standard doses of piperacillin sufficient for critically ill patients with augmented creatinine clearance? Critical Care. 2015;19(1):28. doi:10.1186/s13054-015-0750-y
40. Anderson MR, Shashaty MGS. Impact of Obesity in Critical Illness. Chest. 2021;160(6):2135–2145. doi:10.1016/j.chest.2021.08.001
41. Liqiang S, Fang-Hui L, Minghui Q, Yanan Y, Haichun C. Free fatty acids and peripheral blood mononuclear cells (PBMC) are correlated with chronic inflammation in obesity. Lipids Health Dis. 2023;22(1):93. doi:10.1186/s12944-023-01842-y
42. Dull RO, Hahn RG. Hypovolemia with peripheral edema: what is wrong? Critical Care. 2023;27(1):206. doi:10.1186/s13054-023-04496-5
43. Akers K, Cota J, Waters J, Chung K, Murray C. Variable Pharmacokinetics and Pharmacodynamics (PK/PD) of Piperacillin in Critically Ill Patients. Crit Care Med. 2013;41(12):A243.
44. Beijer G, Swartling M, Nielsen EI, et al. First dose target attainment with extended infusion regimens of piperacillin and meropenem. Critical Care. 2025;29(1):208. doi:10.1186/s13054-025-05445-0
45. Schatz LM, Greppmair S, Kunzelmann AK, et al. Predictive performance of multi-model approaches for model-informed precision dosing of piperacillin in critically ill patients. Int J Antimicrob Agents. 2024;64(4):107305. doi:10.1016/j.ijantimicag.2024.107305
46. Abdul-Aziz MH, Hammond NE, Brett SJ, et al. Prolonged vs Intermittent Infusions of β-Lactam Antibiotics in Adults With Sepsis or Septic Shock: a Systematic Review and Meta-Analysis. JAMA. 2024;332(8):638–648. doi:10.1001/jama.2024.9803
47. Hyun DG, Seo J, Lee SY, et al. Continuous Piperacillin-Tazobactam Infusion Improves Clinical Outcomes in Critically Ill Patients with Sepsis: a Retrospective, Single-Centre Study. Antibiotics. 2022;11(11):1508. doi:10.3390/antibiotics11111508
48. Martínez-Casanova J, Esteve-Pitarch E, Colom-Codina H, et al. Predictive Factors of Piperacillin Exposure and the Impact on Target Attainment after Continuous Infusion Administration to Critically Ill Patients. Antibiotics. 2023;12(3):531. doi:10.3390/antibiotics12030531
49. Bassetti S, Tschudin-Sutter S, Egli A, Osthoff M. Optimizing antibiotic therapies to reduce the risk of bacterial resistance. Eur J Internal Med. 2022;99:7–12. doi:10.1016/j.ejim.2022.01.029
50. El-Haffaf I, Guilhaumou R, Velly L, Marsot A. Impact of piperacillin unbound fraction variability on dosing recommendations in critically ill patients. Br J Clin Pharmacol. 2023;89(4):1502–1508. doi:10.1111/bcp.15619
 © 2026 The Author(s). This work is published and licensed by Dove Medical Press Limited. The
full terms of this license are available at https://www.dovepress.com/terms
and incorporate the Creative Commons Attribution
- Non Commercial (unported, 4.0) License.
By accessing the work you hereby accept the Terms. Non-commercial uses of the work are permitted
without any further permission from Dove Medical Press Limited, provided the work is properly
attributed. For permission for commercial use of this work, please see paragraphs 4.2 and 5 of our Terms.
© 2026 The Author(s). This work is published and licensed by Dove Medical Press Limited. The
full terms of this license are available at https://www.dovepress.com/terms
and incorporate the Creative Commons Attribution
- Non Commercial (unported, 4.0) License.
By accessing the work you hereby accept the Terms. Non-commercial uses of the work are permitted
without any further permission from Dove Medical Press Limited, provided the work is properly
attributed. For permission for commercial use of this work, please see paragraphs 4.2 and 5 of our Terms.