Back to Journals » Drug Design, Development and Therapy » Volume 20
Plumbagin Induces Ferroptosis in Nonfunctioning Pituitary Adenomas via Nrf2/FTH1-Dependent Ferritinophagy
Authors Fan D, Wang Z, Luo S, Huang X, Yuan X, Wang Y, Wang Z, Chen H, Wang W, Ma Y, Zhou C, Jin X, Liu J, Wang X
Received 2 September 2025
Accepted for publication 1 June 2026
Published 26 June 2026 Volume 2026:20 564608
DOI https://doi.org/10.2147/DDDT.S564608
Checked for plagiarism Yes
Review by Single anonymous peer review
Peer reviewer comments 2
Editor who approved publication: Prof. Dr. Georgios Panos
Dong Fan,1,2,* Zongming Wang,3,* Shixue Luo,1,2 Xuanhao Huang,2 Xingyi Yuan,1,2 Yanan Wang,4 Zhongyu Wang,2 Huitong Chen,2 Weiwen Wang,2 Yuxin Ma,2 Chang Zhou,2 Xiaobao Jin,5 Jing Liu,2 Xin Wang1,2,5
1Department of Neurosurgery, The First Affiliated Hospital, Guangdong Pharmaceutical University, Guangzhou, 510080, People’s Republic of China; 2School of Basic Medical Sciences, Guangdong Pharmaceutical University, Guangzhou, 510006, People’s Republic of China; 3Department of Neurosurgery, Pituitary Tumor Center, The Sixth Affiliated Hospital, Sun Yat-sen University, Guangzhou, 510655, People’s Republic of China; 4Department of Neurology, The Second People’s Hospital of Panyu Guangzhou, Guangzhou, 511400, People’s Republic of China; 5Guangdong Key Laboratory of Pharmaceutical Bioactive Substances, Guangdong Pharmaceutical University, Guangzhou, 510006, People’s Republic of China
*These authors contributed equally to this work
Correspondence: Xin Wang, Email [email protected] Jing Liu, Email [email protected]
Background: Nonfunctioning pituitary adenoma (NFPA) is among the most prevalent intracranial tumors. As surgical resection remains the primary treatment, there is a need for new therapeutic strategies. Plumbagin (PLB), a bioactive naphthoquinone compound derived from the roots of Plumbaginaceae Juss, has been used in anti-tumor research in recent years, but its mechanism remains controversial.
Purpose: The aim of this study was to explore the molecular mechanism of PLB-induced ferroptosis in NFPA.
Methods: The cell viability of PLB against PDFS cells was first assessed by CCK-8, colony formation, and EDU assays. Network pharmacology, molecular docking, and molecular dynamics were then used to screen out targets associated with ferroptosis. Finally, the Nrf2/FTH1 pathway was validated by a 3D multicellular tumour spheroids (MCTSs) model, q-PCR, and Western blot in vitro and in vivo.
Results: Compared to temozolomide (TMZ), PLB more potently inhibited the viability of PDFS cells. In vitro, PLB treatment was associated with downregulation of the Nrf2/FTH1 pathway, accompanied by increased lipid peroxidation and labile iron pool (LIP) accumulation. Furthermore, PLB treatment led to the upregulation of NCOA4 and an increase in intracellular free iron, consistent with ferritinophagy activation. These effects collectively point to the induction of ferroptosis.
Conclusion: This study demonstrates that PLB may induce ferroptosis in PDFS cells. The mechanism involves suppression of the Nrf2/FTH1 pathway, subsequent upregulation of NCOA4, and ferritinophagy-driven iron overload. These results identify PLB as a potential ferroptosis inducer and warrant further investigation into its therapeutic potential for NFPA. The image shows a biochemical pathway illustrating ferritinophagy and ferroptosis. Iron in the form of Fe superscript 3 is transported by transferrin into the cell, where it is stored in ferritin. Ferritin is directed to the autolysosome, facilitated by Lamp2, where iron is released as Fe superscript 2. NCOA4 and LC3 are involved in ferritinophagy, leading to the labile iron pool. The Fenton reaction produces reactive oxygen species, contributing to ferroptosis. Nrf2 regulates FTH1, with arrows indicating promotion and inhibition. Plumbagin is shown affecting the pathway, with an illustration of a mouse receiving an injection, highlighting the interaction between NCOA4, FTH1 and Nrf2 in the brain. Arrows indicate promotion and inhibition effects within the pathway.Diagram of ferritinophagy and ferroptosis: iron regulation, NCOA4, FTH1, Nrf2 and plumbagin effects.
Keywords: pituitary adenomas, ferroptosis, ferritinophagy, plumbagin
Introduction
Nonfunctioning pituitary adenomas (NFPA), recently reclassified as pituitary neuroendocrine tumors (PitNET), are the second most common intracranial tumors, and PitNET incidence is approximately 0.1%.1 According to their hormone-producing capacity, PitNETs are classified into NFPAs or functional pituitary adenomas (FPAs). NFPAs account for 14–54% of all pituitary adenomas2 and are one of the most common subtypes of pituitary adenomas in neurosurgical practice. Unlike FPAs, NFPAs primarily manifest as masses rather than hormonal hypersecretion. NFPA treatment is based on surgical resection; however, complete resection is often hampered by tumor aggressiveness,3 leading to frequent recurrence or progression.4 Although temozolomide is used for aggressive pituitary carcinomas, its efficacy in NFPAs is limited, highlighting the need for novel therapeutic strategies.
Ferroptosis is an iron-dependent form of regulated cell death driven by excessive lipid peroxidation, leading to oxidative damage to cellular membranes.5 This mode of cell death has been implicated in various pathological conditions, particularly cancer.6 Notably, induction of ferroptosis inhibits cancer cell proliferation, suggesting its potential as a therapeutic strategy for refractory malignancies.7 The transcription factor nuclear factor erythroid 2-related factor 2 (Nrf2) is considered a major regulator of antioxidant responses8,9 because many of its downstream target genes, such as FTH1, are involved in preventing or correcting redox imbalances in cells.10 Although several pro-ferroptosis factors that modulate lipid peroxidation have been identified,11–13 the precise mechanisms underlying the dysregulation of iron homeostasis during ferroptosis remain poorly understood. Moreover, several studies have focused on the critical role of the labile iron pool (LIP) and ferritinophagy in disrupting iron homeostasis.14,15 Ferritinophagy is a selective autophagic process mediated by nuclear receptor coactivator 4 (NCOA4). This process involves the recognition and binding of FTH1 by NCOA4, followed by the delivery of ferritin to the autophagosome for lysosomal degradation. This cascade liberates free iron, thereby amplifying Fenton reaction-driven oxidative stress and ultimately triggering ferroptosis.16,17 Dysregulation of iron metabolism and antioxidant defense is increasingly implicated in pituitary tumor pathobiology,18 suggesting that ferroptosis may represent a therapeutically targetable vulnerability in NFPA. Whether this can be harnessed for treatment remains unexplored.
Plumbagin (PLB) is a bioactive naphthoquinone compound derived from plants in the Plumbaginaceae Juss., family and is a secondary metabolite with antitumor properties.19 PLB induces tumor cell death by inducing apoptosis, anti-angiogenesis and reactive oxygen species (ROS) production.20 Recent studies indicate that PLB can induce ferroptosis, and it has been reported to cross the blood-brain barrier, making it a candidate for targeting intracranial tumors.21
This study integrates in vitro and in vivo NFPA models with network pharmacology, computational docking and dynamics, and functional rescue experiments to demonstrate that PLB likely induces ferroptosis in PDFS cells by disrupting the Nrf2/FTH1 axis and activating NCOA4-mediated ferritinophagy. Our findings provide insights into a mechanism through which PLB may exert anti-tumor effects in NFPA, supporting its further investigation as a potential therapeutic agent.
Materials and Methods
Human Nonfunctioning Pituitary Adenoma Samples
Three NFPA specimens were collected from The Sixth Affiliated Hospital of Sun Yat-sen University, with informed consent obtained from the donor. All procedures were approved by the Institutional Ethics Committee of the Sixth Affiliated Hospital of Sun Yat-sen University (L2025ZSLYEC-422) and conducted by the principles of the Declaration of Helsinki.
Reagents and Antibodies
PLB was purchased from Solar bio (IP0650, Beijing, China), DMSO was purchased from MP Biomedical (0219605580, California, USA), Z-VAD-FMK was purchased from Biotite (C1202-0.02 mL, Liaoning China), Chloroquine (CQ) was purchased from Aladdin Bio (C424619 54-05-7, Beijing, China), Ferrostatin-1 (Fer-1) was purchased from Alexio (Y-A4371, Houston, USA), Deferoxamine (DFO) was purchased from Tegretol (138-14-7, Proteintech), C11 BODIPY 581/591 was purchased from Beyotime (S0043M, Liaoning China), NCOA4-9a was purchased from GLPBIO (2650557-72-3, USA), Temozolomide (TMZ) and NK-252 were purchased from MedChemExpress (HY-17364, HY-19734, New Jersey, USA). Primary Antibodies for Western Blot: anti-β-actin (1:8000, 66009-1, Proteintech, China), anti-Glutathione peroxidase 4 (GPX4) (1:1000, ET1706-45, HUABIO, China), anti-Solute carrier family seven-member 11 (anti-SLC7A11) (1:2000, T57046, Abmart, China); anti-Long-chain acyl-CoA synthetase 4 (anti-FACL4) (1:2000, T510198, Abmart, China); anti-Ferroportin (anti-FPN) (TD13561, Abmart, China); anti-Heme oxygenase 1 (anti-HO-1) (1:2000, T55113, Abmart, China); anti-Transferrin receptor protein 1(anti-TFR) (1:2000, T56618, Abmart, China); anti-FTH1 (1:5000, ET1610-78, HUABIO, China), anti- Nrf2 (1:2000, T55136, Abmart, China), anti- NCOA4 (1:2000, TD4255, Abmart, China), anti-LC3B (1:2000, T55992, Abmart, China), anti-P62 (1:5000, T55546, Abmart, China), anti-Lysosome-associated membrane glycoprotein 2 (LAMP-2) (1:2000, TD6719, Abmart, China), anti-cleaved Caspase-3 (1:2000, TA7022S, Abmart, China), anti-cleaved PARP (1:2000, T55265S, Abmart, China).
Cell Line Selection and Culture
This study chose the PDFS cell line as an in vitro model system (PDFS were obtained from follicular cells derived from human nonfunctioning pituitary adenomas by multiple passages22), which was generously provided by the Laboratory of Neuroendocrinology, Massachusetts General Hospital, Harvard Medical School, and has been well-characterized in previous studies.23,24 The identity of PDFS cells was assessed by immunofluorescence detection of Vimentin, demonstrating that the cells retain the folliculostellate phenotype reported in the original characterization of this cell line (Figure S1A). NFPA cells refer to primary tumor cells isolated from human nonfunctioning pituitary adenomas. Human normal gastric mucosal epithelial cells (GES1) were kindly donated by Prof. Chang Zhou. PDFS and GES1 cells were cultured in Dulbecco’s Modified Eagle Medium (DMEM) supplemented with 10% fetal bovine serum (FBS) and 1% penicillin/streptomycin. NFPA cells were maintained in DMEM/F12 medium supplemented with 12% FBS and 1% penicillin/streptomycin. Cells were incubated at 37°C in a humidified 5% CO2 atmosphere. All cell lines underwent routine mycoplasma contamination testing, and the culture medium was refreshed every 72 hours.
Cell Viability Assay
Cell viability was assessed using the Cell Counting Kit-8 (CCK-8; Meilunbio, Liaoning, China). Cells were seeded in 96-well plates at a density of 1 × 10⁴ cells/well in 100 μL of medium. After adherence, cells were treated with varying concentrations of PLB or pre-incubated with inhibitors or agonists for 12 hours, followed by PLB co-treatment for 24 hours. Subsequently, add 10 μL of CCK-8 Reagent to each well and incubate the plate at 37°C for 1 hour. Measure the absorbance at 450 nm using an enzyme meter and calculate cell viability based on OD.
5-Ethynyl-2ʹ-Deoxyuridine (EdU) Cell Proliferation Assay
Cell proliferation was assessed using the BeyoClick™ EdU Cell Proliferation Kit (C0078S, Beyotime, Shanghai). Inoculate 1×10⁴ cells/well after adherence, then treat them with different concentrations of PLB for 24 hours. Replace half of the medium with fresh complete medium containing EdU and incubate for 2 hours at 37°C under 5% CO2. Perform subsequent steps according to the kit instructions.
Live/Dead Cell Staining
Viability was assessed using the Live/Dead Cell Staining Kit (Solarbio, CA1630-500T, Beijing). Cells (10,000/well) were seeded in 96-well plates. After adherence, cells were treated with DMSO, NK-252, DFO, or PLB for 24 h. Calcein AM/PI working solution (100 μL/well) was added, and plates were incubated in the dark at 37°C for 20–30 min. Images were captured using a fluorescence microscope.
Colony Formation Assay
Cells pretreated with DMSO or PLB for 24 h were digested, centrifuged, and counted. Cells (1000/well) were seeded in 6-well plates and cultured for 14 days. Colonies were fixed with 4% paraformaldehyde (Biosharp, Anhui, China), stained with 0.1% crystal violet, and quantified.
Wound Healing Assay
Cells (5 × 10⁵/well) were seeded in 6-well plates and grown to confluence. A linear scratch was created using a sterile pipette tip. Cells were washed and cultured in a medium containing 1% FBS to minimize proliferation. Images were captured at 0 h and 24 h post-scratch. The migration rate was calculated by measuring the distance between wound edges.
Transwell Assay
Cell invasion was evaluated using Transwell chambers coated with 60 μL Matrigel. Cells (200 μL serum-free medium) pretreated with PLB or DMSO were added to the upper chamber; simultaneously, 600 μL of medium containing 10% FBS was added to the lower chamber. After 24 hours of incubation, cells were fixed with 4% paraformaldehyde, stained with 0.5% crystal violet, washed, and photographed under an inverted microscope.
Western Blot Analysis
After 24 h of cell action with different concentrations of PLB, the cells were lysed with cell lysate to extract the total protein and quantified, after protein denaturation-electrophoresis-wet transfer method for membrane, the membrane were blocked, and the corresponding primary antibodies (GPX4, FACL4, SLC7A11, cleaved Caspase-3, cleaved PARP, FTH1, NCOA4, FPN, Nrf2, LC3, LAMP-2, and P62, β-actin as an internal reference) were incubated at 4 °C overnight, and then the membrane was washed, and the secondary antibodies were incubated. The protein bands were detected by chemiluminescence and quantified by Image J.
Real-Time Quantitative Reverse Transcriptase-Polymerase Chain Reaction Analysis (q-PCR)
Total RNA was isolated from PDFS cells using TRIzol reagent. cDNA was synthesized using the PrimeScript RT Kit (RR092S, TaKaRa, Japan). q-PCR was performed with SYBR Premix Ex Taq II (RR820A, TaKaRa, Japan) on a Bio-Rad CFX Manager 2.1 system (Bio-Rad, USA). mRNA expression was analyzed using the comparative Ct method, normalized to GAPDH. Primer sequences are as follows: hsa-Nrf2: 5ʹ-AGGTTGCCCACATTCCCAAA-3ʹ (forward) and 5ʹ-AGTGACTGAAACGTAGCCGA-3ʹ (reverse); hsa-GPX4: 5ʹ-GACACCGTCTCTCCACAGTTC-3ʹ (forward) and 5ʹ-CAGGTCCTTCTCTATCACCAGG-3ʹ (reverse); hsa-FTH1: 5ʹ-TCCTACGTTTACCTGTCCATGT-3ʹ (forward) and 5ʹ-GTTTGTGCAGTTCCAGTAGTGA-3ʹ (reverse); hsa-GAPDH: 5ʹ-GGAGCGAGATCCCTCCAAAAT-3ʹ (forward) and 5ʹ-GGCTGTTGTCATACTTCTCATGG-3ʹ (reverse).
Lipid Peroxidation and ROS Detection
Malondialdehyde (MDA), a biomarker of lipid peroxidation, was quantified using the MDA Assay Kit (S0131S, Beyotime, China). The total protein concentration was determined using the BCA Protein Assay Kit (MA0082-2, Meilunbio, China). Relative MDA levels were normalized to total protein content and expressed as nmol/mg protein.
After adherent PDFS cells were treated with different drugs for 24 hours, a working solution of C11 BODIPY 581/591 at a concentration of 10 μM/L was added, and the cells were cultured in 5% carbon monoxide at 37°C for 30 minutes, then observed using an inverted fluorescence microscope.
Intracellular ROS was detected using DCFH-DA (Beyotime, Shanghai, China). Cells treated with DMSO or PLB were incubated with 10 μM DCFH-DA for 30 min in the dark. Fluorescence images were captured using an inverted fluorescence microscope.
Glutathione (GSH) Assay
Total intracellular glutathione levels were measured in PDFS cells using the GSH Assay Kit (S0053, Beyotime, China) according to the manufacturer’s protocol. Absorbance was recorded at 412 nm, and GSH concentrations were calculated based on a standard curve normalized to total protein content.
Fe2+ and LIP Quantification
Intracellular ferrous iron (Fe2+) levels were analyzed using the Iron Assay Kit (BC5410, Solarbio, Beijing, China) according to the manufacturer’s instructions. After cell lysis and centrifugation, the supernatant was incubated with a 100 μL detection probe for 1 h. Absorbance was immediately measured at 593 nm, and Fe2+ concentration was calculated via a standard calibration curve.
LIP was assessed using calcein acetoxymethyl ester (calcein-AM) as described previously.25 Cells were incubated with calcein-AM (2 μmol/L) at 37°C for 15 min, followed by treatment with DFO (100 μmol/L) for an additional 15 min. The LIP level was determined by calculating the ratio of fluorescence intensity (excitation: 485 nm; emission: 535 nm) before and after DFO addition.
Mitochondrial Membrane Potential (MMP) Assay
MMP was evaluated using the JC-1 probe (C2006, Beyotime, China). Briefly, cells were stained with JC-1 working solution at 37°C for 20 min, washed, and visualized under an inverted fluorescence microscope.
Identification of PLB Therapeutic Targets in NFPA
Potential targets of PLB were screened using the keyword “plumbagin” across multiple databases, PharmMapper (http://www.lilab-ecust.cn/pharmmapper/), Swiss Target Prediction (http://www.swisstargetprediction.ch/), TargetNet (http://targetnet.scbdd.com/), STITCH (https://stitch.embl.de/), SEA (http://sea.bkslab.org/), and Genecards (https://www.genecards.org/). A total of 352 PLB-related targets were identified. Concurrently, NFPA-associated targets (n=1703) were retrieved using the keyword “pituitary adenoma” from OMIM (https://www.omim.org/), GeneCards (https://www.genecards.org), and DisGeNET (https://www.disgenet.org). Protein standardization was performed via NCBI (https://www.ncbi.nlm.nih.gov/) and UniProt (https://www.uniprot.org/). Shared targets between PLB and NFPA were analyzed using the Jvenn platform (https://www.bioinformatics.com.cn/static/others/jvenn/), and a Venn diagram was generated for visualization.
Protein-Protein Interaction (PPI) Network Construction
A PPI network was constructed using the STRING v12.0 database (https://cn.string-db.org/) with Homo sapiens as the reference species. A confidence threshold of 0.4 was applied to filter high-reliability interactions. Network visualization and hub gene identification were performed using Cytoscape v3.7.1. The cytoHubba plugin was employed with the following six centrality algorithms to rank nodes (genes/proteins) by their topological importance within the PPI network: Degree (number of direct connections), Betweenness (frequency of lying on shortest paths), Closeness (inverse of the total distance to all other nodes), MNC (Maximum Neighborhood Component, size of the largest connected component formed by a node and its direct neighbors), EPC (Edge Percolated Component, robustness score based on connectivity after random edge removal), and Radiality (measure based on the network diameter and shortest‑path distances). The top 5 genes from the ranking list of each algorithm were selected, and their intersection was defined as the core targets mediating PLB’s ferroptosis effects.
Kyoto Encyclopedia of Genes and Genomes (KEGG) Pathway and Gene Ontology (GO) Enrichment Analysis
Functional enrichment analysis of shared targets was conducted using the DAVID v6.8 database (https://david.ncifcrf.gov/).26 GO terms (biological process [BP], molecular function [MF], cellular component [CC]) and KEGG pathways were annotated. Results were visualized as bubble plots via the Bioinformatics Analysis Platform (http://www.bioinformatics.com.cn/).
Molecular Docking Validation
Molecular docking was performed to validate PLB-target interactions: 3D structures of target proteins were retrieved from the Protein Data Bank (PDB; https://www.rcsb.org/). Hydrogen atoms and charges were optimized using AutoDock Tools 1.5.6. Ligand Preparation: PLB’s 3D structure was downloaded from PubChem (https://pubchem.ncbi.nlm.nih.gov/) and processed for flexibility (rotatable bonds defined). Docking Protocol: Semi-flexible docking was executed with the protein backbone fixed, and side chains allowed flexibility. Parameters included an exhaustiveness of 25 and the Lamarckian Genetic Algorithm for conformational sampling. Binding Affinity: Binding free energy (ΔG) was calculated using AutoDock Vina 1.2.0. Visualization: Docking poses were analyzed with PyMOL 3.0.3 and Discovery Studio 2019. Binding energies <0 kcal/mol indicated spontaneous binding; values < −5 kcal/mol and < −7 kcal/mol represented strong and extremely strong affinity, respectively.
Molecular Dynamics (MD)
All molecular dynamics (MD) simulations were performed using GROMACS 2024.4. Protein–ligand complexes of PLB with Nrf2 or FTH1 were solvated in a dodecahedral box with SPC/E water and neutralized with Na+/Cl− ions (150 mM). The protein was parameterized with the Amber99sb-ildn force field, and the ligand topology was generated via Sobtop using GAFF2. After energy minimization (steepest descent, Fmax < 1000 kJ·mol−1·nm−1), the system was equilibrated for 100 ps each in the NVT (300 K, V-rescale thermostat) and NPT (1 bar, Parrinello–Rahman barostat) ensembles. A 100-ns production run was carried out at 300 K and 1 bar with a 2-fs time step. Electrostatics were treated with PME (Fourier spacing = 0.12 nm), and van der Waals interactions used a force-switch beyond 1.0 nm. Coordinates were saved every 100 ps.
Binding free energies were estimated using gmx_MMPBSA v1.6.4 based on snapshots from 90–100 ns (10 frames, single-trajectory approach). Polar solvation energies were computed by solving the nonlinear Poisson–Boltzmann equation (εin = 2, εout = 78.54, T = 298.15 K, 150 mM ionic strength, probe radius = 1.4 Å). Nonpolar contributions were calculated from SASA with a surface tension of γ = 0.0301 kJ·mol−1·Å−2 (equivalent to 0.0072 kcal·mol−1·Å−2, AMBER-PB4 standard). Entropy was not included. Data were visualized using GraphPad Prism 10.1.2 and Python 3.13.2.
Determination of Three-Dimensional (3D) Multicellular Tumor Spheroids (MCTSs) Model
PDFS cells were trypsinized, resuspended in a complete growth medium, and seeded at 800 cells/well (200 μL medium) in the low cell-adhesion treated PrimeSurface™ 96 U-bottom plates. (designated as pre-Day 0). When spheroid diameters reached 500 μm (pre-Day 3), half of the medium was replaced with fresh medium containing 10 μM PLB (designated as Day 0). Spheroid sizes were photographed daily from Day 0 to Day 7. On Day 7, live/dead cell staining was performed using Calcein AM/PI (Beyotime, China) according to the manufacturer’s protocol.
Construction of the PDFS Xenograft Tumor Model
BALB/C-nu nude mice were purchased from the Guangdong Medical Laboratory Animal Center. Male mice (aged 4–5 weeks, weighing 15–17 g) were randomly divided into five groups: vehicle group, TMZ group, PLB group, PLB+NK-252 group, and PLB+DFO group (n=6 per group). A mixture of 200 μL PDFS cells (1×10⁷ cells/100 μL) and Matrigel were subcutaneously injected into the right upper limb axilla of each mouse. When the tumor volume reached 100 mm3, mice in the PLB+NK-252 and PLB+DFO groups were pretreated with NK-252 (10 mg/kg) and DFO (50 mg/kg) 6 hours before intraperitoneal drug administration. All mice then received daily injections: the vehicle group received 200 μL of saline, while the TMZ and PLB groups were administered 5 mg/kg of TMZ and 5 mg/kg of PLB, respectively. Tumor volume was monitored daily for 14 days using the formula: (long diameter × short diameter2)/2. On day 15 post-transplantation, mice were euthanized, and tumor tissues were excised for analysis. All tumor tissue does not exceed the maximum size specified by this institution (volume not greater than 1500mm3). All procedures adhered to institutional animal ethics guidelines (Ethics Approval No. GDPULACSPF2022737) and were conducted in accordance with China’s national standards for laboratory animal welfare “Guideline for Ethical Review of Animal Welfare in Laboratory Animals” (GB/T 35892-2018).
H&E Staining
After euthanizing the mice, the heart, liver, spleen, lung, kidney and tumor were collected for further staining. The organs or tumors were fixed in a 4% paraformaldehyde solution. Following dehydration and paraffin embedding, tissue sections were prepared with a thickness of approximately 4–5 μm. These sections were then immersed in hematoxylin solution for 5 minutes, rinsed, stained with eosin solution for 1 minute, and rinsed again. Finally, the sections were mounted with neutral balsam and imaged under a microscope.
Statistical Analysis
The sample size n for each experiment is defined as the number of independent biological replicates. For in vivo studies, n is the number of individual mice; for in vitro experiments, n is the number of independent cultures, each derived from a separate experimental repeat. Technical replicates (eg, multiple wells of the same passage, multiple fields of view, repeated qPCR runs from the same RNA sample) were averaged to yield a single value per biological replicate and were not treated as independent observations. For datasets with n ≥ 5 independent replicates per group and meeting parametric assumptions, one‑way or two‑way ANOVA was performed, followed by Tukey’s post hoc test for all pairwise comparisons (family‑wise error rate controlled at α = 0.05). Data are presented as mean ± SD. For datasets with n < 5 independent replicates per group, parametric assumptions could not be reliably assessed due to the small sample size. Normality was assessed visually via histograms, and statistical significance was determined using two‑sided permutation tests with 10,000 resamples, using the mean difference between groups as the test statistic. P < 0.05 (based on the permutation distribution) was considered significant. For comparisons involving more than two groups, the Bonferroni correction was applied to the permutation‑derived p‑values to control for multiple comparisons. Additionally, for small-sample datasets (n < 5), mean differences between groups were calculated, and 95% confidence intervals were estimated using bootstrap resampling (10,000 iterations) and are reported in Supplementary Table S1. Data for these small‑sample datasets are also presented as mean ± SD.
For longitudinal data (tumor volume and body weight measured repeatedly in the same animals over time), when n ≥ 5, a two‑way repeated‑measures ANOVA was performed with Time as the within‑subject factor and Group as the between‑subject factor. Post hoc comparisons were conducted using Tukey’s test within the repeated‑measures framework. Endpoint tumor weight was analyzed using one-way ANOVA followed by Tukey’s post hoc test. For longitudinal datasets with n < 5 (eg, spheroid growth), a repeated-measures framework was applied, and statistical significance was assessed using permutation-based methods that preserve within-subject correlations. P < 0.05 was considered statistically significant. All analyses were performed using GraphPad Prism 9 and R software (v4.3.0).
Results
PLB Inhibits the Proliferation, Migration, and Invasion of PDFS Cells
CCK-8 assays revealed that the 24-h half-maximal inhibitory concentration (IC50) values of PLB for PDFS cells were 10.15 μM (Figure 1A). In contrast, the 24-h IC50 of PLB for GES1 cells was 26.19 μM (Figure 1A). The 24-h IC50 of temozolomide (TMZ) for PDFS cells was 874.4 μM (Figure 1B). In primary NFPA cells, the 24-h IC50 of PLB was 20 μM (Figure 1C). These results showed that PLB inhibited the viability of NFPA cells at lower concentrations than those required for GES1 cells or TMZ. The EdU assay revealed a dose-dependent reduction in EdU-positive cells after PLB treatment (Figure 1D). Colony formation assays showed a dose-dependent decrease in the number of PDFS cell colonies after PLB treatment (Figure 1E). To evaluate the impact of PLB on metastatic potential, wound healing and Transwell assays were performed. PLB treatment reduced PDFS cell migration compared to the DMSO control (Figure 1F). Similarly, the Transwell assay showed that PLB reduced the invasive capacity of PDFS cells in a dose-dependent manner (Figure 1G). In summary, PLB treatment inhibited the viability, proliferation, migration, and invasion of PDFS cells.
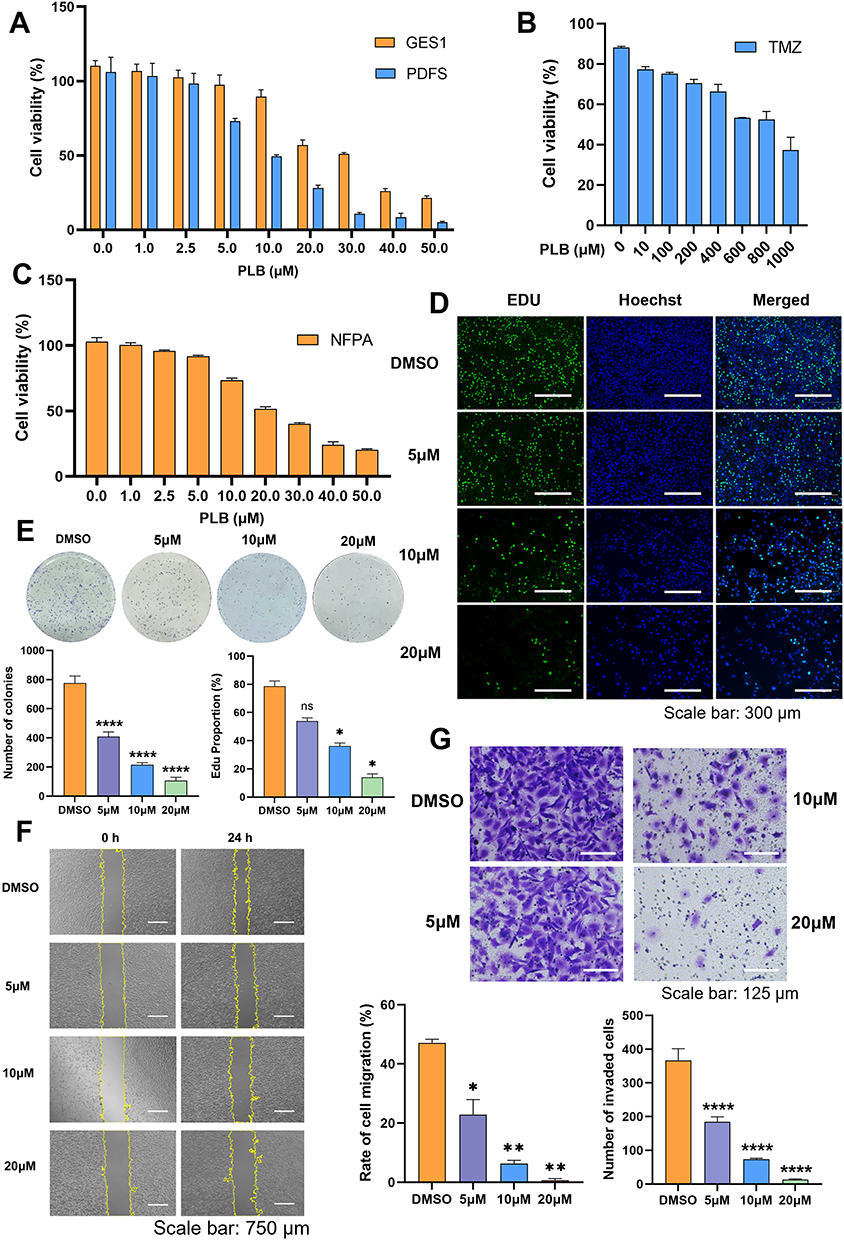 |
Figure 1 PLB selectively inhibits the viability, proliferation, migration, and invasion of pituitary adenoma cells. (A) CCK-8 assay showing the viability of PDFS cells after PLB treatment (n=5). (B) CCK-8 assay for TMZ-treated PDFS cells (n=5). (C) CCK-8 assay for PLB-treated NFPA cells (n=5). (D) The EdU-DNA synthesis assay evaluating cell proliferation (n=4). Scale bar: 300 μm. Quantification shows the percentage of EdU-positive PDFS cells. (E) Colony formation assay in PDFS cells (n=5). Colonies were counted using ImageJ. (F) Wound healing assay assessing PDFS cell migration (n=4). Scale bar: 750 μm. (G) Transwell invasion assay for PDFS cells (n=6). Scale bar: 125 μm. Data are presented as mean ± SD for experiments with n ≥ 5. For experiments with n=4, statistical significance was determined using two‑sided permutation tests (10,000 resamples); detailed permutation p‑values and 95% bootstrap confidence intervals are provided in Supplementary Table S1. *P < 0.05, **P < 0.01, ****P < 0.0001; ns, no statistical significance. |
Ferroptosis Is the Primary Mechanism of PLB-Induced PDFS Cell Death
To investigate the potential mechanisms of PLB action, GO and KEGG enrichment analyses were performed. GO analysis showed enrichment of target genes in biological processes related to cellular responses to ROS, cell cycle regulation, xenobiotic metabolic processes, oxidative stress detoxification, and glutathione metabolism. Cellular component analysis indicated localization of these genes to structures such as the nucleoplasm, cytoplasm, mitochondrial outer membrane, plasma membrane raft, and glutamatergic synapses. Molecular functions included iron ion binding, oxidoreductase activity, glutathione peroxidase activity, and epidermal growth factor receptor activity (Figure 2A). KEGG pathway analysis further revealed that PLB may be involved in regulating cell death by modulating ferroptosis (Figure 2B). To test the involvement of different cell death pathways, PDFS cells were treated with PLB in the presence or absence of specific inhibitors: the apoptosis inhibitor Z-VAD-FMK, the ferroptosis inhibitors DFO and Fer-1, and the autophagy inhibitor CQ, were used to target distinct cell death pathways. Z-VAD-FMK did not attenuate the cytotoxic effect of PLB, whereas DFO, Fer-1, and CQ partially restored cell viability, with DFO showing the greatest effect (Figure 3A). To further rule out the involvement of apoptosis, we assessed the expression of key apoptotic markers in PDFS cells following treatment. Western blot analysis revealed that PLB treatment did not induce expression of cleaved Caspase-3 and PARP across a range of concentrations (Figure 3B). These data indicate that PLB-induced cytotoxicity may not be mediated primarily through apoptosis and is attenuated by ferroptosis inhibitors.
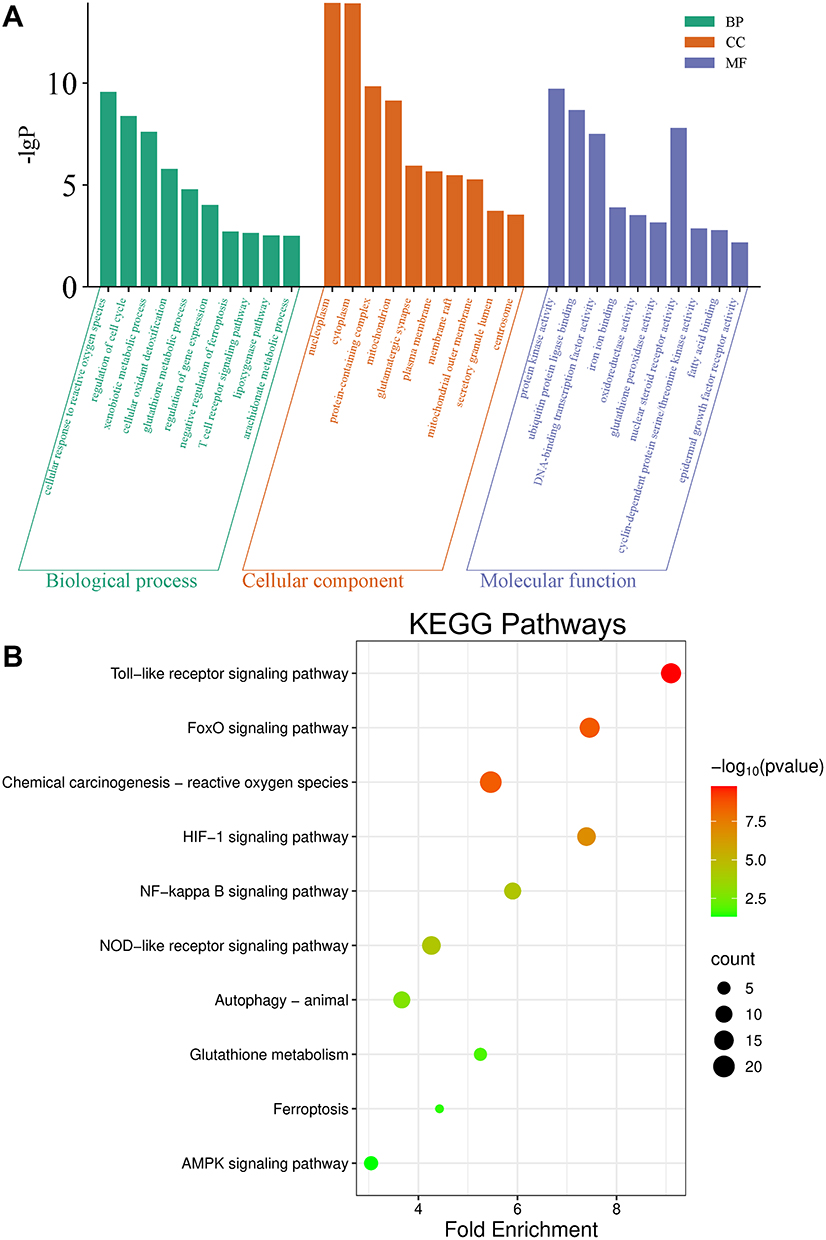 |
Figure 2 KEGG pathways enrichment and GO analysis in PLB-NFPA. (A) GO annotation categorizes differentially expressed proteins into three classes: cellular components, biological processes, and molecular functions. (B) KEGG enrichment analysis reveals pathways associated with PLB-treated PDFS cells. Left: enriched pathways; right: corresponding P-values and gene counts. |
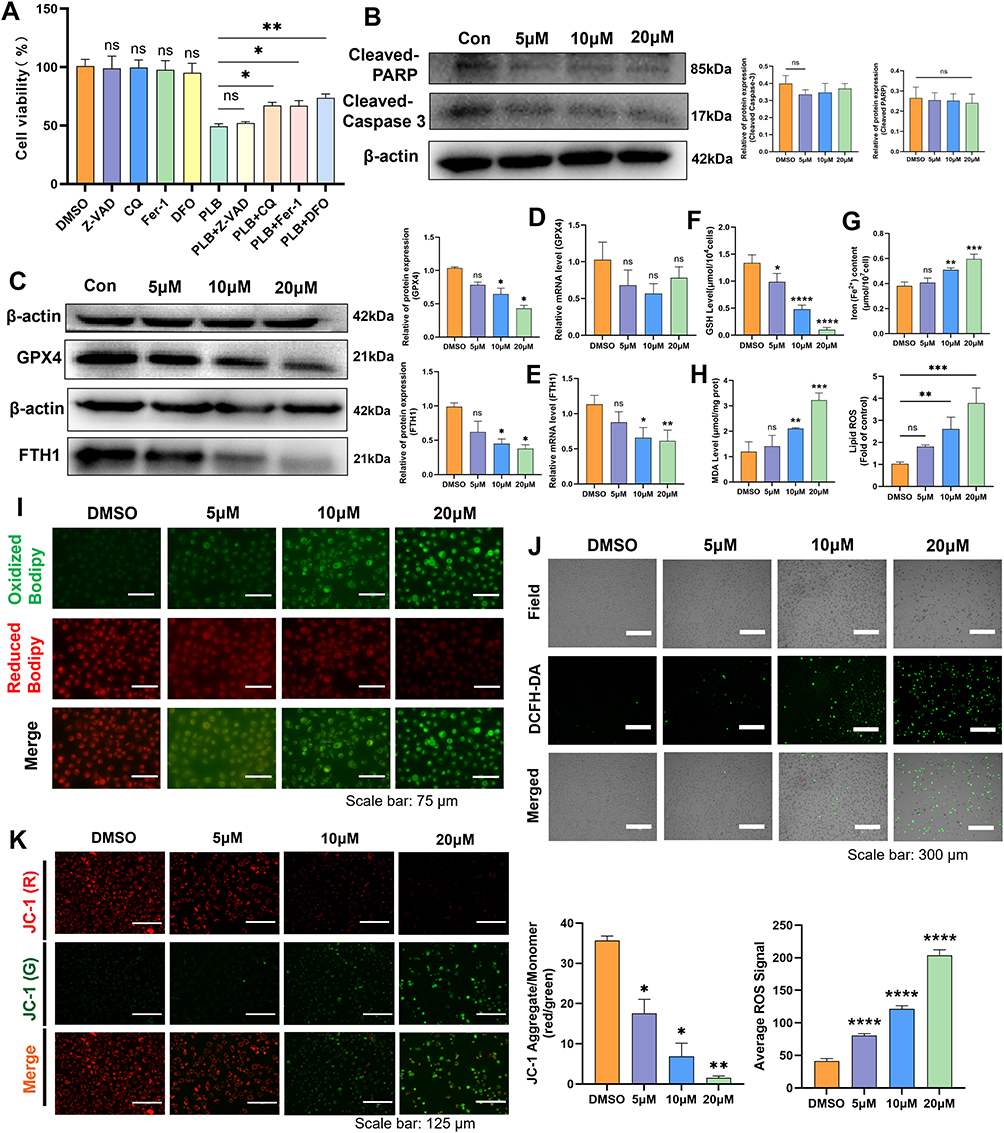 |
Figure 3 PLB triggers ferroptosis hallmarks in PDFS cells. (A) CCK-8 assay evaluating rescue effects of cell death inhibitors on PLB-treated PDFS cells, cells were pre‑treated with Fer‑1 (5 μM), DFO (15 μM), Z‑VAD‑FMK (10 μM), or CQ (25 μM) for 12 h before incubation with PLB (n=5). (B) The Western blot detected the protein expression of cleaved PARP and cleaved Caspase-3 (n=4). (C–E) Western blot (n=4) and q-PCR (n=6) examined the protein expression and mRNA levels of GPX4 and FTH1 after PLB treatment. (F–H) GSH, Fe2+, and MDA levels in PLB-treated PDFS cells (n=6). (I) C11 BODIPY 581/591 probe is used to measure the level of lipid peroxidation in cells. (n=5). Scale bar: 75 μm. (J) ROS fluorescence intensity in PLB-treated cells (n=5). Scale bar: 300 μm. (K) JC-1 staining showing MMP changes (n=4). Scale bar: 125 μm. Data are presented as mean ± SD for experiments with n ≥ 5. For experiments with n=4, statistical significance was determined using two-sided permutation tests (10,000 resamples); detailed permutation p-values and 95% bootstrap confidence intervals are provided in Supplementary Table S1. *P < 0.05, **P < 0.01, ***P < 0.001, ****P < 0.0001; ns, no statistical significance. |
Disruption of intracellular iron homeostasis and lipid peroxidation are the two primary pathways driving ferroptosis.27 The dynamic balance of iron in the cytosol mainly relies on the cytosolic iron uptake mechanism involved in the TFR, in conjunction with the transmembrane iron excretion process executed by FPN. Ferritin is a key protein involved in intracellular iron storage and undergoes hydrolysis to rapidly release free iron.28 Additionally, HO-1 catalyzes the conversion of heme to ferrous iron. In terms of lipid peroxidation, the SLC7A11/GPX4/FACL4 axis is a critical pathway mediating cellular oxidative stress.29,30 Western blot and q-PCR analysis showed that FTH1 expression decreased with increasing drug concentrations, although PLB reduced GPX4 protein expression; no significant changes were observed at the mRNA level (Figure 3C–E). However, the FACL4, SLC7A11, TFR, HO-1, and FPN protein levels remained unchanged (Figure S2A–E). PLB treatment dose-dependently reduced GSH levels (Figure 3F) and increased intracellular Fe2+ and lipid peroxidation levels (Figure 3G–I). ROS fluorescence intensity, measured using the DCFH-DA probe, increased proportionally with the PLB concentration (Figure 3J). Furthermore, during ferroptosis, MMP hyperpolarization induces lipid ROS generation and accumulation,31 which was reduced by PLB treatment (Figure 3K). Taken together, these observations are consistent with hallmarks of ferroptosis.
PLB Induces the Inhibition of the Nrf2/FTH1 Pathway
To further elucidate the mechanism of PLB-induced ferroptosis in PDFS cells, 352 PLB-related targets were identified using PharmMapper and other databases, alongside 1703 NFPA-associated targets from OMIM and related databases. After standardization using NCBI and UniProt, Venn analysis revealed 150 shared targets (Figure 4A). A PPI network was constructed using STRING v12.0, incorporating the ferroptosis regulators GPX4 and FTH1 along with the shared PLB-NFPA targets (Figure S3A). The PPI network showed interactions between a subset of 21 shared targets and key ferroptosis regulators (Figures 4B and S3B). Subsequent multi-algorithm analysis (MNC, EPC, Degree, Closeness, Betweenness, and Radiality) using the CytoHubba plugin identified Nrf2 as the sole transcription factor ranked highly by all six algorithms (Figure 4C). Molecular docking suggested that PLB had a relatively higher predicted binding affinity for FTH1 than for the other targets (Figure S4A–C and Table 1). Molecular docking of a PLB-Nrf2-FTH1 model indicated potential interactions (Figure 4D). Although PLB exhibits a binding affinity of −5.5 kcal/mol for GPX4, it does not target the catalytic Sec46 residue.32 Western blot and q-PCR analysis showed that PLB treatment downregulated Nrf2 expression at both the protein and mRNA levels (Figure 4E and F). Together with the observed downregulation of FTH1 (Figure 3C), these data implicate the Nrf2/FTH1 pathway in PLB’s action and support its selection for further investigation. This provided a basis for selecting the Nrf2/FTH1 pathway for subsequent mechanistic studies.
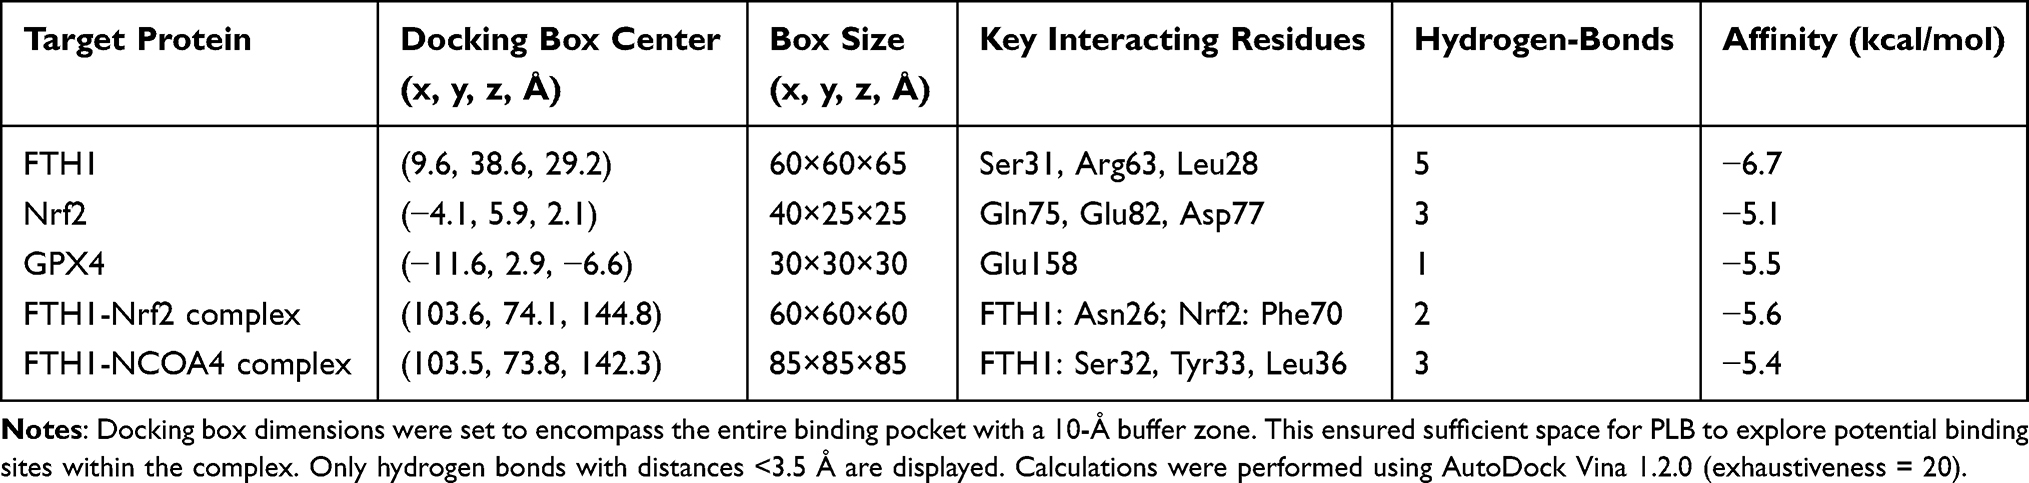 |
Table 1 Molecular Docking Results of PLB |
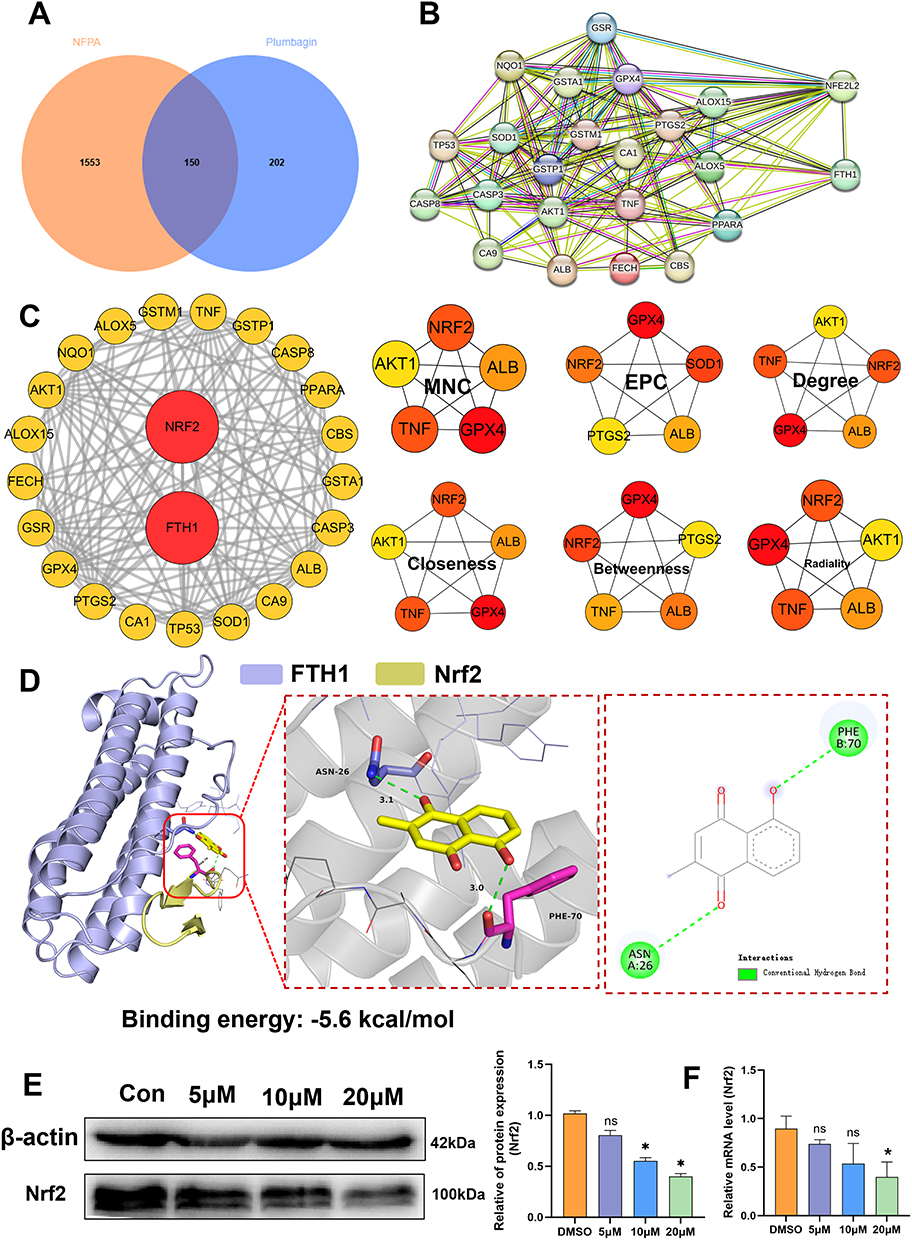 |
Figure 4 PLB-induced ferroptosis via Nrf2/FTH1 inhibition. (A) Venn diagram showing 150 overlapping targets between PLB (352 targets) and NFPA (1703 targets). (B) PPI network of 21 PLB-predicted targets and ferroptosis regulators. (C) Hub gene identification using six algorithms; Nrf2 (red nodes) ranked highest across all methods. (D) Molecular docking of PLB with the Nrf2/FTH1 complex (Nrf2: yellow; FTH1: purple). (E) Western blot (n=4) and (F) q-PCR showing Nrf2 downregulation in PLB-treated PDFS cells (n=6). Data are presented as mean ± SD for experiments with n ≥ 5. For experiments with n=4, statistical significance was determined using two-sided permutation tests (10,000 resamples); detailed permutation p-values and 95% bootstrap confidence intervals are provided in Supplementary Table S1. *P < 0.05; ns, no statistical significance. |
Molecular Dynamics Simulations of PLB with Nrf2 and FTH1
To evaluate the stability and interaction of PLB with Nrf2 and FTH1, we performed 100-ns molecular dynamics (MD) simulations followed by MM/PBSA binding free energy calculations. Both the PLB-Nrf2 and PLB-FTH1 complexes reached a state of dynamic equilibrium, as evidenced by stabilized root mean square deviation (RMSD) values after ~25 ns and ~20 ns, respectively (Figure 5A and B). Low residue fluctuations (RMSF), consistent radius of gyration (Rg), and stable solvent accessible surface area (SASA) profiles throughout the simulations were consistent with structural stability (Figure 5C–H). A hydrogen bond network was maintained throughout the simulations, with 2–5 bonds for the PLB-Nrf2 complex and 3–6 bonds for the PLB-FTH1 complex (Figure 5I and J).
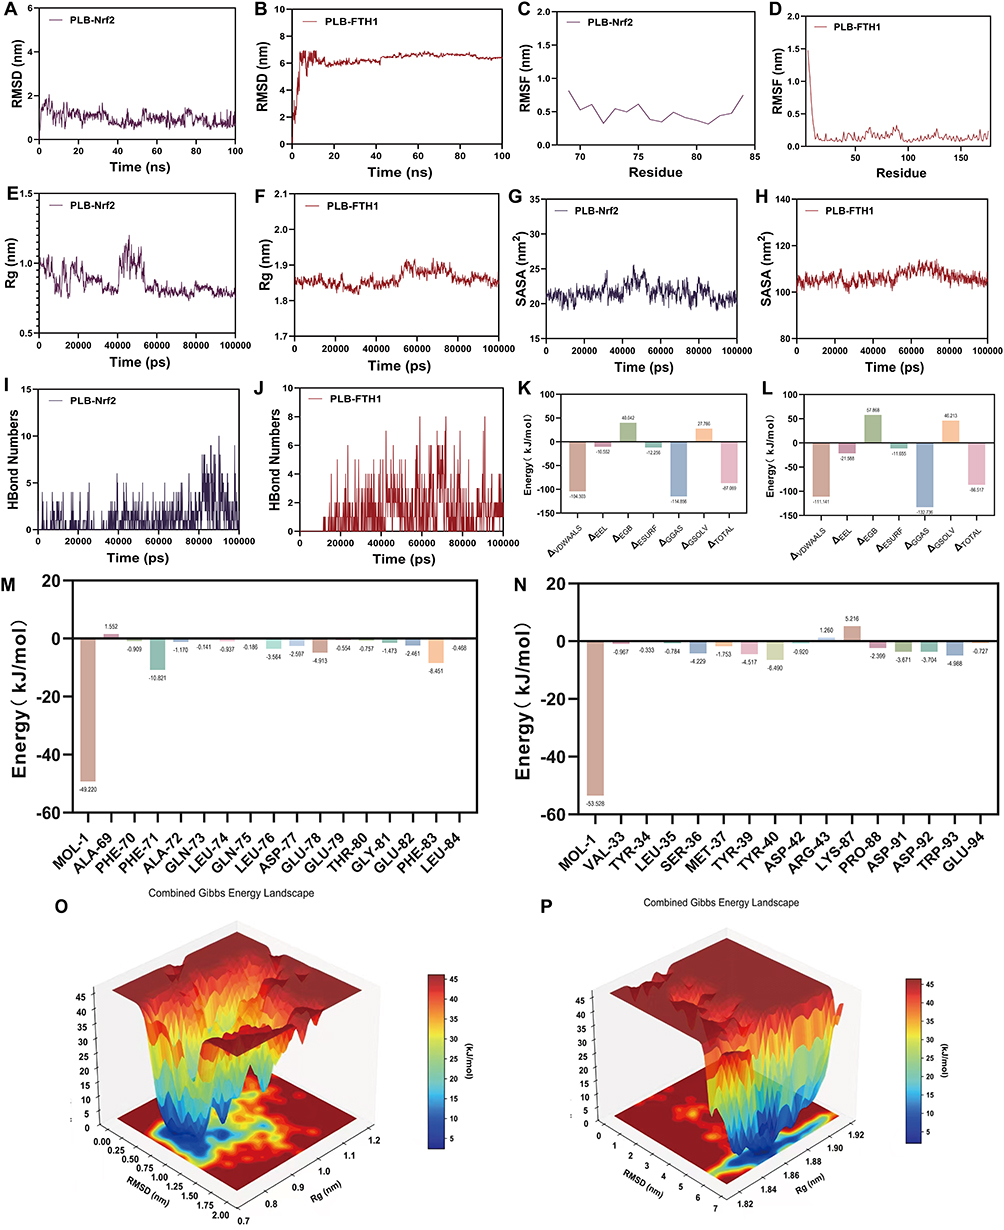 |
Figure 5 Molecular dynamics simulations of PLB with Nrf2 and FTH1, respectively. (A and B) RMSD of the PLB-Nrf2 and PLB-FTH1 complexes during the simulations. (C and D) RMSF analysis of the ligand-protein complexes. (E and F) Rg profiles of the ligand-protein complexes. (G and H) Changes in solvent accessible surface area. (I and J) The number of hydrogen bonds formed between the ligand and protein. (K and L) Total binding free energy and its constituent energy components calculated by the MM/PBSA method. (M and N) Binding free energy decomposition analysis for key residues. (O and P) Three-dimensional spatial conformations of the ligand-protein complexes. |
The MM/PBSA analysis revealed favorable binding free energies (ΔGtotal) of approximately −87.1 kJ/mol for PLB-Nrf2 and −86.5 kJ/mol for PLB-FTH1, suggesting spontaneous binding (Figure 5K and L). In both systems, van der Waals interactions and non-polar solvation energy were the major favorable contributors, while polar solvation energy disfavored binding. Electrostatic interactions provided a modest, favorable contribution to PLB-FTH1 binding.
Energy decomposition identified residues contributing substantially to the binding: PHE71, LEU76, GLU78, and PHE83 in Nrf2; and TYR40, SER36, TYR39, and TRP93 in FTH1, with TYR40 contributing approximately −6.5 kJ/mol (Figure 5M and N). Principal component analysis-derived free energy landscapes displayed single deep energy basins for both complexes, consistent with conformational convergence and stability during the simulations (Figure 5O and P).
PLB Induces Ferritinophagy-Mediated Ferroptosis in PDFS Cells by Downregulating Nrf2/FTH1
PLB downregulated the expression of Nrf2 and FTH1 (Figures 3C and 4E). To elucidate the mechanism linking PLB-induced ferroptosis to the Nrf2/FTH1 axis, functional validation was performed using the Nrf2-specific agonist, NK-252. Co-treatment with NK-252 reduced the loss of cell viability and the inhibition of colony formation caused by PLB, as shown by live/dead staining, CCK-8, and colony formation assays (Figure 6A–C). Lipid peroxidation levels were lower in cells co-treated with NK-252 and PLB than in cells treated with PLB alone (Figure 6D and E). Co-treatment with NK-252 was associated with reduced intracellular ROS levels and an attenuation of the loss in mitochondrial membrane potential (MMP) induced by PLB (Figure 6F and G). Western blot showed that NK-252 restored GPX4 and Nrf2 protein expression (Figure 6H) and reversed PLB-mediated suppression of Nrf2 and FTH1 mRNA (Figure 6I and J).
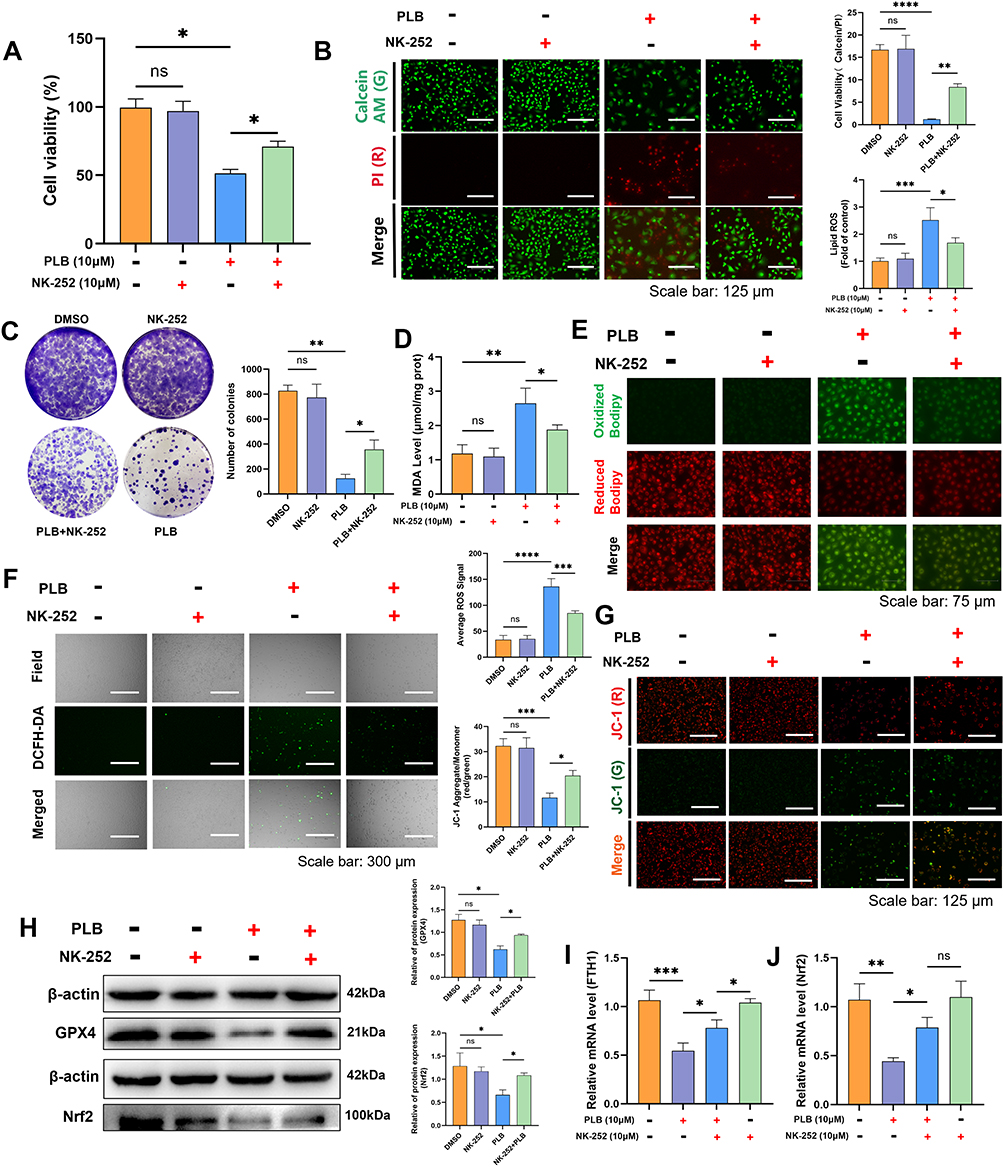 |
Figure 6 NK-252 rescues PLB-induced ferroptosis by activating the Nrf2/ FTH1 axis. (A) CCK-8 assay demonstrating that NK-252 reverses PLB-induced cell inactivation (n=4). NK‑252 (10 μM) was added 12 h prior to PLB treatment. (B) Live/dead cell staining showing NK-252 rescues PLB (10 μM)-induced cell death in PDFS cells (n=5). Scale bar: 125 μm. (C) Colony formation assay showing NK-252 (10 μM) restores PLB-suppressed proliferation (n=4). (D) NK-252 reduces PLB-elevated MDA levels (n=6). (E) C11 BODIPY 581/591 probe is used to measure the level of lipid peroxidation in cells (n=5). Scale bar: 75 μm. (F and G) NK-252 mitigates PLB-induced ROS accumulation and MMP depolarization (n=5). Scale bars: 300 μm (ROS), 125 μm (JC-1). (H) Western blot measurement of GPX4 and Nrf2 in PDFS cells treated with PLB and NK-252 (n=4). (I and J) q-PCR measurement of Nrf2 and FTH1 in PDFS cells treated with PLB and NK-252 (n=6). Data are presented as mean ± SD for experiments with n ≥ 5. For experiments with n=4, statistical significance was determined using two-sided permutation tests (10,000 resamples); detailed permutation p-values and 95% bootstrap confidence intervals are provided in Supplementary Table S1. *P < 0.05, **P < 0.01, ***P < 0.001, ****P < 0.0001; ns, no statistical significance. |
We next examined intracellular iron levels. Both NK-252 and the iron chelator DFO reduced the PLB-induced increases in Fe2+ and LIP levels (Figure 7A and B). In recent years, a newly identified pathway of ferroptosis has been associated with ferritin degradation and the induction of its selective cargo NCOA4. Molecular docking predicted an interaction between PLB and the FTH1-NCOA4 complex, with a calculated binding affinity of −5.4 kcal/mol (Figure 7C). The model suggested PLB could bind to FTH1 at residues Ser32, Tyr33, and Leu36. Western blot analysis showed that co-treatment with NK-252 or DFO increased FTH1 protein levels and decreased NCOA4 protein levels compared to PLB treatment alone (Figure 7D). Furthermore, co-treatment with NK-252 or DFO decreased the LC3II/LC3I ratio and increased the protein levels of p62 and LAMP-2 relative to PLB treatment alone (Figure 7E). Co-treatment with the autophagy inhibitor CQ also increased FTH1 and decreased NCOA4 protein levels compared to PLB treatment alone (Figure 7F).
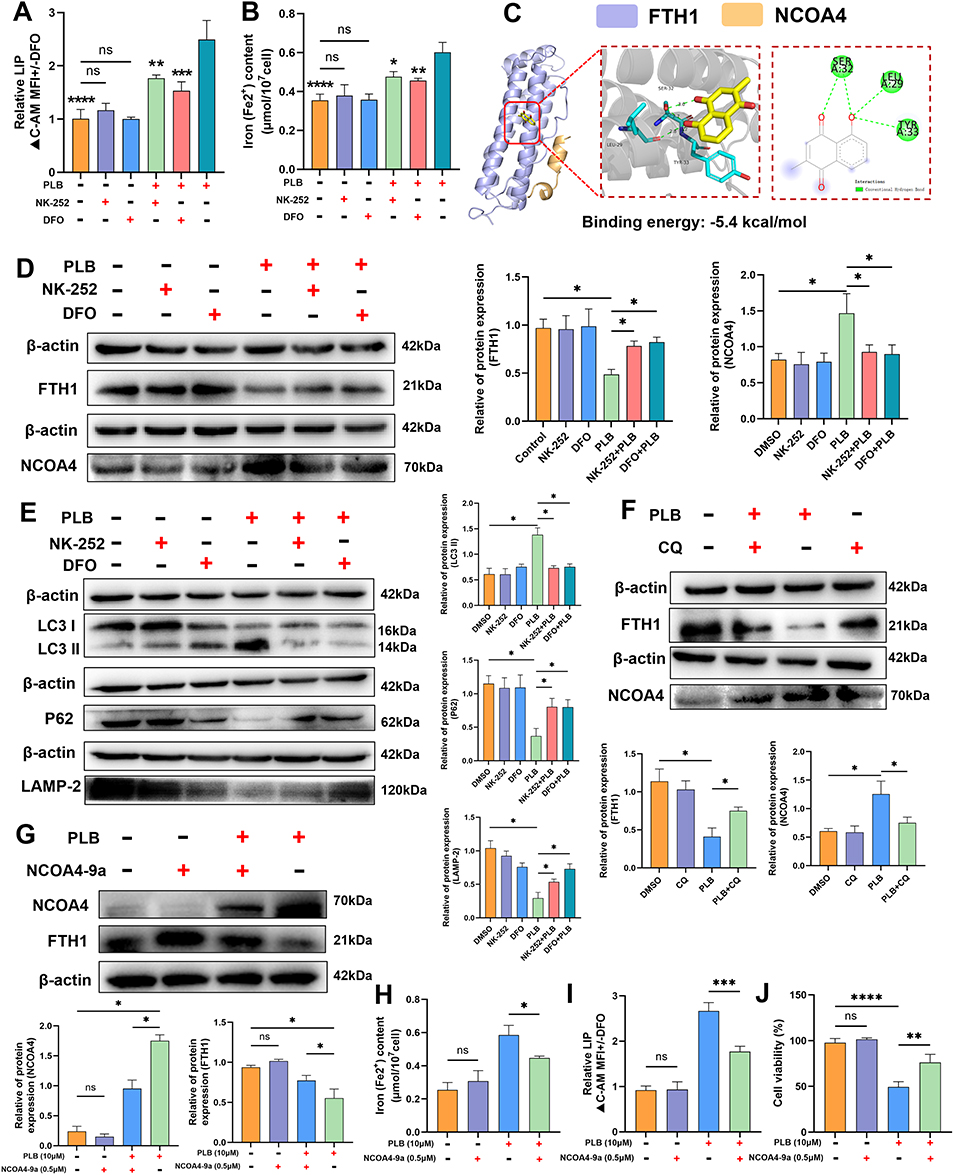 |
Figure 7 PLB induces ferritinophagy-mediated ferroptosis via Nrf2/ FTH1/ NCOA4 modulation. (A and B) NK-252 and DFO reduce PLB-induced LIP and Fe2+ levels (n=6). NK‑252 (10 μM) and DFO (50 μM) were added 12 h prior to PLB (10 μM) treatment. (C) Molecular docking of PLB with the FTH1-NCOA4 complex (NCOA4: Orange; FTH1: purple). (D) NK-252 and DFO reverse PLB-mediated FTH1 downregulation and NCOA4 upregulation (n=4). (E) NK-252 and DFO restore autophagy markers (LC3II/LC3I, p62, LAMP-2) (n=4). (F) CQ (25 μM) reverses FTH1 and NCOA4 expression in PLB-treated cells (n=4). (G) NCOA4-9a reverses FTH1 and NCOA4 expression in PLB-treated cells (n=4). NCOA4-9a (0.5 μM) was added 12 h prior to PLB treatment. (H and I) NCOA4-9a reduce PLB-induced Fe2+ and LIP levels (n=6). (J) Cell viability after addition of NCOA4-9a (n=6). Data are presented as mean ± SD for experiments with n ≥ 5. For experiments with n=4, statistical significance was determined using two-sided permutation tests (10,000 resamples); detailed permutation p-values and 95% bootstrap confidence intervals are provided in Supplementary Table S1. *P < 0.05, **P < 0.01, ***P < 0.001, ****P < 0.0001; ns, no statistical significance. |
To probe the role of NCOA4, we used the inhibitor NCOA4-9a, which disrupts the NCOA4-FTH1 interaction and has been validated to block ferritinophagy.33,34 Co-treatment with NCOA4-9a increased FTH1 protein levels (Figure 7G) and reduced the intracellular Fe2+ and LIP levels elevated by PLB (Figure 7H and I). It also increased the viability of PLB-treated cells (Figure 7J).
PLB Activity in Three-Dimensional (3D) Multicellular Tumor Spheroids (MCTSs) Model
The effect of PLB was further evaluated in three-dimensional multicellular tumor spheroids (MCTSs) generated from PDFS cells. MCTSs, which recapitulate the pathological and histological features of solid tumors, serve as surrogates for animal studies for lead drug development.35 Spheroids with an average diameter of 500 μm were treated with PLB alone or in combination with NK-252 or DFO. Subsequently, microscopic images of the tumor spheroids were taken every 24 h to monitor the change in tumor volume over seven days. As shown in Figure 8A–C, PLB treatment reduced spheroid growth over seven days. This reduction in growth was less pronounced when PLB was combined with NK-252 or DFO. Permutation-based repeated-measures analysis of spheroid growth trajectories is summarized in Supplementary Table S2. Cell viability within spheroids was assessed using calcein-AM and PI staining (Figure 8D). In PLB-treated spheroids, an increase in PI signal and a decrease in calcein-AM signal were observed compared to controls.
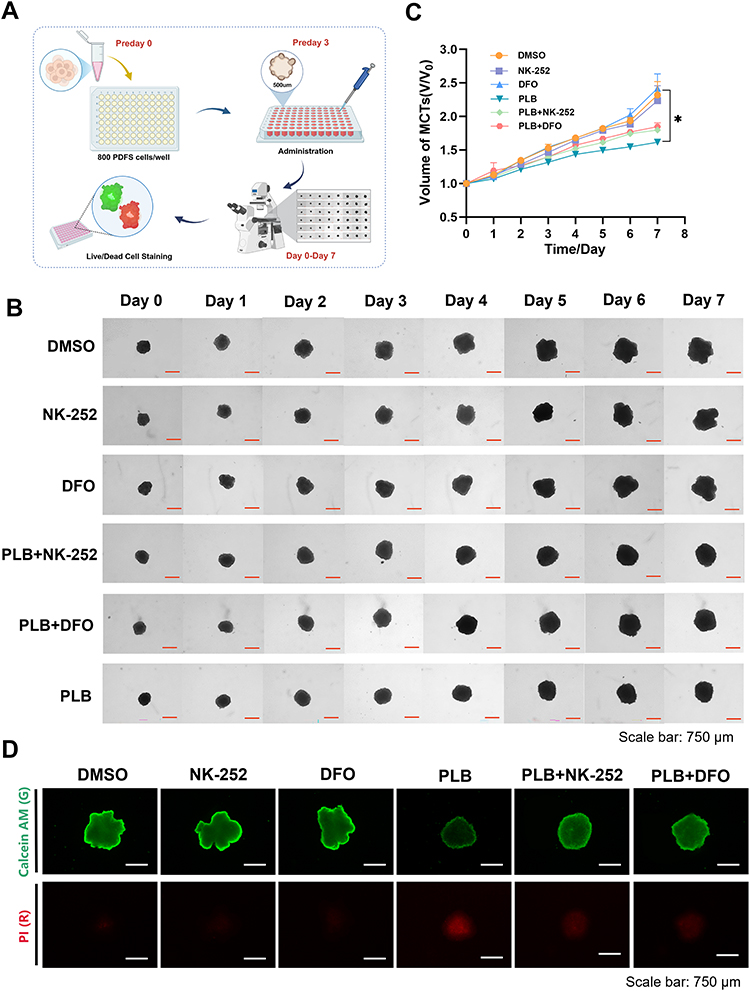 |
Figure 8 PLB suppresses tumor spheroid growth in the 3D MCTSs model. (A–C) Representative images and growth curves of PDFS MCTSs over seven days of treatment (n=4). Scale bar: 750 μm. (D) Calcein-AM and PI staining showing live (green) and dead (red) cells in PLB-treated MCTSs (n=4). Scale bar: 750 μm. Data are presented as mean ± SD. For spheroid growth over time, a repeated-measures framework was applied. Statistical significance was assessed using permutation-based methods with 10,000 resamples while preserving within-subject correlations. *P < 0.05. |
Effects of PLB on NFPA Xenograft Growth and Related Protein Expression
A xenograft model was established by subcutaneously inoculating PDFS cells into nude mice to evaluate the effects of PLB in vivo. Tumor-bearing mice were randomly assigned to five treatment groups when tumor volumes reached 100 mm3 and subsequently received daily intraperitoneal injections of PLB (5 mg/kg), NK-252 (10 mg/kg), DFO (50 mg/kg), TMZ (5 mg/kg), or an equivalent volume of saline for 14 consecutive days (Figure 9A). Compared to the vehicle group, PLB treatment reduced tumor growth, without affecting body weight. The reduction in tumor growth by PLB was less pronounced in mice co-treated with NK-252 or DFO (Figure 9B–E).
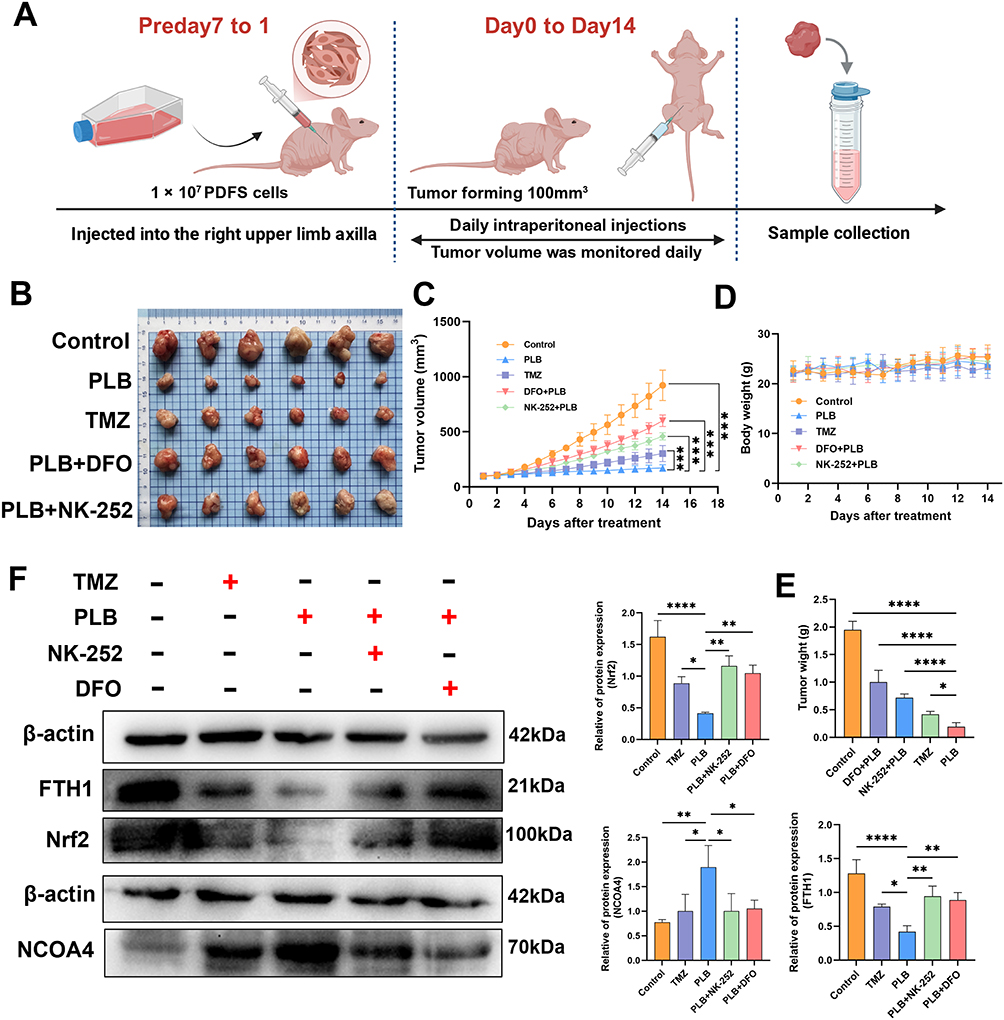 |
Figure 9 PLB suppresses tumor growth and induces ferroptosis in a PDFS xenograft mouse model. (A) The experimental timeline included a seven-day tumor induction phase in nude mice before drug administration followed by 14-day treatments with the vehicle, TMZ (5 mg/kg), PLB (5 mg/kg), PLB + NK-252 (10 mg/kg), or PLB + DFO (50 mg/kg) (n=6). (B) Representative tumor images (n=6). (C) Tumor volume curves (n=6). (D) Body weight changes (n=6). (E) Tumor weights (n=6). (F) Protein levels of Nrf2, FTH1, and NCOA4 (n=6). Data are presented as mean ± SD. Tumor volume and body weight were analyzed using two-way repeated-measures ANOVA. Endpoint tumor weight was analyzed using one-way ANOVA. *P < 0.05, **P < 0.01, ***P < 0.001, ****P < 0.0001. |
Protein expression was analyzed in tumor tissues by Western blot. PLB treatment decreased Nrf2 and FTH1 protein levels and increased NCOA4 protein levels. These changes in protein expression were attenuated in tumors from mice co-treated with NK-252 or DFO (Figure 9F).
H&E staining of tumor tissues revealed morphological changes indicative of cell death, such as nuclear condensation and karyorrhexis, in the PLB-treated group (Figure 10A). No obvious pathological changes were observed in major organs across all groups (Figure 10B).
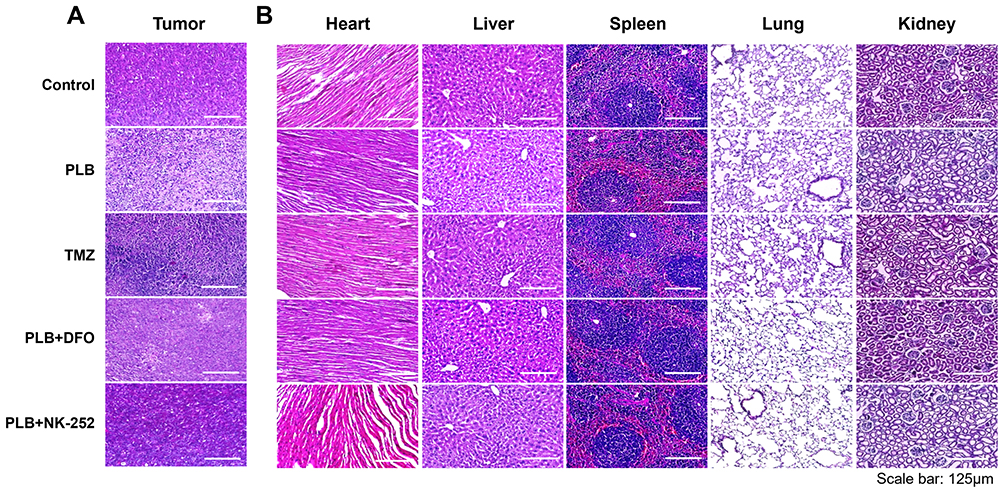 |
Figure 10 H&E staining of tumor-bearing tissues and major organs after PLB treatment. (A) H&E-staining of PDFS xenograft tumor tissues across experimental groups (n=4). (B) Representative H&E staining images of major organs in each group of mice (n=4). Scale bar: 125 μm. |
Discussion
NFPAs are among the most common intracranial tumors treated with neurosurgery. NFPAs are often macroadenomas during diagnosis and treatment, and some are invasive, and usually cause life-threatening symptoms, such as decreased visual acuity, visual field defects, pituitary hypoplasia, and obstructive hydrocephalus, due to the compression of surrounding structures by the large tumor mass.36 The main NFPA treatment method is transsphenoidal surgical resection; however, the rate of incomplete resection is high.37 Postoperative residual lesions have a high risk of recurrence without additional intervention,38 and follow-up data showed a residual rate of 46% at five years postoperatively.3 No approved drugs for NFPA are available, and although some studies have suggested that cabergoline has therapeutic potential, a recent meta-analysis showed that it is ineffective in 14% of NFPA cases, and additional intervention remains.4 In addition, TMZ, a first-line chemotherapeutic agent for pituitary carcinoma, has a lower response rate in NFPAs than in FPAs.39 Therefore, novel, safe, and effective therapeutic approaches are urgently needed.
PLB has been investigated for its anti-inflammatory and anti-tumor properties.40 Although its ability to induce cancer cell death has been confirmed, the molecular mechanism has not been fully elucidated. In this study, PLB inhibited PDFS cell viability at lower concentrations than TMZ. The study further explored the mechanisms by which PLB caused cell death. In previous studies, PLB-induced cell death was primarily characterized by apoptosis and necrosis.41 GPX4 is widely recognized as one of the most critical regulators of ferroptosis, working in concert with SLC7A11 to play a central role in suppressing lipid peroxidation.42,43 FACL4 is essential for lipid oxidation following GPX4/SLC7A11.44 However, in our study, PLB did not alter GPX4 mRNA levels in PDFS cells. Molecular docking suggested that PLB does not bind to the catalytic Sec46 residue of GPX4. Additionally, the protein expression levels of SLC7A11 and FACL4 were unaffected by PLB treatment. These observations suggest that PLB-induced ferroptosis in PDFS cells may not primarily rely on the canonical GPX4/SLC7A11/FACL4 axis, pointing to alternative mechanisms. Instead, our data indicate that PLB disrupts iron homeostasis in PDFS cells, increasing the LIP. This elevated iron likely contributes to ROS generation via the Fenton reaction, leading to lipid peroxidation and ferroptosis, a pathway supported by the attenuation of these effects with the iron chelator DFO.45
Nrf2 is a well-characterized transcription factor that regulates cellular antioxidant responses by binding to antioxidant response elements (AREs) in the promoters of target genes, including FTH1.46–48 Our data show that PLB treatment leads to coordinate downregulation of both Nrf2 and FTH1 at the mRNA and protein levels (Figures 3C, E and 4E, F). Importantly, the Nrf2 agonist NK-252 attenuated the downregulation of FTH1 mRNA and protein induced by PLB (Figures 6I, J and 7D), supporting a role for Nrf2 in regulating FTH1 expression in this context. Ferritin heavy chain 1 (FTH1) plays a key role in iron storage, sequestering free iron to maintain homeostasis. In contrast to proteins involved in iron uptake (eg, TFR) or export (eg, FPN),49,50 our data showed that PLB specifically downregulated FTH1 without affecting TFR or FPN levels. Therefore, PLB appears to disrupt iron homeostasis primarily through downregulation of FTH1, rather than by modulating TFR or FPN. These findings suggest that PLB may disrupt iron homeostasis mainly via suppression of the Nrf2/FTH1, leading to iron overload and lipid peroxidation, which contribute to ferroptosis execution in PDFS cells.
A complex relationship between ferroptosis and autophagy has been identified through multiple feedback pathways, including NCOA4-mediated ferritinophagy.33,51 NCOA4 mediates ferritinophagy by selectively recognizing and binding to FTH1 to form a complex.52 This process promotes ferritin entry into the autophagosome for the degradation and release of free iron.14 Therefore, NCOA4 expression levels are a key determinant of the extent of ferritinophagy degradation.52 Given that Nrf2 inhibition decreases FTH1, we investigated whether PLB also affects NCOA4, the cargo receptor for ferritinophagy. In our study, both NK-252 and DFO attenuated the PLB-induced increases in Fe2+ and LIP. Co-treatment with NK-252, DFO, or the autophagy inhibitor CQ increased FTH1 and decreased NCOA4 protein levels, and modulated markers of autophagic flux (LC3, p62, LAMP-2).
This study investigated the mechanisms of PLB-induced ferroptosis in NFPA. The study findings are consistent with the emerging evidence of effective anti-tumor strategies characterized by iron overload, lipid peroxidation, and ferritinophagy.53 Our data suggest that PLB downregulates the Nrf2/FTH1 axis, leading to increased lipid peroxidation and iron accumulation. The attenuation of PLB’s effects by the Nrf2 agonist NK-252 further underscores the involvement of this pathway. The molecular docking and functional assays suggest that PLB disrupts the transcriptional regulation of FTH1 by Nrf2, thereby promoting iron release and amplifying oxidative stress through ferritinophagy. The efficacy of PLB was further supported by its inhibitory effects in 3D spheroid and xenograft tumor models.
Conclusion
In conclusion, our study indicates that PLB induces ferroptosis in NFPAs by suppressing the Nrf2/FTH1 pathway. This suppression is associated with increased NCOA4 expression, iron overload, and lipid peroxidation, culminating in ferritinophagy-dependent cell death. These findings reveal a potential anti-tumor mechanism of PLB against pituitary adenoma. These findings elucidate a mechanism of ferroptosis induction through Nrf2/FTH1 pathway inhibition and ferritinophagy activation, presenting PLB as a potential candidate for NFPA treatment research. It is important to acknowledge certain limitations of this study. While our findings support the hypothesis that reducing the Nrf2/FTH1 axis may represent a potential therapeutic strategy for NFPA, we acknowledge that the current evidence is derived primarily from a single cell model. As such, the mechanistic conclusions presented here should be regarded as a well-supported mechanistic framework, rather than definitive causal proof. Furthermore, for some experiments with limited sample sizes (eg, n < 5), such as the Western blot analyses. To derive statistically meaningful insights from these preliminary datasets while adhering to rigorous analytical standards, we employed permutation tests with 10,000 resamples to assess significance. This resampling approach does not rely on assumptions of normal distribution, making it suitable for small-sample comparisons. Additionally, bootstrapping was used to estimate the 95% confidence intervals for mean differences, providing a robust measure of effect size uncertainty. In future work, increasing the sample size and incorporating additional experimental replicates will be prioritized to enhance the statistical power, robustness, and reproducibility of the findings. While the mechanistic insights are supported by multi-modal evidence, they would benefit from future genetic perturbation studies to establish direct causality. These aspects will be the focus of our subsequent investigations.
Abbreviations
CCK-8, Cell Counting Assay Kit-8; CQ, Chloroquine; DMSO, Dimethyl sulfoxide; DFO, Deferoxamine mesylate; Fer-1, Ferrostatin-1; FTH1, Ferritin Heavy Chain 1; FACL4, Long-chain acyl-CoA synthetase 4; FPN, Ferroportin; GPX4, glutathione peroxidase 4; GSH, Glutathione; H&E, Hematoxylin and Eosin; HO-1, Heme Oxygenase 1; LIP, Labile Iron Pool; MDA, Malondialdehyde; MMP, Mitochondrial Membrane Potential; Nrf2, Nuclear Factor Erythroid 2/Related Factor 2; NCOA4, Nuclear Receptor Coactivator 4; NFPAs, Nonfunctioning pituitary adenomas; PLB, Plumbagin; PDFS, Pituitary-Derived Folliculostellate; ROS, Reactive oxygen species; SLC7A11, Solute carrier family 7 member 11; TFR, Transferrin receptor protein 1; TMZ, Temozolomide.
Data Sharing Statement
Data will be made available on request.
Ethical Approval
Three human nonfunctioning pituitary adenoma specimens were collected from The Sixth Affiliated Hospital of Sun Yat-sen University with informed consent obtained from the donor. All procedures were approved by the Institutional Ethics Committee of the Sixth Affiliated Hospital of Sun Yat-sen University (Ethics Approval No. L2025ZSLYEC-422). All procedures adhered to institutional animal ethics guidelines (Ethics Approval No. GDPULACSPF2022737). Guangdong Pharmaceutical University (Guangzhou, China).
Author Contributions
Dong Fan and Zongming Wang should be considered co-first authors. All authors made a significant contribution to the work reported, whether that is in the conception, study design, execution, acquisition of data, analysis and interpretation, or in all these areas; took part in drafting, revising or critically reviewing the article; gave final approval of the version to be published; have agreed on the journal to which the article has been submitted; and agree to be accountable for all aspects of the work.
Funding
This study was funded by the National Natural Science Foundation of China for Young Scholars [grant number 81802678], the Guangdong Province Administration of Traditional Chinese Medicine Project [grant number 20231210], the Medical Scientific Research Foundation of the Guangdong Province of China [grant number B2024062], Key Clinical Technique of Guangzhou [grant number 2023P-ZD18] and Guangdong Medical Association Clinical Research Special Fund [No.2024HY-A6003].
Disclosure
The authors declare that there are no conflicts of interest in this work.
References
1. Zhang F, Zhang Q, Zhu J, et al. Integrated proteogenomic characterization across major histological types of pituitary neuroendocrine tumors. Cell Res. 2022;32(12):1047–24. doi:10.1038/s41422-022-00736-5
2. Tritos NA, Miller KK. Diagnosis and management of pituitary adenomas: a review. JAMA. 2023;329(16):1386–1398. doi:10.1001/jama.2023.5444
3. Chen Y, Wang CD, Su ZP, et al. Natural history of postoperative nonfunctioning pituitary adenomas: a systematic review and meta-analysis. Neuroendocrinology. 2012;96(4):333–342. doi:10.1159/000339823
4. Botelho MS, Franzini ÍA, Nunes-Nogueira VDS, Boguszewski CL. Treatment of non-functioning pituitary adenoma with cabergoline: a systematic review and meta-analysis. Pituitary. 2022;25(6):810–818. doi:10.1007/s11102-022-01257-5
5. Dixon SJ, Lemberg KM, Lamprecht MR, et al. Ferroptosis: an iron-dependent form of nonapoptotic cell death. Cell. 2012;149(5):1060–1072. doi:10.1016/j.cell.2012.03.042
6. Zhang C, Liu X, Jin S, Chen Y, Guo R. Ferroptosis in cancer therapy: a novel approach to reversing drug resistance. Mol Cancer. 2022;21(1):47. doi:10.1186/s12943-022-01530-y
7. Zheng H, Liu J, Cheng Q, et al. Targeted activation of ferroptosis in colorectal cancer via LGR4 targeting overcomes acquired drug resistance. Nat Cancer. 2024;5(4):572–589. doi:10.1038/s43018-023-00715-8
8. Shi M, Li X, Guo Y, et al. Gaudichaudione H enhances the sensitivity of hepatocellular carcinoma cells to disulfidptosis via regulating NRF2-SLC7A11 signaling pathway. Adv Sci. 2025;12(11):e2411131. doi:10.1002/advs.202411131
9. Wu X, Zhao L, Yu Z, Zhang K. Buddlejasaponin IVb Alleviates DSS-induced ulcerative colitis through the Nrf2/GPX4 pathway and gut microbiota modulation. J Agric Food Chem. 2024;72(42):23183–23195. doi:10.1021/acs.jafc.4c02069
10. Dodson M, Castro-Portuguez R, Zhang DD. NRF2 plays a critical role in mitigating lipid peroxidation and ferroptosis. Redox Biol. 2019;23:101107. doi:10.1016/j.redox.2019.101107
11. Wang Y, Yang T, Li Q, et al. circASAP1 induces renal clear cell carcinoma ferroptosis by binding to HNRNPC and thereby regulating GPX4. Mol Cancer. 2025;24(1):1. doi:10.1186/s12943-024-02122-8
12. Zhang Y, Yao R, Li M, et al. CircTTC13 promotes sorafenib resistance in hepatocellular carcinoma through the inhibition of ferroptosis by targeting the miR-513a-5p/SLC7A11 axis. Mol Cancer. 2025;24(1):32. doi:10.1186/s12943-024-02224-3
13. Qi R, Bai Y, Li K, et al. Cancer-associated fibroblasts suppress ferroptosis and induce gemcitabine resistance in pancreatic cancer cells by secreting exosome-derived ACSL4-targeting miRNAs. Drug Resist Updat. 2023;68:100960. doi:10.1016/j.drup.2023.100960
14. Dowdle WE, Nyfeler B, Nagel J, et al. Selective VPS34 inhibitor blocks autophagy and uncovers a role for NCOA4 in ferritin degradation and iron homeostasis in vivo. Nat Cell Biol. 2014;16(11):1069–1079. doi:10.1038/ncb3053
15. Xu M, Zhong W, Yang C, et al. Tiliroside disrupted iron homeostasis and induced ferroptosis via directly targeting calpain-2 in pancreatic cancer cells. Phytomedicine. 2024;127:155392. doi:10.1016/j.phymed.2024.155392
16. Fuhrmann DC, Mondorf A, Beifuß J, Jung M, Brüne B. Hypoxia inhibits ferritinophagy, increases mitochondrial ferritin, and protects from ferroptosis. Redox Biol. 2020;36:101670. doi:10.1016/j.redox.2020.101670
17. Xiong M, Wang M, Liu X, et al. Quercetin inhibits oligodendrocytes ferroptosis by blocking NCOA4-mediated ferritinophagy. Int Immunopharmacol. 2025;150:114152. doi:10.1016/j.intimp.2025.114152
18. Wang Y, Pang B, Zhang R, Fu Y, Pang Q. Ubenimex induces apoptotic and autophagic cell death in rat GH3 and MMQ cells through the ROS/ERK pathway. Drug Des Devel Ther. 2019;13:3217–3228. doi:10.2147/dddt.S218371
19. Ortiz-Pérez E, Rivera G, Salas CO, et al. Natural and synthetic naphthoquinones as potential anti-infective agents. Curr Top Med Chem. 2021;21(22):2046–2069. doi:10.2174/1568026621666210915121348
20. Liang Y, Zhou R, Liang X, Kong X, Yang B. Pharmacological targets and molecular mechanisms of plumbagin to treat colorectal cancer: a systematic pharmacology study. Eur J Pharmacol. 2020;881:173227. doi:10.1016/j.ejphar.2020.173227
21. Zhan S, Lu L, Pan SS, et al. Targeting NQO1/GPX4-mediated ferroptosis by plumbagin suppresses in vitro and in vivo glioma growth. Br J Cancer. 2022;127(2):364–376. doi:10.1038/s41416-022-01800-y
22. Danila DC, Zhang X, Zhou Y, et al. A human pituitary tumor-derived folliculostellate cell line. J Clin Endocrinol Metab. 2000;85(3):1180–1187. doi:10.1210/jcem.85.3.6424
23. Zhu Z, Cui W, Zhu D, Gao N, Zhu Y. Common tools for pituitary adenomas research: cell lines and primary cells. Pituitary. 2020;23(2):182–188. doi:10.1007/s11102-019-01003-4
24. Zhao W, Jiang X, Weisenthal K, et al. High histone deacetylase 2/3 expression in non-functioning pituitary tumors. Front Oncol. 2022;12:875122. doi:10.3389/fonc.2022.875122
25. Tang Z, Jiang W, Mao M, Zhao J, Chen J, Cheng N. Deubiquitinase USP35 modulates ferroptosis in lung cancer via targeting ferroportin. Clin Transl Med. 2021;11(4):e390. doi:10.1002/ctm2.390
26. Huang da W, Sherman BT, Lempicki RA. Systematic and integrative analysis of large gene lists using DAVID bioinformatics resources. Nat Protoc. 2009;4(1):44–57. doi:10.1038/nprot.2008.211
27. Zeng F, Nijiati S, Tang L, Ye J, Zhou Z, Chen X. Ferroptosis detection: from approaches to applications. Angew Chem Int Ed Engl. 2023;62(35):e202300379. doi:10.1002/anie.202300379
28. Li K, Chen B, Xu A, et al. TRIM7 modulates NCOA4-mediated ferritinophagy and ferroptosis in glioblastoma cells. Redox Biol. 2022;56:102451. doi:10.1016/j.redox.2022.102451
29. Wen RJ, Dong X, Zhuang HW, et al. Baicalin induces ferroptosis in osteosarcomas through a novel Nrf2/xCT/GPX4 regulatory axis. Phytomedicine. 2023;116:154881. doi:10.1016/j.phymed.2023.154881
30. Huang J, Xie H, Yang Y, et al. The role of ferroptosis and endoplasmic reticulum stress in intermittent hypoxia-induced myocardial injury. Sleep Breath. 2023;27(3):1005–1011. doi:10.1007/s11325-022-02692-1
31. Liu Y, Lu S, Wu LL, Yang L, Yang L, Wang J. The diversified role of mitochondria in ferroptosis in cancer. Cell Death Dis. 2023;14(8):519. doi:10.1038/s41419-023-06045-y
32. Moosmayer D, Hilpmann A, Hoffmann J, et al. Crystal structures of the selenoprotein glutathione peroxidase 4 in its apo form and in complex with the covalently bound inhibitor ML162. Acta Crystallogr D Struct Biol. 2021;77(Pt 2):237–248. doi:10.1107/s2059798320016125
33. Fang Y, Chen X, Tan Q, Zhou H, Xu J, Gu Q. Inhibiting ferroptosis through disrupting the NCOA4-FTH1 interaction: a new mechanism of action. ACS Cent Sci. 2021;7(6):980–989. doi:10.1021/acscentsci.0c01592
34. Liu L, Li D, Zhou Z, et al. Inhibition of NCOA4/FTH1-mediated ferritinophagy attenuates ferroptosis in PDLCs and alleviates orthodontically induced inflammatory root resorption. Prog Orthod. 2025;26(1):43. doi:10.1186/s40510-025-00590-2
35. Patel T, Jain N. Multicellular tumor spheroids: a convenient in vitro model for translational cancer research. Life Sci. 2024;358:123184. doi:10.1016/j.lfs.2024.123184
36. Brownlee BP, Mann D, Glenn C, McKinney KA. Nonfunctioning Pituitary Lesions. Otolaryngol Clin North Am. 2022;55(2):343–350. doi:10.1016/j.otc.2021.12.015
37. Wang Z, Wei L, Lin J, et al. Donor-acceptor-donor strategy rouses the photodynamic therapy anticancer activity of a Bis-terpyridyl Ru(II) complex. J Med Chem. 2024;67(15):13435–13445. doi:10.1021/acs.jmedchem.4c01307
38. McCormack A, Dekkers OM, Petersenn S, et al. Treatment of aggressive pituitary tumours and carcinomas: results of a European Society of Endocrinology (ESE) survey 2016. Eur J Endocrinol. 2018;178(3):265–276. doi:10.1530/eje-17-0933
39. Burman P, Trouillas J, Losa M, et al. Aggressive pituitary tumours and carcinomas, characteristics and management of 171 patients. Eur J Endocrinol. 2022;187(4):593–605. doi:10.1530/eje-22-0440
40. Roy A. Plumbagin: a potential anti-cancer compound. Mini Rev Med Chem. 2021;21(6):731–737. doi:10.2174/1389557520666201116144421
41. Li T, Lv M, Chen X, Yu Y, Zang G, Tang Z. Plumbagin inhibits proliferation and induces apoptosis of hepatocellular carcinoma by downregulating the expression of SIVA. Drug Des Devel Ther. 2019;13:1289–1300. doi:10.2147/dddt.S200610
42. Li H, Sun Y, Yao Y, et al. USP8-governed GPX4 homeostasis orchestrates ferroptosis and cancer immunotherapy. Proc Natl Acad Sci U S A. 2024;121(16):e2315541121. doi:10.1073/pnas.2315541121
43. Xu Z, Wang Y, Yang W, et al. Total extracts from Abelmoschus manihot (L.) alleviate radiation-induced cardiomyocyte ferroptosis via regulating redox imbalances mediated by the NOX4/xCT/GPX4 axis. J Ethnopharmacol. 2024;334:118582. doi:10.1016/j.jep.2024.118582
44. Doll S, Proneth B, Tyurina YY, et al. ACSL4 dictates ferroptosis sensitivity by shaping cellular lipid composition. Nat Chem Biol. 2017;13(1):91–98. doi:10.1038/nchembio.2239
45. Sandech N, Yang MC, Juntranggoor P, et al. Benja-ummarit induces ferroptosis with cell ballooning feature through ROS and iron-dependent pathway in hepatocellular carcinoma. J Ethnopharmacol. 2024;335:118672. doi:10.1016/j.jep.2024.118672
46. Wang X, Tomso DJ, Chorley BN, et al. Identification of polymorphic antioxidant response elements in the human genome. Hum Mol Genet. 2007;16(10):1188–1200. doi:10.1093/hmg/ddm066
47. Wei R, Zhao Y, Wang J, et al. Tagitinin C induces ferroptosis through PERK-Nrf2-HO-1 signaling pathway in colorectal cancer cells. Int J Biol Sci. 2021;17(11):2703–2717. doi:10.7150/ijbs.59404
48. Agyeman AS, Chaerkady R, Shaw PG, et al. Transcriptomic and proteomic profiling of KEAP1 disrupted and sulforaphane-treated human breast epithelial cells reveals common expression profiles. Breast Cancer Res Treat. 2012;132(1):175–187. doi:10.1007/s10549-011-1536-9
49. Dutt S, Hamza I, Bartnikas TB. Molecular mechanisms of iron and heme metabolism. Annu Rev Nutr. 2022;42:311–335. doi:10.1146/annurev-nutr-062320-112625
50. Cheng H, Wang P, Wang N, et al. Neuroprotection of NRF2 against ferroptosis after traumatic brain injury in mice. Antioxidants. 2023;12(3):731. doi:10.3390/antiox12030731
51. Hou W, Xie Y, Song X, et al. Autophagy promotes ferroptosis by degradation of ferritin. Autophagy. 2016;12(8):1425–1428. doi:10.1080/15548627.2016.1187366
52. Mancias JD, Wang X, Gygi SP, Harper JW, Kimmelman AC. Quantitative proteomics identifies NCOA4 as the cargo receptor mediating ferritinophagy. Nature. 2014;509(7498):105–109. doi:10.1038/nature13148
53. Shao N, Yu H, Li X, et al. Ferritinophagy and organ injury. Autophagy. 2026:1–15. doi:10.1080/15548627.2026.2633246
 © 2026 The Author(s). This work is published and licensed by Dove Medical Press Limited. The
full terms of this license are available at https://www.dovepress.com/terms
and incorporate the Creative Commons Attribution
- Non Commercial (unported, 4.0) License.
By accessing the work you hereby accept the Terms. Non-commercial uses of the work are permitted
without any further permission from Dove Medical Press Limited, provided the work is properly
attributed. For permission for commercial use of this work, please see paragraphs 4.2 and 5 of our Terms.
© 2026 The Author(s). This work is published and licensed by Dove Medical Press Limited. The
full terms of this license are available at https://www.dovepress.com/terms
and incorporate the Creative Commons Attribution
- Non Commercial (unported, 4.0) License.
By accessing the work you hereby accept the Terms. Non-commercial uses of the work are permitted
without any further permission from Dove Medical Press Limited, provided the work is properly
attributed. For permission for commercial use of this work, please see paragraphs 4.2 and 5 of our Terms.
Recommended articles
Eleutheroside E Attenuates Hypobaric Hypoxia-Induced High Altitude Pulmonary Edema by Regulating Ferritinophagy-Mediated Ferroptosis via Keap1-Nrf2 Regulatory Axis
Wang Y, Jia N, Shen Z, Zhao S, Pei C, Huang D, Wang Z
Journal of Inflammation Research 2026, 19:577574
Published Date: 5 May 2026