Back to Journals » Diabetes, Metabolic Syndrome and Obesity » Volume 18
Pituitary-Thyroid Hormones and Related Indices in Euthyroid Type 2 Diabetes: Association With Thyroid Nodules
Authors Ji B, Shi S, Zhao H, Ma X, Sheng J, Ban B ![]() , Gao G
, Gao G ![]()
Received 7 November 2024
Accepted for publication 13 February 2025
Published 27 February 2025 Volume 2025:18 Pages 627—636
DOI https://doi.org/10.2147/DMSO.S503444
Checked for plagiarism Yes
Review by Single anonymous peer review
Peer reviewer comments 2
Editor who approved publication: Dr Rebecca Baqiyyah Conway
Baolan Ji,1,* Shuwei Shi,1,2,* Hongyan Zhao,1,2 Xuan Ma,1,2 Jie Sheng,1,2 Bo Ban,3 Guanqi Gao1
1Department of Endocrinology, Linyi People’s Hospital, Linyi, Shandong, 276034, People’s Republic of China; 2School of Clinical Medicine, Shandong second Medical University, Weifang, Shandong, 261000, People’s Republic of China; 3Department of Endocrinology, Affiliated Hospital of Jining Medical University, Jining, Shandong, 272029, People’s Republic of China
*These authors contributed equally to this work
Correspondence: Guanqi Gao, Department of Endocrinology, Linyi People’s Hospital, North Side of the Intersection of Wohushan Road and Wuhan Road in Lanshan District, Linyi, Shandong, 276034, People’s Republic of China, Email [email protected] Bo Ban, Department of Endocrinology, Affiliated Hospital of Jining Medical University, 89 Guhuai Road, Jining, Shandong, 272029, People’s Republic of China, Email [email protected]
Aim: Diabetes is an independent risk factor for thyroid nodules (TNs), however, the influencing factors of TNs have not been fully clarified under the condition of diabetes. Previous studies have shown a connection between pituitary-thyroid hormone (TH) functions and TNs in different populations. However, the potential link in euthyroid patients with diabetes is unclear. We aimed to explore the correlates of TNs in euthyroid type 2 diabetes (T2D) patients.
Methods: This cross-sectional study included 1965 euthyroid adults with T2D. Clinical and biochemical data, including TH and relevant covariates were collected. TNs were evaluated using ultrasound. Univariate and multivariate logistic regression analyses were performed to identify factors associated with TNs, with analyses stratified by sex.
Results: The overall prevalence of TNs was 51.9%. The prevalence of TNs was higher in females. Stratified by sex, the results from univariate and further logistic regression analyses showed that free triiodothyronine (FT3) (OR: 1.381; 95% CI: 1.066– 1.790) and thyroid-stimulating hormone index (TSHI) (OR: 0.740; 95% CI: 0.584– 0.937) were independently correlated with TNs only in females, while no TH-related indicators entered the regression model in males.
Conclusion: The relationship between TH and related indices with TNs exhibited sex differences. Specifically, FT3 and TSHI were independently associated with TNs in females. These findings underscore the importance of evaluating TH and related indices for early monitoring and management of TNs, particularly in euthyroid female T2D patients.
Keywords: pituitary-thyroid hormone, type 2 diabetes, thyroid nodules, correlates
Introduction
In recent years, the detection rates of thyroid nodules (TNs) have increased rapidly.1 TNs are more prevalent in type 2 diabetes (T2D) patients compared to the general population,2,3 suggesting a complex relationship that warrants further investigation. Additionally, TNs are associated with malignancy risk and adverse impacts on mental health.4,5 Epidemiological and observational studies consistently demonstrate that diabetes is an independent risk factor for TNs,6–9 with a higher incidence in females than in males.10–12 Therefore, it is crucial to investigate the risk factors for TNs by sex, specifically in the context of diabetes.
Pituitary-thyroid hormone (TH), including thyroid-stimulating hormone (TSH), free triiodothyronine (FT3) and free thyroxine (FT4), along with its associated indices—such as the thyroid feedback quantile-based index (TFQI), thyroid-stimulating hormone index (TSHI), thyrotroph T3 resistance index (TT3RI) and thyrotroph T4 resistance index (TT4RI), have been shown to be associated with various diseases, even in euthyroid subjects.13–17 Recent research showed that the TH axis was related to TNs in euthyroid adults.18 However, under the condition of diabetes, the relationship between TNs and TH axis and other potential factors affecting TNs is as yet unclear. Therefore, potential correlates of TNs were identified and analyzed among euthyroid patients with T2D in this study.
Materials and Methods
Patients
Medical records of patients with T2D from the Department of Endocrinology, Linyi People’s Hospital, were collected for the period between January 2020 and March 2023. The inclusion criteria were as follows: T2D and age ≥ 18 years. The exclusion criteria included: (1) patients with type 1 diabetes and other types of diabetes; (2) patients with thyroid dysfunction and thyroid surgery; (3) patients with missing thyroid ultrasound data. Ultimately, a total of 1965 euthyroid patients with T2D were included in our study.
Physical Examinations
Participants’ height and weight were measured. The systolic blood pressure (SBP) and diastolic blood pressure (DBP) were measured in the in the seated participants’ nondominant arm with an automated electronic device. Visceral fat area (VFA) and subcutaneous fat area (SFA) were assessed using bioelectrical impedance analysis (Omron DUALSCAN HDS-2000, Kyoto, Japan).
Laboratory Measurements
Following an overnight fast, blood samples were collected in the morning for analysis. Lipid profiles, including total cholesterol (TC), triglycerides (TG), high density lipoprotein-cholesterol (HDL-c), and low density lipoprotein-cholesterol (LDL-c), were assessed. Liver function markers, including alanine aminotransferase (ALT), aspartate aminotransferase (AST), and γ- glutamyl transpeptidase (GGT); and kidney function markers, including serum creatinine (Scr) and uric acid (UA), were measured. Hemoglobin (Hb); glycosylated haemoglobin (HbA1c, high-performance liquid chromatography), and urinary albumin to creatinine ratio (UACR) was tested by an autoanalyzer (Beckman Coulter AU5821). Thyroid function was assessed by measuring FT3, FT4, TSH, and anti-thyroperoxidase antibody (TPOAb) using a chemiluminescence immunoassay (SIEMENS, USA).
Euthyroidism was defined as FT3 levels ranging from 3.5 to 6.5 pmol/L; FT4 levels ranging from 11.5 to 22.7 pmol/L; and TSH levels ranging from 0.55 to 4.78 uIU/mL.
Definition of Complications and Comorbidities
According to the corresponding criteria, diabetic neuropathy (DN),19 retinopathy (DR)20 and peripheral neuropathy (DPN) (assessed by electromyography) were diagnosed. Peripheral atherosclerosis (PAS) including increased intima-media thickness, plaque formation, stenosis and occlusion of the carotid or lower extremity artery, was assessed by vascular ultrasonography. TNs were assessed by thyroid ultrasound. Self-reported current cigarette smoking, alcohol consumption, the age of menarche, and the age of menopause were collected. A smoker was defined as someone smoking at least one cigarette per day in the last month, and a drinker was defined as alcohol consumption ≥ two or more times per week.
Parameter Calculations


Statistical Analysis
Statistical analysis was performed using SPSS 20.0 (SPSS, Inc, Chicago, USA). Data were presented as mean ± SD for normally distributed variables, and median (interquartile ranges) for non-normally distributed variables. Independent-Samples t-test and Mann–Whitney U-test were used for comparisons of normally and non-normally distributed continuous variables between two groups. Categorical variables were presented as percentage (%), and were compared by chi-square test. Spearman correlation analysis and logistic regression analysis were used to analyze the independent correlates of TNs. Statistical significance was defined as p-value (two-tailed) less than 0.05.
Results
Baseline Clinical and Biochemical Characteristics
The clinical and biochemical characteristics of the participants are shown in Table 1. A total of 1965 euthyroid patients with T2D with a mean age of 57.1 ± 13.3 years were enrolled in this study. The overall prevalence of TNs was 51.9%. Then, the subjects were divided into two groups: female group and male group, and each variable was compared between the two groups (Table 1). Compared with males, the results showed that the age, SBP, TC, LDL-c, HDL-c, UACR, TSH, TT3RI, TT4RI and the percentage of TNs were increased, while BMI, VFA, SFA, DBP, ALT, AST, GGT, UA, Scr, Hb, FT3, FT4, FT3/FT4 ratio and TFQIFT3 were lower in females. Additionally, the percentage of smoking, drinking and DN were also lower in females (all p-values < 0.05). However, there was no obvious differences in duration of diabetes, TG, HbA1c, TPOAb, TFQIFT4, TSHI, and the percentage of DR, DPN and PAS (all p-values > 0.05).
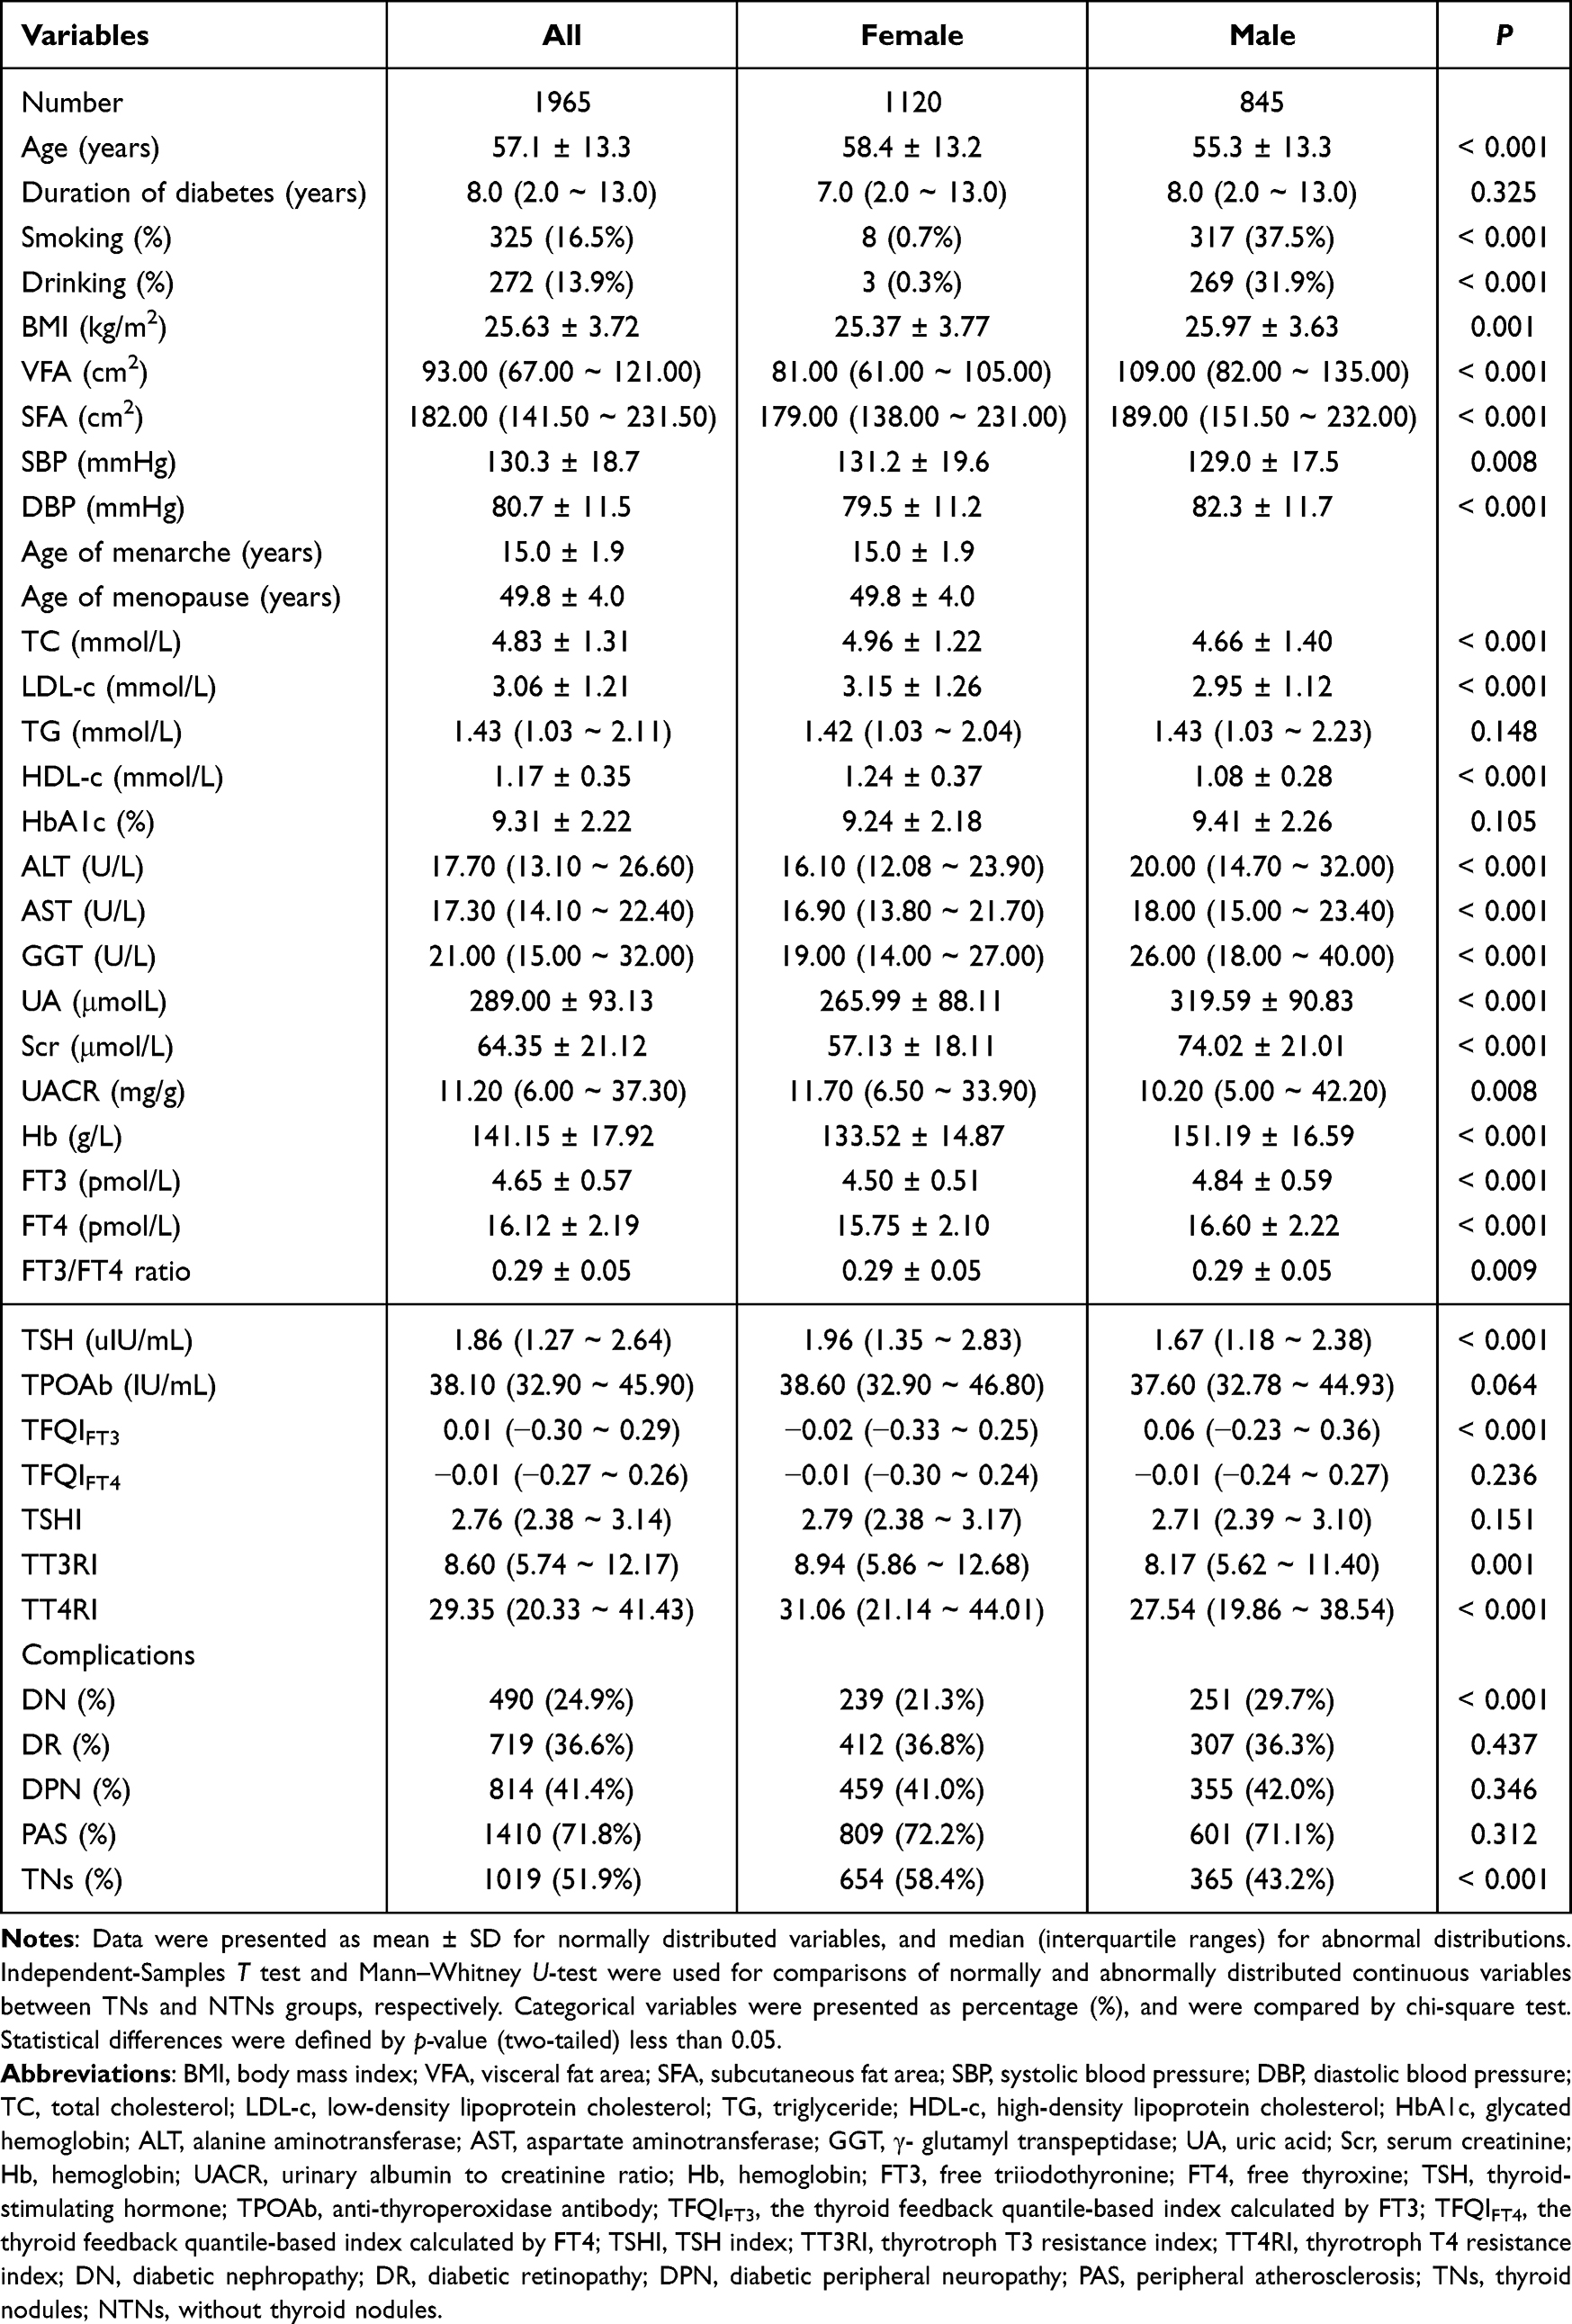 |
Table 1 Clinical and Biochemical Characteristics Stratified by Gender |
As shown in Table 2, for each sex, patients were divided into NTNs and TNs groups, and each variable was compared. In females, compared with NTNs group, the age, duration of diabetes, and the percentage of DR and PAS were increased, while the UA, TSH, TFQIFT4, TSHI, TT3RI and TT4RI were decreased in TNs group (all p-values < 0.05). However, there were no statistically significant differences in BMI, VFA, SFA, SBP, DBP, age of menarche, age of menopause, TC, LDL-c, TG, HDL-c, ALT, AST, GGT, Scr, HbA1c, UACR, Hb, FT3, FT4, FT3/FT4 ratio, TPOAb, TFQIFT3, and the percentage of smoking, drinking, DN and DPN (all p-value < 0.05). In males, compared with NTNs group, the age, duration of diabetes, and the percentage of smoking, DR and PAS were increased, while the TC, TG, UA and Hb were lower in the TNs group (all p-values < 0.05). However, there was no obvious differences in BMI, VFA, SFA, SBP, DBP, LDL-c, HDL-c, HbA1c, ALT, AST, GGT, Scr, UACR, FT3, FT4, FT3/FT4 ratio, TSH, TPOAb, TFQIFT3, TFQIFT4, TSHI, TT3RI, TT4RI, and the percentage of drinking, DN and DPN (all p-values < 0.05).
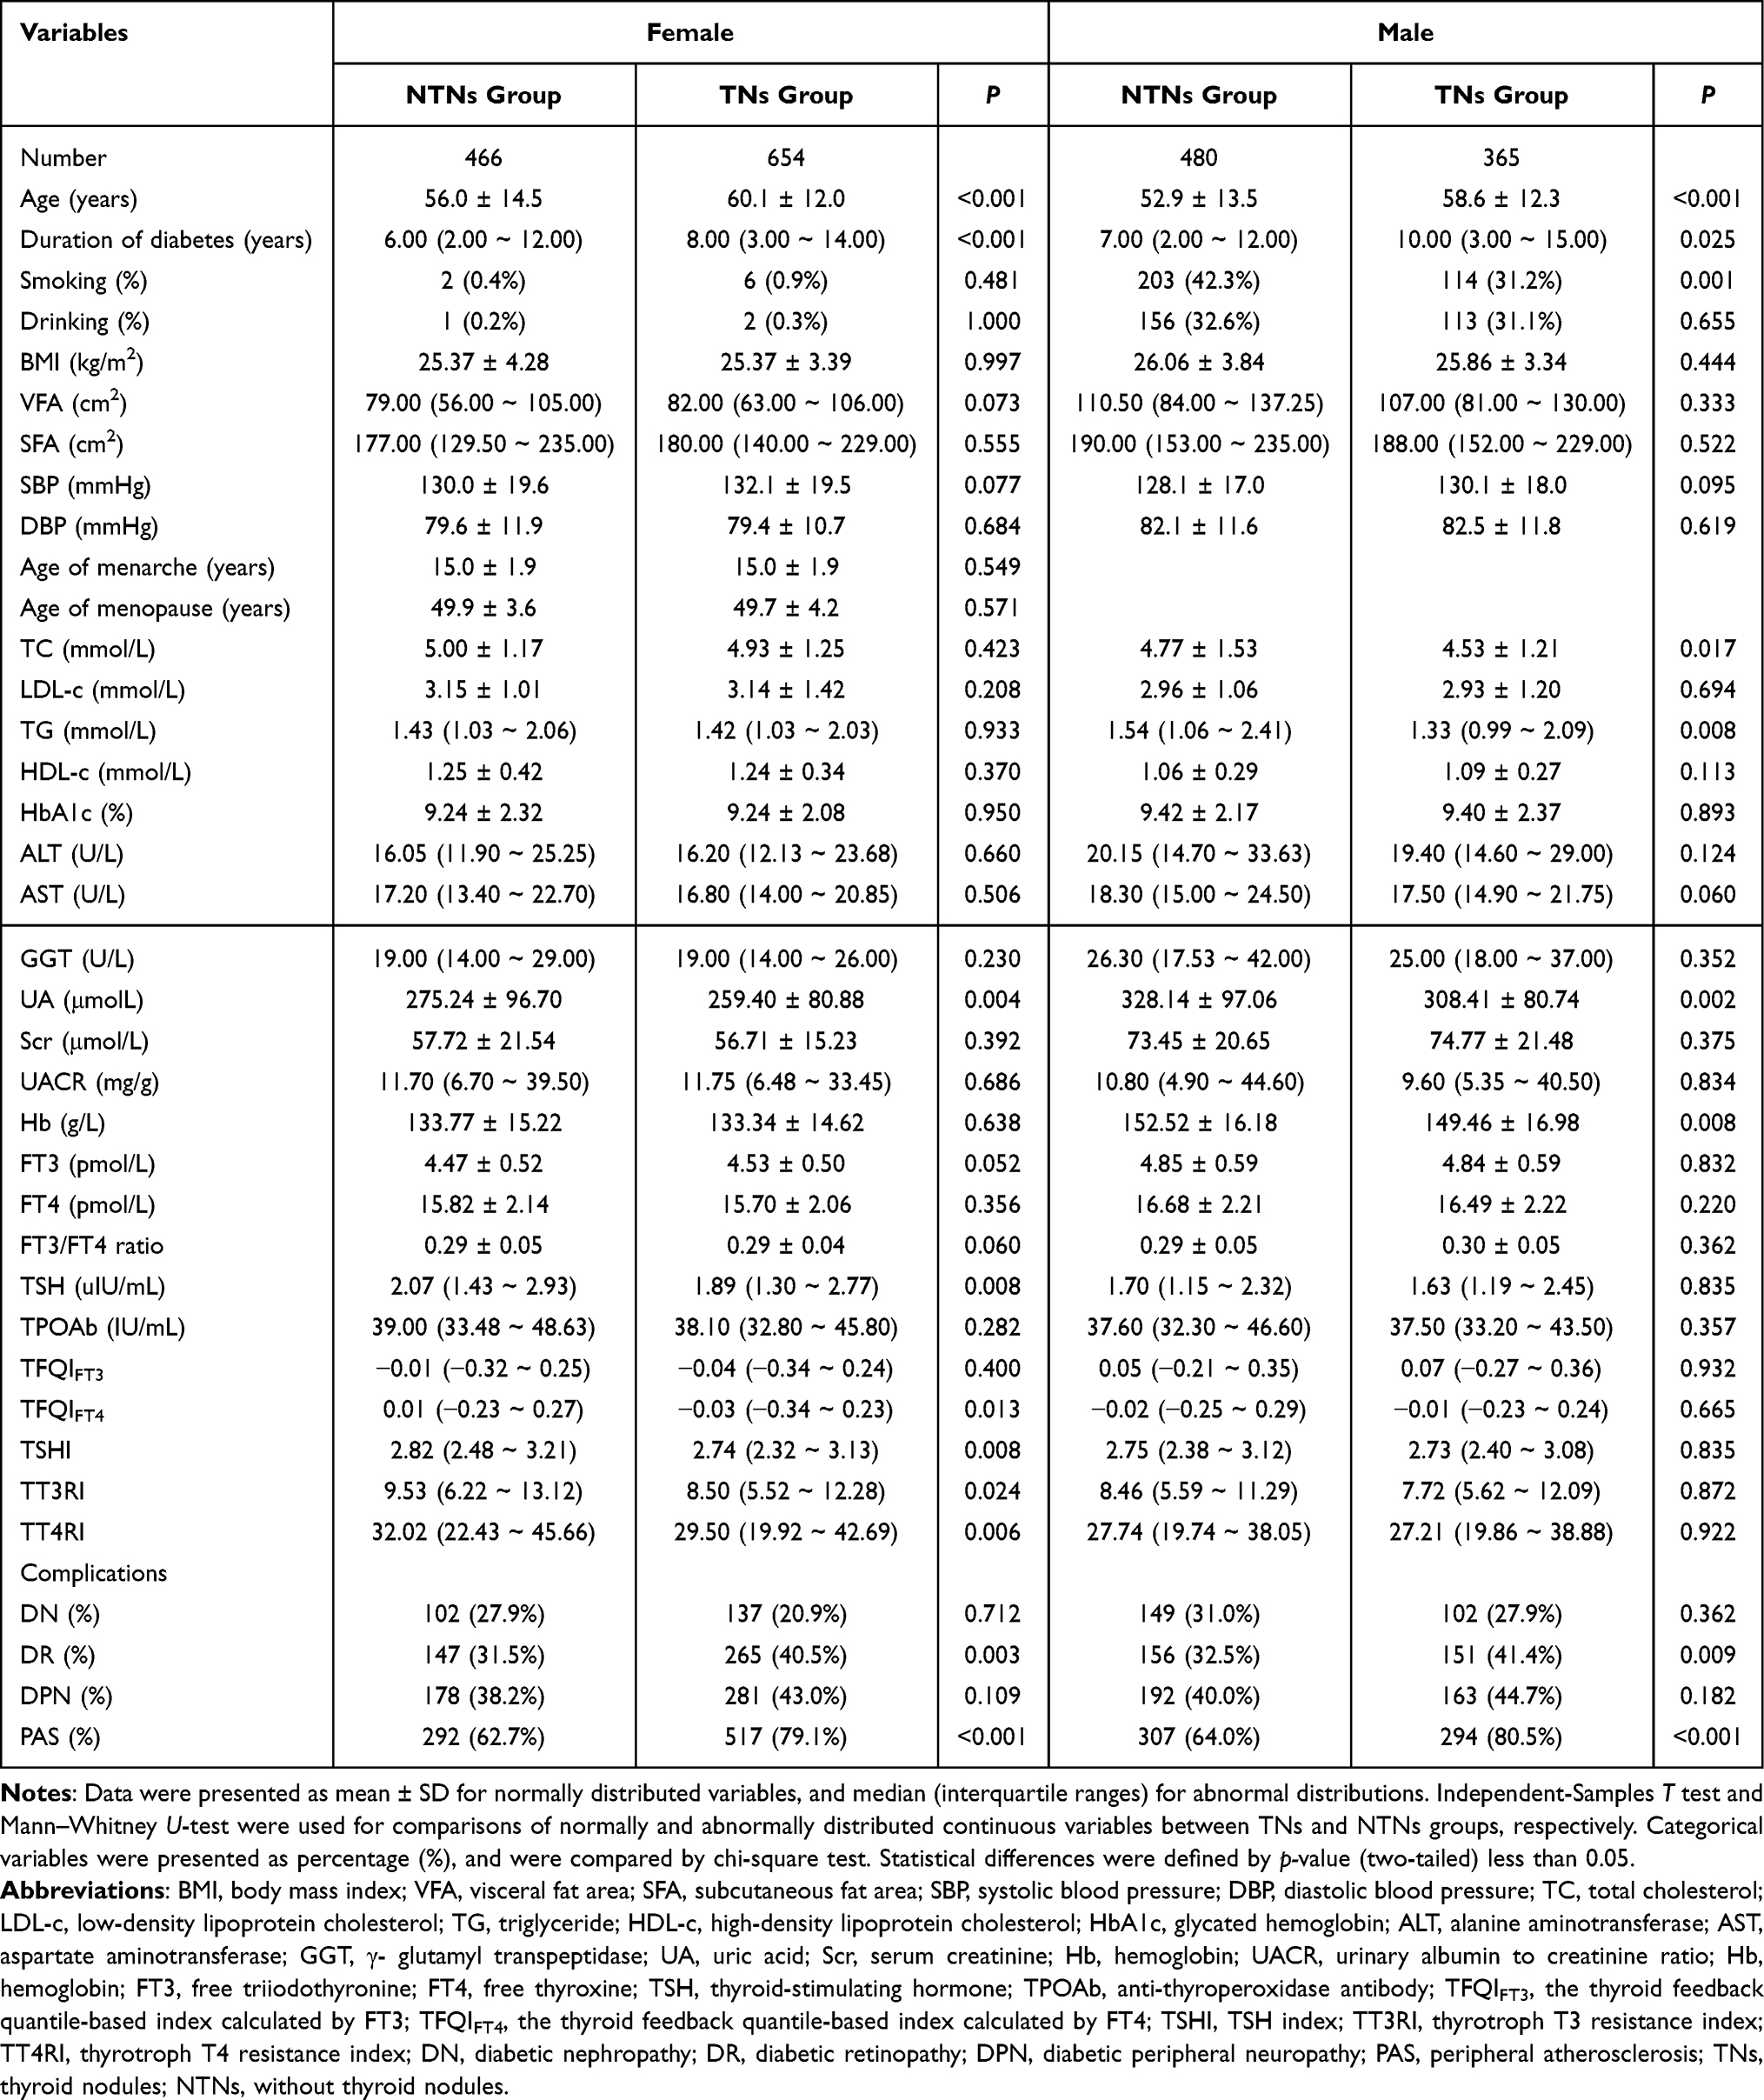 |
Table 2 Comparison of Clinical and Biochemical Characteristics Between NTNs Group and TNs Group |
Correlation Between TNs and All Variables by Univariate Analysis
As shown in Table 3, for each sex, a Spearman correlation analysis was performed to examine the relationship between TNs and each variable. For females, the results showed that TNs were related positively to age, duration of diabetes, FT3, DR and PAS, while negatively to UA, TSH, TFQIFT4, TSHI, TT3RI and TT4RI (all p-values < 0.05). However, there was no significant association between TNs and smoking, drinking, BMI, VFA, SFA, SBP, DBP, age of menarche, age of menopause, TC, LDL-c, TG, HDL-c, HbA1c, ALT, AST, GGT, Scr, UACR, Hb, FT4, FT3/FT4 ratio, TPOAb, TFQIFT4, DN and DPN in both groups (all p-value > 0.05). For males, the results showed that TNs were related positively to age, duration of diabetes, smoking, drinking, HDL-c, DR and PAS, while negatively to TG, UA and Hb (all p-values < 0.05). However, there was no statistically significant association between TNs and BMI, VFA, SFA, SBP, DBP, TC, LDL-c, HbA1c, ALT, AST, GGT, Scr, UACR, FT3, FT4, FT3/FT4 ratio, TSH, TPOAb, TFQIFT3, TFQIFT4, TSHI, TT3RI, TT4RI, DN and DPN (all p-values > 0.05).
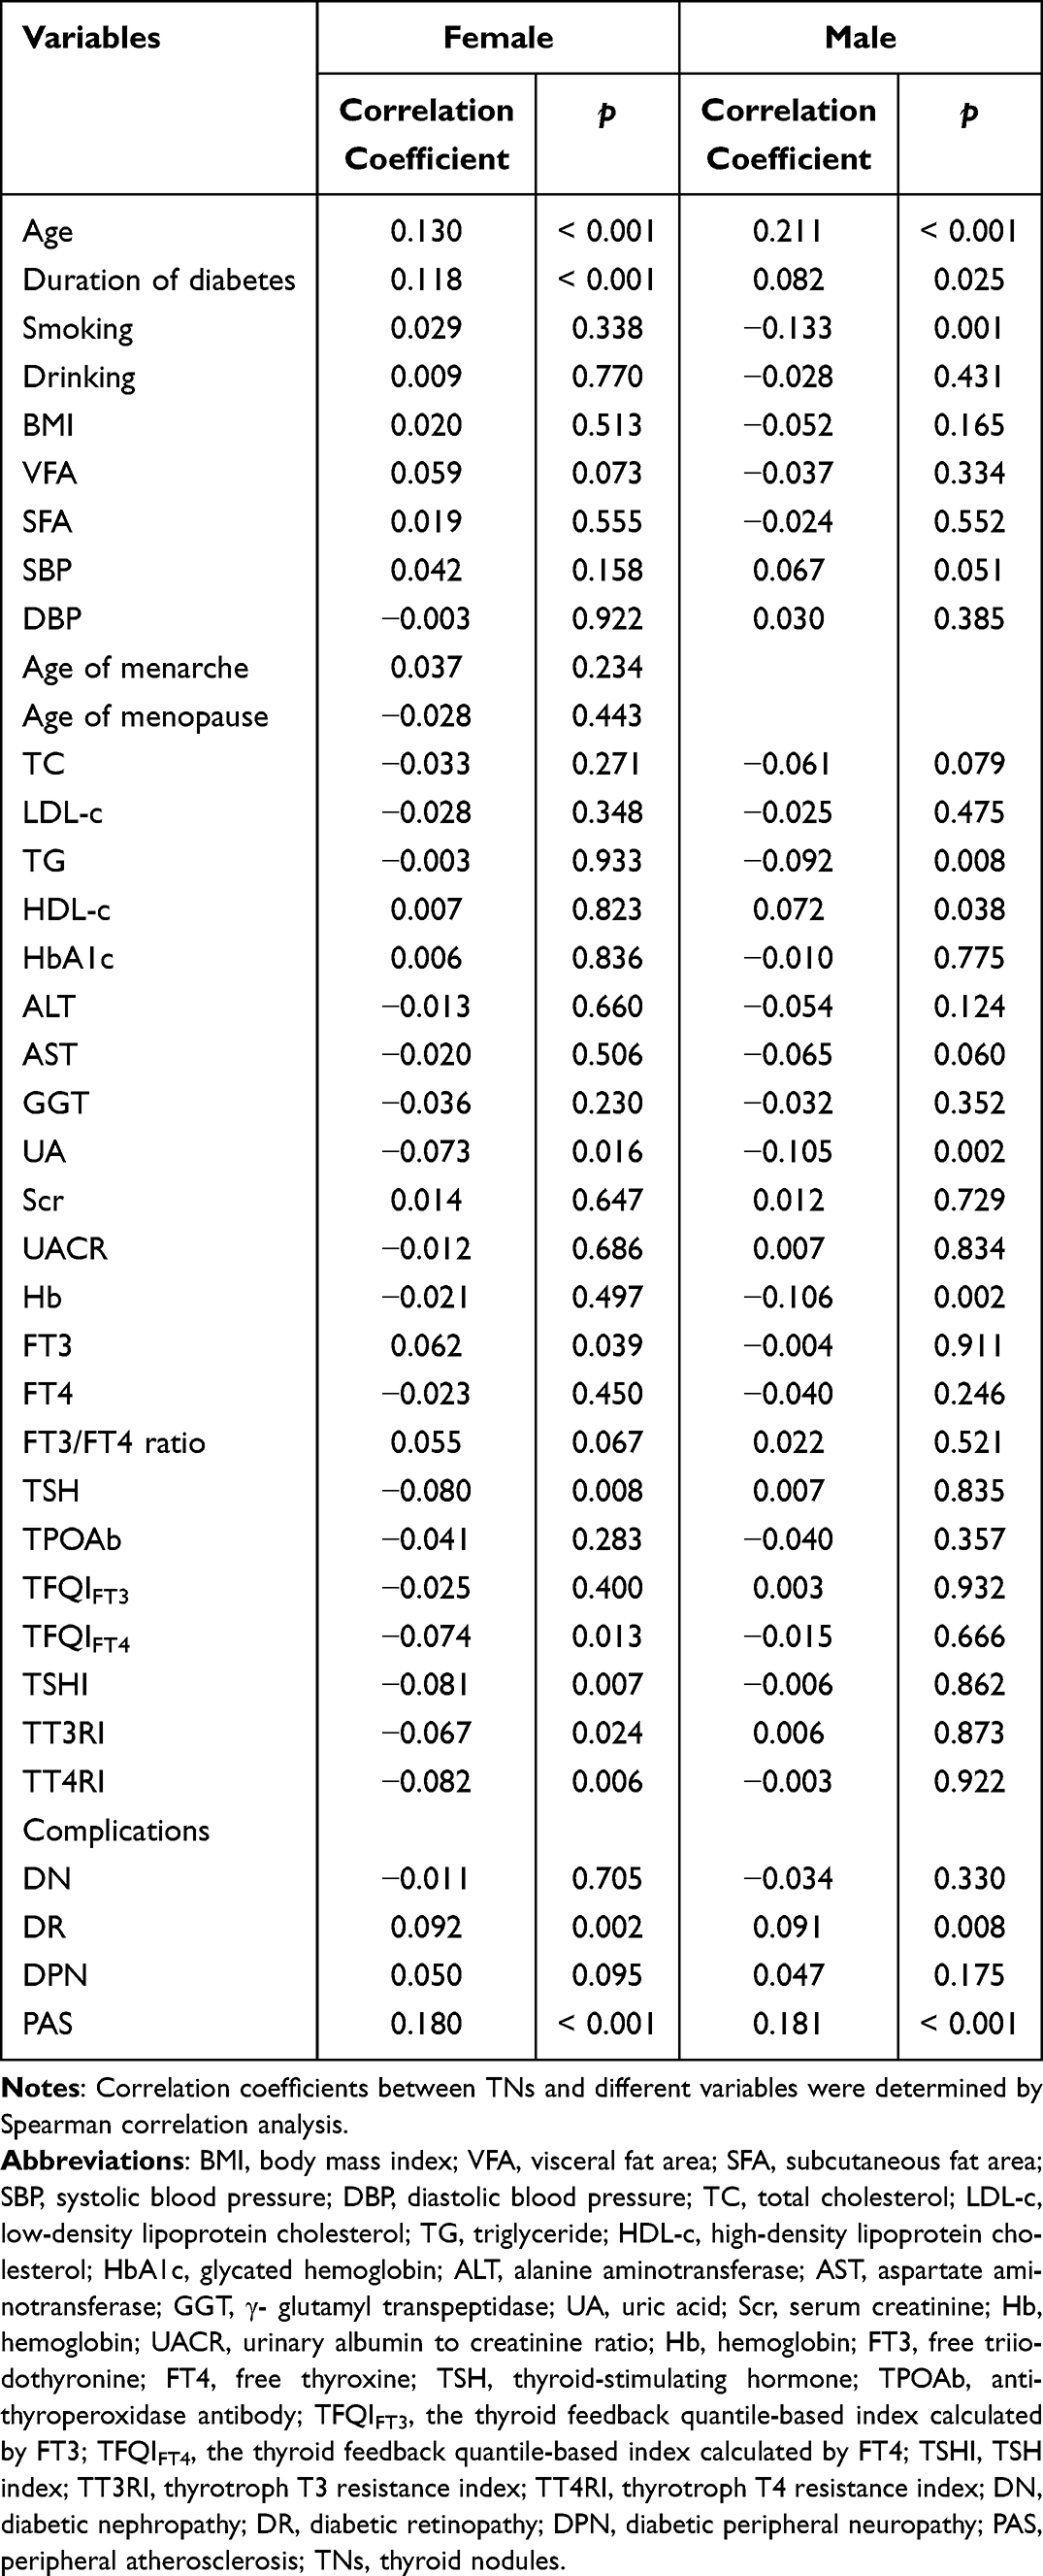 |
Table 3 The Correlation Between TNs and Different Variables by Univariate Analysis |
Independent Correlates of TNs by Logistic Regression Analysis
For females, TNs were served as the dependent variable including the age, duration of diabetes, FT3, UA, TSH, TFQIFT4, TSHI, TT3RI, TT4RI, DR and PAS were considered as the independent variables according to the results of univariate analysis (Table 3). A logistic regression analysis was performed to identify the independent correlates of TNs (Table 4). After adjusting for the other variables, the analysis revealed that PAS (OR: 1.845; 95% CI: 1.388–2.452), FT3 (OR: 1.381; 95% CI: 1.066–1.790), and DR (OR: 1.342; 95% CI: 1.029–1.751) were independently related to TNs. Additionally, UA (OR: 0.998; 95% CI: 0.997–1.000) and TSHI (OR: 0.740; 95% CI: 0.584–0.937) were also independently correlates of TNs.
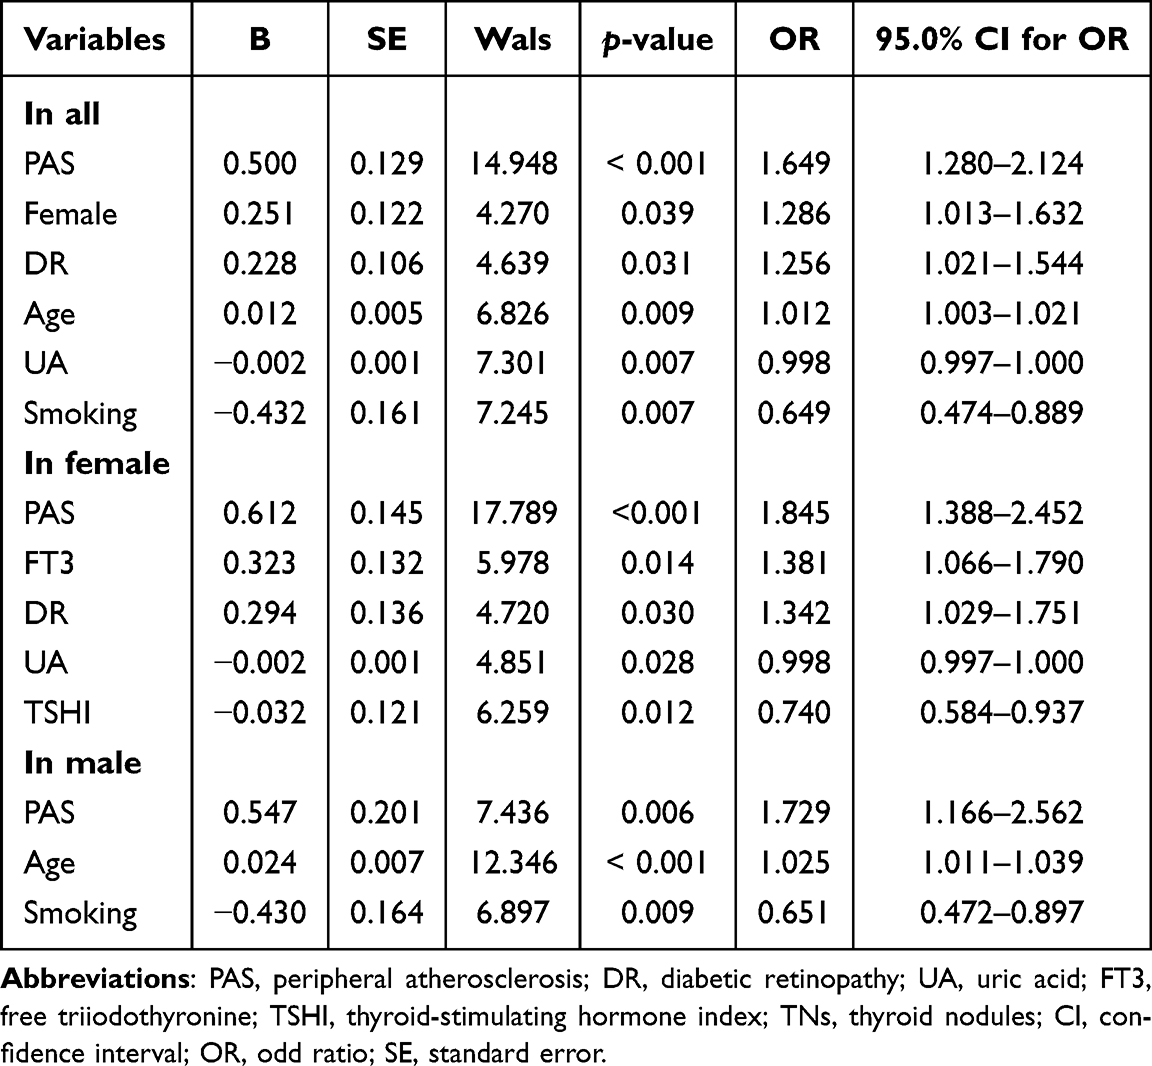 |
Table 4 The Relative Risks for TNs by Logistic Regression Analysis |
For males, adjusting for the age, duration of diabetes, smoking, drinking, HDL-c, TG, UA, Hb, DR and PAS, the results showed that the PAS (OR: 1.729; 95% CI: 1.166–2.562), age (OR: 1.025; 95% CI: 1.011–1.039) and smoking (OR: 0.651; 95% CI: 0.472–0.897) were independently related to TNs.
Discussion
This study demonstrated a high prevalence of TNs in euthyroid T2D patients, with a prevalence of 51.9% among the study population. This finding is consistent with previous studies reporting a prevalence of approximately 60% among T2D patients.2 The data underscore the importance of investigating factors that influence TNs in the T2D population. A deeper understanding of these complex relationships is essential for identifying potential risk factors and developing targeted strategies for managing TNs in T2D patients.
There might be an exist association between the function of pituitary-thyroid axis and TNs, but it has not been fully clarified. Some studies showed a positive association between TSH level and TNs, as well as cancer in adults,26 but others displayed that TSH measurement may not serve as a single effective tool to detect or exclude TNs.27 In our study, a difference in TSH levels between TNs and NTNs groups was observed only in females. However, after adjusting for other confounding factors, this difference was no longer significant. Additionally, in contrast to previous studies,28,29 we found that FT3 rather than FT4 was positively correlated with TNs in patients with T2D in females. The composite indices were better to reflect the dynamic variability between THS and TH than a single index. Research on the relationship between TNs and TH related indices, such as TFQIFT3, TFQIFT4, TSHI, TT3RI and TT4RI, has been limited in euthyroid T2D. A recent study found that TFQIFT3 and TFQIFT4 showed sex differences in euthyroid adults, and were related negatively to TNs in females.18 Similarly, in our study, we found a significant association between low levels of TFQIFT4, TSHI, TT3RI and TT4RI and the presence of TNs in females. However, after adjusting for other confounding factors, we observed that only TSHI, which reflected pituitary thyrotroph function, remained independently correlated with the presence of TNs. This discrepancy in results might be attribute to the different physiological states. Thus, further research should be carried out to explore the roles of the pituitary-thyroid axis function on the occurrence and progression of TNs.
Strong evidence demonstrates that females and age are strongly associated with TNs.6,10–12,30 Our results also supported the conclusion that the prevalence of TNs was significantly increased in females. The mechanism of the sex difference in TNs was unclear, and the underlying reason might be related to the effect of oestrogen in the propagation of thyroid stem/progenitor cells which are probably involved in the origin of non-functioning TNs in females.31 Additionally, it should be noted that our study suggested that age might have a more significant impact on TNs in male patients. Additionally, studies showed that although the prevalence of TNs increased with advancing age, such nodules had a lower risk of malignancy, whereas identified cancers were more likely to be of high-risk histology.32,33 Therefore, it is essential to further explore the effect of age on TNs and carefully weigh the risks and benefits of the diagnosis and treatment in older adults.
In addition, there was no consensus on the association between UA and TNs. In the studies by Huang et al34 and Li et al.10 UA was an independent risk factor for the formation of TNs. However, in the meta-analysis by Hu et al35 the data showed no correlation between the incidence of TNs and the presence or absence of hyperuricemia in the overall population, but revealed a bidirectional regulatory effect of UA on TNs in different genders. In the present study, we found that UA was negatively associated with TNs and may serve as protective factor for TNs in females. Therefore, further large sample studies are needed to analyze the relationships and mechanism between UA and TNs by stratified analysis.
Moreover, we found that smoking was a protective factor for TNs in males. Our finding was consistent with Cho et al study,36 and might be due to smoking can decrease TSH secretion and its anti-estrogenic properties.37 However, other studies inconsistent with our results, Wan et al observed that smoking was a risk factor for TNs,38 which might be attribute to the harmful substances in tobacco smoke that could negative impact on thyroid cells.39 Nevertheless, there is currently no consensus on the relationship between smoking and TNs, and the potential mechanisms needed to be further explored.
Finally, our results showed that the percentage of PAS was significantly higher in the TNs group than in the NTNs group, and a significant relationship existed between PAS and TNs in both females and males. Also, we found DR was an independent risk factor for TNs only in females. Unfortunately, there were few evidence to support our data. A recent study of 4696 patients with T2D showed that eye disorders and peripheral vascular disease were significantly related to TNs.40 Inhibitors of 3-hydroxy-3-methylglutaryl coenzyme A reductase (statins), potent cholesterol-lowering drugs, presented multiple vascular protective actions.41 Accumulating evidence indicated an antiproliferative effect of statins on TNs.42–45 Overall, the specific relationship and mechanism between PAS, DR and TNs, and the preventive and therapeutic effects of statins on TNs needed to be further elaborated.
A few limitations of our study should be considered. First, the single-center design means that the study sample is limited to hospitalized euthyroid T2D patients, and thus the findings cannot be directly extrapolated to the entire diabetic population, potentially affecting their generalizability. Second, as a cross-sectional study, this research only identifies an association between thyroid hormone-related indices and TNs without establishing causality. Therefore, longitudinal or experimental studies are needed to further explore the potential pathogenic mechanisms underlying the relationship between these factors and TNs. Additionally, we only conducted a preliminary analysis of correlates of TNs, further studies should be performed to explore the effects of the above correlates on the size, morphology and pathology of TNs.
In conclusion, sex differences are evident in the relationship between TH and related indices with TNs. FT3 and TSHI were independently associated with TNs exclusively in females. These findings underscore the importance of evaluating TH and related indices, particularly in euthyroid female T2D patients, to facilitate early detection and targeted management of TNs.
Ethics Approval and Consent to Participate
All procedures were performed in accordance with ethical standards laid out in the Declaration of Helsinki. Written informed consent was obtained from all patients upon admission, explicitly stating that their medical records could be used for scientific research purposes. No patients objected to this during the study period. Furthermore, the study was approved by the Human Ethics Committee of Linyi People’s Hospital (202404-H-018).
Funding
This study was funded by grants from the Postdoctoral Program of Affiliated Hospital of Jining Medical University (JYFY322152), and the Key Research and Development Program of Linyi City (2024YX004).
Disclosure
This paper has been uploaded to ResearchSquare as a preprint: https://www.researchsquare.com/article/rs-3241534/v1. All authors declare that they have no conflicts of interest.
References
1. Qu MY, Tang W, Cui XY, et al. Increased prevalence of thyroid nodules across nearly 10 years in Shanghai, China. Current Med Sci. 2023;43(1):191–197. doi:10.1007/s11596-022-2666-5
2. Zhang HM, Feng QW, Niu YX, Su Q, Wang X. Thyroid nodules in type 2 diabetes mellitus. Curr Med Sci. 2019;39(4):576–581. doi:10.1007/s11596-019-2076-5
3. Fumagalli C, Serio G. Molecular testing in indeterminate thyroid nodules: an additional tool for clinical decision-making. Pathologica. 2023;115(4):205–216. doi:10.32074/1591-951X-887
4. Kant R, Davis A, Verma V. Thyroid nodules: advances in evaluation and management. Am Fam Physician. 2020;102(5):298–304.
5. Siegmann EM, Müller HHO, Luecke C, Philipsen A, Kornhuber J, Grömer TW. Association of depression and anxiety disorders with autoimmune thyroiditis: a systematic review and meta-analysis. JAMA Psychiatry. 2018;75(6):577–584. doi:10.1001/jamapsychiatry.2018.0190
6. Buscemi S, Massenti FM, Vasto S, et al. Association of obesity and diabetes with thyroid nodules. Endocrine. 2018;60(2):339–347. doi:10.1007/s12020-017-1394-2
7. Xu L, Zeng F, Wang Y, Bai Y, Shan X, Kong L. Prevalence and associated metabolic factors for thyroid nodules: a cross-sectional study in Southwest of China with more than 120 thousand populations. BMC Endocr Disord. 2021;21(1). doi:10.1186/s12902-021-00842-2
8. Zhang F, Li Y, Yu X, et al. The relationship and gender disparity between thyroid nodules and metabolic syndrome components based on a recent nationwide cross-sectional study and meta-analysis. Front Endocrinol. 2021;12. doi:10.3389/fendo.2021.736972
9. Ding X, Xu Y, Wang Y, et al. Gender disparity in the relationship between prevalence of thyroid nodules and metabolic syndrome components: the SHDC-CDPC community-based study. Mediators Inflammation. 2017;2017. doi:10.1155/2017/8481049
10. Li Y, Jin C, Li J, et al. Prevalence of thyroid nodules in china: a health examination cohort-based study. Front Endocrinol. 2021;12:676144. doi:10.3389/fendo.2021.676144
11. Mu C, Ming X, Tian Y, et al. Mapping global epidemiology of thyroid nodules among general population: a systematic review and meta-analysis. Front Oncol. 2022;12:1029926. doi:10.3389/fonc.2022.1029926
12. Fan L, Tan L, Chen Y, et al. Investigation on the factors that influence the prevalence of thyroid nodules in adults in Tianjin, China. J Trace Elem Med Biol. 2018;50:537–542. doi:10.1016/j.jtemb.2018.03.004
13. Zhang X, Chen Y, Ye H, et al. Correlation between thyroid function, sensitivity to thyroid hormones and metabolic dysfunction-associated fatty liver disease in euthyroid subjects with newly diagnosed type 2 diabetes. Endocrine. 2023;80(2):366–379. doi:10.1007/s12020-022-03279-2
14. Liu C, Hua L, Liu K, Xin Z. Impaired sensitivity to thyroid hormone correlates to osteoporosis and fractures in euthyroid individuals. J Endocrinol Invest. 2023;46(10):2017–2029. doi:10.1007/s40618-023-02035-1
15. Wan H, Yu G, He Y, et al. Associations of thyroid feedback quantile-based index with diabetes in euthyroid adults in the United States and China. Ann Med. 2024;56(1):2318418. doi:10.1080/07853890.2024.2318418
16. Sun H, Zhu W, Liu J, An Y, Wang Y, Wang G. Reduced sensitivity to thyroid hormones is associated with high remnant cholesterol levels in Chinese euthyroid adults. J Clin Endocrinol Metab. 2022;108(1):166–174. doi:10.1210/clinem/dgac523
17. Lu Y, Wang J, An Y, et al. Impaired sensitivity to thyroid hormones is associated with hyperuricemia in a Chinese euthyroid population. Front Endocrinol. 2023;14:1132543. doi:10.3389/fendo.2023.1132543
18. Li Y, Yu G, Yao N, et al. Sex-specific associations between the developmental alterations in the pituitary-thyroid hormone axis and thyroid nodules in Chinese euthyroid adults: a community-based cross−sectional study. Front Endocrinol. 2024;15. doi:10.3389/fendo.2024.1379103
19. He BB, Wei L, Gu YJ, et al. Relationship between anemia and chronic complications in Chinese patients with type 2 diabetes mellitus. Arch Iran med. 2015;18(5):277–283.
20. Hao Z, Cui S, Zhu Y, et al. Application of non-mydriatic fundus examination and artificial intelligence to promote the screening of diabetic retinopathy in the endocrine clinic: an observational study of T2DM patients in Tianjin, China. Therapeutic advances in chronic disease. Therapeutic Adv Chronic Dis. 2020. 11. doi:10.1177/2040622320942415
21. Lai S, Li J, Wang Z, Wang W, Guan H. Sensitivity to thyroid hormone indices are closely associated with NAFLD. Front Endocrinol. 2021;12:766419. doi:10.3389/fendo.2021.766419
22. Laclaustra M, Moreno-Franco B, Lou-Bonafonte JM, et al. Impaired sensitivity to thyroid hormones is associated with diabetes and metabolic syndrome. Diabetes Care. 2019;42(2):303–310. doi:10.2337/dc18-1410
23. Jostel A, Ryder WDJ, Shalet SM. The use of thyroid function tests in the diagnosis of hypopituitarism: definition and evaluation of the TSH Index. Clin Endocrinol. 2009;71(4):529–534. doi:10.1111/j.1365-2265.2009.03534.x
24. Xie H, Li N, Zhou G, et al. The association between the thyroid feedback quantile-based index and serum uric acid in U.S. adults. Eur J Med Res. 2023;28(1):259. doi:10.1186/s40001-023-01214-3
25. Yagi H, Pohlenz J, Hayashi Y, Sakurai A, Refetoff S. Resistance to thyroid hormone caused by two mutant thyroid hormone receptors beta, R243Q and R243W, with marked impairment of function that cannot be explained by altered in vitro 3,5,3’-triiodothyroinine binding affinity. J Clin Endocrinol Metab. 1997;82(5):1608–1614. doi:10.1210/jcem.82.5.3945
26. Fiore E, Vitti P. Serum TSH and risk of papillary thyroid cancer in nodular thyroid disease. J Clin Endocrinol Metab. 2012;97(4):1134–1145. doi:10.1210/jc.2011-2735
27. Treglia G, Trimboli P, Verburg FA, Luster M, Giovanella L. Prevalence of normal TSH value among patients with autonomously functioning thyroid nodule. Eur J Clin Invest. 2015;45(7):739–744. doi:10.1111/eci.12456
28. Tang Y, Yan T, Wang G, et al. Correlation between insulin resistance and thyroid nodule in type 2 diabetes mellitus. Int J Endocrinol. 2017;2017:1617458. doi:10.1155/2017/1617458
29. Cao C, Cui ZL, Miao J, Zhou JX, Wang XN, Jin J. The correlation between microalbuminuria and thyroid nodules in type 2 diabetic mellitus. Int J Endocrinol. 2022;2022:1–6. doi:10.1155/2022/2789279
30. Song J, Zou SR, Guo CY, et al. Prevalence of thyroid nodules and its relationship with iodine status in shanghai: a population-based study. Biomed Environ Sci. 2016;29(6):398–407. doi:10.3967/bes2016.052
31. Xu S, Chen G, Peng W, Renko K, Derwahl M. Oestrogen action on thyroid progenitor cells: relevant for the pathogenesis of thyroid nodules? J Endocrinol. 2013;218(1):125–133. doi:10.1530/JOE-13-0029
32. Ospina NS, Papaleontiou M. Thyroid nodule evaluation and management in older adults: a review of practical considerations for clinical endocrinologists. Endocr Pract. 2021;27(3):261–268. doi:10.1016/j.eprac.2021.02.003
33. Kwong N, Medici M, Angell TE, et al. The influence of patient age on thyroid nodule formation, multinodularity, and thyroid cancer risk. J Clin Endocrinol Metab. 2015;100(12):4434–4440. doi:10.1210/jc.2015-3100
34. Huang Y, Li Z, Yang K, et al. The association of uric acid with the development of thyroid nodules: a retrospective cohort study. BMC Endocr Disord. 2022;22(1):197. doi:10.1186/s12902-022-01119-y
35. Hu J, Luo Y, Lin X. A systematic review and meta-analysis of the correlation between hyperuricemia and thyroid nodules in adults. Gland Surg. 2021;10(12):3324–3333. doi:10.21037/gs-21-722
36. Cho A, Chang Y, Ahn J, Shin H, Ryu S. Cigarette smoking and thyroid cancer risk: a cohort study. Br J Cancer. 2018;119(5):638–645. doi:10.1038/s41416-018-0224-5
37. Zivaljevic V, Slijepcevic N, Sipetic S, et al. Risk factors for well-differentiated thyroid cancer in men. Tumori. 2013;99(4):458–462. doi:10.1177/030089161309900403
38. Wan Z, Li Y, Dong X, et al. Influence of metabolic syndrome and lifestyle factors on thyroid nodules in Chinese adult men: a cross-sectional study. Eur Thyroid J. 2023;12(6):e230168. doi:10.1530/ETJ-23-0168
39. Jiang H, Tian Y, Yan W, et al. The prevalence of thyroid nodules and an analysis of related lifestyle factors in Beijing communities. Int J Environ Res Public Health. 2016;13(4):442. doi:10.3390/ijerph13040442
40. Zhang X, Wang X, Liu J, Xu Y, Zhang J, Li Q. Relationship between complications of type 2 diabetes and thyroid nodules. Curr Med Res Opin. 2023;39(8):1069–1075. doi:10.1080/03007995.2023.2239029
41. Sagris M, Katsaros I, Giannopoulos S, et al. Statins and statin intensity in peripheral artery disease. Vasa. 2022;51(4):198–211. doi:10.1024/0301-1526/a001012
42. Aydın K, Ersöz Gülçelik N, Tuncel M, et al. Thyroid volumes and serum VEGF levels in dyslipidemic patients: effects of statin treatment. Turk J Med Sci. 2019;49(3):738–745. doi:10.3906/sag-1708-106
43. Demir C, Anil C, Bozkus Y, et al. Do statins affect thyroid volume and nodule size in patients with hyperlipidemia in a region with mild-to-moderate iodine deficiency? A prospective study. Med Princ Pract. 2018;27(1):1–7. doi:10.1159/000486748
44. Cappelli C, Castellano M, Pirola I, et al. Reduced thyroid volume and nodularity in dyslipidaemic patients on statin treatment. Clin Endocrinol. 2008;68(1):16–21. doi:10.1111/j.1365-2265.2007.02982.x
45. Chon MG, Suk JH, Oh KH, et al. Influence of long-term statin use in type 2 diabetic patients on thyroid nodularity in iodine-sufficient area. Exp Clin Endocrinol Diabetes. 2011;119(8):497–501. doi:10.1055/s-0031-1283123
 © 2025 The Author(s). This work is published and licensed by Dove Medical Press Limited. The
full terms of this license are available at https://www.dovepress.com/terms
and incorporate the Creative Commons Attribution
- Non Commercial (unported, 3.0) License.
By accessing the work you hereby accept the Terms. Non-commercial uses of the work are permitted
without any further permission from Dove Medical Press Limited, provided the work is properly
attributed. For permission for commercial use of this work, please see paragraphs 4.2 and 5 of our Terms.
© 2025 The Author(s). This work is published and licensed by Dove Medical Press Limited. The
full terms of this license are available at https://www.dovepress.com/terms
and incorporate the Creative Commons Attribution
- Non Commercial (unported, 3.0) License.
By accessing the work you hereby accept the Terms. Non-commercial uses of the work are permitted
without any further permission from Dove Medical Press Limited, provided the work is properly
attributed. For permission for commercial use of this work, please see paragraphs 4.2 and 5 of our Terms.