Back to Journals » Journal of Pain Research » Volume 19
Pituitary Gland Volume in Fibromyalgia Syndrome: A Case–Control Volumetric MRI Study
Authors Seber T ![]() , Uylar Seber T, Çiçek F, Ülkü Demir FG, Payas A, Uçar İ
, Uylar Seber T, Çiçek F, Ülkü Demir FG, Payas A, Uçar İ
Received 14 March 2026
Accepted for publication 23 May 2026
Published 8 June 2026 Volume 2026:19 609244
DOI https://doi.org/10.2147/JPR.S609244
Checked for plagiarism Yes
Review by Single anonymous peer review
Peer reviewer comments 2
Editor who approved publication: Professor King Hei Stanley Lam
Turgut Seber,1 Tuğba Uylar Seber,1 Fatih Çiçek,2 Fatma Gül Ülkü Demir,3 Ahmet Payas,4 İlyas Uçar5
1Department of Radiology, Kayseri City Education and Research Hospital, University of Health Sciences, Kayseri, Turkey; 2Department of Anatomy, Faculty of Medicine, Ömer Halisdemir University, Niğde, Turkey; 3Department of Physical Therapy and Rehabilitation, Kayseri City Education and Research Hospital, University of Health Sciences, Kayseri, Turkey; 4Department of Anatomy, Faculty of Medicine, Amasya University, Amasya, Turkey; 5Department of Anatomy, Faculty of Medicine, Erciyes University, Kayseri, Turkey
Correspondence: Turgut Seber, Department of Radiology, Kayseri City Education and Research Hospital, University of Health Sciences, Kayseri, Turkey, Email [email protected]
Purpose: Fibromyalgia (FM) is a chronic pain syndrome frequently associated with neuroendocrine dysfunction and has been hypothesized to share pathophysiological mechanisms with conditions such as empty sella (ES) and intracranial hypertension. Data regarding pituitary morphology in FM remain limited. This study aimed to evaluate pituitary gland volume (PGV), pituitary gland height (PGH), and the frequency of ES in patients with FM using volumetric magnetic resonance imaging (MRI).
Patients and Methods: This single-center, prospective, cross-sectional study included 30 female patients with FM and 26 age-matched female controls. All participants underwent brain MRI using a 3-T scanner. Pituitary volumetric measurements were obtained through manual segmentation with Insight Segmentation and Registration Toolkit software. Inter- and intra-observer reliability were assessed using intraclass correlation coefficients. Group comparisons were performed using independent samples t-tests and analysis of covariance (ANCOVA), with statistical significance set at p < 0.05. Linear regression analysis was used to evaluate associations between variables.
Results: The FM and control groups did not differ significantly in age or body mass index. Mean PGV was significantly higher in the FM group compared with controls (625.8 ± 115.2 mm³ vs. 519.5 ± 148.3 mm³), with a mean difference of 106.3 mm³ (95% CI: 35.9 to 176.7, p = 0.004), whereas PGH did not differ significantly. ES was identified in one participant in each group, with no significant difference in prevalence.
Conclusion: Patients with FM demonstrated increased PGV. ES was rarely observed in both groups. The biological and clinical implications of these findings warrant further investigation in larger cohorts integrating hormonal and volumetric imaging analyses.
Keywords: fibromyalgia, pituitary gland, volumetric MRI, pituitary volume
Introduction
Fibromyalgia (FM) is a chronic pain disorder characterized by widespread musculoskeletal pain, fatigue, sleep disturbances, and cognitive symptoms. It is one of the most common chronic pain conditions, with a reported prevalence of approximately 2–8% in the general population and a marked female predominance.1–3 Despite its high prevalence and substantial impact on quality of life, the pathophysiology of FM remains incompletely understood. Proposed mechanisms include central sensitization, altered pain processing, and dysregulation of neuroendocrine systems, particularly involving the hypothalamic–pituitary axis.4
Previous studies have suggested that FM may occur more frequently in patients with hypothalamic–hypophyseal disorders.5 Moreover, clinical similarities between conditions such as empty sella (ES), FM, and chronic pain syndromes have been reported.6,7 Based on these observations, a potential relationship between ES and FM has been proposed, and it has been hypothesized that idiopathic intracranial hypertension (IIH) may influence adenohypophyseal function and contribute to FM-like symptoms.6–10
The pituitary gland plays a central role in neuroendocrine regulation, and structural alterations of the gland could theoretically reflect underlying functional changes. However, data regarding pituitary gland morphology in FM are scarce. To our knowledge, no studies in the English literature have evaluated pituitary gland volume (PGV) or the frequency of ES in patients with FM using volumetric MRI techniques.
Therefore, the primary objective of this study was to compare PGV between patients with FM and healthy controls using volumetric MRI. The secondary objectives were to evaluate pituitary gland height (PGH) and to determine the prevalence of ES in patients with FM compared with controls.
Materials and Methods
Study Design and Setting
This study was designed as a single-center, prospective observational case–control study conducted in the Department of Physical Therapy and Rehabilitation. The study was carried out in accordance with a predefined protocol, and all procedures were performed under standardized clinical and imaging conditions.
Participants and Sample Size Determination
The sample size was determined a priori using G*Power software (version 3.1.9.7) to identify the minimum number of participants required to achieve adequate statistical power for the primary outcome variable, PGV. Based on an assumed large effect size of 0.80, a Type I error rate of 5%, and a statistical power above the conventional minimum threshold of 80%, the required sample size was calculated as 56 participants. The selected effect size was used because no previous study or pilot data were available in this specific population. Accordingly, it was planned to include at least 30 female patients with FM and 26 healthy female controls. A total of 56 participants (30 FM patients and 26 controls) were therefore enrolled in the study. No post-hoc power analysis was performed.
Patients were diagnosed with FM according to the American College of Rheumatology 2016 diagnostic criteria by physicians specialized in Physical Medicine and Rehabilitation within the Department of Physical Therapy and Rehabilitation. Control subjects were prospectively recruited from hospital staff and individuals presenting to the hospital for reasons unrelated to FM, and all controls underwent brain MRI solely for research purposes within the study protocol. All control participants were clinically evaluated by physicians in the same department to confirm the absence of FM and to ensure that none of the predefined exclusion criteria were present.
Eligibility criteria were predefined. The inclusion and exclusion criteria are presented in Table 1. Exclusion criteria were assessed based on medical history and participant self-report. Individuals with chronic systemic diseases, malignancy, psychiatric disorders, inflammatory rheumatic diseases, autoimmune diseases, regular alcohol consumption, known endocrine disorders, use of hormonal medications (including oral contraceptives or estrogen therapy), or antipsychotic treatment were excluded. No additional hormonal or laboratory evaluations were performed.
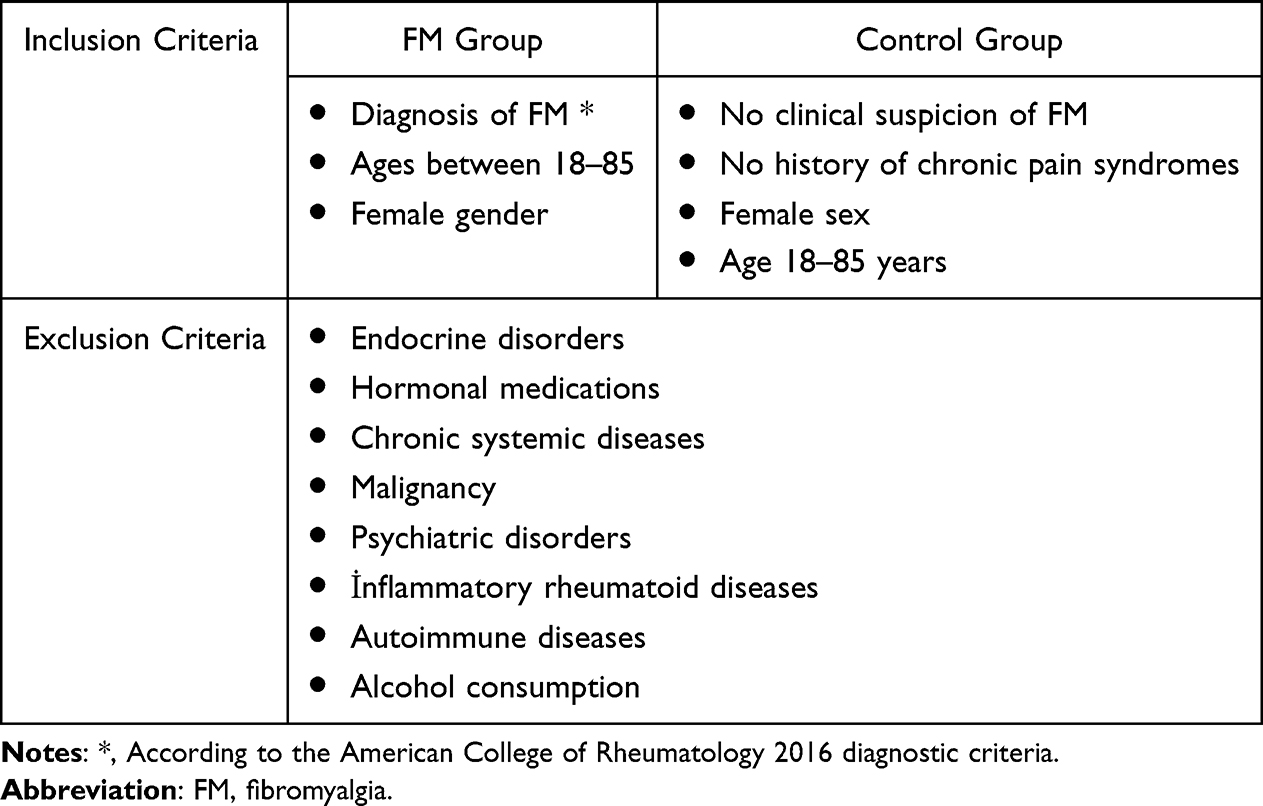 |
Table 1 Eligibility Criteria for Study Participants |
The control group was defined concurrently with the patient group at the time of study planning and initiation of imaging procedures. Participant recruitment and data collection were conducted between November 2023 and February 2024.
Given the higher prevalence of FM in females and to ensure group homogeneity, only female participants were included in both groups. The mean age of the study population was 46.5 years (range: 30–68 years).
Variables
The primary outcome variable of the study was PGV, measured in mm³. Secondary variables included PGH, age, and body mass index (BMI). A PGH value of ≤ 2 mm was considered indicative ES. All variables were defined prior to analysis.
Data Sources and Measurement
Radiological data were obtained using a 3-Tesla MRI system (Siemens Magnetom Skyra, Siemens Healthineers, Erlangen, Germany). Anatomical brain structures were visualized using a T1-weighted magnetization-prepared rapid acquisition gradient echo (MPRAGE) sequence with the following parameters: sagittal acquisition, repetition time (TR) = 2300 ms, echo time (TE) = 3.4 ms, flip angle = 9°, field of view (FOV) = 250×250 mm², voxel size = 1 × 1×1 mm³, matrix = 256 × 256, and slice thickness = 1 mm.
Pituitary gland segmentation was performed using the Insight Segmentation and Registration Toolkit (ITK-SNAP) (Figure 1). MRI data in Digital Imaging and Communications in Medicine (DICOM) format were imported into the software. Manual segmentation was performed slice-by-slice on T1-weighted images according to predefined anatomical landmarks. Segmentation was performed in a blinded manner, with the evaluators unaware of the participants’ group allocation. The average time required for segmentation per subject was approximately 5–10 minutes. The superior border was defined by the diaphragma sellae and optic chiasm, the inferior border by the sellar floor, and the lateral borders by the medial margins of the cavernous sinuses. The anterior and posterior boundaries were defined by visible gland tissue. The pituitary stalk was excluded from volumetric measurements.
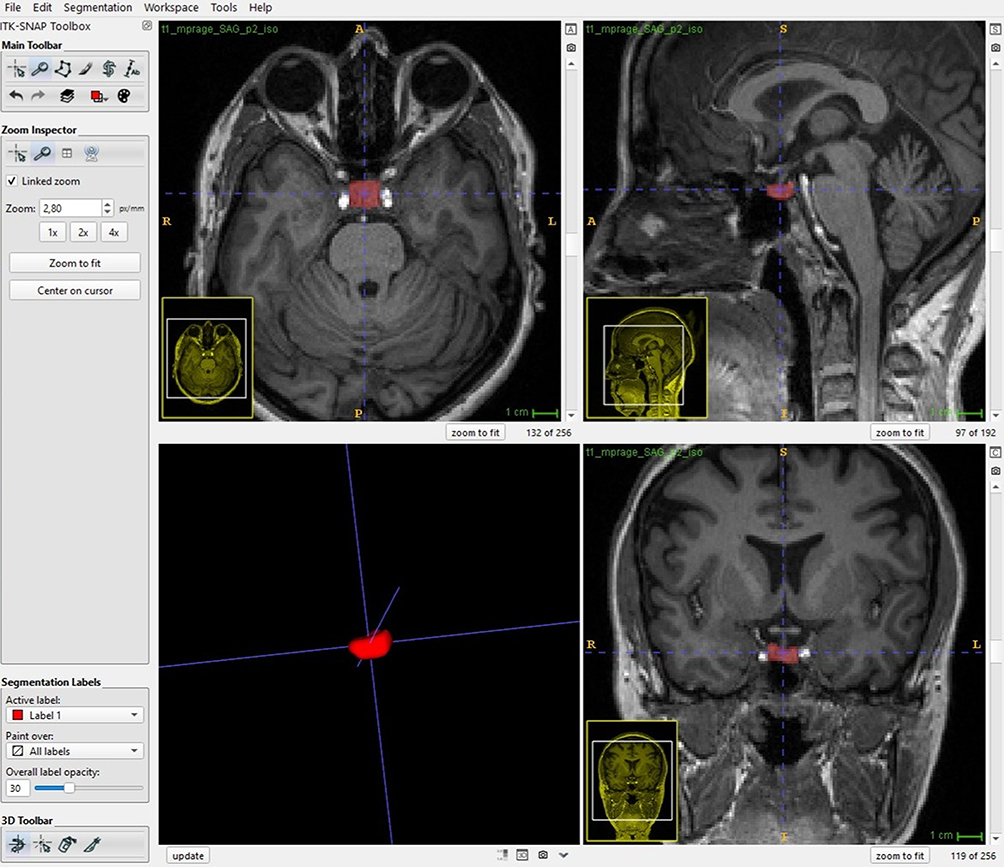 |
Figure 1 Manual segmentation of the pituitary gland performed using the ITK-SNAP software. |
After segmentation, all contours were visually inspected to avoid inclusion of adjacent anatomical structures. PGV was automatically calculated based on segmented voxels and expressed in mm³. PGH was measured on the midsagittal slice at the level of the infundibulum.
Reliability Assessment
Intra- and inter-observer reliability were evaluated using repeated measurements of pituitary gland parameters. Measurements were performed twice at a one-month interval by a clinical neuroanatomist (≥10 years of experience) and a neuroradiologist (15 years of experience), both blinded to clinical data. Reliability was assessed using intraclass correlation coefficients (ICC) based on a two-way random-effects model with absolute agreement. Intra-observer reliability demonstrated excellent agreement (ICC = 0.94; 95% CI: 0.865–0.975), and inter-observer reliability demonstrated good agreement (ICC = 0.88; 95% CI: 0.812–0.935).
Bias
To minimize measurement bias, all radiological assessments were performed by experienced observers blinded to participants’ clinical information. Standardized MRI acquisition protocols and predefined anatomical landmarks were used for all measurements. Selection bias was minimized by prospectively recruiting both patient and control groups using predefined eligibility criteria.
Statistical Analysis
The normality of data distribution was evaluated using both visual methods (histograms and Q–Q plots) and analytical tests (Shapiro–Wilk test, skewness, and kurtosis), and all variables were found to be approximately normally distributed. Therefore, parametric analyses were considered appropriate. Continuous variables were expressed as mean ± standard deviation (SD).
Between-group comparisons were initially performed using the independent samples t-test (unadjusted analysis). Differences in PGV between groups were further analyzed using analysis of covariance (ANCOVA), with group as the fixed factor and age and BMI as covariates to control for potential confounding effects (adjusted analysis).
Although groups were frequency-matched for age at the design stage, individual matching was not performed. Therefore, covariate adjustment using ANCOVA was considered appropriate to control for any residual confounding. Age and BMI were included as covariates, as both variables may influence PGV and were considered potential confounders in the association between FM and PGV. Additionally, linear regression analysis was performed to further explore the independent association between BMI and PGV, considering its potential confounding role.
Effect sizes and 95% confidence intervals (CI) were calculated where appropriate. A p-value < 0.05 was considered statistically significant. All statistical analyses were performed using IBM SPSS Statistics version 22.0 (IBM Corp., Armonk, NY, USA).
Results
The study included 56 participants (30 FM patients and 26 controls), all of whom were female. There was no statistically significant difference in age between the FM and control groups (mean ± SD: 48.1 ± 6.7 vs. 44.5 ± 9.3 years, respectively; p = 0.09) (Table 2).
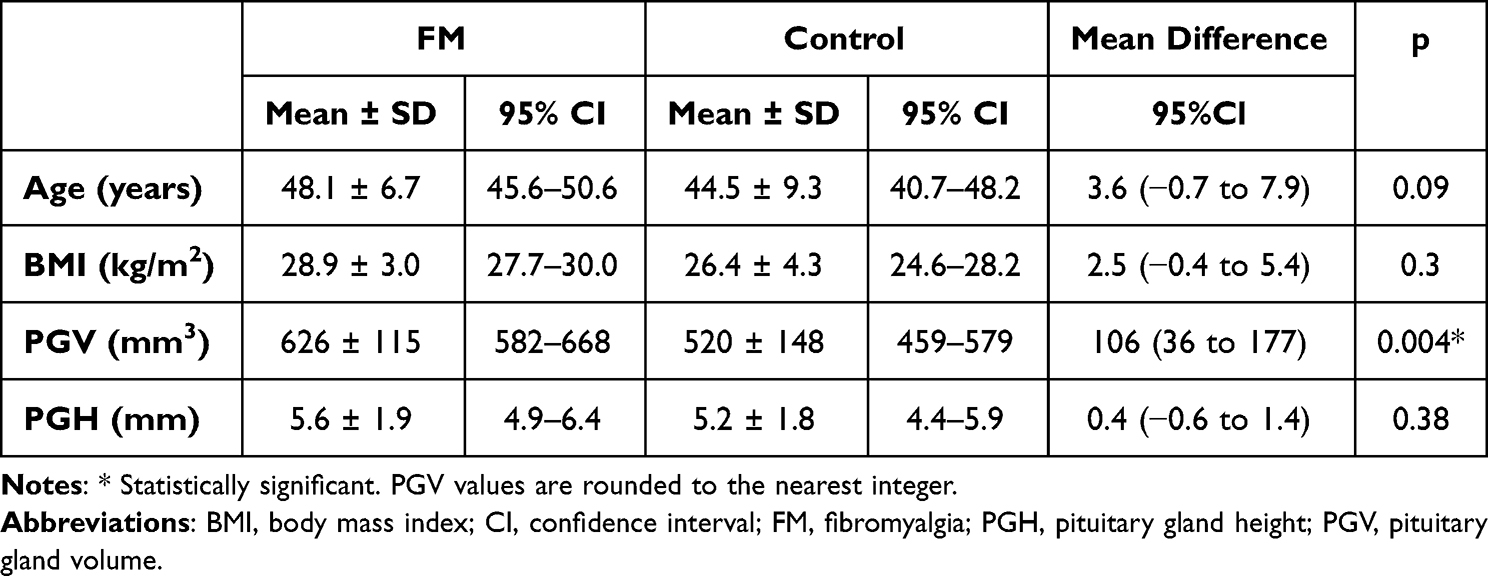 |
Table 2 Demographic Characteristics and Pituitary Gland Measurements in the Fibromyalgia and Control Groups |
We found that mean BMIs were higher in the FM group compared to the control group, but this difference was not statistically significant (28.9 ± 3.1 kg/m2 vs. 26.4 ± 4.4 kg/m2, respectively; p = 0.30). There was no significant difference in mean PGH between the FM and control groups (5.6 ± 2.0 mm vs. 5.2 ± 1.8 mm, respectively; p = 0.38; Table 2, Figure 2A). We detected ES (height ≤ 2 mm) in one patient in each group. PGV was significantly higher in the FM group compared with controls (625.8 ± 115.2 mm³ vs. 519.5 ± 148.3 mm³), corresponding to an absolute mean difference of 106.3 mm³ (95% CI: 35.9 to 176.7; p = 0.004), representing approximately a 20% relative increase (Table 2 and Figure 2B).
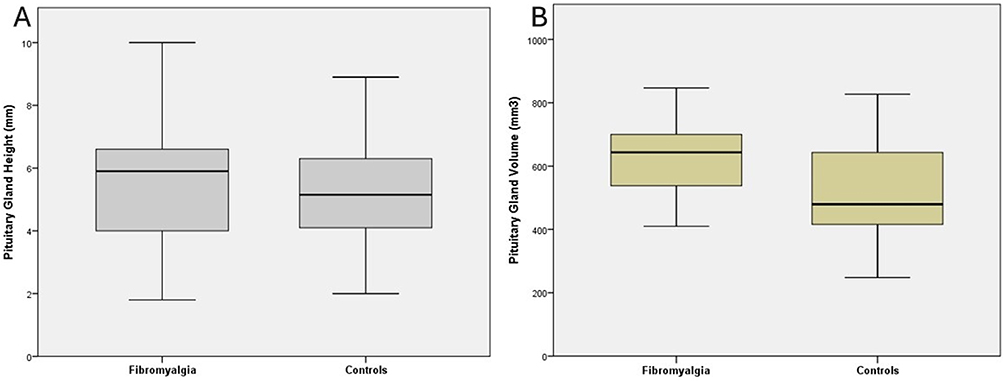 |
Figure 2 Box-and-whisker plots showing pituitary gland height (A) and pituitary gland volume (B) in the fibromyalgia and control groups. |
After adjustment for age and BMI using ANCOVA, the difference in PGV between groups remained statistically significant (F = 9.46, p = 0.003, partial η² = 0.154). The adjusted mean PGV was 627.4 mm³ (95% CI: 580.0–674.8) in the FM group and 517.7 mm³ (95% CI: 466.6–568.8) in the control group, corresponding to an adjusted mean difference of approximately 109.7 mm³. These findings indicate that the observed increase in PGV in FM patients is independent of age and BMI. The similarity between unadjusted and adjusted estimates suggests minimal confounding by these variables.
Discussion
There are hypotheses proposing that patients with ES on MRI frequently exhibit similar clinical features that overlap substantially with those reported in FM and other chronic pain syndromes.6–10 According to these hypotheses, moderate or intermittent IIH may reduce pituitary perfusion, impair basal pituitary hormone secretion, and lead to anterior pituitary (adenohypophyseal) dysfunction and ES.7 If intracranial pressure rises further, a fulminant IIH syndrome may develop, characterized by papilledema, severe headache, and visual disturbances.7,11 Taken together, these observations have prompted the hypothesis that IIH could contribute to the development of FM.6–10
Although multiple neuroimaging studies in FM have documented volumetric and morphometric alterations in brain regions involved in pain processing—most notably the hippocampus and prefrontal cortex—the literature offers little regarding pituitary morphology.12–15 In particular, there are insufficient studies that systematically evaluate pituitary size, PGV, or the prevalence of ES in patients with FM, and to our knowledge no published MRI-based volumetric investigations of PGV in this population exist. This MRI volumetric study therefore aims to fill that gap.
Pituitary size and PGV are known to vary according to age and sex, with women being affected approximately seven times more frequently than men.16 In addition, PGV decreases with advancing age in men and is higher in young women compared with middle-aged women.17 All participants in the present study were women, and there was no statistically significant age difference between the study groups (p = 0.09).
Increased PGV has been reported in obese individuals (BMI > 30) a finding that has been attributed to dysfunction of the hypothalamic–pituitary axis.17 In the present study, 17 participants had a BMI greater than 30. The distribution of obese individuals between the groups (10 FM, 7 controls) did not differ significantly (p = 0.30).
Empty sella was identified in one patient in each group; accordingly, no statistically significant difference in PGH was observed between the groups (p = 0.38). However, given the extremely low number of ES cases, this comparison is inherently underpowered, and no meaningful inference regarding ES prevalence or group differences can be made.
The only statistically significant finding of our study was a higher PGV in the FM group compared with the control group (p = 0.004). A key limitation of this study is the absence of concurrent hormonal measurements, which restricts the ability to directly link structural findings with functional neuroendocrine alterations. This finding partially contrasts with hypotheses proposing pituitary hypoperfusion and volume reduction secondary to IIH.6–10 The observed increase in PGV in FM patients is unlikely to be explained by structural causes such as neoplastic, iatrogenic, or overt endocrine disorders, as these conditions were excluded by study design. Instead, the findings may reflect functional alterations of the hypothalamic–pituitary axis. In this context, chronic stress exposure, hypothalamic dysregulation, and adaptive neuroendocrine responses—frequently reported in FM—may contribute to pituitary morphological changes. These mechanisms are consistent with previous evidence suggesting altered hypothalamic–pituitary–adrenal and growth hormone axis regulation in FM.4,18–24
Because our study lacked contemporaneous pituitary and hypothalamic hormone measurements, we are unable to draw definitive conclusions regarding the hormonal mechanisms underlying the observed increase in PGV. However, when prior studies on FM are considered, several characteristic neuroendocrine patterns emerge. Although exceptions have been reported, FM patients generally demonstrate low basal ACTH and cortisol levels with an exaggerated response to exogenous CRH stimulation,4,18–22 as well as low basal GH levels with an exaggerated response to exogenous GHRH stimulation.23,24 In addition, a blunted TSH response to TRH stimulation has been reported,25,26 suggesting impaired pituitary-level regulation related to CRH, GHRH, and TRH secretion or signaling. Despite reported variability, elevated levels of FSH, LH, and prolactin have been frequently observed in patients with FM and have been suggested to reflect alterations in GnRH and TRH-related regulatory pathways.22,26–31 In this context, the increased PGV observed in our FM cohort could potentially be related to neuroendocrine alterations suggested in prior FM literature. Nevertheless, any interpretation involving hypothalamic–pituitary mechanisms remains hypothetical, as our study did not include direct hormonal measurements.
A major limitation of our study is the absence of contemporaneous pituitary hormone measurements, which limits the ability to directly link structural findings with functional neuroendocrine alterations. In addition, cerebrospinal fluid opening pressure and funduscopic examination were not performed, and therefore mild or intermittent intracranial hypertension cannot be entirely excluded.
Although age and BMI were accounted for in the analysis, the potential influence of unmeasured confounders should be considered. Factors such as menopausal status, menstrual cycle phase, subclinical endocrine variations, stress, depression, sleep disturbances, and physical activity were not systematically evaluated. Furthermore, reliance on medical history and participant self-report may have introduced misclassification bias, particularly in the control group.
Although a priori sample size calculation was performed, the assumed large effect size (0.80) may be considered optimistic. In addition, the relatively small sample size (n = 56) limits the generalizability of the findings and precludes detailed subgroup analyses.
Another limitation is the lack of data regarding the duration and severity of FM symptoms, which prevented assessment of a potential dose–response relationship.
Future studies with larger cohorts, comprehensive hormonal profiling, and longitudinal designs are needed to better elucidate the relationship between FM and pituitary morphology. Despite these limitations, this imaging-based study addresses an important gap by providing one of the first MRI-based volumetric assessments of pituitary gland morphology in patients with FM.
Conclusion
PGV was higher in patients with FM, while the prevalence of ES did not differ significantly from controls. These findings should be interpreted cautiously and warrant further investigation using larger cohorts and integrated hormonal and volumetric imaging approaches.
Abbreviations
BMI, Body mass index; S, Empty sella; FM, Fibromyalgia; ICC, Intraclass correlation coefficient; IIH, Idiopathic intracranial hypertension; ITK-SNAP, Insight Segmentation and Registration Toolkit; MRI, Magnetic resonance imaging; MPRAGE, Magnetization-prepared rapid acquisition gradient echo; PGH, Pituitary gland height; PGV, Pituitary gland volume; SD, Standard deviation.
Data Sharing Statement
The data that support the findings of this study are available from the corresponding author upon reasonable request. The data are not publicly available due to privacy and ethical restrictions related to patient information.
Ethics Approval and Consent to Participate
The study protocol was approved by the Non-Interventional Clinical Research Ethics Committee of Kayseri City Education and Research Hospital (Approval No. 2025/574). The study was conducted in accordance with the principles of the Declaration of Helsinki. Written informed consent was obtained from all participants.
Funding
There is no funding to report.
Disclosure
The authors have no conflicts of interest to declare for this work.
References
1. Clauw DJ. Fibromyalgia: a clinical review. JAMA. 2014;311(15):1547–8. doi:10.1001/jama.2014.3266
2. Wolfe F, Ross K, Anderson J, Russell IJ, Hebert L. The prevalence and characteristics of fibromyalgia in the general population. Arthritis Rheum. 1995;38(1):19–28. doi:10.1002/art.1780380104
3. Vincent A, Lahr BD, Wolfe F, et al. Prevalence of fibromyalgia: a population-based study in Olmsted County, Minnesota, utilizing the Rochester Epidemiology Project. Arthritis Care Res. 2013;65(5):786–792. doi:10.1002/acr.21896
4. Tak LM, Cleare AJ, Ormel J, et al. Meta-analysis and meta-regression of hypothalamic-pituitary-adrenal axis activity in functional somatic disorders. Biol Psychol. 2011;87(2):183–194. doi:10.1016/j.biopsycho.2011.02.002
5. Harbeck B, Süfke S, Harten P, Haas CS, Lehnert H, Mönig H. High prevalence of fibromyalgia-associated symptoms in patients with hypothalamic-pituitary disorders. Clin Exp Rheumatol. 2013;31(Suppl 79):S16–S21.
6. Hulens M, Rasschaert R, Vansant G, Stalmans I, Bruyninckx F, Dankaerts W. The link between idiopathic intracranial hypertension, fibromyalgia, and chronic fatigue syndrome: exploration of a shared pathophysiology. J Pain Res. 2018;11:3129–3140. doi:10.2147/JPR.S186878
7. Hulens M, Dankaerts W, Rasschaert R, Bruyninckx F, De Mulder P, Bervoets C. The link between empty sella syndrome, fibromyalgia, and chronic fatigue syndrome: the role of increased cerebrospinal fluid pressure. J Pain Res. 2023;16:205–219. doi:10.2147/JPR.S394321
8. Higgins JNP, Pickard JD, Lever AML. Chronic fatigue syndrome and idiopathic intracranial hypertension: different manifestations of the same disorder of intracranial pressure? Med Hypotheses. 2017;105:6–9. doi:10.1016/j.mehy.2017.06.014
9. Bragée B, Michos A, Drum B, Fahlgren M, Szulkin R, Bertilson BC. Signs of ıntracranial hypertension, hypermobility, and craniocervical obstructions in patients with myalgic encephalomyelitis/chronic fatigue syndrome. Front Neurol. 2020;11:828. doi:10.3389/fneur.2020.00828
10. Wostyn P, Van Dam D, Audenaert K, Paul De Deyn P. Fibromyalgia as a glymphatic overload syndrome. Med Hypotheses. 2018;115:17–18. doi:10.1016/j.mehy.2018.03.014
11. Chiloiro S, Giampietro A, Bianchi A, et al. Diagnosis of endocrine disease: primary empty sella: a comprehensive review. Eur J Endocrinol. 2017;177(6):R275–R285. doi:10.1530/EJE-17-0505
12. McCrae CS, O’Shea AM, Boissoneault J, et al. Fibromyalgia patients have reduced hippocampal volume compared with healthy controls. J Pain Res. 2015;8:47–52. doi:10.2147/JPR.S71959
13. Leon-Llamas JL, Villafaina S, Murillo-Garcia A, Gusi N. Impact of fibromyalgia in the hippocampal subfields volumes of women-an MRI study. Int J Environ Res Public Health. 2021;18(4):1549. doi:10.3390/ijerph18041549
14. Karayol KC, Karayol SS. Brain morphometric changes in patients with fibromyalgia. J Pak Med Assoc. 2022;72(10):2086–2089. doi:10.47391/JPMA.273
15. Murillo-Garcia A, Leon-Llamas JL, Villafaina S, Gusi N. Fibromyalgia impact in the prefrontal cortex subfields: an assessment with MRI. Clin Neurol Neurosurg. 2022;219:107344. doi:10.1016/j.clineuro.2022.107344
16. Hawkins RA. Fibromyalgia: a clinical update. J Am Osteopath Assoc. 2013;113(9):680–689. doi:10.7556/jaoa.2013.034
17. Fehrenbach U, Jadan A, Auer TA, et al. Obesity and pituitary gland volume - a correlation study using three-dimensional magnetic resonance imaging. Neuroradiol J. 2020;33(5):400–409. doi:10.1177/1971400920937843
18. Griep EN, Boersma JW, Lentjes EG, Prins AP, van der Korst JK, de Kloet ER. Function of the hypothalamic-pituitary-adrenal axis in patients with fibromyalgia and low back pain. J Rheumatol. 1998;25(7):1374–1381.
19. Kirnap M, Colak R, Eser C, Ozsoy O, Tutus A, Kelestimur F. A comparison between low-dose (1 microg), standard-dose (250 microg) ACTH stimulation tests and insulin tolerance test in the evaluation of hypothalamo-pituitary-adrenal axis in primary fibromyalgia syndrome. Clin Endocrinol. 2001;55(4):455–459. doi:10.1046/j.1365-2265.2001.01373.x
20. Riedel W, Schlapp U, Leck S, Netter P, Neeck G. Blunted ACTH and cortisol responses to systemic injection of corticotropin-releasing hormone (CRH) in fibromyalgia: role of somatostatin and CRH-binding protein. Ann N Y Acad. Sci. 2002;966:483–490. doi:10.1111/j.1749-6632.2002.tb04251.x
21. Izquierdo-Alvarez S, Bocos-Terraz JP, Bancalero-Flores JL, Pavón-Romero L, Serrano-Ostariz E, de Miquel CA. Is there an association between fibromyalgia and below-normal levels of urinary cortisol? BMC Res Notes. 2008;1:134. doi:10.1186/1756-0500-1-134
22. Gur A, Cevik R, Nas K, Colpan L, Sarac S. Cortisol and hypothalamic-pituitary-gonadal axis hormones in follicular-phase women with fibromyalgia and chronic fatigue syndrome and effect of depressive symptoms on these hormones. Arthritis Res Ther. 2004;6(3):R232–R238. doi:10.1186/ar1163
23. Paiva ES, Deodhar A, Jones KD, Bennett R. Impaired growth hormone secretion in fibromyalgia patients: evidence for augmented hypothalamic somatostatin tone. Arthritis Rheum. 2002;46(5):1344–1350. doi:10.1002/art.10209
24. Yuen KC, Bennett RM, Hryciw CA, Cook MB, Rhoads SA, Cook DM. Is further evaluation for growth hormone (GH) deficiency necessary in fibromyalgia patients with low serum insulin-like growth factor (IGF)-I levels? Growth Horm IGF Res. 2007;17(1):82–88. doi:10.1016/j.ghir.2006.12.006
25. Neeck G, Riedel W. Thyroid function in patients with fibromyalgia syndrome. J Rheumatol. 1992;19(7):1120–1122.
26. Riedel W, Layka H, Neeck G. Secretory pattern of GH, TSH, thyroid hormones, ACTH, cortisol, FSH, and LH in patients with fibromyalgia syndrome following systemic injection of the relevant hypothalamic-releasing hormones. Z Rheumatol. 1998;57(Suppl 2):81–87. doi:10.1007/s003930050242
27. Erem C. A case of pituitary hyperplasia secondary to primary hypothyroidism presenting with irregular menses, galactorrhea, and hyperprolactinemia. Endocrinologist. 2010;20(4):168–170. doi:10.1097/TEN.0b013e3181ecb07d
28. Ahmed M, Banna M, Sakati N, Woodhouse N. Pituitary gland enlargement in primary hypothyroidism: a report of 5 cases with follow-up data. Horm Res. 1989;32(5–6):188–192. doi:10.1159/000181287
29. Scheithauer BW, Kovacs K, Randall RV, Ryan N. Pituitary gland in hypothyroidism. Histologic and immunocytologic study. Arch Pathol Lab Med. 1985;109(6):499–504.
30. Qu P, Yu JX, Chen GH. Neuroendocrine modulation of cognitive performance in the patients with fibromyalgia. Eur Neurol. 2021;84(4):254–264. doi:10.1159/000514756
31. El Maghraoui A, Tellal S, Achemlal L, et al. Bone turnover and hormonal perturbations in patients with fibromyalgia. Clin Exp Rheumatol. 2006;24(4):428–431.
 © 2026 The Author(s). This work is published and licensed by Dove Medical Press Limited. The
full terms of this license are available at https://www.dovepress.com/terms
and incorporate the Creative Commons Attribution
- Non Commercial (unported, 4.0) License.
By accessing the work you hereby accept the Terms. Non-commercial uses of the work are permitted
without any further permission from Dove Medical Press Limited, provided the work is properly
attributed. For permission for commercial use of this work, please see paragraphs 4.2 and 5 of our Terms.
© 2026 The Author(s). This work is published and licensed by Dove Medical Press Limited. The
full terms of this license are available at https://www.dovepress.com/terms
and incorporate the Creative Commons Attribution
- Non Commercial (unported, 4.0) License.
By accessing the work you hereby accept the Terms. Non-commercial uses of the work are permitted
without any further permission from Dove Medical Press Limited, provided the work is properly
attributed. For permission for commercial use of this work, please see paragraphs 4.2 and 5 of our Terms.