Back to Journals » Cancer Management and Research » Volume 12
PINK1 Overexpression Promotes Cell Migration and Proliferation via Regulation of Autophagy and Predicts a Poor Prognosis in Lung Cancer Cases
Authors Lu X, Liu QX, Zhang J, Zhou D, Yang GX, Li MY ![]() , Qiu Y, Chen Q, Zheng H
, Qiu Y, Chen Q, Zheng H ![]() , Dai JG
, Dai JG
Received 14 May 2020
Accepted for publication 24 July 2020
Published 24 August 2020 Volume 2020:12 Pages 7703—7714
DOI https://doi.org/10.2147/CMAR.S262466
Checked for plagiarism Yes
Review by Single anonymous peer review
Peer reviewer comments 3
Editor who approved publication: Dr Eileen O'Reilly
Xiao Lu,1,* Quan-Xing Liu,1,* Jiao Zhang,1 Dong Zhou,1 Gui-Xue Yang,1 Man-Yuan Li,1 Yuan Qiu,2 Qian Chen,3 Hong Zheng,1 Ji-Gang Dai1
1Department of Thoracic Surgery, Xinqiao Hospital, Army Medical University, Chongqing 400037, People’s Republic of China; 2Department of General Surgery, Xinqiao Hospital, Army Medical University, Chongqing 400037, People’s Republic of China; 3Cancer Center of Daping Hospital, Army Medical University, Chongqing 400042, People’s Republic of China
*These authors contributed equally to this work
Correspondence: Ji-Gang Dai; Hong Zheng Email [email protected]; [email protected]
Background: Lung cancer remains the leading cause of cancer-related death worldwide. The human PINK1 gene (PTEN induced kinase 1, Park6), an important gene for Parkinson’s disease, was found to be associated with tumor development although the molecular mechanisms underlying this relationship remain largely unknown.
Objective: To analyze the clinical value and molecular mechanism of PINK1 in non-small cell lung cancer (NSCLC).
Materials and Methods: Western blot, qRT-PCR and Immunohistochemistry were employed to determine the levels of PINK1 in 87 paired NSCLC tissues, Oncomine and TCGA databases were also used for the evaluation of expression and prognosis of PINK1. The mitophagy, proliferation, migration, invasion, and apoptosis abilities of A549 and H1975 cells were detected, and the autophagy-related proteins in the cells were also determined.
Results: Immunohistochemical staining revealed higher PINK1 expression in tumor tissues, which was strongly linked to the tumor-node-metastasis classification. Survival analysis of 1085 NSCLC patients also revealed that low PINK1 expression levels were associated with significantly longer overall survival. Univariate and multivariate analyses indicated that PINK1 expression was an independent predictor of overall survival among patients with NSCLC. We also evaluated the influence of PINK1 deficiency in NSCLC cell lines (A549 and H1975), which revealed significant suppression of migration capability and cell viability, as well as a significantly elevated apoptosis ratio. In cells with stable interference of PINK1 expression, dysfunctional mitochondria accumulated while autophagy was inhibited, which indicated that cell activity suppression was mediated by the accumulation of dysfunctional mitochondria. The suppression of migration and autophagy was reversed in cells that overexpressed PINK1.
Conclusion: Our results suggest that PINK1 may be a potential therapeutic target and prognostic biomarker in NSCLC.
Keywords: PINK1, NSCLC, mitochondria, autophagy, migration, proliferation
Introduction
Lung cancer remains the leading cause of cancer-related death worldwide and is the most common malignant tumor with the highest morbidity and mortality rates in China. The main histological subtype of lung cancer is non-small cell lung cancer (NSCLC), which accounts for approximately 75–80% of lung cancer cases.1–3 Patients with early-stage NSCLC are asymptomatic and only 20% of patients are diagnosed with local lesions, indicating that surgery may not be possible in many cases. Furthermore, the poor 5-year survival rate among NSCLC patients is related to tumor metastasis occurring at an early stage.4 Although the underlying mechanism remains unknown, many genes likely play roles in this process, which would be consistent with the diverse factors that are related to tumor development and invasion.5–7 Current evidence also suggests that the Parkinson’s disease gene family plays an important role in cancer cell proliferation and migration.8–11
Parkinson’s disease is a chronic progressive neurological disease that is caused by degeneration and death of substantia nigra cells.12 The Parkinson’s disease gene family (including PARK1/4, PARK2, PARK5, PARK6, PARK7, PARK8, PARK9, and PARK15) plays an important role in the occurrence and development of Parkinson’s disease.13 Recent studies have also indicated that expression of the Parkinson’s disease genes is inversely related to tumor development.14–16 The human PINK1 gene (PTEN induced kinase 1, Park6) is located on the short arm of chromosome 1 and encodes a serine/threonine protein kinase with 581 amino acids.17 This gene is widely expressed in mammalian tissues and cells, especially in the heart and reproductive system.18 Current studies have indicated that PINK1 plays an important role in tumor occurrence and development through inducing autophagy to eliminate dysfunctional mitochondria. Knockdown of PINK1 can significantly inhibit the cancer phenotype in breast and cervical cancer cells, although overexpression of this protein may also result in drug resistance and poor outcomes in esophageal squamous cell carcinoma models.19–23 Our previous research also revealed that PINK1 might be associated with tumorigenesis and progression of lung cancer,14 although the underlying functions and mechanisms were unclear. Therefore, this study aimed to clarify the potential role of PINK1 in regulating the proliferation and migration of lung cancer cells.
Materials and Methods
Cell Lines and Culture
Human NSCLC cell lines (A549 and H1975) were purchased from the Shanghai Institute of Country Cell Bank. The cells were cultured in DMEM (Hyclone, Logan, UT, USA) containing 2 mM L-glutamine (Sangon Biotech, Shanghai, China) and 10% FBS (Gibco, Grand Island, NY, USA) in a 37ºC humidified atmosphere containing 5% CO2. Digestion with trypsin-EDTA (Hyclone, Logan, Utah, USA) was performed when the cells were grown in culture flasks. The cells were subcultured (1:3) or used for experiments when the cell fusion proportion reached 90%.
Clinical Samples
Tumor specimens and adjacent normal tissue specimens were obtained from 91 NSCLC patients before they received any therapy (87 paired specimens and 4 tumor tissues). All patients had been treated at the Xinqiao Hospital, Army Medical University between 2004 and 2009. The patients had provided informed consent for research use of their specimens. This study was approved by the Ethical committee of Xinqiao Hospital of The Army Military Medical University (Approval number: AF/SC-08/1.0), and conducted in accordance with the Declaration of Helsinki. Furthermore, we confirmed that the data related to this manuscript were anonymized.
Immunohistochemistry and Scoring
The tissue specimens were paraffin-embedded, sectioned, dewaxed, and subjected to antigen retrieval using a citrate buffer. The sections were incubated with antibodies to PINK1 (1:25; ab23707, Abcam, Camb, UK) at 4°C overnight and then incubated with specific secondary HRP-conjugated antibodies (Dako, Santa Clara, CA) according to previously reported methods.24 The expression of PINK1 was detected and scored using a semi-quantitative staining index, which provides scores that range from 0 to 12. The index was calculated by multiplying the expression extent score (0 points: <5% positive cells, 1 point: 5–25% positive cells, 2 points: 26–50% positive cells, 3 points: 51–75% positive cells, and 4 points: >75% positive cells) by the staining intensity score (0 points: negative expression, 1 point: weak expression, 2 points: moderate expression, and 3 points: strong expression). A cut-off value of 6 points was used to define high/low expression scores, and all data were analyzed using X-tile software (version 3.6.1; New Haven, CT, USA).25
Creating Cells with Stable Interference or PINK1 Overexpression
Lentiviruses to provide stable interference or PINK1 overexpression were created by Sangon Biotech. The A549 and H1975 cells were infected with stabling interfering lentivirus (LV5-shPINK1), overexpression lentivirus (LV5-pCDH-ovPINK1), or control lentivirus (LV5-control) at a multiplicity of infection of 15 for 48 h. The positively infected cells were identified using puromycin (3 µg/mL, Gibco) and cloned using a limited-dilution method. The cells that were stably infected with shPINK1 (PINK1 interference) or ovPINK1 (PINK1 overexpression) and the control cells were cultured in DMEM containing 10% FBS and puromycin (1 mg/mL). The control shRNA sequence was 5′-UUCUCCGAACGUGUCACGUTT-3′ and the PINK1-specific shRNA sequence was 5′-CGCUGUUCCUCGUUAUGAATT-3′.
Quantitative RT-PCR
Total RNA from tissues and cells were extracted using the Trizol reagent (Invitrogen, USA). Reverse transcription was performed using the PrimeScript™ RT reagent with the gDNA Eraser Kit (TaKaRa, Japan) according to the manufacturer’s instructions. The cDNA samples were detected using TB Green® Premix Ex Taq™ II (Tli RNaseH Plus, TaKaRa, Japan) and the Bio-Rad CFX96 PCR System (Bio-Rad, Hercules, CA, USA) with CFX Manager Software (version 3.1, Bio-Rad). The primer sequences were: PINK1 forward primer: 5ʹ-CAAGAGAGGTCCCAAGCAAC-3ʹ, PINK1 reverse primer: 5ʹ-GGCAGCACATCAGGGTAGTC-3ʹ; GAPDH forward primer: 5ʹ-GGACCTGACCTGCCGTCTAG-3ʹ, GADPH reverse primer: 5ʹ-CCTGCTTCACCACCTTCTTGA-3ʹ.
Western Blotting
Total protein from tissues or cells was extracted using RIPA lysis buffer (Sangon Biotech, Shanghai, China) and quantified using a BCA kit (Beyotime Biotech, Shanghai, China). Equal amounts of protein from each sample were separated using 10% SDS-polyacrylamide gels and transferred onto polyvinylidene fluoride membranes (Millipore, MA, USA). After blocked with 5% non-fat milk, the polyvinylidene fluoride membranes were incubated at 4°C overnight with antibodies specific to LC3 (1:1000, # 12741S), SQSTM1 (1:1000, # 39749S), ATG5 (1:1000, # 12994S), Beclin-1 (1:1000, #3495S), and β-actin (1:2000, #8457S) (all purchased from Cell Signaling Technology, Boston, USA), as well as antibodies specific to PINK1 (1:1000, Abcam, UK). The polyvinylidene fluoride membranes were subsequently incubated at room temperature for 2 h with corresponding secondary HRP-conjugated antibodies (1:20,000). The protein bands were visualized using the ECL kit (Beyotime Biotech, Shanghai, China), exposed using a Chemiluminescence Imaging System (Fusion Solo S, Vilber, France), and the greyscale values were analyzed using Image J software (version 1.51d, NIH, USA).
CCK-8 Assay
The cells that were stably infected with shPINK1 and the control cells were seeded into 96-well plates and incubated for 24 h, 48 h, 72 h, and 96 h. A total of 10 µL of Cell Counting Kit-8 (Beyotime Biotech) was added to each well for 2 h and the absorbance was then measured at 450 nm.
Flow Cytometry
The cells that were stably infected with shPINK1 and the control cells were incubated in 12-well plates, then treated with fresh medium or CDDP (5uM, Sigma-Aldrich) for 24 h and digested by trypsin (Hyclone). The cell suspension was transferred to 1.5 mL centrifuge tubes and stained using Annexin V for 30 min. The PI buffer was added and then apoptosis was detected using a BD FACS CaliburTM device (Franklin Lakes, NJ, USA).
Cell Migratory Assay
The cells’ migration capabilities were evaluated using the transwell assay and the wound healing assay. For the transwell assay, 4×10⁴ shPINK-positive cells or control cells were seeded into the upper chamber with FBS-free medium (8 µm pore size; Millipore), and 500 µL of complete medium was added to the lower chambers of 24-well plates. After incubation for 24 h, the cells on the underside of the filter membrane were fixed, stained, and counted. For the wound healing assay, 1×10⁶ shPINK1-positive cells or control cells were seeded into 6-well plates and incubated for 24 h. The cells were then scratched using 1000 µL pipette tips and washed 3 times using PBS. The plates were photographed at 0 h and 24 h for comparison.
Mitochondrial Membrane Potential Assay
Detection of the mitochondrial membrane potential was performed using a mitochondrial membrane potential assay kit with JC-1 (Beyotime Biotech). According to the manufacturer’s instructions, 2×10⁵ A549 cells or H1975 cells were stained with JC-1 for 20 min, washed twice, and then the fluorescence intensity (red/green) was detected.
Detecting Reactive Oxygen Species
The mitochondria from A549 cells and H1975 cells were isolated according to the instructions for the Cell Mitochondria Isolation Kit (Beyotime Biotech). Mitochondrial levels of reactive oxygen species (ROS) were evaluated using the Reactive Oxygen Species Assay Kit (Beyotime Biotech).
Transmission Electron Microscopy
A total of 1×10⁶ cells were centrifuged after digestion using trypsin and then fixed for 2 h using 2.5% glutaraldehyde. The products were dehydrated using a gradient of 50% ethanol, 70% ethanol, 90% ethanol, 90% ethanol plus 90% acetone (1:1), and 90% acetone at 4ºC, with a final dehydration step using 100% acetone for 20 min. The cells were sliced after embedding and solidifying, and stained using 3% uranium acetate plus lead citrate. Transmission electron microscopy was then used to evaluate the mitochondrial dysfunction in shPINK1-positive cells.
Immunofluorescence
A total of 5×10⁴ A549 cells or H1975 cells (from the control, shPINK1, or ovPINK1 groups) were seeded into 24-well plates and incubated overnight. The cells were then transfected with the LC3 plasmid for 24 h using a Lipofectamine 3000 transfection kit (Invitrogen). The cells were subsequently washed using PBS, fixed using 4% paraformaldehyde (Sangon Biotech), permeabilized using 0.1% Triton-X 100 (Amresco, Radnor, PA, USA), and blocked for 1 h with 5% goat serum (Gibco). The slides were then stained for 5 min using DAPI buffer (Beyotime Biotech) and mounted for fluorescence microscopy using DAKO Fluorescence Mounting Medium (Agilent, La Jolla, CA, USA). The image acquisition was performed using a LSM 780 NLO microscope system and the image export/analysis was performed using ZEN Imaging Software (Zeiss).
PINK1 Rescue Experiment
The cell autophagy and migratory capacity were detected when over-expressed PINK1 in shPINK1 cells. Briefly, 1x10⁶ cells were seeded in 6-well plate and the 4ug PINK1 overexpressed plasmid was transfected into A549 and H1975 cells with Lipofectamine 3000 (Invitrogen). Twenty-four hours later, the cells were digested by trypsin (Hyclone) and counted for transwell assay. For immunofluorescence assay, 1×10⁵ shPINK1 A549 and H1975 cells were seeded in 24-well plate overnight and then transfected with GFP-LC3 plasmid plus PINK1 overexpressed plasmid or control plasmid for 36h. The RNA and protein were also collected after PINK1 transfection. These experimental procedures were same as above.
Statistical Analysis
All results were expressed as mean ± standard deviation. Data regarding cell numbers, wound widths, and relative grayscale values were analyzed using Image J software. Inter-group comparisons were performed with SPSS software (version 19.0) using one-way analysis of variance or the unpaired two-tailed Student’s t-test. Differences were considered statistically significant at P-values of <0.05.
Results
Abnormal PINK1 Expression in NSCLC Specimens
The expression of PINK1 was evaluated in 87 pairs of tumor tissues and adjacent normal tissues via immunohistochemical analysis. High expression was significantly more common in the tumor tissues than in the adjacent normal tissues (78.02% vs 35.6%, P=0.000) (Figure 1A and Table 1). We also evaluated PINK1 expressions in the two groups via qRT-PCR analyses with 25 paired specimens from NSCLC patients, which revealed upregulation of PINK1 transcription in the tumor tissues (Figure 1B). Western blotting using 5 paired specimens also confirmed this result (Figure 1C), as well as data from the Oncomine database26 (Figure 1D). These results indicated that PINK1 expression was significantly upregulated in NSCLC cells, relative to in cells from adjacent normal tissue.
 |
Table 1 The Level of PINK1 Expression in NSCLC and Adjacent Normal Tissue |
 |
Figure 1 PINK1 is highly expressed in NSCLC tissues. (A) Representative images (left) of tumor tissues and normal tissues with PINK1 staining (scale bar = 50 µm), plus the immunohistochemical scores for tumor tissues and adjacent normal tissues from 87 patients with non-small cell lung cancer (NSCLC, right). (B) Expression ratios of PINK1/GAPDH in the tumor tissues and corresponding normal tissues from 25 paired NSCLC samples (left) and the results of the quantitative assay (right). (C) Protein levels of PINK1 from 5 paired NSCLC samples (top) and the relative densities as determined using Image J software (bottom). The data were presented as mean ± standard deviation for 3 independent experiments. (D) Log2 median-centered intensities of PINK1 expression in 226 tumor tissues and 20 normal tissues from the Oncomine database (Okayama). *p < 0.05, **p < 0.01, ***p< 0.001. |
High PINK1 Expression Was Associated with Tumor Malignancy and Poor Prognosis
Table 2 shows the clinicopathological features of the NSCLC specimens that were used, and the relationships between PINK1 expression and the clinicopathological features are shown in Table 3. The intensity of staining for PINK1 varied according to TNM classification, and high PINK1 expression was much more common in specimens from patients with advanced-stage NSCLC than in patients with early-stage NSCLC. Moreover, the expression of PINK1 was closely related to tumor diameter (P=0.008) and lymphatic metastasis (P=0.001) (Figure 2A and Table 3). Kaplan-Meier survival curves revealed that high PINK1 expression was associated with remarkably shorter survival, relative to low PINK1 expression (median survival: 39 months vs 62 months, P=0.011) (Figure 2B), and similar results were observed among 994 NSCLC patients from the TCGA database (P=0.032) (Figure 2C). In addition, the univariate and multivariate analyses revealed that advanced TNM stage and high PINK1 expression were associated with poor overall survival, and that poor overall survival was independently predicted by high PINK1 expression in NSCLC (hazard ratio: 2.279, 95% confidence interval: 1.182–4.395; P=0.014) (Table 4).
 |
Table 2 The Clinical Features of the NSCLC Specimens Used in This Study |
 |
Table 3 The Relationship Between PINK1 Expression and Clinicopathological Features of NSCLC Patients |
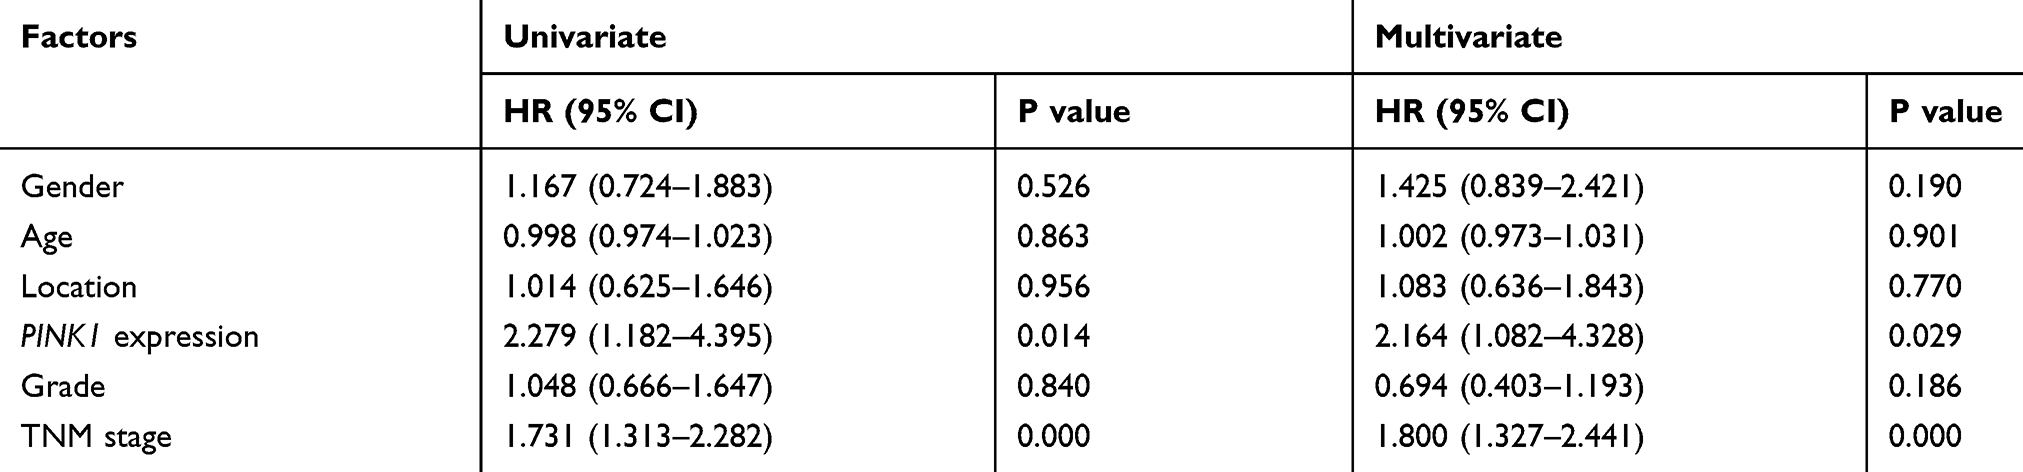 |
Table 4 Univariate and Multivariate Analysis for Overall Survival in NSCLC Patients |
 |
Figure 2 PINK1 expression is associated with tumor malignancy and outcomes in NSCLC patients. (A) Representative images (left) of tumor tissues from TMN stage I–IV with hematoxylin and eosin staining, as well as PINK1 staining (scale bar = 200 µm), plus the immunohistochemical scores for TNM stage I–IV specimens from 91 patients with non-small cell lung cancer (NSCLC, right). (B) Kaplan-Meier survival curves for patients with NSCLC according to low PINK1 expression (n=20) and high PINK1 expression (n=71). (C) Kaplan-Meier curves for patients from the TCGA database according to low PINK1 expression (n=204) and high PINK1 expression (n=790). *p < 0.05, **p < 0.01, ***p< 0.001. |
PINK1 Played an Important Role in Cell Migration and Survival in vitro
Cells with stable PINK1 interference were created using the A549 and H1975 cell lines. Figure 3 shows that the viability of both cell lines was significantly reduced by PINK1 interference. The RNA and protein level of PINK1in normal cell and shPINK1 cell was detected, respectively (Figure 3A and F). Compared to those in the control cells, obviously wider wounds and weaker cell migration were observed for shPINK1-positive cells from the A549 cell line (Figure 3B and C) and the H1975 cell line (Figure 3G and H). Furthermore, downregulation of PINK1 significantly increased the apoptosis rate when cells were treated with CDDP (Figure 3D and I) and suppressed cell viability (Figure 3E and J) in both two cell lines. These results indicated that PINK1 played a crucial role in cell survival and migration.
 |
Figure 3 PINK1 deficiency was associated with significantly inhibited cellular activity. Human NSCLC cell lines A549 and H1975 were used to create cells with stable interference of PINK1 expression and corresponding control cells for functional trials. A total of 1×10⁶ A549 cells (A) and H1975 cells (F) were inoculated into 6-well plates overnight, cultured for 24 h, and then lysed on ice through WB lysis buffer or Trizol. The mRNA and protein level of PINK1 was detected by qRT-PCR assay and Western blot, respectively. A total of 1×10⁶ A549 cells (B) and H1975 cells (G) were inoculated into 6-well plates overnight, cultured for 24 h, then scratched using 1000 µL tips. Photographs were taken at 0 h and 24 h. A total of 2×10⁴ A549 cells (C) and H1975 cells (H) were inoculate into transwell chamber with FBS-free medium and then the cell numbers on the underside of the filter membrane were determined based on 20 visual fields. A total of 5×10⁵ A549 cells (D) and H1975 cells (I) were inoculated into 12-well plates for 12 h and then treated with DMEM or Cisplatin (CDDP) for 24h. The apoptosis ratio was detected using flow cytometry. A total of 2×10³ A549 cells (E) and H1975 cells (J) were inoculated into 96-well plates and cell viability was detected after incubation for 24 h, 48 h, 72 h, and 96 h. The data were presented as mean ± standard deviation for 3 independent experiments. *p < 0.05, **p < 0.01, ***p< 0.001. |
PINK1 Regulated Cell Activity Through Autophagy
Given that PINK1 plays a crucial role in clearing dysfunctional mitochondria, we evaluated related cellular parameters. The results showed that PINK1 interference contributed to the accumulation of dysfunctional mitochondria in the A549 and H1975 cell (Figure 4A) and significantly upregulated ROS production (Figure 4B), decreased the mitochondria membrane potential (Figure 4C). Elimination of dysfunctional mitochondrial is mediated by autophagy, which prompted us to evaluate the level of autophagy in control cells and shPINK1-positive cells. The GFP-LC3 puncta was remarkably decreased in shPINK1-positive cells, relative to the control cells (Figure 4D and E). The results from Western blotting and immunofluorescence also revealed marked changes in autophagy-related proteins, with shPINK1-positive cells having decreased levels of the Beclin-1 and LC3 proteins, as well as increased levels of the SQSTM 1 protein (Figure 4F and G). These results suggested that PINK1-related inhibition of cell migration and survival was associated with the accumulation of dysfunctional mitochondria.
 |
Figure 4 PINK1 regulated cellular activities and was mediated by autophagy. (A) Transmission electron microscopy was used to investigate the status of mitochondria in the control cells and cells with stable PINK1 interference. Mitophagy (degradation of dysfunctional mitochondria) was indicated as the yellow triangle. Alterations in (B) reactive oxygen species production and (C) mitochondrial membrane potential were detected in the A549 and H1975 cell lines. The autophagy levels of A549 cells (D) and H1975 cells (E) were evaluated using immunofluorescence in the cells with stable PINK1 interference (scale bar = 5 µm). Autophagy-related proteins in A549 cells (F) and H1975 cells (G) were separated using Western blotting and the relative intensities were analyzed using Image J software. The data were presented as mean ± standard deviation for 3 independent experiments. *p < 0.05, **p < 0.01. |
PINK1 Overexpression Reversed the Migration Suppression in Two NSCLC Cells
The role of PINK1 in regulating autophagy and migration of NSCLC cells was evaluated using PINK1-overexpressing (ovPINK1) A549 and H1975 cells. The RNA and protein level of PINK1 were detected in Figure 5C, E, G and J. The ovPINK1-positive cells had significantly increased the migratory capacity during transwell assay and wound healing assay. While shPINK1-positive cells had much wider simulated wounds than the control cells, the wound widths were markedly decreased for ovPINK1-positive cells (Figure 5A and B). Similarly, ovPINK1-positive cells had a greater autophagy level with upregulating autophagy-related proteins, excepted SQSTM 1 (Figure 5D and F). Moreover, overexpressing PINK1 in shPINK1 cells was effective promoting the cell autophagy accompanying with accumulated GFP-LC3 puncta (Figure 5H and K), and increasing cell migratory capacity (Figure 5I and L). When considered together, all of these findings suggest that PINK1 plays an important role in the autophagy and migration of NSCLC cells.
 |
Figure 5 Overexpression of PINK1 reversed the suppression of autophagy and migration. Human NSCLC cell lines A549 and H1975 were used to create cells with stable PINK1 interference, cells with stable PINK1 overexpression, and corresponding control cells for the functional trials. The migration capabilities of A549 cells (A) and H1975 cells (B) were detected using the transwell and wound healing assays using cells with stable interference or PINK1 overexpression. The mRNA and protein level of PINK1 in normal, stable interfering or overexpressed PINK1 of A549 (C) and 1975 (E) cells. Western blotting was used to evaluate the expressions of autophagy-related proteins in the shPINK1 groups, ovPINK1 groups, and control groups of A549 cells (D) and H1975 cells (F). The overexpressed PINK1 plasmid was transfected into shPINK1 cells and the mRNA and protein level of PINK1 was detected in A549 (G) and 1975 (J) cells. A total of 1×10⁵ shPINK1 A549 cells (H) and H1975 cells (K) were inoculated into 24-well plates overnight. The GFP-LC3 plasmid plus PINK1 overexpressed plasmid or control plasmid were transfected into cells for 36 h and the GFP-LC3 puncta was detected using Image J software (scale bar = 5 µm). A total of 1×10⁶ shPINK1 A549 cells (I) and H1975 cells (L) were inoculated into 6-well plates overnight and then transfected with PINK1 overexpressed plasmid or control plasmid for 24h. The cells were digested and 2x10⁴ cells were plated in transwell insert. The migratory capacity was detected through transwell assay. **p < 0.01, ***p < 0.001. |
Discussion
Unlimited proliferation and migration are critical to cancer development, invasion, and metastasis, which are processes that contribute to tumor progression and recurrence. This study revealed that PINK1 was involved in the regulation of NSCLC cell viability, migration, and apoptosis, which suggests that PINK1 was a crucial mediator in NSCLC. Moreover, PINK1 expression might be a prognostic biomarker, as poor survival was linked to elevated PINK1 expression in 87 pairs of tumor tissues and adjacent normal tissues. The univariate and multivariate analyses also revealed that PINK1 expression might be an independent prognostic factor for NSCLC patients (Table 4).
The PINK1 protein plays an important role in the pathogenesis of Parkinson’s disease, and mutations in the PINK1 gene are crucial pathogenic factors that cause familial neurodegenerative diseases.27 The precursors of PINK1 are synthesized in the endoplasmic reticulum and guided into the mitochondrial matrix by their N-terminal signal peptides. The signal peptide is then degraded when the PINK1 precursor is transferred into the mitochondrial intima, which causes release of the mature protein and allows it to be hydrolyzed in the matrix. In the depolarized mitochondria, the full-length PINK1 is inserted and fixed into the mitochondrial outer membrane by TOM (translocator of the outer mitochondrial membrane) through its termination signal of intimal metastasis domain.28 Thus, accumulation of PINK1 in the mitochondrial outer membrane is an important marker of mitochondrial damage and induces autophagy to eliminate the depolarized mitochondria.29,30 However, PINK1 deficiency can also lead to mitochondrial dysfunction.31,32 The present study revealed that stable interference of PINK1 expression in two NSCLC cell lines was associated with dysfunctional mitochondria accumulation, up-regulated ROS production, and decreased mitochondrial membrane potential (Figure 4A), which is consistent with previously reported findings.15,33,34
There is growing evidence that PINK1 expression is associated with tumor cell activities. For example, O’Flanagan et al19 reported that PINK1 expression protected cells from damage caused by various cytotoxic agents and promoted survival in multiple tumor cell models. Murata et al35 also reported that PINK1 overexpression increased resistance against chemotherapeutic drugs, proteasome inhibitors, and oxidative stress in neuroblastoma cells and prostate cancer cells. Our study evaluated changes in cellular biological activity after stably interfering with PINK1 expression, which was associated with significantly reduced cell migration capability and viability, as well as an increased apoptosis ratio (Figure 3).
The relationship between PINK1 and cell autophagy has attracted considerable research attention. In this context, the unhydrolyzed PINK1 protein attaches to the outer mitochondrial membrane and activates the autophagy process to eliminate the dysfunctional mitochondria.36–38 Autophagy is also associated with cell migration, proliferation, and apoptosis, although the molecular mechanisms underlying the relationship between autophagy and cellular activities remain unclear.39–41 The present study revealed that autophagy was severely suppressed in cells with stable interference of PINK1 expression (Figure 4B–E), which suggests that deficient autophagy might be related to the PINK1 mediation of suppression of cell proliferation and migration. Moreover, autophagy was upregulated and migratory suppression was reversed when the cells overexpressed PINK1.
In conclusion, we found that PINK1 was an independent prognostic biomarker in cases of NSCLC, and that stable interference of PINK1 expression suppressed NSCLC cell migration and proliferation. However, these findings are limited by the relatively small sample size (only 87 pairs of tumor tissues and adjacent normal tissues), as well as the need to confirm that high PINK1 expression is independently associated with shorter survival among a larger sample of patients. Moreover, additional in vivo studies are needed to confirm that regulation of PINK1 helps suppress cell proliferation and migration, which we hope to investigate in future studies.
Data Sharing Statement
The data used to support the findings of this study are included within the article.
Disclosure
The authors declare that there are no conflicts of interest regarding the publication of this report.
References
1. Chabowski M, Polanski J, Jankowska-Polanska B, Lomper K, Janczak D, Rosinczuk J. The acceptance of illness, the intensity of pain and the quality of life in patients with lung cancer. J Thorac Dis. 2017;9:2952. doi:10.21037/jtd.2017.08.70
2. Wang S, Lian X, Sun M, Luo L, Guo L. Efficacy of compound Kushen injection plus radiotherapy on nonsmall-cell lung cancer: a systematic review and meta-analysis. J Cancer Res Ther. 2016;12:1298. doi:10.4103/0973-1482.199538
3. Torre LA, Bray F, Siegel RL, Ferlay J, Lortet-Tieulent J, Jemal A. Global cancer statistics, 2012. CA Cancer J Clin. 2015;65:87. doi:10.3322/caac.21262
4. Silva GT, Bergmann A, Thuler LC. Incidence, associated factors, and survival in metastatic spinal cord compression secondary to lung cancer. Spine J. 2015;15:1263. doi:10.1016/j.spinee.2015.02.015
5. Goel A, Chhabra R, Ahmad S, et al. DAMTC regulates cytoskeletal reorganization and cell motility in human lung adenocarcinoma cell line: an integrated proteomics and transcriptomics approach. Cell Death Dis. 2012;3:e402. doi:10.1038/cddis.2012.141
6. Smolle E, Leithner K, Olschewski H. Oncogene addiction and tumor mutational burden in non-small-cell lung cancer: clinical significance and limitations. Thorac Cancer. 2020;11:205. doi:10.1111/1759-7714.13246
7. Skoulidis F, Heymach JV. Co-occurring genomic alterations in non-small-cell lung cancer biology and therapy. Nat Rev Cancer. 2019;19(9):495–509. doi:10.1038/s41568-019-0179-8
8. Fiala O, Zahorakova D, Pospisilova L, et al. Parkin (PARK 2) mutations are rare in Czech patients with early-onset Parkinson’s disease. PLoS One. 2014;9:e107585. doi:10.1371/journal.pone.0107585
9. Cao J, Lou S, Ying M, Yang B. DJ-1 as a human oncogene and potential therapeutic target. Biochem Pharmacol. 2015;93:241. doi:10.1016/j.bcp.2014.11.012
10. Lin Y, Chen Q, Liu QX, et al. High expression of DJ-1 promotes growth and invasion via the PTEN-AKT pathway and predicts a poor prognosis in colorectal cancer. Cancer Med. 2018;7:809. doi:10.1002/cam4.1325
11. Matsuo Y, Kamitani T, Feany MB. Parkinson’s disease-related protein, alpha-synuclein, in malignant melanoma. PLoS One. 2010;5:e10481. doi:10.1371/journal.pone.0010481
12. Pagonabarraga J, Kulisevsky J, Strafella AP, Krack P. Apathy in Parkinson’s disease: clinical features, neural substrates, diagnosis, and treatment. Lancet Neurol. 2015;14:518. doi:10.1016/S1474-4422(15)00019-8
13. Hardy J. Genetic analysis of pathways to Parkinson disease. Neuron. 2010;68:201. doi:10.1016/j.neuron.2010.10.014
14. Liu QX, Zheng H, Deng XF, Zhou D, Dai JG. Status of the Parkinson’s disease gene family expression in non-small-cell lung cancer. World J Surg Oncol. 2015;13(1). doi:10.1186/s12957-015-0646-y
15. Liu L, Zuo Z, Lu S, Wang L, Liu A, Liu X. Silencing of PINK1 represses cell growth, migration and induces apoptosis of lung cancer cells. Biomed Pharmacother. 2018;106:333. doi:10.1016/j.biopha.2018.06.128
16. Jin Y, Murata H, Sakaguchi M, et al. Partial sensitization of human bladder cancer cells to a gene-therapeutic adenovirus carrying REIC/Dkk-3 by downregulation of BRPK/PINK1. Oncol Rep. 2012;27:695.
17. Matsuda S, Nakanishi A, Minami A, Wada Y, Kitagishi Y. Functions and characteristics of PINK1 and Parkin in cancer. Front Biosci (Landmark Ed). 2015;20:491. doi:10.2741/4321
18. Berthier A, Navarro S, Jimenez-Sainz J, et al. PINK1 displays tissue-specific subcellular location and regulates apoptosis and cell growth in breast cancer cells. Hum Pathol. 2011;42:75. doi:10.1016/j.humpath.2010.05.016
19. O’Flanagan CH, O’Neill C. PINK1 signalling in cancer biology. Biochim Biophys Acta. 2014;1846:590.
20. Li L, Hu G-K. Pink1 protects cortical neurons from thapsigargin-induced oxidative stress and neuronal apoptosis. Biosci Rep. 2015;35(1). doi:10.1042/BSR20140104
21. O’Flanagan CH, Morais VA, Wurst W, De Strooper B, O’Neill C. The Parkinson’s gene PINK1 regulates cell cycle progression and promotes cancer-associated phenotypes. Oncogene. 2015;34:1363. doi:10.1038/onc.2014.81
22. Zhang R, Gu J, Chen J, et al. High expression of PINK1 promotes proliferation and chemoresistance of NSCLC. Oncol Rep. 2017;37:2137. doi:10.3892/or.2017.5486
23. Yamashita K, Miyata H, Makino T, et al. High expression of the mitophagy-related protein Pink1 is associated with a poor response to chemotherapy and a poor prognosis for patients treated with neoadjuvant chemotherapy for esophageal squamous cell carcinoma. Ann Surg Oncol. 2017;24:4025. doi:10.1245/s10434-017-6096-8
24. Chen J, Yang WJ, Sun HJ, Yang X, Wu YZ. C5b-9 staining correlates with clinical and tumor stage in gastric adenocarcinoma. Appl Immunohistochem Mol Morphol. 2016;24:470. doi:10.1097/PAI.0000000000000218
25. Camp RL, Dolled-Filhart M, Rimm DL. X-tile: a new bio-informatics tool for biomarker assessment and outcome-based cut-point optimization. Clin Cancer Res. 2004;10:7252. doi:10.1158/1078-0432.CCR-04-0713
26. Okayama H, Kohno T, Ishii Y, et al. Identification of genes upregulated in ALK-positive and EGFR/KRAS/ALK-negative lung adenocarcinomas. Cancer Res. 2012;72:100. doi:10.1158/0008-5472.CAN-11-1403
27. Poewe W, Seppi K, Tanner CM, et al. Parkinson disease. Nat Rev Dis Primers. 2017;3:17013. doi:10.1038/nrdp.2017.13
28. Schulz C, Schendzielorz A, Rehling P. Unlocking the presequence import pathway. Trends Cell Biol. 2015;25:265. doi:10.1016/j.tcb.2014.12.001
29. Nguyen TN, Padman BS, Lazarou M. Deciphering the molecular signals of PINK1/Parkin mitophagy. Trends Cell Biol. 2016;26:733. doi:10.1016/j.tcb.2016.05.008
30. Pallanck L. Mitophagy: mitofusin recruits a mitochondrial killer. Curr Biol. 2013;23:R570. doi:10.1016/j.cub.2013.05.032
31. Matsui H, Gavinio R, Asano T, et al. PINK1 and Parkin complementarily protect dopaminergic neurons in vertebrates. Hum Mol Genet. 2013;22:2423. doi:10.1093/hmg/ddt095
32. Triplett JC, Zhang Z, Sultana R, et al. Quantitative expression proteomics and phosphoproteomics profile of brain from PINK1 knockout mice: insights into mechanisms of familial Parkinson’s disease. J Neurochem. 2015;133:750. doi:10.1111/jnc.13039
33. Parganlija D, Klinkenberg M, Dominguez-Bautista J, et al. Loss of PINK1 impairs stress-induced autophagy and cell survival. PLoS One. 2014;9:e95288. doi:10.1371/journal.pone.0095288
34. Ci Y, Shi K, An J, et al. ROS inhibit autophagy by downregulating ULK1 mediated by the phosphorylation of p53 in selenite-treated NB4 cells. Cell Death Dis. 2014;5:e1542. doi:10.1038/cddis.2014.506
35. Murata H, Sakaguchi M, Jin Y, et al. A new cytosolic pathway from a Parkinson disease-associated kinase, BRPK/PINK1: activation of AKT via mTORC2. J Biol Chem. 2011;286:7182. doi:10.1074/jbc.M110.179390
36. Bader V, Winklhofer KF. PINK1 and Parkin: team players in stress-induced mitophagy. Biol Chem. 2020;401(6–7):891–899. doi:10.1515/hsz-2020-0135
37. Jiang XS, Chen XM, Hua W, et al. PINK1/Parkin mediated mitophagy ameliorates palmitic acid-induced apoptosis through reducing mitochondrial ROS production in podocytes. Biochem Biophys Res Commun. 2020;525:954. doi:10.1016/j.bbrc.2020.02.170
38. Gu J, Zhang T, Guo J, Chen K, Li H, Wang J. PINK1 activation and translocation to mitochondria-associated membranes mediates mitophagy and protects against hepatic ischemia/reperfusion injury. Shock. 2020;Publish Ahead of Print. doi:10.1097/SHK.0000000000001534
39. Hill C, Wang Y. The importance of epithelial-mesenchymal transition and autophagy in cancer drug resistance. Cancer Drug Resist. 2020;3:38.
40. Wu Q, Xiang M, Wang K, et al. Overexpression of p62 induces autophagy and promotes proliferation, migration and invasion of nasopharyngeal carcinoma cells through promoting ERK signaling pathway. Curr Cancer Drug Targets. 2020;20. doi:10.2174/1568009620666200424145122
41. Jing Z, Ye X, Ma X, et al. SNGH16 regulates cell autophagy to promote Sorafenib resistance through suppressing miR-23b-3p via sponging EGR1 in hepatocellular carcinoma. Cancer Med. 2020;9(12):4324–4338. doi:10.1002/cam4.3020
 © 2020 The Author(s). This work is published and licensed by Dove Medical Press Limited. The
full terms of this license are available at https://www.dovepress.com/terms
and incorporate the Creative Commons Attribution
- Non Commercial (unported, 3.0) License.
By accessing the work you hereby accept the Terms. Non-commercial uses of the work are permitted
without any further permission from Dove Medical Press Limited, provided the work is properly
attributed. For permission for commercial use of this work, please see paragraphs 4.2 and 5 of our Terms.
© 2020 The Author(s). This work is published and licensed by Dove Medical Press Limited. The
full terms of this license are available at https://www.dovepress.com/terms
and incorporate the Creative Commons Attribution
- Non Commercial (unported, 3.0) License.
By accessing the work you hereby accept the Terms. Non-commercial uses of the work are permitted
without any further permission from Dove Medical Press Limited, provided the work is properly
attributed. For permission for commercial use of this work, please see paragraphs 4.2 and 5 of our Terms.