Back to Journals » OncoTargets and Therapy » Volume 11
Pim1 promotes cell proliferation and regulates glycolysis via interaction with MYC in ovarian cancer
Authors Wu Y ![]() , Deng Y, Zhu J, Duan Y
, Deng Y, Zhu J, Duan Y ![]() , Weng W, Wu XH
, Weng W, Wu XH ![]()
Received 18 July 2018
Accepted for publication 15 August 2018
Published 9 October 2018 Volume 2018:11 Pages 6647—6656
DOI https://doi.org/10.2147/OTT.S180520
Checked for plagiarism Yes
Review by Single anonymous peer review
Peer reviewer comments 3
Editor who approved publication: Dr William C. Cho
Yong Wu,1,2 Yu Deng,2,3 Jun Zhu,1,2 Yachen Duan,1,2 WeiWei Weng,2,3 Xiaohua Wu1,2
1Department of Gynecologic Oncology, Fudan University Shanghai Cancer Center, Shanghai, People’s Republic of China; 2Department of Oncology, Shanghai Medical College, Fudan University, Shanghai, People’s Republic of China; 3Department of Pathology, Fudan University Shanghai Cancer Center, Shanghai, People’s Republic of China
Background: Ovarian cancer (OC) is the leading cause of death among women with gynecologic malignancies. Recent studies have highlighted the role of Pim1, which belongs to a group of constitutively activated serine/threonine kinases, in cancer development. However, the effect of Pim1 in OC is largely unclear.
Methods: OC cell lines with Pim1 overexpression or knockdown were constructed with lentivirus transduction. Cell Counting Kit-8, colony formation, glycolysis stress test and in vivo mice models were carried out to assess the effect of Pim1 on OC biological functions. Co-immunoprecipitation assay coupled with western blot were performed to explore the intrinsic mechanisms of Pim1 in OC. Bioinformatic analysis was then performed to evaluate the expression and prognostic value of Pim1.
Results: We present the first evidence that silencing or overexpressing Pim1 can suppress or promote, respectively, OC cell proliferation. Furthermore, we demonstrated that Pim1 can significantly enhance glycolysis in OC cells. In vivo experiments further confirmed that knockdown of Pim1 inhibits the growth of tumors derived from the SKOV3 cell line. To search for the underlying molecular mechanism, we examined the effect of Pim1 on MYC, a pivotal gene in glycolysis, and observed that Pim1-mediated phosphorylation of c-Myc activated the expression of glycolysis-associated key genes such as PGK1 and LDHA. Moreover, we found that the Pim1 inhibitor SMI4a induced chemosensitization to cisplatin. Clinically, Pim1 was also overexpressed in OC and correlated with poor overall survival by bioinformatics analysis.
Conclusion: Together, these results suggest that Pim1 contributes to proliferation and glycolysis in OC via interaction with MYC and may serve as a potential target in the treatment of OC patients.
Keywords: Pim1, ovarian cancer, c-Myc, glycolysis, SMI4a, therapeutic target
Introduction
Ovarian cancer (OC) is the fifth leading cause of cancer-related death in women worldwide.1,2 The reason for the high death rate is the absence of early symptoms in most cases, meaning that the majority of OC patients are diagnosed at a late stage.2,3 Although a significant proportion of women attain a complete response with modern management strategies, most of those who present with advanced disease will develop recurrence within 18 months.4 This condition emphasizes the urgency of early detection of these patients and the establishment of new therapeutic targets for successful intervention.
Aerobic glycolysis, which is also known as the Warburg effect and is a hallmark of cancer, is characterized by the increased conversion of glucose into lactate irrespective of oxygen availability and is an important process that provides numerous intermediates for cell survival and new biomass building in cancer.5–7 Various studies found that aerobic glycolysis plays a key role in tumorigenesis in OC.8–10 Because it is closely associated with tumor growth and progression, aerobic glycolysis is considered a metabolic signature of invasive cancer. Thus, a better understanding of the underlying mechanisms of glycolysis in OC might aid in the discovery of novel treatment opportunities that are urgently needed.
Previous studies identified a group of constitutively activated serine/threonine kinases in the Pim murine leukemia virus family, which includes Pim1.11–13 Pim1, a member of the PIM kinase family, has been implicated in the control of cancer cell proliferation, migration and apoptosis.13 Knowledge of Pim1 in carcinomas has been emerging in recent years. Previous evidence has shown that overexpression of Pim1 in various human cancers such as breast cancer and glioblastoma is well correlated with processes of cancer progression, including cell proliferation, cell cycle arrest, apoptosis, migration, invasion, and drug resistance. However, the role and underlying mechanisms of Pim1 in growth, development, and aerobic glycolysis in OC remain unclear.
This study was undertaken to test the hypothesis that Pim1 provides a proliferative advantage and regulates glycolysis in OC. Furthermore, we examined the impact of Pim1 on c-Myc to explore the underlying molecular mechanism.
Materials and methods
Cell lines and reagents
The human OC cell lines SKOV3 and OVCAR3 were obtained from American Type Culture Collection (Manassas, VA, USA) and were maintained in Dulbecco’s Modified Eagle’s Medium (DMEM) containing 10% FBS, 100 U/mL penicillin G, and 100 μg/mL streptomycin in a humid atmosphere with 5% CO2 at 37°C. The A2780 cell line was obtained from the European Collection of Cell Cultures and was cultured in RPMI-1640 containing 10% FBS and 100 U/mL penicillin-streptomycin mixture (Thermo Fisher Scientific) at 37°C and 5% CO2. The human epithelial OC line 433 was purchased from Sailybio Company and was grown in DMEM (Thermo Fisher Scientific) containing 10% FBS, 100 U/mL penicillin G, and 100 μg/mL streptomycin in a humid atmosphere with 5% CO2 at 37°C. Antibodies against Pim1 (#2907), c-Myc (#5605), p-Ser62 c-Myc (#13748), PGK1 (#3248), PKM2 (#8337), PKM1/2 (#8337), and LDHA (#8337) were purchased from Cell Signaling Technology (Danvers, MA, USA). The Pim1 inhibitor SMI4a (Selleckchem , Houston, TX, USA) and the cytotoxic agent cisplatin were dissolved in dimethyl sulfoxide and kept at −20°C prior to in vitro studies.
Plasmid, RNAi, and stable cell lines using lentivirus transfection
The control vector pcDNA3.1 and plasmid pcDNA3.1-Pim1 (Pim1) were purchased from Synbio Technologies (Suzhou, People’s Republic of China). An siRNA targeting Pim1 (siPim1) (Synbio Technologies) was used to decrease Pim1 expression; the detailed sequences are listed in Table S1. Vectors and siRNAs previously described were transfected into cells using Lipofectamine 3000 (Invitrogen, Waltham, MA, USA). To generate stable cell lines, the pLKO.1-TRC cloning vector was employed. Lentiviral particles were produced by cotransfection of the pLKO.1-shPim1 (shPim1) and pLKO.1-Pim1 (Pim1) constructs with psPAX2 and pMD2.G into HEK-293T cells in a ratio of 4:3:1. Cell lines were obtained by infection of A2780, 433, SKOV3, and OVCAR3 cells with lentiviral particles followed by puromycin selection.
Cell proliferation assays
A total of 2×10³ cells per well was seeded in 96-well plates 24 hours before the experiment. A2780 and 433 cells were transfected with pcDNA3.1-Pim1 or the negative control, whereas SKOV3 and OVCAR3 cells were transfected with siRNA or scrambled siRNA. Proliferation was measured using the CCK-8 kit (Dojindo, Kumamoto, Japan) according to the manufacturer’s protocol. All experiments were performed in triplicate. Cell proliferation curves were plotted using the absorbance at each time point.
Colony formation assay
Cells were digested with trypsin into single-cell suspensions at 48 hours after transfection. For the colony formation assay, a sample of 1,500 cells was plated into six-well plates and incubated in the appropriate media with 10% FBS at 37°C. After one week, the cells were fixed and stained with 0.1% crystal violet, and visible colonies were manually counted. Triplicate wells were measured for each treatment group.
RNA isolation and quantitative real-time PCR
Total RNA was prepared by using TRIzol reagent (Invitrogen). Quantitative real-time PCR was performed as described previously.14 The primer sequences are listed as Table S2. ACTIN was used as an internal control. All experiments were performed in triplicate.
Western blot analysis
Cells were lysed in RIPA buffer (Sigma Aldrich, St. Louis, MO, USA) supplemented with a protease inhibitor (Roche, Basel, Switzerland) and a phosphatase inhibitor (Roche). Protein concentration was measured using a BCA protein assay kit (Thermo Fisher Scientific). The isolated proteins were probed with the indicated primary antibodies followed by incubation with HRP-linked secondary antibodies and detection using an ECL system (Thermo Fisher Scientific). The protein expression levels were normalized to those of vinculin and β-actin (Cell Signaling Technology).
Extracellular acidification rate and oxygen consumption rate
Cellular glycolytic capacity and mitochondrial function were measured using the Seahorse Bioscience XF96 Extracellular Flux Analyzer according to the manufacturer’s instructions for the Seahorse XF Glycolysis Stress Test Kit and Cell Mito Stress Test Kit.15
Lactate analysis
Lactate Colorimetric Assay Kits (Biovision) were used to examine the glycolysis process in OC cells, according to the manufacturer’s protocols.
In vivo subcutaneous xenograft inoculation and immunohistochemistry
All animal experiments were performed according to the Guidelines for the Care and Use of Laboratory Animals and were approved by the Institutional Animal Care and Use Committee of Fudan University. In total, 1×10⁷ of either NC or shPim1 cells (SKOV3) were resuspended in 100 μL PBS and injected subcutaneously in both sides of the posterior flanks of four- to six-week-old BALB/c-nu female mice. Tumor sizes were measured every five days by calipers, and tumor volumes (mm3) were calculated by the formula length × width2 ×0.5. The animals were sacrificed after three weeks and the tumor bulks were harvested. The tumor specimens were preserved in liquid nitrogen. Immunohistochemical (IHC) analysis of Ki-67 (27309–1-AP; Proteintech) was performed on 5 mm sections of paraffin-embedded tumors as previously described.16
Co-immunoprecipitation assay
Cells were lysed in IP lysis buffer containing protease inhibitors and the lysate was precleared with protein A/G Sepharose beads for 60 minutes. Lysates were then incubated with the indicated primary antibodies or nonspecific immunoglobulin (IgG) in the presence of protein G-Sepharose beads overnight at 4°C. The beads were washed with 40 μL of ice-cold elution buffer. Then, 30 μL of 5× loading buffer was added to the eluted samples followed by boiling at 95°C for 5 minutes. Protein expression analyses of the indicated proteins were performed by western blot analysis.
Cell viability assay
For cell proliferation assays, cells were seeded in 96-well plates with 4,000 cells per well, in triplicate, and cultured overnight and treated with SMI4a (Pim1 inhibitor) or/and cisplatin for 96 hours, followed by an ATPlite luminescence assay (PerkinElmer, Norwalk, CT, USA), according to the manufacturer’s specifications.
Statistical analyses
The data are presented as the mean with error bars indicating the SD. All statistical analyses were performed using SPSS 18.0 (SPSS Inc., Chicago, IL, USA). Figures were made by GraphPad Prism 6 (GraphPad Software Inc., San Diego, CA, USA). Student’s t-test and one-way ANOVA were used for analyzing statistical significance. Differences were considered significant at *P<0.05; **P<0.01; ***P<0.001.
Results
Pim1 promotes OC cell proliferation in vitro
Recent evidence shows that Pim1 can influence cancer cell proliferation in many different tumors. To obtain insight into the role of Pim1 in OC cells, we first determined Pim1 expression in OC cell lines. A2780 and 433 were selected for overexpression experiments due to their low endogenous expression of Pim1. SKOV3 and OVCAR3 showed the highest baseline levels of Pim1, and so they were chosen for the knockdown experiments (Figure 1A). Then, we established stable cell lines with Pim1 overexpression and knockdown, and the efficiencies of overexpression and downregulation were validated by western blot analysis and qRT-PCR, respectively (Figure 1B). Then, we utilized CCK-8 and colony formation assays to elucidate the potential effect of Pim1 on OC tumor cell proliferation. The CCK-8 assays showed that heightened expression of Pim1 significantly promoted the proliferation of OC cells; the opposite results were observed in the knockdown cell lines (Figure 1C, P<0.05). Similarly, the colony formation assays showed that overexpression of Pim1 led to the formation of more colonies in both A2780 and 433 cells than in controls (Figure 1D, P<0.05). In addition, when Pim1 expression was downregulated, the ability of SKOV3 and OVCAR3 cells to form colonies was markedly impaired (Figure 1D, P<0.05).
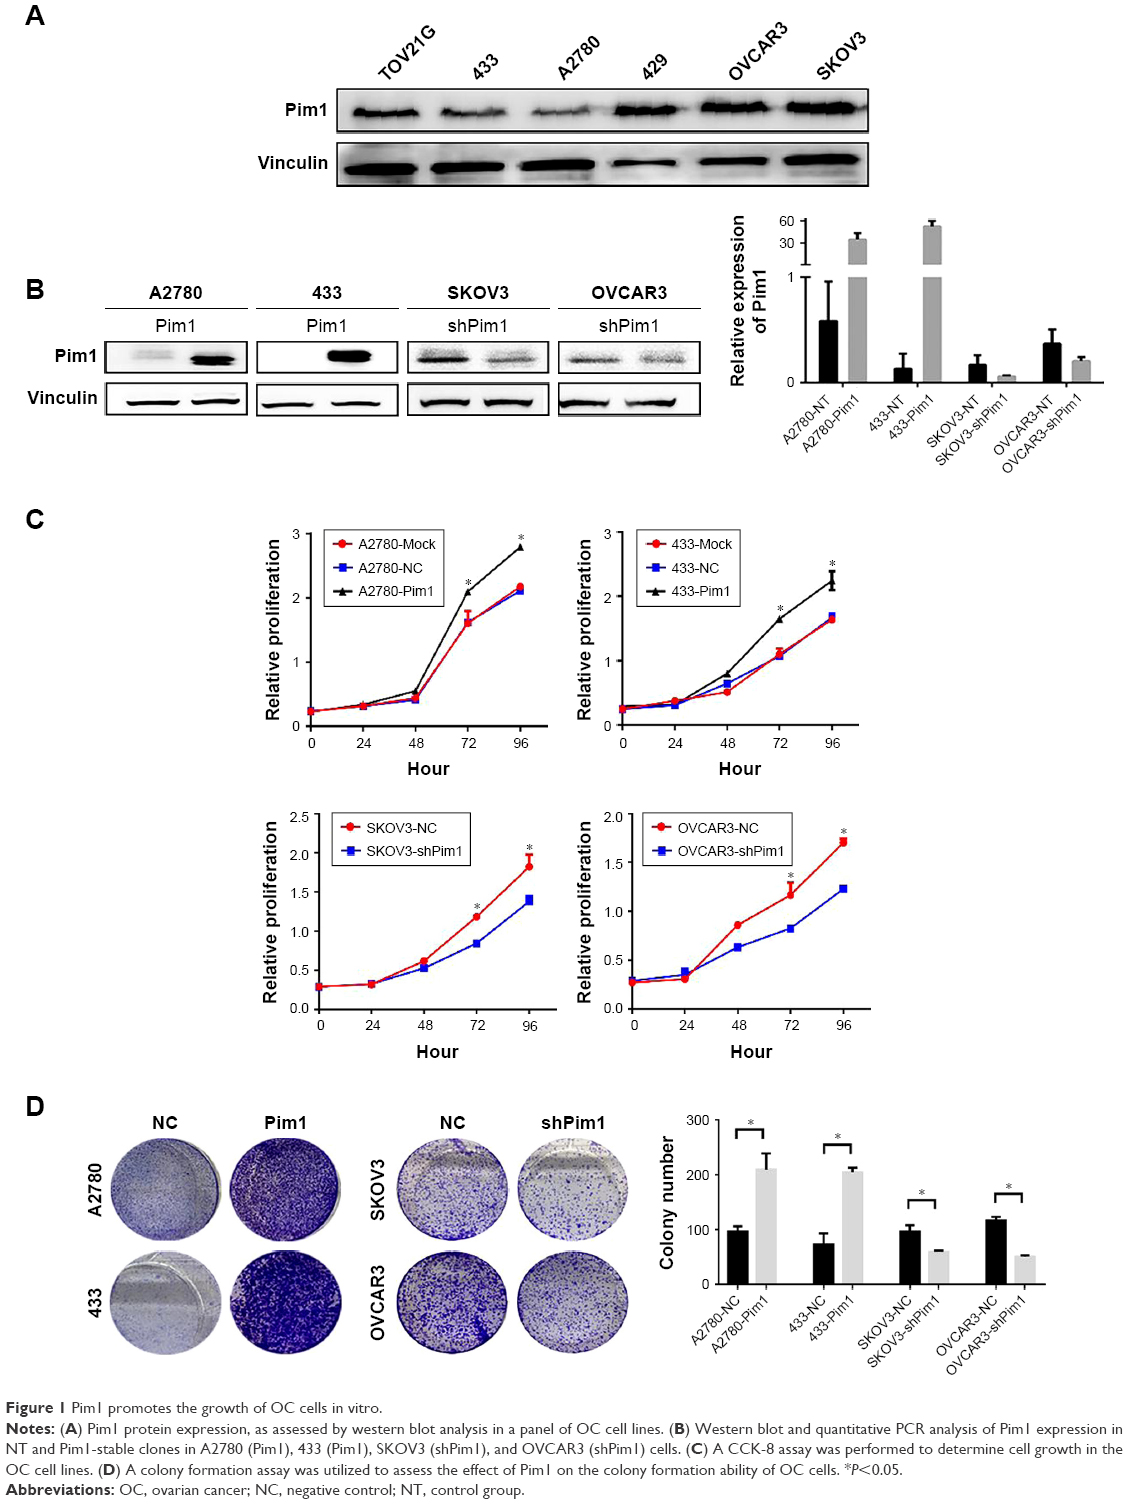 | Figure 1 Pim1 promotes the growth of OC cells in vitro. |
Pim1 influences glycolysis in OC cells
Previous literature reported that the proliferation of tumor cells is usually accompanied by metabolic changes. Reprogrammed energy metabolism is considered a hallmark of cancer, and dysregulated energy metabolism in tumor cells is mainly attributed to mitochondrial dysfunction. Here, extracellular acidification rate (ECAR) and oxygen consumption rate (OCR) measurements were performed to investigate the cellular metabolic status. The ECAR significantly increased in Pim1-overexpressing cells, indicating that overexpressing Pim1 promoted the glycolytic process in OC cells (Figure 2A); the opposite results were also observed in the SKOV3 cell line with transient transfection of the siRNAs (Figure 2B). The OCR value reflects glucose mitochondrial oxidation. Consistent with the ECAR results, overexpressing Pim1 can reduce the OCR in OC cells (Figure 2C), suggesting its role in mitochondrial respiration inhibition. Similarly, silencing Pim1 by siRNAs could increase the OCR (Figure 2D). Moreover, the lactate colorimetric assay was adopted to assess cellular lactate production. The results showed that Pim1 overexpression can boost lactate production (Figure 2E) and that knockdown of Pim1 by siRNAs inhibited lactate generation (Figure 2F). These results indicated the role of Pim1 in promoting glycolysis.
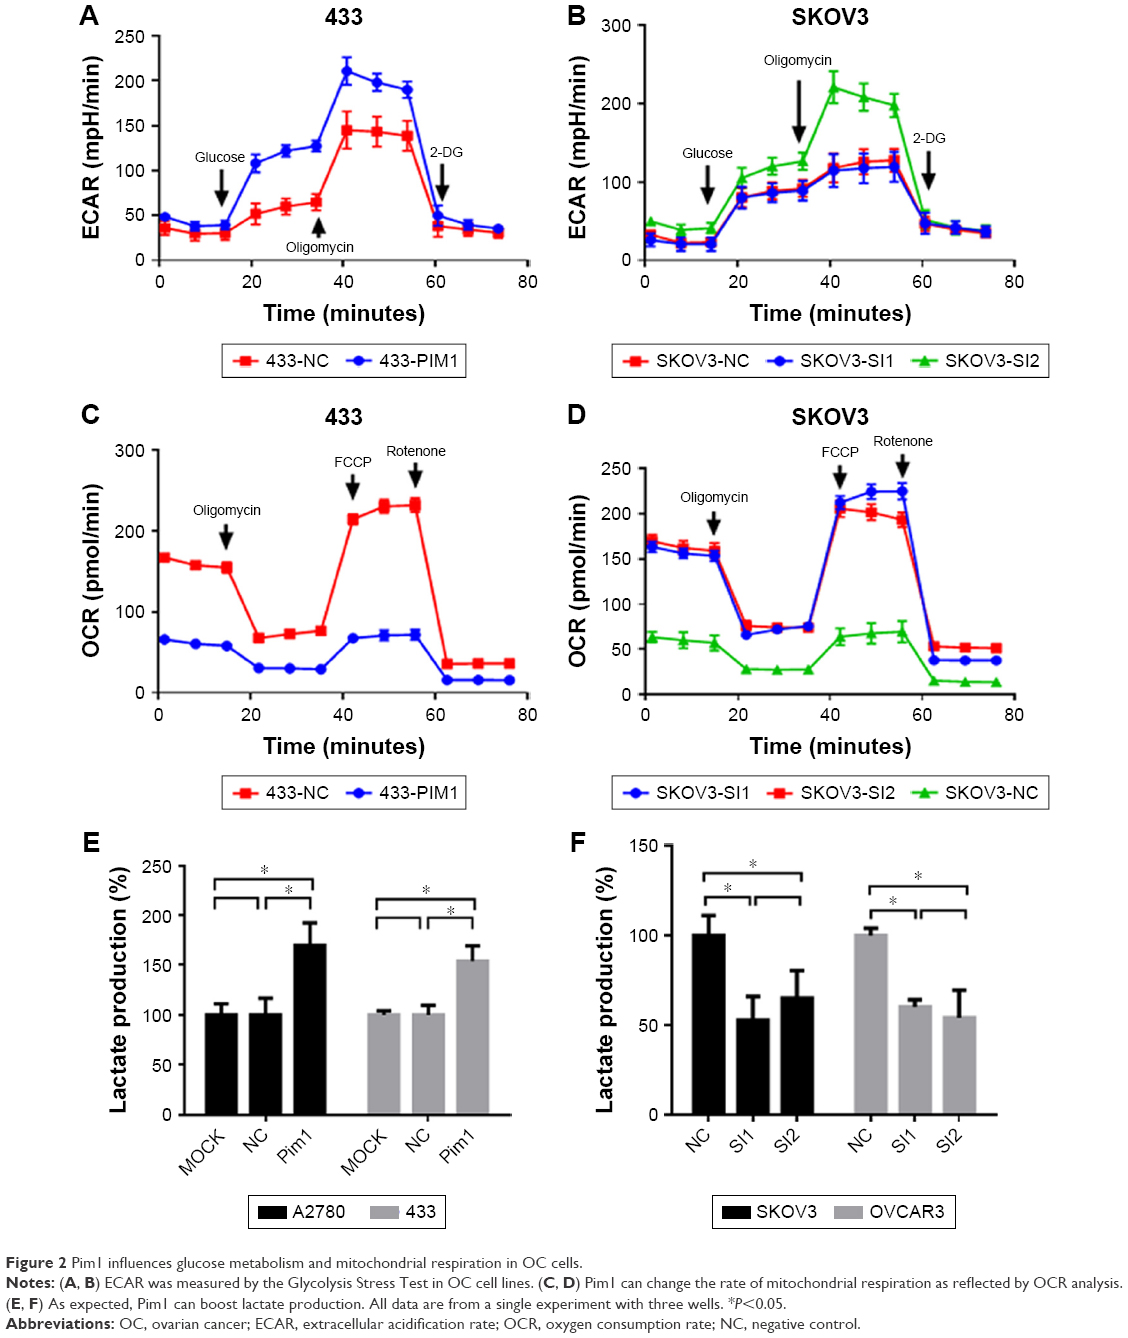 | Figure 2 Pim1 influences glucose metabolism and mitochondrial respiration in OC cells. |
Effect of Pim1 on OC tumor growth in vivo
Based on the abovementioned observations, we next investigated the effect of Pim1 on tumorigenicity in vivo by comparing tumor growth using a stable Pim1 knockdown cell line. Knockdown of Pim1 significantly reduced the tumor growth in vivo in nude mice injected subcutaneously with tumor cells of the SKOV3-shPim1 cell line (Figure 3A). In addition, the xenografts derived from Pim1-knockdown SKOV3 cells were smaller than those derived from control cells in both size and weight (Figure 3B and C). In order to demonstrate an effect of Pim1 on the growth in vivo, we also conducted IHC of Ki-67, which is a proliferation index. Results showed that Ki-67 was lower in the Pim1 knockdown groups than in the control groups (Figure 3D).
 | Figure 3 Tumorigenicity of Pim1 in vivo. |
Pim1-mediated phosphorylation of c-Myc activates the expression of glycolysis-associated key genes
Previous studies demonstrated that c-Myc is primarily responsible for metabolic reprogramming. We next investigated whether c-Myc participates in Pim1-mediated glycolysis in OC cells. Immunoblotting and co-immunoprecipitation assays were performed, and the results indicated that Pim1 interacts with c-Myc and phosphorylates c-Myc at S62 (Figure 4A). Phosphorylation of c-Myc at the Ser62 position is thought to activate key enzymes in the glycolytic pathway. We then measured the mRNA expression of glycolytic-associated genes when Pim1 was overexpressed or downregulated; the results showed that attenuated or increased expression of Pim1 altered the expression of metabolic enzymes such as LDHA, PKM2, IDH1, MTHFD2, TKT, GLUT1, PGK1, PGAM1, and ENO1 (Figure 4B and C; P<0.05). The expression levels of metabolic-related enzymes that did not change are shown in Table S3. Among the abovementioned enzymes, PGK1 exhibited the greatest changes in expression, suggesting that Pim1 may influence metabolic changes in OC cells via PGK1. Moreover, the protein levels of these enzymes were assessed by western blot analysis. Knockdown of Pim1 by siRNAs resulted in decreased p-Ser62 c-Myc levels, but the total c-Myc level remained static (Figure 4D). Meanwhile, attenuating the expression of Pim1 can downregulate the protein expression levels of PGK1 and LDHA (Figure 4D), but the levels of PKM2 and PKM1/2 did not change (Figure 4D). This difference may be due to the existence of other mechanisms of Pim1 in regulating glycolytic pathways.
 | Figure 4 Pim1-mediated phosphorylation of c-Myc activates the expression of glycolysis-associated key genes. |
Evaluation of a Pim1 inhibitor in OC cells
Moreover, we tried to determine whether the Pim1 inhibitor SMI4a is effective for OC treatment. We found that SMI4a could exert chemosensitizing effects on cisplatin, a widely used conventional cytotoxic agent for the clinical treatment of OC, in A2780 and SKOV3 cells in vitro (Figure 5). These findings demonstrated that SMI4a may serve as a promising chemosensitizing target.
 | Figure 5 SMI4a (Pim1 inhibitor) induces chemosensitization to cisplatin in OC cells. |
Pim1 is overexpressed in human OC specimens
To determine the clinical relevance of Pim1 expression, we first analyzed Pim1 protein expression in clinical specimens from the Human Protein Atlas.17 The results demonstrated that Pim1 was more highly expressed in OC than in normal ovary (Figure 6A). Consistent with this finding, the Pim1 mRNA level was higher in the TCGA OC RNAseq (Figure 6B; N=591) data set,18,19 and the same results were also observed in the TCGA database on the Oncomine website (Compendia Biosciences, www.oncomine.org) (Figure 6C). The Kaplan–Meier survival curve20 demonstrated that the high Pim1 expression contributed to a significantly poorer survival, which is based on the medium value of Pim1 (n=278, P=0.047334; Figure 6D). Taken together, these results clearly suggest that Pim1 is aberrantly overexpressed in human OC tissues and is positively correlated with human OC progression.
 | Figure 6 Pim1 is upregulated in human ovarian carcinoma specimens. |
Discussion
The fifth leading cause of cancer death in women is OC.17 Since the introduction of platinum-based drugs in clinical practice, no significant improvements in OC therapies have taken place over the past four decades.18,19 Continuous efforts have been made to explore potential targets and to improve the survival of OC patients.19 However, few effective targets for OC treatment have been obtained, and it is urgent for us to identify underlying mechanisms and effective targets. We selected Pim1, which has been reported in many types of cancers, as the object of this research.
Pim1 belongs to a group of constitutively activated serine/threonine kinases first identified as the Proviral integrating site for Moloney murine leukemia virus.11,20 The three members in the PIM family, Pim1 (chromosome 6), PIM2 (chromosome X), and PIM3 (chromosome 22), physiologically mediate cytokine signaling of hematopoietic cells.21 Knowledge of Pim1 in solid cancers has been emerging in recent years. Pim1 was found to be overexpressed in breast,22,23 gastric,24 and prostate cancers25–29 and was associated with aggressive clinicopathological features. However, the role of Pim1 in OC has not been elucidated. In this study, we demonstrated the overexpression of Pim1 in OC tissues by bioinformatic analysis. The results from our functional assays established a significant role for Pim1 in OC cell proliferation. The role of Pim1 in OC growth was also certified by in vivo experiments.
Cancer cells usually have a higher rate of proliferation than normal cells. For this reason, they require more energy, reductive power, and intermediates as precursors for biosynthesis.30 The main alterations in the metabolic reprogramming of cancer cells involve the metabolic pathways of glucose, amino acids, and lipids as well as processes such as autophagy, oxidative phosphorylation, and ROS formation.30,31 Little is known about the role of Pim1 in the metabolic processes in tumors. The present study provided evidence for the role of Pim1 in reprogramming OC cell metabolism through glycolysis and demonstrated that the phosphorylation of c-Myc at Ser62, which occurs downstream of Pim1, is an important regulator of OC metabolism. c-Myc regulates aerobic glycolysis via the upregulation of many key glycolytic genes such as LDHA, GLUT1, and PKM2.32–36 Similar conclusions were also validated by our observations. However, the PKM2 mRNA level changed, whereas the protein level did not change obviously; this contrast might be the result of differential Pim1 activity at the transcriptional and translational levels. Furthermore, we found that PGK1 exhibited the greatest changes in expression, suggesting that Pim1 may influence metabolic changes in OC cells via the c-Myc-PGK1 axis.
The utility of specific Pim1 inhibitors or monoclonal antibodies in the treatment of cancer cells has been documented in prostate cancer and leukemia.37–40 Given the significant role of Pim1 in OC, we evaluated the efficacy of the Pim1 inhibitor SMI4a in combination with cisplatin. As reported in our work, we found that SMI4a induced chemosensitization to cisplatin. Thus, in line with these observations, the clinical significance of Pim1 in OC became more affirmative. However, there are still some questions that need to be answered. For example, how c-Myc regulates the expression of PGK1, whether PGK1 plays a role in ovarian tumorigenesis, and what the underlying molecular mechanism is need further investigation.
Taken together, our study provides insights into the mechanisms by which Pim1 drives proliferation and glycolysis OC cells. Moreover, we provided supporting evidence that Pim1 is overexpressed in OC and is correlated with the poor overall survival of patients. Pim1 can be a novel therapeutic avenue for the treatment of OC patients.
Acknowledgments
This work was supported by funding from the Science and Technology Commission of Shanghai Municipality to Wu Xiaohua (15411962000; 17411963000; KW1514; JGYXLJ1502) and CJ Xu (2013ZYJB0201).
Disclosure
The authors report no conflicts of interest in this work.
References
Hansen JM, Coleman RL, Sood AK. Targeting the tumour microenvironment in ovarian cancer. Eur J Cancer. 2016;56:131–143. | ||
Barnett R. Ovarian cancer. Lancet. 2016;387(10025):1265. | ||
Bertone-Johnson ER. Epidemiology of ovarian cancer: a status report. Lancet. 2005;365(9454):101–102. | ||
No authors listed. The trouble with ovarian cancer. Lancet. 2009;374(9698):1302. | ||
Liu PF, Cao YW, Jiang HP, et al. Heterogeneity research in muscle-invasive bladder cancer based on differential protein expression analysis. Medical oncology. 2014;31(9):21. | ||
Levine AJ, Puzio-Kuter AM. The control of the metabolic switch in cancers by oncogenes and tumor suppressor genes. Science. 2010;330(6009):1340–1344. | ||
Tennant DA, Duran RV, Gottlieb E. Targeting metabolic transformation for cancer therapy. Nature reviews Cancer. 2010;10(4):267–277. | ||
Liu Y, Tong L, Luo Y, Li X, Chen G, Wang Y. Resveratrol inhibits the proliferation and induces the apoptosis in ovarian cancer cells via inhibiting glycolysis and targeting AMPK/mTOR signaling pathway. Journal of cellular biochemistry. 2018. | ||
Zhao E, Maj T, Kryczek I, et al. Cancer mediates effector T cell dysfunction by targeting microRNAs and EZH2 via glycolysis restriction. Nature immunology. 2016;17(1):95–103. | ||
Suh DH, Kim MK, No JH, Chung HH, Song YS. Metabolic approaches to overcoming chemoresistance in ovarian cancer. Annals of the New York Academy of Sciences. 2011;1229:53–60. | ||
van Lohuizen M, Verbeek S, Krimpenfort P, et al. Predisposition to lymphomagenesis in pim-1 transgenic mice: cooperation with c-myc and N-myc in murine leukemia virus-induced tumors. Cell. 1989;56(4):673–682. | ||
Sivertsen EA, Galteland E, Mu D, et al. Gain of chromosome 6p is an infrequent cause of increased PIM1 expression in B-cell non-Hodgkin’s lymphomas. Leukemia. 2006;20(3):539–542. | ||
Magnuson NS, Wang Z, Ding G, Reeves R. Why target PIM1 for cancer diagnosis and treatment? Future oncology. 2010;6(9):1461–1478. | ||
Wu Y, Tan C, Weng WW, et al. Long non-coding RNA Linc00152 is a positive prognostic factor for and demonstrates malignant biological behavior in clear cell renal cell carcinoma. American journal of cancer research. 2016;6(2):285–299. | ||
Pathiraja TN, Thakkar KN, Jiang S, et al. TRIM24 links glucose metabolism with transformation of human mammary epithelial cells. Oncogene. 2015;34(22):2836–2845. | ||
Wang S, Li J, Xie J, et al. Programmed death ligand 1 promotes lymph node metastasis and glucose metabolism in cervical cancer by activating integrin beta4/SNAI1/SIRT3 signaling pathway. Oncogene. 2018;37(30):4164–4180. | ||
Uhlen M, Fagerberg L, Hallstrom BM, et al. Proteomics. Tissue-based map of the human proteome. Science. 2015;347(6220):1260419. | ||
Gao J, Aksoy BA, Dogrusoz U, et al. Integrative analysis of complex cancer genomics and clinical profiles using the cBioPortal. Sci Signal. 2013;6(269):pl1. | ||
Cerami E, Gao J, Dogrusoz U, et al. The cBio cancer genomics portal: an open platform for exploring multidimensional cancer genomics data. Cancer discovery. 2012;2(5):401–404. | ||
Mizuno H, Kitada K, Nakai K, Sarai A. PrognoScan: a new database for meta-analysis of the prognostic value of genes. BMC medical genomics. 2009;2:18. | ||
McIntosh MW, Drescher C, Fitzgibbon MM. Ovarian Cancer Early Detection Needs Better Imaging, Not Better Algorithms or Biomarkers. Journal of clinical oncology: official journal of the American Society of Clinical Oncology. 2016;34(2):199–200. | ||
Crum CP. Preventing Ovarian Cancer. Journal of clinical oncology: official journal of the American Society of Clinical Oncology. 2016;34(2):198–199. | ||
Kurta ML, Edwards RP, Moysich KB, et al. Prognosis and conditional disease-free survival among patients with ovarian cancer. Journal of clinical oncology: official journal of the American Society of Clinical Oncology. 2014;32(36):4102–4112. | ||
Zhao W, Qiu R, Li P, Yang J. PIM1: a promising target in patients with triple-negative breast cancer. Medical oncology. 2017;34(8):142. | ||
Narlik-Grassow M, Blanco-Aparicio C, Carnero A. The PIM family of serine/threonine kinases in cancer. Medicinal research reviews. 2014;34(1):136–159. | ||
PIM1 May Be a Therapeutic Target in Triple-Negative Breast Cancer. Cancer discovery. 2016;6(12):1303. | ||
Braso-Maristany F, Filosto S, Catchpole S, et al. PIM1 kinase regulates cell death, tumor growth and chemotherapy response in triple-negative breast cancer. Nature medicine. 2016;22(11):1303–1313. | ||
Yan B, Yau EX, Samanta S, et al. Clinical and therapeutic relevance of PIM1 kinase in gastric cancer. Gastric cancer: official journal of the International Gastric Cancer Association and the Japanese Gastric Cancer Association. 2012;15(2):188–197. | ||
Ha S, Iqbal NJ, Mita P, et al. Phosphorylation of the androgen receptor by PIM1 in hormone refractory prostate cancer. Oncogene. 2013;32(34):3992–4000. | ||
Wang J, Anderson PD, Luo W, Gius D, Roh M, Abdulkadir SA. Pim1 kinase is required to maintain tumorigenicity in MYC-expressing prostate cancer cells. Oncogene. 2012;31(14):1794–1803. | ||
Zemskova M, Lilly MB, Lin YW, Song JH, Kraft AS. p53-dependent induction of prostate cancer cell senescence by the PIM1 protein kinase. Molecular cancer research: MCR. 2010;8(8):1126–1141. | ||
Kim J, Roh M, Abdulkadir SA. Pim1 promotes human prostate cancer cell tumorigenicity and c-MYC transcriptional activity. BMC cancer. 2010;10:248. | ||
Zemskova M, Sahakian E, Bashkirova S, Lilly M. The PIM1 kinase is a critical component of a survival pathway activated by docetaxel and promotes survival of docetaxel-treated prostate cancer cells. The Journal of biological chemistry. 2008;283(30):20635–20644. | ||
Morais M, Dias F, Teixeira AL, Medeiros R. MicroRNAs and altered metabolism of clear cell renal cell carcinoma: Potential role as aerobic glycolysis biomarkers. Biochimica et biophysica acta. 2017;1861(9):2175–2185. | ||
Labak CM, Wang PY, Arora R, et al. Glucose transport: meeting the metabolic demands of cancer, and applications in glioblastoma treatment. American journal of cancer research. 2016;6(8):1599–1608. | ||
Gordan JD, Thompson CB, Simon MC. HIF and c-Myc: sibling rivals for control of cancer cell metabolism and proliferation. Cancer cell. 2007;12(2):108–113. | ||
Shim H, Dolde C, Lewis BC, et al. c-Myc transactivation of LDH-A: implications for tumor metabolism and growth. Proceedings of the National Academy of Sciences of the United States of America. 1997;94(13):6658–6663. | ||
Osthus RC, Shim H, Kim S, et al. Deregulation of glucose transporter 1 and glycolytic gene expression by c-Myc. The Journal of biological chemistry. 2000;275(29):21797–21800. | ||
Mendez-Lucas A, Li X, Hu J, et al. Glucose Catabolism in Liver Tumors Induced by c-MYC Can Be Sustained by Various PKM1/PKM2 Ratios and Pyruvate Kinase Activities. Cancer research. 2017. | ||
Li W, Xu Z, Hong J, Xu Y. Expression patterns of three regulation enzymes in glycolysis in esophageal squamous cell carcinoma: association with survival. Medical oncology. 2014;31(9):118. | ||
Mologni L, Magistroni V, Casuscelli F, Montemartini M, Gambacorti-Passerini C. The Novel PIM1 Inhibitor NMS-P645 Reverses PIM1-Dependent Effects on TMPRSS2/ERG Positive Prostate Cancer Cells And Shows Anti-Proliferative Activity in Combination with PI3K Inhibition. Journal of Cancer. 2017;8(1):140–145. | ||
Andreoli M, Persico M, Kumar A, et al. Identification of the first inhibitor of the GBP1:PIM1 interaction. Implications for the development of a new class of anticancer agents against paclitaxel resistant cancer cells. Journal of medicinal chemistry. 2014;57(19):7916–7932. | ||
Wan X, Zhang W, Li L, Xie Y, Li W, Huang N. A new target for an old drug: identifying mitoxantrone as a nanomolar inhibitor of PIM1 kinase via kinome-wide selectivity modeling. Journal of medicinal chemistry. 2013;56(6):2619–2629. | ||
Nakano H, Saito N, Parker L, et al. Rational evolution of a novel type of potent and selective proviral integration site in Moloney murine leukemia virus kinase 1 (PIM1) inhibitor from a screening-hit compound. Journal of medicinal chemistry. 2012;55(11):5151–5164. |
 © 2018 The Author(s). This work is published and licensed by Dove Medical Press Limited. The
full terms of this license are available at https://www.dovepress.com/terms
and incorporate the Creative Commons Attribution
- Non Commercial (unported, 3.0) License.
By accessing the work you hereby accept the Terms. Non-commercial uses of the work are permitted
without any further permission from Dove Medical Press Limited, provided the work is properly
attributed. For permission for commercial use of this work, please see paragraphs 4.2 and 5 of our Terms.
© 2018 The Author(s). This work is published and licensed by Dove Medical Press Limited. The
full terms of this license are available at https://www.dovepress.com/terms
and incorporate the Creative Commons Attribution
- Non Commercial (unported, 3.0) License.
By accessing the work you hereby accept the Terms. Non-commercial uses of the work are permitted
without any further permission from Dove Medical Press Limited, provided the work is properly
attributed. For permission for commercial use of this work, please see paragraphs 4.2 and 5 of our Terms.