Back to Journals » International Journal of Nanomedicine » Volume 10 » Issue 1
Physiologically based pharmacokinetic modeling of zinc oxide nanoparticles and zinc nitrate in mice
Authors Chen W ![]() , Cheng Y
, Cheng Y ![]() , Hsieh N, Wu B, Chou W, Ho C, Chen J, Liao C
, Hsieh N, Wu B, Chou W, Ho C, Chen J, Liao C ![]() , Lin P
, Lin P ![]()
Received 17 April 2015
Accepted for publication 18 July 2015
Published 5 October 2015 Volume 2015:10(1) Pages 6277—6292
DOI https://doi.org/10.2147/IJN.S86785
Checked for plagiarism Yes
Review by Single anonymous peer review
Peer reviewer comments 3
Editor who approved publication: Dr Thomas Webster
Wei-Yu Chen,1 Yi-Hsien Cheng,2 Nan-Hung Hsieh,3 Bo-Chun Wu,2 Wei-Chun Chou,4 Chia-Chi Ho,4 Jen-Kun Chen,5 Chung-Min Liao,2,* Pinpin Lin4,*
1Department of Biomedical Science and Environmental Biology, Kaohsiung Medical University, Kaohsiung, 2Department of Bioenvironmental Systems Engineering, National Taiwan University, Taipei, 3Institute of Labor, Occupational Safety and Health, Ministry of Labor, New Taipei City, 4National Institute of Environmental Health Sciences, 5Institute of Biomedical Engineering and Nanomedicine, National Health Research Institutes, Zhunan, Taiwan
*These authors contributed equally to this work
Abstract: Zinc oxide nanoparticles (ZnO NPs) have been widely used in consumer products, therapeutic agents, and drug delivery systems. However, the fate and behavior of ZnO NPs in living organisms are not well described. The purpose of this study was to develop a physiologically based pharmacokinetic model to describe the dynamic interactions of 65ZnO NPs in mice. We estimated key physicochemical parameters of partition coefficients and excretion or elimination rates, based on our previously published data quantifying the biodistributions of 10 nm and 71 nm 65ZnO NPs and zinc nitrate (65Zn(NO3)2) in various mice tissues. The time-dependent partition coefficients and excretion or elimination rates were used to construct our physiologically based pharmacokinetic model. In general, tissue partition coefficients of 65ZnO NPs were greater than those of 65Zn(NO3)2, particularly the lung partition coefficient of 10 nm 65ZnO NPs. Sensitivity analysis revealed that 71 nm 65ZnO NPs and 65Zn(NO3)2 were sensitive to excretion and elimination rates in the liver and gastrointestinal tract. Although the partition coefficient of the brain was relative low, it increased time-dependently for 65ZnO NPs and 65Zn(NO3)2. The simulation of 65Zn(NO3)2 was well fitted with the experimental data. However, replacing partition coefficients of 65ZnO NPs with those of 65Zn(NO3)2 after day 7 greatly improved the fitness of simulation, suggesting that ZnO NPs might decompose to zinc ion after day 7. In this study, we successfully established a potentially predictive dynamic model for slowly decomposed NPs. More caution is suggested for exposure to 65ZnO NPs <10 nm because those small 65ZnO NPs tend to accumulate in the body for a relatively longer time than 71 nm 65ZnO NPs and 65Zn(NO3)2 do.
Keywords: zinc nanomaterials, bioaccumulation, biodistribution, PBPK modeling, partition coefficient
Introduction
Nanomaterials have a broad range of applications in technology and biological medicine because of the unique properties of nanoparticles (NPs), which render nanomaterials convenient and efficient for use. However, the increasing use of engineered NPs has led to increased exposure potential and concern for human and environmental safety. NPs can enter an organism through various pathways and distribute systemically in the circulatory and lymphatic systems and ultimately into tissues.1 The biodistribution of NPs might markedly influence their biological effects in vivo, such as in inflammatory and oxidative responses related to cardiopulmonary toxicity.2,3
Zinc oxide nanoparticles (ZnO NPs) are commonly used in sunscreens in particle sizes ranging from 70 nm to 100 nm because of strong ultraviolet absorptive properties. ZnO NPs also have potential application in the delivery of therapeutic agents for tumors and autoimmune diseases.4–6
In our previous study, we reported the biodistribution of 65ZnO NPs in mice.7 The results provide relevant data for developing a particle size-dependent physiologically based pharmacokinetic (PBPK) model for metal NPs. The advantages of a PBPK model include the ability to integrate the physiological structures of organisms and the physicochemical properties of toxicants and provide quantitative descriptions of the kinetic processes of absorption, distribution, metabolism, and excretion.8 A PBPK model is an effective tool to estimate the time course of chemical accumulation in target tissues of organisms and can be incorporated into a quantitative risk assessment framework. The dynamic interactions of NPs in living organisms, such as transportation kinetics across biobarriers, can also be described by a metal NP-based PBPK model. A nanometal PBPK model with adequate predictive power can be used to investigate mechanical processes, evaluate hypotheses, and guide experimental designs and also has advantages of reduced animal testing and costs and the ability to simulate and predict biodistribution in humans and the human response to NPs.9
Therefore, in this study, we aimed to develop an appropriate particle size-dependent PBPK model for describing 65ZnO NP pharmacokinetics in mice and to evaluate the tissue accumulation properties of various 65ZnO NP sizes and zinc nitrate (65Zn(NO3)2). We identified that physicochemical parameters of 10 nm and 71 nm 65ZnO NPs and 65Zn(NO3)2 in NP PBPK modeling were predictive of 65ZnO NP biodistribution and accumulative levels in living organisms. Our PBPK model was able to predict the distributions of 65ZnO NPs and 65Zn(NO3)2 in target tissues.
Materials and methods
All animal treatments and experimental protocols for this study were reviewed and approved by the Institutional Animal Care and Use Committee of the National Health Research Institutes (NHRI), Zhunan, Taiwan.
Test NPs
ZnO NPs of 71 nm diameter were purchased from Alfa Aesar (Ward Hill, MA, USA), while ZnO NPs of 10 nm diameter were purchased from NanoScale Corporation (Manhattan, KS, USA). Zn(NO3)2 was purchased from Showa Corporation (Tokyo, Japan). Radioactive 65ZnO NPs and 65Zn(NO3)2 were generated using the Tsing Hua Open-Pool Reactor (THOR; National Tsing Hua University, HsinChu, Taiwan). Before neutron activation, the surface area, surface charge, shape, and size distribution of cold ZnO NPs were assessed and reported in the previously published paper.7
For surface chemistry identification, ZnO NPs were subjected to Raman spectroscopic analysis using DXR Raman Microscope (DXR; Thermo Fisher Scientific, Waltham, MA, USA) with DXR 532 nm laser and full-range grating (50–3,500 cm−1). For crystalline analysis, each sample (1 g) was filled into a sample holder and subjected to X-ray powder diffraction. The measurements were carried out by powder X-ray diffraction (MiniFlex II, Rigaku Corporation, Tokyo, Japan) with a scan speed of 2° per minute for the scan angle between 10° and 90°. Figure S1A and B are Raman spectra of 10 nm and 71 nm ZnO NPs, respectively, in which the characteristic Zn–O stretching bands are observed at 436 cm−1 and both NPs are not chemically modified on their surface.10 Figure S2A and B display X-ray diffraction patterns of 10 nm and 71 nm ZnO NPs, respectively, presenting no significant difference between these two NPs. The diffraction peaks for 10 nm ZnO NPs are located at 31.62°, 34.30°, 36.12°, 47.42°, 56.46°, 62.84°, 65.32°, 67.84°, and 69.00°. The diffraction peaks for 71 nm ZnO NPs are located at 31.44°, 34.10°, 35.92°, 47.24°, 56.28°, 62.54°, 65.12°, 67.64°, and 68.78°. These X-ray diffraction patterns are assigned to (100), (002), (101), (102), (110), (103), (200), (112), and (201) planes of hexagonal wurtzite crystal of ZnO, which are in good agreement with data published by Talam et al and Uysala et al.11,12
Study data
Using previously published tissue accumulation data from mice injected with 65ZnO NPs and 65Zn(NO3)2, the size-dependent 65ZnO NP and 65Zn(NO3)2 PBPK mice model were constructed.7 The experiments provided information on tissue burdens that enabled intravenously injected 65ZnO NPs and 65Zn(NO3)2 to be compared. Before neutron activation, the surface area, surface charge, shape, and size distribution of cold ZnO NPs were assessed and reported in the previously published paper.7
To evaluate the accumulation of 10 nm and 71 nm 65ZnO NPs and 65Zn(NO3)2, 120 μg of suspended 65ZnO NPs or 65Zn(NO3)2 were dissolved in 400 μL of distilled water and injected into 6-week-old male ICR mice (0.031–0.032 kg) through a tail vein.7 The sampling times for accumulation and tissue weight measurements were 1, 2, 4, and 7 hours and 1, 2, 3, 7, and 28 days postinjection. The tissue samples included blood, liver, lung, kidney, spleen, brain, heart, gastrointestinal (GI) tract, and carcass (muscle and bone).
Model construction
Figure 1 shows the study framework and computational algorithm. The prototypical mice PBPK model for 65ZnO NPs and 65Zn(NO3)2 (Figure 2) were established based on the key assumptions that 1) a chemical is well mixed and homogeneously distributed within each compartment, 2) all transport within blood and tissues is limited by the flow circulatory system, 3) excretion and elimination rates are described as first-order processes, and 4) complete equilibrium in a chemical exists between blood and tissue phases. Almost all PBPK models can be described by mass balance equations. Table 1 lists the detailed PBPK model equations and symbols. The model equations were constructed according to the mass transfer of zinc (Zn)-containing chemicals and the physiological properties of mice. The liver, GI tract, and kidney are the major excreting and eliminating tissues for 65ZnO NPs and 65Zn(NO3)2.
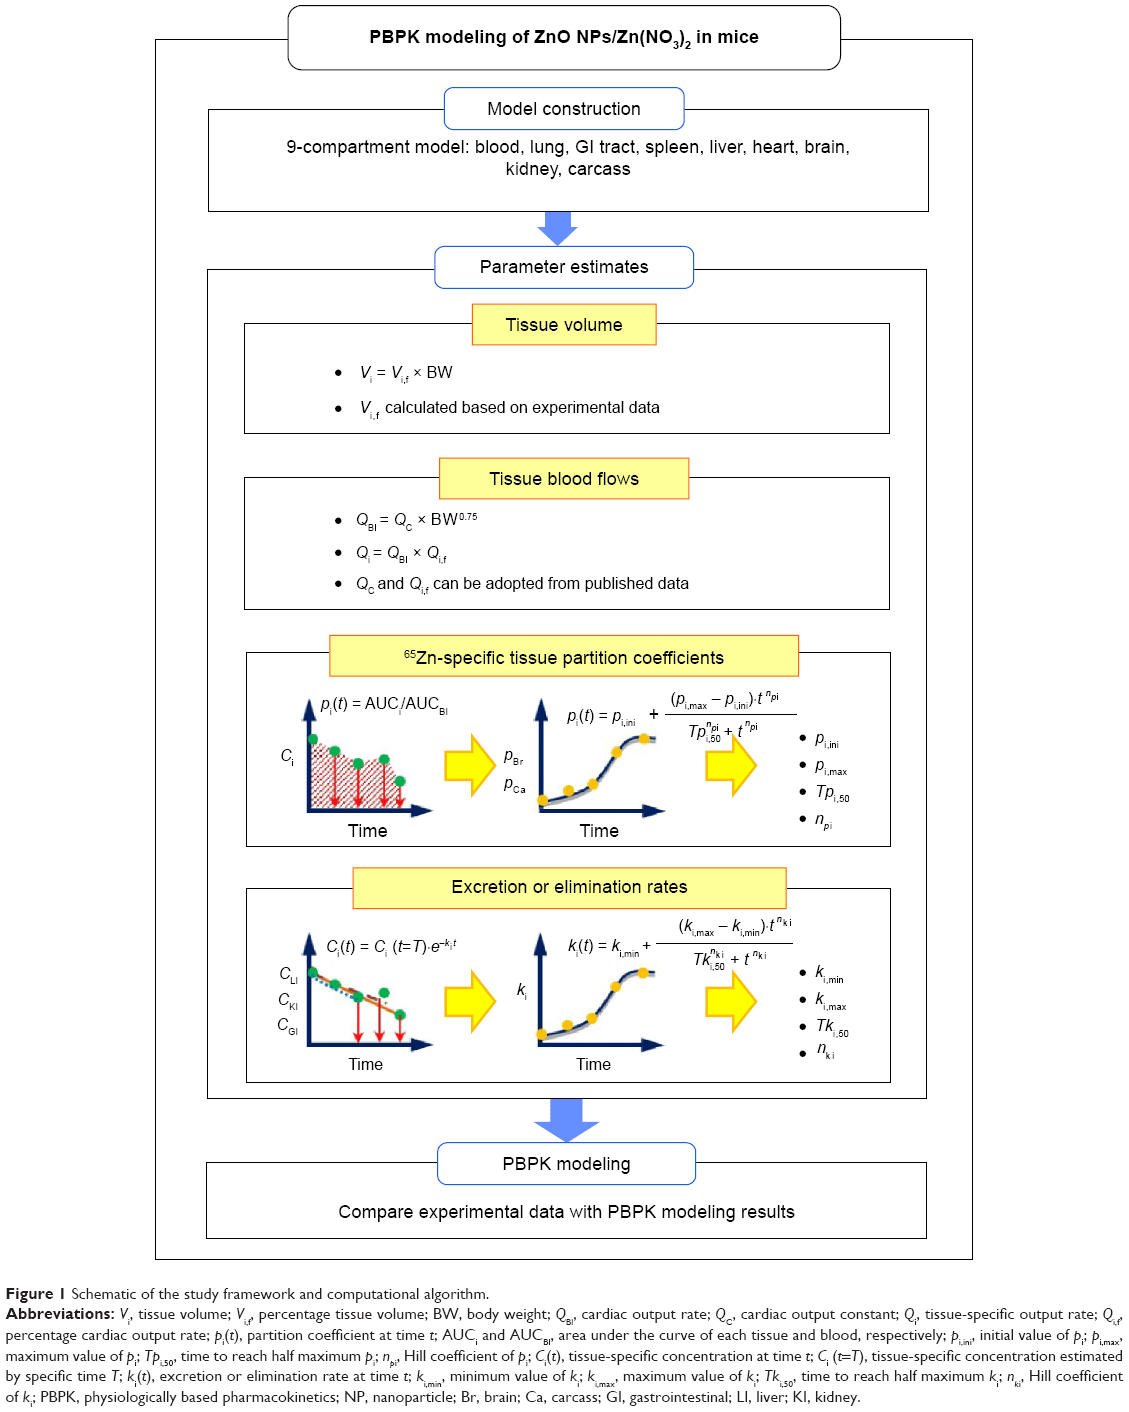 | Figure 1 Schematic of the study framework and computational algorithm. |
 | Figure 2 Constructed PBPK model describing the transportation of 10 nm and 71 nm 65ZnO NPs and 65Zn2+ and interactions between blood and tissues or organs. |
 | Table 1 Physiologically based pharmacokinetic model equations in mice |
Physiological parameters, including blood and tissue volumes, can be obtained from the experimental data. Exchange rates between tissue and blood compartments can be expressed as a fraction of cardiac output (QBl, L·h−1), in which cardiac output is scaled to body weight using the allometric equation,
QBl = QC BW0.75 | (1) |
where QC is the cardiac output constant for a 1 kg mice and BW is the body weight (kg).13 Organ volume constants (Vi) of mice were scaled to body weight based on a previous study.7 Table 2 lists all physiological parameters used in PBPK modeling.
 | Table 2 Physiological parameters used in PBPK model for 65ZnO NPs and 65Zn(NO3)2 in mice |
Parameterization and validation
To acquire the physicochemical parameters of 10 nm and 71 nm 65ZnO NPs and 65Zn(NO3)2, the time-dependent tissue partition coefficients (pi) and excretion and elimination rates (ki) were considered. The tissue partition coefficient can be estimated by the area under the curve of 65Zn2+ or 65ZnO NPs in tissues or blood. Monte Carlo simulation was performed using the calculated mean and standard deviation of the area under the curve of tissues and blood to obtain the distribution of tissue partition coefficients for blood and tissue samples with various plausible combinations. The distributions were assumed to be lognormal to avoid negative values caused by high deviations. The individual variability of mice was also incorporated into the tissue partition coefficient estimates. The time-dependent partition coefficients for carcass and brain were sigmoidal, whereas a peak curve was observed for other tissues. Crystal Ball® software (Version 2000.2; Decisioneering Inc, Denver, CO, USA) was used for Monte Carlo simulation to obtain the 2.5 and 97.5 percentiles as 95% confidence intervals.
A four-parameter Hill function can be used to describe the time-dependent partition coefficient of heart, brain, and carcass in 65Zn(NO3)2 and that of brain and carcass in 10 nm and 70 nm 65ZnO NPs in a sigmoid manner,
|
|

where pi(t) is the time-dependent partition coefficient (−), pi,ini is the initial partition coefficient (−), pi,max is the maximum partition coefficient (−), Tpi,50 is the time constant at 50% maximum partition coefficient (hours), t is the time (hours), and npi is the Hill coefficient (−).
Typically, excretion or elimination rate constant estimates can be determined by a depuration process in a contaminated organism without 65ZnO NP or 65Zn(NO3)2 injection. Therefore, the kinetics of the depuration process,
| (3) |

where Ci (t) is the time-dependent 65ZnO NP or 65Zn(NO3)2 concentration in tissue i (μg·g−1), Ci (t=T) is the concentration at time T (hours) when depuration begins, and ki is the excretion or elimination rate constant (h−1), can be used to estimate excretion or elimination rate constants. The results at the end of the experimental period showed that the accumulated Zn was substantially less than the initial administered dose. Thus, time-dependent maximum and half-maximum excretion or elimination rates can also markedly affect 65ZnO NP or 65Zn(NO3)2 accumulation.
Time-dependent excretion and elimination were considered to occur in 65ZnO NP or 65Zn(NO3)2 kinetic processes,
|
|

where ki,min is the minimum excretion or elimination rate constant (h−1), ki,max is the maximum excretion or elimination rate constant (h−1), Tki,50 is the time constant at 50% maximum excretion or elimination rate (hours), and nki is the Hill coefficient (−). TableCurve 2D (Version 5; AISN Software Inc, Mapleton, OR, USA) was used to fit the experimental data to obtain the optimally fitted statistical model. The generated coefficients of determination (r2) can be used to examine the goodness of fit of selected nonlinear statistical models.
To investigate differences in size- and tissue-specific accumulation trends, mean residence times of 65ZnO NPs and 65Zn(NO3)2 in tissues were calculated. Mathematically, mean residence time can be defined as:
|
|

where  is the mean residence time (hours) and Ci(t) is the tissue concentration profile (μg·g−1).14
The Berkeley Madonna: Modeling and Analysis of Dynamic Systems (Version 8.3.9; University of California, Berkley, CA, USA) was used to perform all PBPK simulations for 65ZnO NPs and 65Zn(NO3)2 in mice. To assess the performance of model predictability, the mean absolute percentage error (MAPE) was calculated as:15,16
|
|

where N denotes the number of observations, Co,n is the observed biodistribution data from blood and each tissue of 65ZnO NPs and 65Zn(NO3)2, and Cm,n is the modeled result corresponding to blood- and tissue-specific data point n. Further calibration might be required to obtain the optimal fit of pharmacokinetics to experimental data. To perform further calibration of the experimental data, the estimated tissue-specific excretion or elimination rates and partition coefficients would be adjusted based on our study hypothesis and the characteristics of 65ZnO NPs and 65Zn(NO3)2 to reduce the MAPE values.
Sensitivity analysis
A sensitivity analysis was performed to identify the influence of critical variables in the algorithm on tissue accumulation. To test sensitivity, the partition coefficients and excretion and elimination rates were increased by 10% to iterate the model simulation and to identify significant changes in the modeled accumulation distribution. The sensitivity ratios were calculated as:
|
|

where ΔC is the difference between the resulting and original (Yo) predicted concentration values, and Δx is the difference between the resulting and initial (xo) parameter values.
Results
Particle size-dependent physicochemical parameters
Our results indicated that the calculated tissue partition coefficients of 10 nm 65ZnO NPs were greater than those of 71 nm 65ZnO NPs and 65Zn(NO3)2, except for the partition coefficients of 71 nm 65ZnO NPs in the liver and kidney at 672 hours, GI tract at 24–672 hours, and carcass at 1 hour and 24–672 hours. Tables S1–S3 list the detailed time-dependent partition coefficients of 10 nm and 71 nm 65ZnO NPs and 65Zn(NO3)2. The increases in the partition coefficients of brain and carcass were time-dependent. The four-parameter Hill function in Equation 2 was optimally fitted to the partition coefficient of brain and carcass over time (r2=0.97–0.99), and Hill coefficients were significant (>1) for both. Table 3 shows the estimates of the Hill parameters for brain and carcass partition coefficients.
 | Table 3 Physicochemical parameters used in PBPK model for 65ZnO NPs and 65Zn(NO3)2 in mice |
Table S4 lists the estimated excretion or elimination rate constants of 65ZnO NPs and 65Zn(NO3)2. The estimated time-dependent excretion or elimination rates for 10 nm and 71 nm 65ZnO NPs and 65Zn(NO3)2 marginally decreased during the 28-day experimental period. Furthermore, a significant decreasing trend of excretion or elimination rate following the order 65Zn(NO3)2, 71 nm 65ZnO NPs, and 10 nm 65ZnO NPs were observed in kidneys and GI tract and not in the liver (Table S4).
Simulation and model validation
Figures 3 and 4 show comparisons between the results from PBPK model simulation (solid line, without calibration; dashed line, with calibration, after 7 days of exposure) and the experimental data on tissue and blood concentrations of 10 nm and 71 nm 65ZnO NPs and 65Zn(NO3)2. To perform PBPK simulation, we considered the time-dependent excretion or elimination rates and partition coefficients of 10 nm and 71 nm 65ZnO NPs and 65Zn(NO3)2. Specifically, the concentration of 10 nm 65ZnO NPs in the lung showed a higher accumulative capacity than those of 71 nm 65ZnO NPs and 65Zn(NO3)2 for the first 7 hours (Figure 3). Moreover, the concentration of 71 nm 65ZnO NPs decreased substantially to almost zero from days 3 to 7 in the spleen. Therefore, we used optimized partition coefficients (listed in Table 3) to simulate and describe 65ZnO NPs concentration profiles over time in the lung and spleen (Figure 3A–F).
 | Figure 3 Comparisons between PBPK model simulations and pharmacokinetics in mice lung (A–C), spleen (D–F), GI tract (G–I), kidney (J–L), heart (M–O), liver (P–R), brain (S–U), and carcass (V–X) after intravenous injection of 10 nm (circle) and 71 nm (triangle) 65ZnO NPs and 65Zn(NO3)2 (square). |
 | Figure 4 Comparisons between PBPK model simulations and pharmacokinetics of mice in blood after intravenous injection of (A) 10 nm and (B) 71 nm 65ZnO NPs, and (C) 65Zn(NO3)2. |
The majority of the experimental concentration profiles of 65ZnO NPs and 65Zn(NO3)2 in the target tissues of mice rapidly increased within a few hours of intravenous injection and decreased thereafter (Figures 3A–R and 4), whereas concentrations profiles in the brain and carcass increased and then slightly decreased during the 7-day period (Figure 3S–X). The time-dependent increasing functions of the partition coefficients might thus be suitable to describe the biodistributions of 65ZnO NPs and 65Zn(NO3)2 in mice brain and carcass (Table 3).
During the late phase (days 7–28), we observed that tissue concentration markedly decreased and that our simulation of 65ZnO NPs barely fit the experimental data. Yet, the simulation of 65Zn(NO)3 was well fitted with the experimental data. Therefore, it is likely that 65ZnO NPs gradually decompose into zinc ion after 7 days. Indeed, similar results were also observed in a previous study.17 We proposed that the 65ZnO NPs might decompose after day 7, resulting in a markedly decreasing trend on day 28. For that, we replaced the partition coefficients and excretion or elimination rates of 10 nm and 71 nm 65ZnO NPs after day 7 with those estimated from 65Zn(NO3)2 experimental data. All partition coefficients used for calibration are listed in Table 4.
 | Table 4 Physicochemical parameters used in PBPK model for 65ZnO NPs in mice after day 7 |
Overall, our results indicated that the PBPK simulations with calibration reasonably agreed with the experimentally determined values of the time-dependent 65ZnO NP and 65Zn(NO3)2 concentrations (MAPE <50%) (Figure 5). Notably, 10 nm 65ZnO NPs of the heart and brain and 71 nm 65ZnO NPs of the liver and carcass provided good predictions (10%≤ MAPE <20%). The PBPK simulation outcome for 65Zn(NO3)2 concentration in the kidney provided an excellent prediction (MAPE <10%).
 | Figure 5 MAPE estimates showing the performances of model predictability of 10 nm and 71 nm 65ZnO NPs and 65Zn(NO3)2, with and without calibration. |
Mean residence time estimation and sensitivity analysis
We used the experimental accumulation data obtained using Equation 5 to estimate the mean residence times of 65ZnO NPs and 65Zn(NO3)2 in each tissue. As shown in Figure 6A, the mean residence times of the majority of tissues ranged from 7 days to 14 days. Generally, the mean residence time of 10 nm 65ZnO NPs was longer than those of 65Zn(NO3)2 and 71 nm 65ZnO NPs (Figure 6B). These results indicated that 10 nm 65ZnO NPs in the blood, brain, heart, and carcass and 71 nm 65ZnO NPs and 65Zn(NO3)2 in the brain and carcass had mean residence times close to the highest outliers of 14 days, whereas 71 nm 65ZnO NPs in the spleen had the lowest mean residence time of 4.55 days (95% confidence interval: 1.14–2.07).
 | Figure 6 Tissue-specific mean residence times and probability density of 10 nm and 71 nm 65ZnO NPs and 65Zn(NO3)2 accumulations. |
Figure 7 shows the critical variables in our sensitivity analyses for tissue concentrations during the 7-day period. The sensitivity analyses indicated that 65Zn(NO3)2 tissue concentrations were most sensitive to the increased excretion or elimination rate of the liver (kLi, sensitive coefficient: 0.46) and that the partition coefficient of the lung (pLu) presented the most sensitive coefficient of 0.54 in 10 nm 65ZnO NPs. However, parameters that increased in correspondence with a decrease in tissue concentration included the excretion or elimination rates of the GI tract and kidney for all chemicals, the partition coefficients of the GI tract (−0.06) and carcass (−0.32) for 10 nm 65ZnO NPs, and the partition coefficients of the carcass (−0.14) for 71 nm 65ZnO NPs.
 | Figure 7 Sensitivity analysis of partition coefficients and excretion or elimination rates in the mice PBPK model. |
Discussion
ZnO NP has been proposed to gradually decompose into zinc ion in the biological system. However, our data showed that the tissue kinetics of 65ZnO NP were still different from those of zinc ion in mice. By comparing the PBPK parameters of 65ZnO NP and 65Zn2+, we are able to propose that majority of 65ZnO NP in tissues might decompose after day 7. And incorporating the parameters of zinc ion into 65ZnO NP model after day 7 would improve the simulation. Our study shows that it is possible to construct a PBPK model for slowly decomposed NPs, by comparing the kinetics of NPs and soluble elements.
Critical parameters and associated effects of PBPK model
Our 65ZnO NP PBPK model for 65ZnO NPs fitted well with the accumulation of various size 65ZnO NPs in mice tissues. In a PBPK model, the partition coefficient is the key parameter affecting accumulation levels in tissues.18 Although it is often assumed that partitioning between tissues and blood reaches equilibrium after 24 hours, increasing evidence suggests that equilibrium for NPs in specific tissues is reached after several days to several months and that the concentrations in these organs can increase several fold with increasing duration of exposure.19–23 Thus, the constant partition coefficients estimated from the steady-state condition might not be able to assess the biodistributions of 65ZnO NPs and 65Zn(NO3)2 in target tissues.
We observed that the partition coefficient in the lung (pLu) was particularly high for 10 nm 65ZnO NPs and that pLu was the most sensitive parameter of the biodistribution of 10 nm 65ZnO NPs. This result might have been caused by the lung being the first organ with a reticuloendothelial system in contact with 65ZnO NPs following intravenous injection. NPs are readily uptaken by phagocytic cells in the reticuloendothelial system. It is thus likely that alveolar macrophages in the lung would capture 10 nm 65ZnO NPs before translocating to the lymphatic tissue, and then trapped 65ZnO NPs would be redistributed to other tissues over a longer duration. Our results support those hypotheses.24,25 However, at later time points,65ZnO NPs failed to accumulate in the lung and its partition coefficients decreased, suggesting that this mechanism in the lung might not be crucial in long-term biodistribution.
Potential mechanisms for the biodistribution of NPs
The potential mechanisms for the biodistribution of NPs are complicated. Several factors such as interactions with biological barriers and NP properties (composition, size, core properties, and surface modifications) have been shown to significantly influence the biodistribution and blood circulation half-life of circulating NPs. A study indicated that partition coefficients of tissues or blood might be influenced by factors including blood flow and the turnover rate of each tissue, tissue affinity, and lipid composition.26 An increased time-dependent partition coefficient in the liver in mice exposed to polychlorinated biphenyls was identified.27 ZnO NPs might be persistent in the approximately neutral surfactant fluid or cytosol, yet it is rapidly converted to Zn2+ when ZnO NPs internalized into the acid environment of the lysosome.17 From our previous studies and in vitro experiments, we proposed that ZnO NPs would decompose, release Zn2+, and upregulate MT protein after endocytosis (Figure 8). Sadhu and Gedamu reported that the upregulation of MT decreased dynamically with time after exposure to Zn.28 MT binds to intracellular Zn2+ and increases their accumulation in cells (Figure 8). When MT protein decreases at later time points, Zn2+ ions are pumped out of the cells by the Zn transporter, reenter the circulation, and are subsequently stored in muscle and bone (referred to as carcass in this study).29,30 Therefore, the tissue partition coefficients of ZnO NPs might change time-dependently. Indeed, our results showed that the partition coefficients of ZnO NPs are dependent on time after exposure and might be affected by the decomposition of ZnO NPs (Figure 8). Also, the results have a good prediction when we replaced the partition coefficients and excretion or elimination rates of 10 nm and 71 nm ZnO NPs with that of Zn2+ after day 7 exposure.
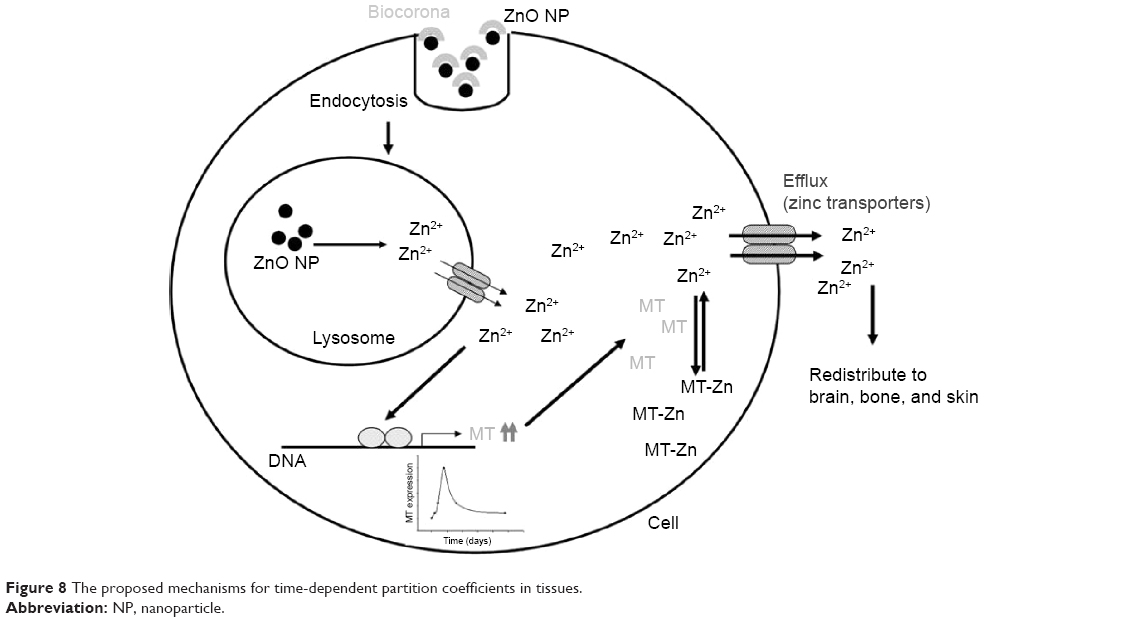 | Figure 8 The proposed mechanisms for time-dependent partition coefficients in tissues. |
Furthermore, NPs are reportedly readily uptaken by phagocytic cells in the liver, spleen, lung, and kidneys.31 Therefore, ZnO NPs quickly distribute to these organs within 24 hours of exposure. Proteins associated with the surfaces of NPs are recognized by macrophages and might modulate the translocation and redistribution of NPs from blood by organs with an reticuloendothelial system.32 In addition, the uptake and internalization of NPs in the brain might be facilitated by the formation of a biocorona, with plasma proteins on the surface of NPs, which allows for the crossing of the brain–blood barrier.33–35 Our data indicated that the relationship between time and partition coefficients in the brain and carcass differed from those in other tissues. Considering the unique biodistribution characteristics of ZnO NPs and Zn2+, we used the Hill equation to describe partitioning between blood and tissues in a time-dependent manner. The time-dependent partition coefficients fitted well with the measurement data and enabled the construction of our PBPK model for ZnO NPs.
Implications
We observed that the partition coefficients of the brain (pBr) and carcass (pCa) increased time-dependently. This indicates that irrespective of phase and size, ZnO NPs and Zn(NO3)2 preferentially redistribute to the brain and carcass at later time points after exposure. With high partition coefficient, the 10 nm ZnO NPs tend to redistribute and accumulate in the brain tissue. Although pBr and pCa were relatively low following a single dose of the Zn compounds, multiple dosing for a long duration could potentially increase the accumulation of chemicals in the brain and carcass. Zn2+ ions are abundant in the brain and play crucial roles in learning and memory.36 However, Zn overdose can cause spatial reference memory deficit in animals.37 It has been identified that ZnO NPs have the potential ability to damage and kill neural stem cells in mice.38 Therefore, in future research, the cumulative and hazardous properties of ZnO NPs in the brain should be considered in long-term health assessments of brain damage and memory deficit.
The biodistribution of NPs is highly influenced by the cellular uptake of NPs through phagocytosis by the mononuclear phagocytic system. NPs can accumulate in phagocytic cells of specific organs including the liver, spleen, lung, kidney, and brain or redistribute to the lymphatic fluid. According to previous study, phagocytizing cells rapidly capture NPs until their saturation, constitute a major reservoir in richly perfused organs, including the spleen, liver, bone marrow, lungs, heart, and kidneys, and store 83% NPs in these organs 120 hours after injection.39 To more comprehensively understand the role of the mononuclear phagocytic system in the biodistribution of NPs, we will include mononuclear phagocytic system subcompartments in these organs when we construct PBPK models for NPs in future studies.
A report investigated and compared ZnO NP and zinc chloride contents in the blood and observed that although ZnO NPs partly dissolve in gastric conditions (13%–14%), particles administered in various states produce different biodistribution profiles.40 Although studies have demonstrated that ZnO NPs can dissolve in tissues and release Zn2+ within hours, the metabolic mechanisms leading to the various biodistribution profiles of NPs and ions remain unclear and warrant further investigation.1,40 Given that the exposure doses and excretion or elimination rates of each tissue are known, a PBPK model suitable for transfer within various exposure routes (intravenous, inhalation, and oral) could be constructed.41,42
Conclusion
Despite certain data limitations, this study estimated and identified critical parameters influencing PBPK modeling in certain organs and tissues by using real-time mice exposure experiments. By considering the time-dependent partition coefficients and decomposition of 65ZnO NPs into 65Zn2+ after day 7, we increased the predictability of the PBPK model for exposure experimental data. The general patterns of bioaccumulation and biodistribution of 65ZnO NPs and 65Zn(NO3)2 in mice were serviceably accurate.
In general, the tissue partition coefficients of 65ZnO NPs were greater than those of 65Zn(NO3)2, particularly the partition coefficient of 10 nm 65ZnO NPs in the lung. Sensitivity analysis revealed that 71 nm 65ZnO NPs and 65Zn(NO3)2 were sensitive to excretion or elimination rates in the liver and GI tract. We suggest caution against exposure to ZnO NPs <10 nm because they tend to accumulate in the body for a relatively longer duration than 71 nm 65ZnO NPs and 65Zn(NO3)2 do. Although the partition coefficient of the brain was relatively low, it time-dependently increased for 65ZnO NPs and 65Zn(NO3)2. Hazardous exposure risk for the brain must thus be carefully considered. In this study, we established a potentially predictive dynamic model for NPs, which we will investigate more comprehensively in future studies.
Acknowledgments
This study was supported by a grant from the Ministry of Science and Technology of Taiwan (MOST 102-2932-I-400-001-MY3). This work is a subproject of the collaborative project of the Seventh Framework Programme (FP7), funded by the European Union under project number 310715 (MOD-ENP-TOX). The authors are grateful for the technical consultation provided by Miss Jui-Ping Li and Nai-Chun Huang of the Institute of Biomedical Engineering and Nanomedicine (BN-104-PP-27) and physicochemical characterization support provided by the Institute of Biomedical Engineering and Nanomedicine Service, NHRI, Zhunan, Taiwan.
Author contributions
All authors contributed toward data analysis, drafting and critically revising the paper, and agree to be accountable for all aspects of the work.
Disclosure
The authors report no conflicts of interest in this work.
References
Vandebriel RJ, De Jong WH. A review of mammalian toxicity of ZnO nanoparticles. Nanotechnol Sci Appl. 2012;5:61–71. | ||
Adamcakova-Dodd A, Stebounova LV, Kim JS, et al. Toxicity assessment of zinc oxide nanoparticles using sub-acute and sub-chronic murine inhalation models. Part Fibre Toxicol. 2014;11:1–15. | ||
Chuang HC, Juan HT, Chang CN, et al. Cardiopulmonary toxicity of pulmonary exposure to occupationally relevant zinc oxide nanoparticles. Nanotoxicology. 2014;8:593–604. | ||
Akhtar MJ, Ahamed M, Kumar S, Khan MM, Ahmad J, Alrokayan SA. Zinc oxide nanoparticles selectively induce apoptosis in human cancer cells through reactive oxygen species. Int J Nanomedicine. 2012;7:845–857. | ||
Cao Z, Zhang Z, Wang F, Wang G. Synthesis and UV shielding properties of zinc oxide ultrafine particles modified with silica and trimethyl siloxane. Colloids Surf A Physicochem Eng Asp. 2009;340:161–167. | ||
Rasmussen JW, Martinez E, Louka P, Wingett DG. Zinc oxide nanoparticles for selective destruction of tumor cells and potential for drug delivery applications. Expert Opin Drug Deliv. 2010;7:1062–1077. | ||
Yeh TK, Chen JK, Lin CH, et al. Kinetics and tissue distribution of neutron-activated zinc oxide nanoparticles and zinc nitrate in mice: effects of size and particulate nature. Nanotechnology. 2012;23:085102. | ||
Krishnan K, Peyret T. Physiologically based toxicokinetic (PBTK) modeling in ecotoxicology. In: Devillers J, editor. Ecotoxicology Modeling. New York: Springer; 2009:145–175. | ||
Peters SA. Physiologically-Based Pharmacokinetic (PBPK) Modeling and Simulations. New Jersey: John Wiley & Sons, Inc; 2012. | ||
Zhou JG, Zhao FY, Wang YL, Zhang Y, Yang L. Size-controlled synthesis of ZnO nanoparticles and their photoluminescence properties. J Lumin. 2007;122:195–197. | ||
Talam S, Karumuri SR, Gunnam N. Synthesis, characterization, and spectroscopic properties of ZnO nanoparticles. ISRN Nanotechnol. 2012;2012:372505. | ||
Uysala I, Severcana F, Evisa Z. Characterization by Fourier transform infrared spectroscopy of hydroxyapatite co-droped with zinc and flouoride. Ceram Int. 2013;39:7727–7733. | ||
Davies B, Morris T. Physiological parameters in laboratory animals and humans. Pharm Res. 1993;10:1093–1095. | ||
Cheng HY, Jusko WJ. Mean residence time concepts for pharmacokinetic systems with nonlinear drug elimination described by the Michaelis-Menten equation. Pharm Res. 1988;5:156–164. | ||
Rayer S. Population forecast accuracy: does the choice of summary measure of error matter. Popul Res Policy Rev. 2007;26:163–184. | ||
Wilson T. The forecast accuracy of Australian bureau of statistics national population projections. J Popul Res. 2007;24:91–117. | ||
Cho WS, Duffin R, Howie SE, et al. Progressive severe lung injury by zinc oxide nanoparticles; the role of Zn2+ dissolution inside lysosomes. Part Fibre Toxicol. 2011;8:1–27. | ||
Brown RP, Delp MD, Lindstedt SL, Rhomberg LR, Beliles RP. Physiological parameter values for physiologically based pharmacokinetic models. Toxicol Ind Health. 1997;13:407–484. | ||
Wang J, Liu Y, Jiao F, et al. Time-dependent translocation and potential impairment on central nervous system by intranasally instilled TiO2 nanoparticles. Toxicology. 2008;254:82–90. | ||
Cho M, Cho WS, Choi M, et al. The impact of size on tissue distribution and elimination by single intravenous injection of silica nanoparticles. Toxicol Lett. 2009;189:177–183. | ||
Lankveld DP, Oomen AG, Krystek P, et al. The kinetics of the tissue distribution of silver nanoparticles of different sizes. Biomaterials. 2010;31:8350–8361. | ||
Wenger Y, Schneider RJ 2nd, Reddy GR, Kopelman R, Jolliet O, Philbert MA. Tissue distribution and pharmacokinetics of stable polyacrylamide nanoparticles following intravenous injection in the rat. Toxicol Appl Pharmacol. 2011;251:181–190. | ||
Dziendzikowska K, Gromadzka-Ostrowska J, Lankoff A, et al. Time-dependent biodistribution and excretion of silver nanoparticles in male Wistar rats. J Appl Toxicol. 2012;32:920–928. | ||
Park K, Park EJ, Chun IK, et al. Bioavailability and toxicokinetics of citrate-coated silver nanoparticles in rats. Arch Pharm Res. 2011;34:153–158. | ||
Takenaka S, Karg E, Roth C, et al. Pulmonary and systemaic distribution of inhaled ultrafine silver particles in rats. Environ Health Perspect. 2001;109(suppl 4):547–551. | ||
Weijs L, Yang RS, Covaci A, Das K, Blust R. Physiologically based pharmacokinetic (PBPK) models for lifetime exposure to PCB 153 in male and female harbor porpoises (Phocoena phocoena): model development and evaluation. Environ Sci Technol. 2010;44:7023–7030. | ||
Lee SK, Ou YC, Yang RSH. Comparison of pharmacokinetic interactions and physiologically based pharmacokinetic modeling of PCB 153 and PCB 126 in non-pregnant mice, lactating mice, and suckling pups. Toxicol Sci. 2002;65:26–34. | ||
Sadhu C, Gedamu L. Metal-specific posttranscriptional control of human metallothionein genes. Mol Cell Biol. 1989;9:5738–5741. | ||
Lichten LA, Cousins RJ. Mammalian zinc transporters: nutritional and physiologic regulation. Annu Rev Nutr. 2009;29:153–176. | ||
King JC, Shames DM, Woodhouse LR. Zinc homeostasis in humans. J Nutr. 2000;130:1360S–1366S. | ||
Moghimi SM, Hunter AC, Murray JC. Long-circulating and target-specific nanoparticles: theory to practice. Pharmacol Rev. 2001;53:283–318. | ||
Li SD, Huang L. Nanoparticles evading the reticuloendothelial system: role of the supported bilayer. Biochim Biophys Acta. 2009;1788:2259–2266. | ||
Lundqvist M, Stigler J, Elia G, Lynch I, Cedervall T, Dawson KA. Nanoparticle size and surface properties determine the protein corona with possible implications for biological impacts. Proc Natl Acad Sci U S A. 2008;105:14265–14270. | ||
Nel AE, Mädler L, Velegol D, et al. Understanding biophysicochemical interactions at the nano-bio interface. Nat Mater. 2009;8:543–557. | ||
Wiley DT, Webster P, Gale A, Davis ME. Transcytosis and brain uptake of transferrin-containing nanoparticles by tuning avidity to transferrin receptor. Proc Natl Acad Sci U S A. 2013;110:8662–8667. | ||
Frederickson CJ, Koh JY, Bush AI. The neurobiology of zinc in health and disease. Nat Rev Neurosci. 2005;6:449–462. | ||
Flinn JM, Hunter D, Linkous DH, et al. Enhanced zinc consumption causes memory deficits and increased brain levels of zinc. Physiol Behav. 2005;83:793–803. | ||
Deng X, Luan Q, Chen W, et al. Nanosized zinc oxide particles induce neural stem cell apoptosis. Nanotechnology. 2009;20:115101. | ||
Li D, Johanson G, Emond C, Carlander U, Philbert M, Jolliet O. Physiologically based pharmacokinetic modeling of polyethylene glycol-coated polyacrylamide nanoparticles in rats. Nanotoxicology. 2014;8(S1):128–137. | ||
Paek HJ, Lee YJ, Chung HE, et al. Modulation of the pharmacokinetics of zinc oxide nanoparticles and their fates in vivo. Nanoscale. 2013;5:11416–11427. | ||
Bachler G, von Goetz N, Hungerbühler K. A physiologically based pharmacokinetic model for ionic silver and silver nanoparticles. Int J Nanomedicine. 2013;8:3365–3382. | ||
Li M, Reineke J. Mathematical modelling of nanoparticle biodistribution: extrapolation among intravenous, oral and pulmonary administration routes. Int J Nano Biomater. 2011;3:222–238. |
Supplementary materials
 | Figure S1 Raman spectra of ZnO NPs. |
 | Figure S2 XRD patterns of ZnO NPs. |
 | Table S1 Partition coefficients of 10 nm 65ZnO NPs in each organ |
 | Table S2 Partition coefficients of 71 nm 65ZnO NPs in each organ |
 | Table S3 Partition coefficients of 65Zn(NO3)2 in each organ |
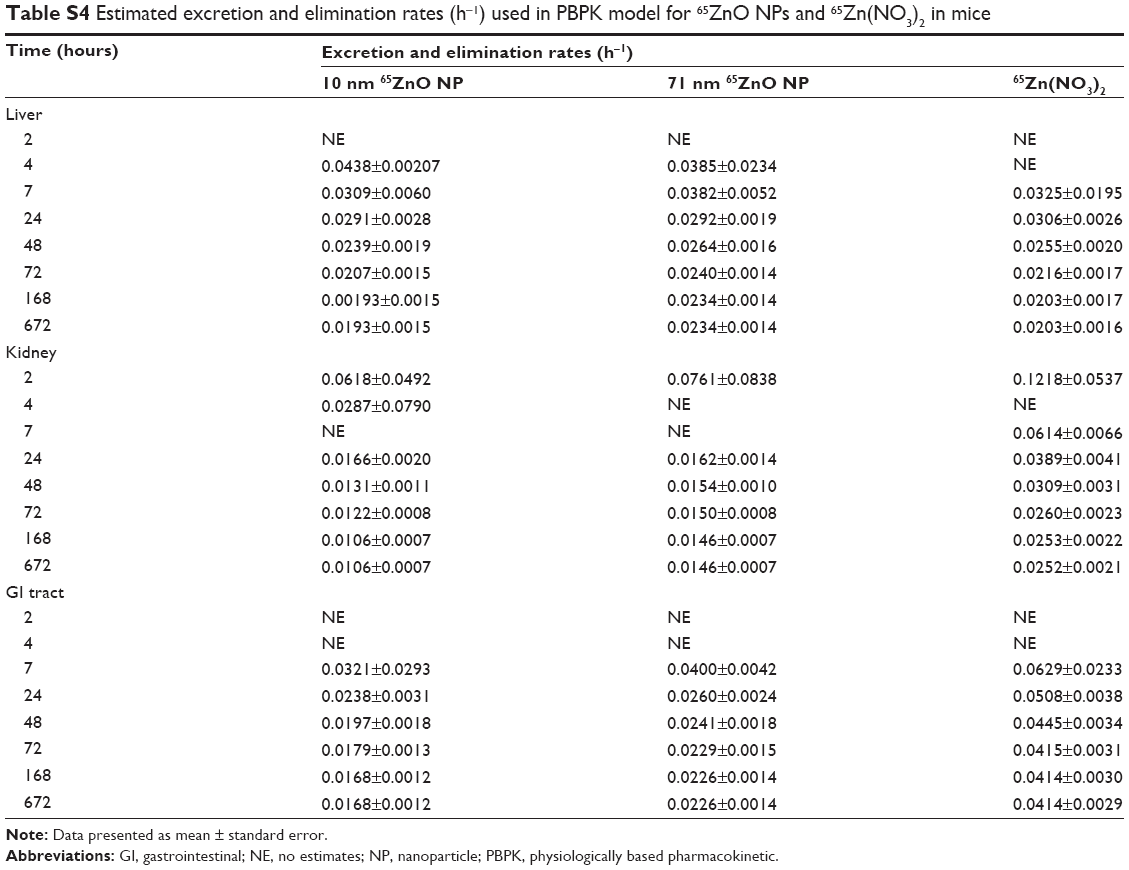 | Table S4 Estimated excretion and elimination rates (h−1) used in PBPK model for 65ZnO NPs and 65Zn(NO3)2 in mice |
 © 2015 The Author(s). This work is published and licensed by Dove Medical Press Limited. The
full terms of this license are available at https://www.dovepress.com/terms
and incorporate the Creative Commons Attribution
- Non Commercial (unported, 3.0) License.
By accessing the work you hereby accept the Terms. Non-commercial uses of the work are permitted
without any further permission from Dove Medical Press Limited, provided the work is properly
attributed. For permission for commercial use of this work, please see paragraphs 4.2 and 5 of our Terms.
© 2015 The Author(s). This work is published and licensed by Dove Medical Press Limited. The
full terms of this license are available at https://www.dovepress.com/terms
and incorporate the Creative Commons Attribution
- Non Commercial (unported, 3.0) License.
By accessing the work you hereby accept the Terms. Non-commercial uses of the work are permitted
without any further permission from Dove Medical Press Limited, provided the work is properly
attributed. For permission for commercial use of this work, please see paragraphs 4.2 and 5 of our Terms.